 filings.tools
NXP Semiconductors 10-K 2021-12-31
Filed 2022-02-24. 23 sections, 446K characters. Original on sec.gov · Markdown · JSON
Cover and table of contents
UNITED STATES
SECURITIES AND EXCHANGE COMMISSION
Washington, D.C. 20549
FORM 10-K
(Mark One)
☒ ANNUAL REPORT PURSUANT TO SECTION 13 OR 15(d) OF THE SECURITIES EXCHANGE ACT OF 1934
For the fiscal year ended December 31, 2021
or
☐ TRANSITION REPORT PURSUANT TO SECTION 13 OR 15(d) OF THE SECURITIES EXCHANGE ACT OF 1934
For the transition period from to .
Commission File Number: 001-34841
NXP Semiconductors N.V.
(Exact name of registrant as specified in its charter)
| Netherlands | 98-1144352 | |||||||
| (State or other jurisdiction of incorporation or organization) | (I.R.S. employer identification number) | |||||||
| 60 High Tech Campus | ||||||||
| Eindhoven | ||||||||
| Netherlands | 5656 AG | |||||||
| (Address of principal executive offices) | (Zip Code) |
| +31 | 40 | 2729999 | |||||||||
| (Registrant’s telephone number, including area code) |
Securities registered pursuant to Section 12(b) of the Act:
| Title of each class | Trading symbol(s) | Name of each exchange on which registered | ||||||
| Common shares, EUR 0.20 par value | NXPI | The Nasdaq Global Select Market |
Securities registered pursuant to Section 12(g) of the Act: None
Indicate by check mark if the Registrant is a well-known seasoned issuer, as defined in Rule 405 of the Securities Act.
Yes ☒ No ☐
Indicate by check mark if the Registrant is not required to file reports pursuant to Section 13 or Section 15(d) of the Act.
Yes ☐ No ☒
Indicate by check mark whether the Registrant (1) has filed all reports required to be filed by Section 13 or 15(d) of the Securities Exchange Act of 1934 during the preceding 12 months (or for such shorter period that the Registrant was required to file such reports), and (2) has been subject to such filing requirements for the past 90 days.
Yes ☒ No ☐
Indicate by check mark whether the Registrant has submitted electronically every interactive data file required to be submitted pursuant to Rule 405 of Regulation S-T (§ 232.405 of this chapter) during the preceding 12 months (or for such shorter period that the Registrant was required to submit such files).
Yes ☒ No ☐
Indicate by check mark whether the Registrant is a large accelerated filer, an accelerated filer, a non-accelerated filer, a smaller reporting company, or an emerging growth company. See the definitions of "large accelerated filer," "accelerated filer," "smaller reporting company," and "emerging growth company" in Rule 12b-2 of the Exchange Act.
| Large accelerated filer | ☒ | Accelerated filer | ☐ | ||||||||
| Non-accelerated filer | ☐ | Smaller reporting company | ☐ | ||||||||
| Emerging growth company | ☐ |
If an emerging growth company, indicate by check mark if the Registrant has elected not to use the extended transition period for complying with any new or revised financial accounting standards provided pursuant to Section 13(a) of the Exchange Act. ☐
Indicate by check mark whether the Registrant has filed a report on and attestation to its management's assessment of the effectiveness of its internal control over financial reporting under Section 404(b) of the Sarbanes-Oxley Act (15 U.S.C. 7262(b)) by the registered public accounting firm that prepared or issued its audit report. ☒
Indicate by check mark whether the Registrant is a shell company (as defined in Rule 12b-2 of the Exchange Act).
Yes ☐ No ☒
The aggregate market value of the voting stock held by non-affiliates of the Registrant, based upon the closing sale price of our ordinary shares on July 2, 2021 as reported on the Nasdaq Global Select Market, was $54.7 billion. As of February 18, 2022, the Registrant had 262,538,156 outstanding ordinary shares, excluding shares held in treasury.
DOCUMENTS INCORPORATED BY REFERENCE
Portions of the Registrant’s definitive proxy statement relating to its 2022 Annual General Meeting of shareholders (the “2022 Proxy Statement”) are incorporated by reference into Part III of this Annual Report on Form 10-K where indicated. The 2022 Proxy Statement will be filed with the U.S. Securities and Exchange Commission within 120 days after the end of the fiscal year to which this report relates.
Table of Contents
Introduction and Forward Looking Statements
This Annual Report on Form 10-K for the fiscal year ended December 31, 2021 (the “Annual Report”) and certain information incorporated herein by reference contains forward-looking statements, which are provided under the “safe harbor” protection of the Private Securities Litigation Reform Act of 1995. When used in this Annual Report, the words “anticipate”, “believe”, “estimate”, “forecast”, “expect”, “intend”, “plan” and “project” and similar expressions, as they relate to us, our management or third parties, identify forward-looking statements. Forward-looking statements include statements regarding our business strategy, financial condition, results of operations, expected timeline to remediate the identified material weakness in our internal control over financial reporting, market data as well as any other statements that are not historical facts. These statements reflect beliefs of our management, as well as assumptions made by our management and information currently available to us. Although we believe that these beliefs and assumptions are reasonable, these statements are subject to numerous factors, risks and uncertainties that could cause actual outcomes and results to be materially different from those projected. These factors, risks and uncertainties expressly qualify all subsequent oral and written forward-looking statements attributable to us or persons acting on our behalf and include, in addition to those listed under Part I, Item 1A. Risk Factors and elsewhere in this Annual Report, the following:
-
market demand and semiconductor industry conditions;
-
our ability to successfully introduce new technologies and products;
-
the demand for the goods into which our products are incorporated;
-
potential impacts of the COVID-19 pandemic;
-
trade disputes between the U.S. and China, and the potential increase of barriers to international trade and resulting disruptions to our established supply chains;
-
our ability to generate sufficient cash, raise sufficient capital or refinance our debt at or before maturity to meet our debt service, research and development and capital investment requirements;
-
our ability to accurately estimate demand and match our production capacity accordingly or obtain supplies from third-party producers;
-
our access to production from third-party outsourcing partners, and any events that might affect their business or our relationship with them;
-
our ability to secure adequate and timely supply of equipment and materials from suppliers;
-
our ability to avoid operational problems and product defects and, if such issues were to arise, to rectify them quickly;
-
our ability to form strategic partnerships and joint ventures and successfully cooperate with our strategic alliance partners;
-
our ability to win competitive bid selection processes;
-
our ability to develop products for use in our customers’ equipment and products;
-
our ability to successfully hire and retain key management and senior product engineers; and
-
our ability to maintain good relationships with our suppliers.
We do not assume any obligation to update any forward-looking statements and disclaim any obligation to update our view of any risks or uncertainties described herein or to publicly announce the result of any revisions to the forward-looking statements made in this Annual Report, except as required by law.
In addition, this Annual Report contains information concerning the semiconductor industry and business segments generally, which is forward-looking in nature and is based on a variety of assumptions regarding the ways in which the semiconductor industry, our market and business segments will develop. We have based these assumptions on information currently available to us, including through the market research and industry reports referred to in this Annual Report. If any one or more of these assumptions turn out to be incorrect, actual market results may differ from those predicted. While we do not know what impact any such differences may have on our business, if there are such differences, they could have a material adverse effect on our future results of operations and financial condition, and the trading price of our common stock.
The financial information included in this Annual Report is based on United States Generally Accepted Accounting Principles (U.S. GAAP), unless otherwise indicated.
In presenting and discussing our financial position, operating results and cash flows, management uses certain non-U.S. GAAP financial measures. These non-U.S. GAAP financial measures should not be viewed in isolation or as alternatives to the equivalent U.S. GAAP measures and should be used in conjunction with the most directly comparable U.S. GAAP measures. A discussion of non-U.S. GAAP measures included in this Annual Report and a reconciliation of such measures to the most directly comparable U.S. GAAP measures are set forth under “Use of Certain Non-U.S. GAAP Financial Measures” contained in this Annual Report under Part II, Item 7. Management’s Discussion and Analysis of Financial Condition and Results of Operations.
Unless otherwise required, all references herein to “we”, “our”, “us”, “NXP” and the “Company” are to NXP Semiconductors N.V. and its consolidated subsidiaries.
This Annual Report includes market data and certain other statistical information and estimates that are based on reports and other publications from industry analysts, market research firms, and other independent sources, as well as management’s own good faith estimates and analyses. NXP believes these third-party reports to be reputable, but has not independently verified the underlying data sources, methodologies or assumptions. The reports and other publications referenced are generally available to the public and were not commissioned by NXP. Information that is based on estimates, forecasts, projections, market research or similar methodologies is inherently subject to uncertainties and actual events or circumstances may differ materially from events and circumstances reflected in this information.
Part I
Item 1. Business
Company Overview
NXP Semiconductors N.V. is a global semiconductor company and a long-standing supplier in the industry, with over 50 years of innovation and operating history. For the year ended December 31, 2021, we generated revenue of $11,063 million, compared to $8,612 million for the year ended December 31, 2020.
We provide leading solutions that leverage our combined portfolio of intellectual property, deep application knowledge, process technology and manufacturing expertise in the domains of cryptography-security, high-speed interface, radio frequency (RF), mixed-signal analog-digital (mixed A/D), power management, digital signal processing and embedded system design. Our product solutions are used in a wide range of end market applications including: automotive, industrial & Internet of Things (IoT), mobile, and communication infrastructure. We engage with leading global original equipment manufacturers (OEMs) and sell products in all major geographic regions.
Our legal name is NXP Semiconductors N.V. and our commercial name is “NXP” or “NXP Semiconductors.” We were incorporated in the Netherlands in 2006 as a Dutch public company with limited liability (naamloze vennootschap).
Our corporate seat is in Eindhoven, the Netherlands. Our principal executive office is at High Tech Campus 60, 5656 AG Eindhoven, the Netherlands, and our telephone number is +31 40 2729999. Our registered agent in the United States is NXP USA, Inc., 6501 William Cannon Dr. West, Austin, Texas 78735, United States of America, phone number +1 512 9338214.
Semiconductor Market Overview
Semiconductors perform a broad variety of functions within electronic products and systems, including processing data, sensing, storing information and converting or controlling electronic signals. Semiconductors vary significantly depending upon the specific function or application of the end product in which the semiconductor is used and the customer who is deploying it. Semiconductors also vary on a number of technical characteristics including the degree of integration, level of customization, programmability and the process technology utilized to manufacture the semiconductor. Advances in semiconductor technology have increased the functionality and performance of semiconductors, improving their features and power consumption characteristics while reducing their size and cost. These advances have resulted in growth of semiconductors and electronic content across a diverse array of products. The semiconductor market totaled $555.9 billion in 2021.
Reporting Segment
NXP has one reportable segment representing the entity as a whole, which reflects the way in which our chief operating decision maker executes operating decisions, allocates resources, and manages the growth and profitability of the Company.
End Market Exposure
Our product groups are focused on four primary end markets that we believe are characterized by long-term, attractive growth opportunities and where we believe we enjoy sustained, competitive differentiation through our technology leadership. The four end markets are Automotive, Industrial & IoT, Mobile, and Communication Infrastructure & Other.
| Automotive | Industrial & IoT | Mobile | Comm Infra & Other | |||||||||||
| Key Applications | ADAS Electrification Vehicle Networks Secure Car Access eCockpit Body Comfort & Convenience Powertrain | Smart Home Edge Nodes Factory and Building Automation Home Entertainment Power and Energy Smart Appliances Medical Smart Retail | Smartphones Wearables Mobile Accessories | Wireless Basestations Network & Security Banking Cards Government ID documents Transit Cards RFID Tagging | ||||||||||
| Growth Drivers | Radar systems Domain and zonal processors Electrification systems | Secure connected Edge solutions Smart home and industrial automation Connectivity and crossover processors | UWB mobile access solutions Mobile Wallet/Mobile Transit | RF Power Systems 5G roll out |
**i.**Automotive
Growth in automotive semiconductor sales relies on global vehicle sales and production trends and the increase in semiconductor content per vehicle, which is being driven by the proliferation of electronic features throughout the vehicle. Despite the decline in vehicles sales and production in 2020 due to the outbreak of the COVID-19 and the very low growth in 2021 due to the global supply crisis, the increase in semiconductor content per vehicle continued.
We believe three mega-trends will drive the semiconductor content increase in the future: Autonomous driving, electrification and the service oriented car. Each of the megatrends involve new functions and each new function requires new technologies. The path to full autonomy is driving the increase of driver assistance systems in the car already today. In the same way, strict emissions regulations as well as consumer willingness for energy efficient cars are accelerating the penetration of electrification, which has been even more intensified during the pandemic, with OEMs prioritizing investments in this area. Last but not least, many consumers want their cars to be service oriented, hyper-connected, configurable and upgradeable, in the same way as they are used to with their smartphones.
Semiconductor content per vehicle continues to increase due to government regulation of safety and emissions, standardization of higher-end options across a greater number of vehicle classes as well as consumer demand for greater fuel efficiency, advanced safety, multimedia applications and connectivity. Automotive safety features are evolving from passive safety systems to active safety systems with Advanced Driving Assisted Systems (ADAS) such as radar and vision systems. Semiconductor content is also increasing in engine management and fuel economy applications, like Battery Management Systems (BMS). Comfort and convenience systems and user interface applications, as well as infotainment features such as digital audio broadcasting are also areas with high semiconductor content increases. In addition, the use of networking in automotive applications continues to increase as various subsystems communicate within the automobile and with external devices and networks. Furthermore, we believe networking will play a key role in the electrical/electronic (E/E) architecture transformation towards domain and zonal architectures. Smart car access, automotive Ultra-Wideband (UWB) and Near-Field Communication (NFC) are gaining ground in automotive as well, enabling the connection of vehicles and car keys to portable devices and the infrastructure. Data integrity and security hardware features for safeguarding memory, communication and system data are also increasing in importance.
Due to the high degree of regulatory scrutiny and safety requirements, the automotive semiconductor market is characterized by stringent qualification processes, zero defect quality processes, functionally safe design architecture, high reliability, extensive design-in timeframes and long product life cycles, which results in significant barriers to entry.
**ii.**Industrial & IoT
The world is becoming smarter, more connected and more data driven, and the Industrial & IoT market sits at the center of this global digital transformation. The Industrial & IoT market is highly fragmented with a diverse collection of products and applications such as factory automation, smart home, smart appliances, home entertainment, smart retail, power and energy and medical electronics.
Growth in the Industrial market is driven by the replacement of traditional mechanical equipment by smart and connected electronic equipment using various sensors, processors, connectivity and security chipsets that align well with NXP’s ability to provide a complete range of processing, connectivity and secure solutions. In IoT, growth is driven by the increasing use of high-performance edge and media devices (e.g., home entertainment, connected home assistants, home control and security) and low power IoT nodes (e.g. smart home, hearables, health trackers) where NXP scalable solutions across the entire embedded processing spectrum are ideally suited. Working and learning from home significantly increased in the past two years due to the COVID-19 pandemic, resulting in strong demand for smart home devices, computing peripherals, home entertainment and gaming consoles within our Industrial & IoT business.
The increase in productivity with real-time insights and efficient processes for factory automation, the enhancement in consumer convenience, security and comfort for smart homes, the reduction of resource consumption and better energy efficiency for smart appliances, the increase in performance of rich media content in smart consumer devices and the need for better health prevention and monitoring solutions (wearables, smart patches and smart drug delivery devices) to help ensure the future health of millions of people are some of the key use-cases driving growth in Industrial & IoT.
Finally, with the growing number of connected devices, latency, privacy and bandwidth have become critical limiting factors and Edge computing solves this by bringing the intelligence closer to the source. Security and tamper-detection capabilities are also becoming essential features of these Industrial & IoT solutions.
**iii.**Mobile
Mobile includes applications such as smartphones, feature phones, tablets, wearables and mobile accessories. NXP has a strong focus on mobile wallet, Ultra-Wideband (UWB) and specialty custom analog solutions. The demand for faster speeds, improved battery life, fast charging, mobile wallets, highly secure localization and sensing technology, mobile transit and authentication is driving increased semiconductor content for NXP. The growth in this market is mainly driven by the increasing attach rate of these features across devices, vendors and regions, from flagship smartphones down to feature phones, from developed countries to emerging regions. UWB, thanks to its unique precision, robustness, and reliability, is emerging as a secure, fine-ranging technology capable of enabling a wide range of innovative location-based user experiences. The technology is gaining momentum thanks to wider chipset availability, adoption across various devices by multiple brands, and the formation of a strong UWB ecosystem across the whole supply chain and NXP is well positioned in this market.
**iv.**Communication Infrastructure & Other
The Communication Infrastructure & Other end market is a combination of three different application markets, namely 5G networks, digital network communications and secure edge identification solutions.
The transition to 5G and the cloudification of the network present a significant opportunity for NXP. More base stations are needed and massive MIMO radio technology - which provides better throughput and better spectrum efficiency - is greatly expanding the number of antennas and power amplifiers needed. Small cells are also deployed to improve coverage and capacity of wireless networks. In power amplification, as more bandwidth and higher frequencies are needed, we observe an increasing adoption of GaN technology because of its higher power output and efficiency.
Workplaces are evolving from offices to homes, and consumers and enterprises need to adapt to changing working conditions, leading to increasing demand for better digital communication capabilities and digital content. This creates strong growth in the network communications market. Meanwhile, billions of connected devices exchange more and more data, leading to strong demand for device edge and cloud processing solutions.
Finally, in secure edge identification solutions, NXP has extensive experience providing customers with solutions for applications demanding the highest security and reliability (ePassports, eID credentials, transportation & payment cards and RFID solutions). Further digitalization of governmental services, the trend
towards secure contactless payment and the need to improve tracking, traceability and authentication of products are driving demand across these applications.
Products
We offer customers a broad portfolio of semiconductor products, including microcontrollers, application processors, communication processors, connectivity chipsets, analog and interface devices, RF power amplifiers, security controllers and sensors. A key element of our strategy is to offer highly integrated and secure solutions that are increasingly sought by our customers to simplify their development efforts and shorten their time to market. We believe we have the broadest ARM processor portfolio in the industry, from microcontrollers to crossover processors and from application processors to communication processors.
**i.**Microcontrollers
We have been a provider of MCU solutions for more than 40 years. MCUs integrate all of the major components of a computing system onto a single semiconductor device. Typically, this includes a programmable processor core, memory, interface circuitry and other components. MCUs provide the digital logic, or intelligence, for electronic applications, controlling electronic equipment or analyzing sensor inputs. We are a trusted, long-term supplier of MCUs to many of our customers, especially in the automotive, smartcards, industrial and consumer markets. Our MCU product portfolio ranges from 8-bit products to higher performance 16-bit and 32-bit products with on-board flash memory. Our portfolio is highly scalable, and is coupled with our extensive software and design tools. This enables our customers to design-in and deploy our MCU families, leveraging a consistent software development environment. Due to the scalability of our portfolio we are able to help future-proof our customer’s products as their systems evolve, becoming more complex or requiring greater processing capabilities over time. For automotive applications, our microcontrollers deliver the required reliability, security and functional safety to address current and future automotive challenges. In an increasingly connected and networked society, where security is playing a more important role, our MCU families are equipped with varying security features (such as remote authentication, system/data integrity, secure communication and anomaly detection) to address different type of security risks. Our new i.MX RT crossover processors are built using applications processors chassis, delivering a high level of integration, high speed peripherals, enhanced security, and engines for enhanced user experience (for example, 2D/3D graphics), but powered by a low-power MCU core running a real-time operating system like Amazon Free RTOS or Zephyr RTOS. The i.MX RT series offers the high performing Arm Cortex-M core, real-time functionality, and MCU usability at an affordable price. Our S32x Automotive Processing Platform offers scalability across products and multiple application domains with S32K MCU’s based on Arm Cortex-M cores with Automotive Safety Integrity Level (ASIL-D) capabilities.
**ii.**Application Processors
Application processors consist of a computing core with embedded memory and special-purpose hardware and software for secure multimedia applications such as graphics and video. Our products focus on consumer devices, industrial applications and automotive applications, like driver information systems, ADAS and vehicle networking that require processing and multimedia capabilities. We provide highly integrated ARM-based i.MX application processors with integrated audio, video and graphics capability that are optimized for low-power and high-performance applications. Our i.MX family of processors are designed in conjunction with a broad suite of additional products including power management solutions, audio codecs, touch sensors and accelerometers to provide full systems solutions across a wide range of operating systems and applications. Our i.MX 8 and 9 families are the latest generations of our general purpose application processors. Our i.MX 8 family is a feature and performance scalable multi-core platform that includes single, dual and quad-core families based on the Arm Cortex architecture for advanced graphics, imaging, machine vision, audio, voice, video, and safety-critical applications. Together, these products provide a family of applications processors featuring software, power and pin compatibility across single, dual and quad core implementations. Software support includes Linux and Android implementations. Our i.MX 9 series of application processors integrates hardware neural processing units across the entire series for acceleration of machine learning applications at the edge. In Automotive, our S32x Automotive Processing Platform offers scalability across products and multiple application domains based on Arm Cortex-A, Cortex-R, and Cortex-M cores with Automotive Safety Integrity Level (ASIL-D) capabilities with software compatibility from the MCU’s to SoC’s.
**iii.**Communication Processors
Communication processors combine a computing core, caches and other memories, with high-speed networking and input/output interfaces, such as Ethernet and PCI Express. Our portfolio includes 64-bit Arm-based Layerscape processors with up to 16 CPUs and Ethernet ports running at up to 100Gbps. Software support includes Linux and commercial real-time operating systems. Within enterprise and data-center communications infrastructure, our processors are used in switches, routers, SD-WAN access devices, Wi-Fi access points, and network security systems. Within service-provider communications infrastructure, our processors are used in cellular base stations, fixed wireless access Customer Premises Equipment (CPE), residential gateways, broadband aggregation systems, and core networking equipment. Although designed for use in communications infrastructure, these processors also find widespread use in other types of equipment, including industrial automation for control, edge computing nodes, cloud computing servers for offloading networking functions, and automobiles for communications and some ADAS functions. We also offer Layerscape Access processors, which implement baseband functions, principally for wireless systems such as 5G fixed wireless access, using programmable vector signal processors.
**iv.**Wireless Connectivity
We offer a broad portfolio of connectivity solutions, including Near Field Communications (NFC), Ultra-wideband (UWB), Bluetooth low-energy (BLE), Zigbee as well as Wi-Fi and Wi-Fi/Bluetooth integrated SoCs. These products are integrated into a wide variety of end devices, such as mobile phones, wearables, enterprise access points, home gateways, voice assistants, multimedia devices, gaming consoles, printers, automotive infotainment and smart industrial devices.
**v.**Analog and Interface Products
We have a very broad portfolio of Analog and Interface products that are used in many markets, particularly automotive, industrial/IoT and mobile. In automotive we are the market leader in most of the applications, with integrated 77Ghz Radar solution for ADAS, battery management products for Electrification, audio processing solutions and amplifiers for car entertainment, Controller Area Network (CAN), Local Interconnect Network (LIN), FlexRay and Ethernet solutions for in-vehicle networking and two-way secure products for secure car access. In Industrial/IoT and mobile, we are a major supplier in interface, power and high-performance analog products. Our product portfolios includes I2C/I³C, General Purpose Input/Output (GPIO), LED controllers, real-time clocks, signal and load switches, signal integrity products, wired charging solutions, fast charging solutions, DC-DC, AC-DC converters and high-performance RF amplifiers. We have also successfully engaged with leading OEMs to drive custom and semi-custom products which in turn allow us to refine and accelerate our innovation and product roadmaps.
**vi.**Radio Frequency Devices
NXP is the market leader in High-Performance Radio Frequency (HPRF) power amplifiers. We have an extensive portfolio of LDMOS, GaN and GaAs RF transistors. NXP’s solutions range from sub-6GHz to 40GHz and from milliwatts to kilowatts. For base stations, NXP offers a full range of solutions addressing 5G RF power amplification needs from MIMO to massive MIMO based active antenna systems for cellular and millimeter Wave (mmWave) spectrum bands. We are engaged with the majority of the largest customers in mobile base stations and in several other application areas. In low and medium Power Amplification, NXPs low noise amplifier (LNA) portfolio offers solutions to meet future design needs in a wide range of applications. Two technologies serve the LNA portfolio, each with distinct advantages for their applications. Wireless infrastructure applications and many general wireless applications are served with III-V technology LNAs. Advanced SiGe technology is utilized in LNAs designed for wireless communication, cellular, consumer, automotive and industrial applications.
**vii.**Security Controllers
NXP is the market leader in security controller ICs. Our security controller ICs are embedded in smart cards (ePassports, electronic ID credentials, payment cards and transportation cards), as well as in consumer electronic and smart devices, for example in smartphones, tablets and wearables. These security controller ICs are suited for applications demanding the highest security and reliability. Nearly all of our security products consist of multi-functional solutions comprised of passive RF connectivity devices facilitating information transfer from the user document to reader infrastructure; secure, tamper-proof microcontroller devices in which
information is securely encrypted (“secure element”); and secure real-time operating system software products to facilitate the encryption-decryption of data, and the interaction with the reader infrastructure systems. Our solutions are developed to provide extreme levels of security of user information, undergoing stringent and continued global governmental and banking certification processes, and to deliver a high level of device performance enabling significant throughput and productivity to our customers.
**viii.**Sensors
Sensors serve as a primary interface in embedded systems for advanced human interface and contextual awareness that mimic the human “5 senses” interaction with the external environment. We provide several categories of semiconductor-based environmental and inertial sensors for the Automotive market, including pressure, inertial, magnetic and gyroscopic sensors that provide orientation detection, gesture recognition, tilt to scroll functionality and position detection.
Manufacturing
We manufacture integrated circuits and discrete semiconductors through a combination of wholly owned manufacturing facilities, a manufacturing facility operated jointly with another semiconductor company and third-party foundries and assembly and test subcontractors. We manage our manufacturing assets together through one centralized organization to ensure we realize scale benefits in asset utilization, purchasing volumes and overhead leverage across businesses.
In the future, we expect to outsource an increased part of our internal demand for wafer foundry and packaging services to third-party manufacturing sources in order to increase our flexibility to accommodate increased demand.
The manufacturing of a semiconductor involves several phases of production, which can be broadly divided into “front-end” and “back-end” processes. Front-end processes take place at highly complex wafer manufacturing facilities (called fabrication plants or “wafer fabs”), and involve the imprinting of substrate silicon wafers with the precise circuitry required for semiconductors to function. The front-end production cycle requires high levels of precision and involves as many as 300 process steps. Back-end processes involve the assembly, test and packaging of semiconductors in a form suitable for distribution. In contrast to the highly complex front-end process, back-end processing is generally less complicated, and as a result we tend to determine the location of our back-end facilities based more on cost factors than on technical considerations.
We primarily focus our internal and joint venture wafer manufacturing operations on running proprietary specialty process technologies that enable us to differentiate our products on key performance features, and we generally outsource wafer manufacturing in process technologies that are available at third-party wafer foundries when it is economical to do so. In addition, we increasingly focus our in-house manufacturing on our competitive 8-inch wafer facilities, which predominantly run manufacturing processes in the 140 nanometer, 180 nanometer and 250 nanometer process nodes. This focus increases our return on invested capital and reduces capital expenditures.
Our front-end manufacturing facilities use a broad range of production processes and proprietary design methods, including complementary metal oxide semiconductor (CMOS), bipolar, bipolar CMOS (BiCMOS) and double-diffused metal on silicon oxide semiconductor (DMOS) technologies. Our wafer fabs produce semiconductors with line widths ranging from 90 nanometers to 3 microns for integrated circuits and 0.5 microns to greater than 4 microns for discretes. This broad technology portfolio enables us to meet increasing demand from customers for system solutions, which require a variety of technologies.
Our back-end manufacturing facilities test and package many different types of products using a wide variety of processes. To optimize flexibility, we use shared technology platforms for our back-end assembly operations. Most of our assembly and test activities are maintained in-house.
The following table shows selected key information with respect to our major front-end and back-end facilities:
| Site | Ownership | Wafer sized used | Line widths used (vm) | Technology/Products | ||||||||||||||||||||||
| (Microns) | ||||||||||||||||||||||||||
| Front-end | ||||||||||||||||||||||||||
| Singapore (SSMC)¹⁾ | 61.2 | % | 8” | 0.14-0.25 | CMOS, eNVM, Power, BCDMOS, RF | |||||||||||||||||||||
| Nijmegen, the Netherlands | 100 | % | 8” | 0.14-1.00 | CMOS, BCDMOS, RF, Power MOSFET | |||||||||||||||||||||
| Austin (Oak Hill), United States | 100 | % | 8” | 0.25-1.50 | CMOS, Sensors, RF, Power MOSFET | |||||||||||||||||||||
| Chandler, United States | 100 | % | 8” | 0.18-0.50 | CMOS, eNVM, BCDMOS | |||||||||||||||||||||
| Chandler RF, United States | 100 | % | 6” | 0.25-0.40 | GaN | |||||||||||||||||||||
| Austin (Ed Bluestein), United States | 100 | % | 8” | 0.09-0.18 | CMOS, eNVM, BCDMOS, Radar | |||||||||||||||||||||
| Back-end | ||||||||||||||||||||||||||
| Kaohsiung, Taiwan | 100 | % | — | — | NFC, Automotive Car-access, In-Vehicle Networking, Micro-controllers, ADAS (Radar), Analog, Mixed-Signal and Power | |||||||||||||||||||||
| Bangkok, Thailand | 100 | % | — | — | Automotive In-Vehicle Networking and Sensors, Analog, RFID, Banking and e-Passport modules, Power Management | |||||||||||||||||||||
| Kuala Lumpur, Malaysia | 100 | % | — | — | Micro-processors, ADAS/Radar, Micro-controllers, Advanced Audio Processor, Sensors, Power Management, Analog and Mixed Signal, RF devices | |||||||||||||||||||||
| Tianjin, China | 100 | % | — | — | Micro-processors, Micro-controllers, Power Management, Battery Management, Analog and Mixed Signal |
- Joint venture with TSMC; we are entitled to 60% of the joint venture’s annual capacity.
We use a large number of raw materials in our front- and back-end manufacturing processes, including silicon wafers, chemicals, gases, lead frames, substrates, molding compounds and various types of precious and other metals. Our most important raw materials are the raw, or substrate, silicon wafers we use to make our semiconductors. We purchase these wafers, which must meet exacting specifications, from a limited number of suppliers in the geographic region in which our fabrication facilities are located. At our wholly owned fabrication plants, we use raw wafers ranging from 6 inches to 8 inches in size. Our SSMC wafer fab facility, which produces 8 inch wafers, is jointly owned by TSMC and ourselves. Emerging fabrication technologies employ larger wafer sizes and, accordingly, we expect that our production requirements will in the future shift towards larger substrate wafers.
We typically source our other raw materials in a similar fashion as our wafers, although our portfolio of suppliers is more diverse. Some of our suppliers provide us with materials on a just-in-time basis, which permits us to reduce our procurement costs and the negative cash flow consequences of maintaining inventories, but exposes us to potential supply chain interruptions. We purchase most of our raw materials on the basis of fixed price contracts.
Due to the COVID-19 pandemic, semiconductor supply chains have been under significant pressure. As a result, there has been a tendency towards longer term contracts with suppliers in exchange for capacity. From an operational perspective, all of our manufacturing facilities continue to operate around the world in accordance with guidance issued by local and national government authorities.
Sales, Marketing and Customers
We market our products and solutions worldwide to a variety of OEMs, contract manufacturers and distributors. We generate demand for our products by delivering product solutions to our customers, and supporting their system design-in activities by providing application architecture expertise and local field application engineering support.
Our sales and marketing teams are organized into five regions, which are EMEA (Europe, the Middle East and Africa), the Americas, Japan, South Korea, and Greater China and Asia Pacific). These sales regions are responsible for managing customer relationships and creating demand for our solutions through the full ecosystem development. In addition, our sales and marketing teams in the regions partner with our distributors and our large number of mass market customers.
Our sales and marketing strategy focuses on key defined verticals in Automotive, Mobile, Industrial & IoT and Communication Infrastructure, deepening our relationship with our top OEMs and electronic manufacturing service customers, expanding our reach to our mass market customers, startups and our distribution partners and becoming their preferred supplier, which we believe assists us in reducing sales volatility in challenging markets. We have long-standing customer relationships with most of our customers. Our 10 largest OEM end customers, some of whom are supplied by distributors, in alphabetical order, are Apple, Aptiv, Bosch, Continental, Denso, Harman Auto, LGE, Samsung, Visteon, and Vitesco. We also have a strong position with our distribution partners, including our three largest, Arrow, Avnet and WT Micro.
Our revenue is primarily the sum of our direct sales to OEMs plus our distributors’ resale of NXP products. Avnet accounted for 18% of our revenue in 2021 and 17% in 2020. No other distributor accounted for greater than 10% of our revenue. No OEM for which we had direct sales to accounted for more than 10% of our revenue in 2021 or 2020.
Research and Development
We believe that our future success depends on our ability to both improve our existing products and to develop new products for both existing and new markets. We direct our research and development efforts largely to the development of new semiconductor solutions where we see significant opportunities for growth. We target applications that require stringent overall system and subsystem performance. As new and challenging applications proliferate, we believe that many of these applications will benefit from our solutions. We have assembled a global team of highly skilled semiconductor and embedded software design engineers with expertise in RF, analog, power management, interface, security and digital processing.
To outpace market growth we invest in research and development to extend or create leading market positions, with an emphasis on fast growing sizable market segments, such as ADAS, in-vehicle networks and power management, as well as Edge computing to support the successful deployment in the IoT with our cross-over processing technology, but also in emerging markets, such as massive MIMO in RF Power and mmWave for 5G. In addition, we invest a few percent of our total research and development expenditures in research activities that develop fundamental new technologies or product categories that could contribute significantly to our company's growth in the future.
We annually perform a fundamental review of our business portfolio and our related new product and technology development opportunities in order to decide on changes in the allocation of our research and development resources. For products targeting established markets, we evaluate our research and development expenditures based on clear business need and risk assessments. For break-through technologies and new market opportunities, we look at the strategic fit and synergies with the rest of our portfolio and the size of the potential addressable market. Overall, we allocate our research and development to maintain a healthy mix of emerging growth and mature businesses.
Intellectual Property
The creation and use of intellectual property is a key aspect of our strategy to differentiate ourselves in the marketplace. We seek to protect our proprietary technologies by obtaining patents, trademarks, domain names, retaining trade secrets and defending, enforcing and utilizing our intellectual property rights, where appropriate. We believe this strategy allows us to preserve the advantages of our products and technologies, and helps us to improve the return on our investment in research and development. We have a broad portfolio of approximately 9,500 patent families (each patent family includes all patents and patent applications originating from the same invention). To protect confidential technical information and software, we rely on copyright and trade secret law and enter into confidentiality agreements as applicable. In situations where we believe that a third party has infringed on our intellectual property, we enforce our rights through all available legal means to the extent that we determine the benefits of such actions to outweigh the costs and risks involved.
We own a number of trademarks that are used in the conduct of our business. Where we consider it desirable, we develop names for our new products and secure trademark protection. Our trademarks allow us to further distinguish our company and our products and are important in our relationships with customers, suppliers, partners and end-users.
While our patents, trademarks, trade secrets and other intellectual property rights constitute valuable assets, we do not view any individual right or asset as material to our operations as a whole. We believe it is the combination of our proprietary technology, patents, know-how and other intellectual property rights and assets that creates an advantage for our business.
In addition to obtaining our own patents and other intellectual property rights, we have entered into licensing agreements and other arrangements authorizing us to use intellectual property rights, confidential technical information, software and other technology owned by third parties. We also engage, in certain instances, in licensing and selling of certain of our technology, patents and other intellectual property rights.
Competition
We compete with many different semiconductor companies on a global basis, including with both integrated device manufacturers (“IDMs”) as well as fabless companies. Nearly all our competitors invest extensively in research and development, manufacturing, sales and marketing capabilities across a broad spectrum of product lines. Many of our competitors are focused on single applications or market segments. Most of our competitors compete with us with respect to some, but not all, of our product lines.
Our primary key public competitors in alphabetical order include, but are not limited to, Analog Devices Inc., Infineon Technologies AG, Intel Corp., Marvell Technology, Mediatek Inc., Microchip Technology Inc., NVIDIA Corp., Qualcomm Incorporated, Renesas Electronics Corp., STMicroelectronics NV and Texas Instruments Incorporated.
The basis on which we compete varies across end markets and geographic regions. This includes competing on the basis of our ability to develop new products and the underlying intellectual property in a timely manner to meet customer requirements in terms of product features, quality, performance, warranty, availability and cost. In addition, we are asked to deliver full system capabilities which include multiple NXP devices and enabling software. This requires in-depth knowledge of specific applications in target markets in order to develop robust system solutions and qualified customer support resources.
Seasonality
Historically, our net revenue does not display consistent or predictable seasonal patterns.
Government Regulation, including Environmental Regulation
The information set forth under the “Environmental remediation” caption of Note 15 of our notes to the Consolidated Financial Statements included in Part II, Item 8 of this Annual Report is incorporated herein by
reference. For additional discussion of certain risks associated with government and environmental regulation, see Part I, Item 1A. Risk Factors.
Information about our Executive Officers
The names, ages and positions as of February 24, 2022, of our executive officers, including our chief executive officer, Mr. Sievers, are as follows:
| Name | Age | Position | ||||||||||||
| Kurt Sievers | 52 | Executive director, president and chief executive officer | ||||||||||||
| Bill Betz | 44 | Executive vice president and chief financial officer | ||||||||||||
| Christopher Jensen | 52 | Executive vice president and chief human resources officer | ||||||||||||
| Andy Micallef | 57 | Executive vice president global operations | ||||||||||||
| Stephen Owen | 61 | Executive vice president sales & marketing | ||||||||||||
| Jennifer Wuamett | 56 | Executive vice president and general counsel |
Human Capital
At NXP, our diverse and talented employees drive the innovation that sets our company apart and fuels our success in the market. Across the globe, we have policies and programs to attract and maintain the best talent possible. We focus on driving employee engagement; building thought leadership; embracing diversity, equity and inclusion; providing competitive and fair compensation and benefits; enabling talent development and growth opportunities; investing in future talent; focusing on employee retention; and giving back to our communities.
NXP’s workforce includes direct labor (DL) and indirect labor (IDL). DL are those employees directly involved in manufacturing our products, while IDL consists of individual contributors, managers and executives in other functions such as research and development (R&D) and selling, general and administrative (SG&A). At December 31, 2021, we had approximately 31,000 employees, which includes approximately 1,500 employees in our joint venture. Our NXP global workforce spans three regions encompassing 30+ countries and includes approximately 9,300 employees dedicated to research and development of our products and solutions.
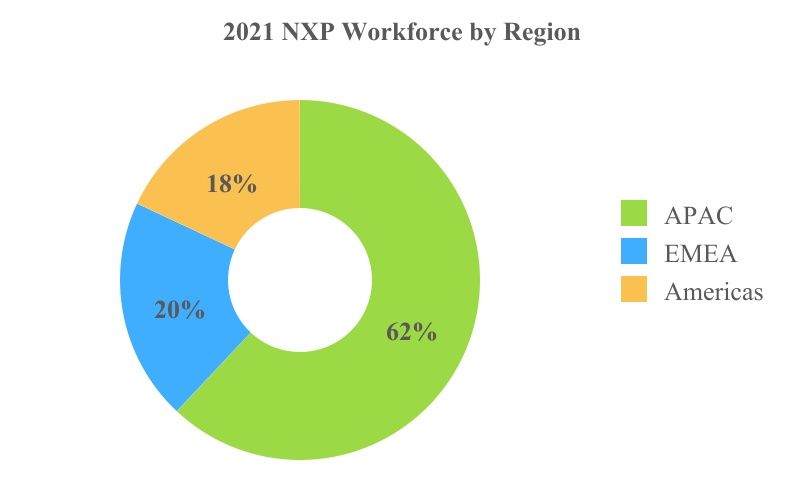
We monitor voluntary attrition closely as a key indicator of employee engagement. This attrition is also compared to industry norms to ensure we are effectively retaining our employees throughout the world. During calendar 2021, our voluntary attrition rate was 7.9% for IDL, 18.4% for our DL population and 12.1% of the combined employee population. In 2021, NXP saw a year-over-year increase in employee turnover. To mitigate voluntary turnover, we launched several initiatives centered around retention for strategic roles and top-performing talent, as well as broad-based programs targeting all employees.
Diversity, Equality and Inclusion
At NXP, we value diversity, equality and inclusion, and respect the unique talents, experiences, backgrounds, cultures and ideas of our team members. Our diversity, equality and inclusion approach is centered around ensuring leadership commitment and accountability; building and sustaining a qualified and diverse talent pipeline and equitable processes; and fostering an inclusive culture and a sense of belonging to attract and retain the best talent. NXP continues to contribute resources focused on driving cultural awareness across the Company, which is spearheaded by NXP’s Head of Diversity, Equality and Inclusion. The Compensation Committee of our Board provides oversight of our policies, programs and initiatives focusing on human capital management, including workforce diversity, equality and inclusion.
NXP Employee Resource Groups (ERGs) enable our culture and inclusive work environment, as we work to ensure diversity of thought throughout our company and bring unique perspectives and skills to help those in our communities. Today, we have eight primary ERGs, with representation in Asia, Europe, Mexico and the United States. Membership and participation in ERGs is open to all employees, and global engagement is encouraged. To track the progress of our growing ERGs, we measure membership, programming and employee engagement for each group.
To support our diversity, equality and inclusion approach and demonstrate our commitment to transparency and accountability, we have established the following aspirational 2025 diversity, equality and inclusion stretch goals to improve global gender representation and minority race and ethnicity representation in the United States.
| 2025 Goals | ||||||||||||||
| 40% Women in Overall Global Workforce | 30% Women in Global Indirect Labor Workforce | 20% Women in Executive Positions* | 25% Women in R&D Positions | 50% Minority Representation in the United States* |
| 2021 Progress towards Goals | ||||||||||||||
| 37% | 24% | 13% | 17% | 49% |
- Executive positions are defined as individuals at the level of Vice President and above. Minority representation includes employees who self-identify as Asian, Hispanic or Latino, Black or African American, American Indian or Alaska Native, Pacific Islander or two or more races. We also include within minority representation employees who have not self-identified an ethnicity.
Corporate Values and Employee Engagement
NXP’s values are the foundation of what makes us an extraordinary company. Engaging, developing, and caring for our team members is how we create long-term value for our stakeholders. Our values guide our decision making and speak to how we operate, our inherent beliefs and how we engage and respect each employee’s contribution, and push the boundaries of creativity and innovation. We hold ourselves accountable to our values by including them in our performance evaluation process.

To assess and improve employee engagement, NXP regularly conducts our global Winning Culture Survey. We invite employees to share their level of agreement on a variety of factors, including engagement, strategy, culture, leadership, continuous improvement, collaboration, execution, accountability, work environment and support.
Talent Development
NXP is committed to continuous learning, including mechanisms for learning from others, on-the-job development experiences, and formal training. Using a blend of internally designed and externally sourced courses and learning resources, we offer our employees around the globe a variety of training programs that provide real-time learning opportunities in support of key business processes, requirements and initiatives. We also provide a library of on-demand skills development and microlearning resources to all our employees.
We work to create developmental opportunities for our employees through stretch assignments, project roles, cross-functional interactions, cross-geography engagements, and both temporary and longer-term job rotations – all of which are used to stimulate core skill and leadership competency development, provide on-the-job learning experience, and fuel employee career growth. We also believe that our commitment to our internship programs and university partnerships are a key contributor to developing the new generation of talent, including engineers in our industry and company, and provide a pipeline of recent college graduates into our talent pool.
Compensation and Benefits
We provide total rewards packages that include market competitive base salary, as well as opportunities to earn short-term cash incentives and equity-based incentives. In addition, in an effort to meet the specific needs of our employees and their families, we offer benefits programs, which vary by country/region, and include an Employee Stock Purchase Plan, retirement programs, healthcare and insurance benefits, allowances, paid time off, family leave, flexible work arrangements, and other employee assistance programs.
NXP’s compensation programs are designed to attract the best talent and drive performance across all areas of our diverse workforce. NXP is committed to managing all reward-based compensation programs, including merit increases, incentive program payouts and long-term incentive awards, to deliver on our pay-for-performance philosophy. Rewarding performance is a critical foundation for our overall compensation program.
We also have developed a proactive process to evaluate each reward-based compensation program in real time and provide leaders with feedback to ensure fair and equitable compensation while decisions are being made. NXP relies on third-party data to establish fair, equitable and competitive compensation and benefits programs. We then empower leaders to recognize both individual and team accomplishments through a variety of compensation programs.
Employee Health and Safety
We are committed to the safety of our employees, and we continuously assess safety risks globally to ensure workplace risks are mitigated. We are certified to ISO 45001, the occupational health and safety management system, and have developed robust safety programs and initiatives to safeguard our workforce.
With the unprecedented COVID-19 pandemic ongoing over the last two years, the health and safety of our employees has continued to be of utmost importance, and we have effectively managed our safety programs over this period. For example, employees who are required to be physically at one of our locations are protected with increased safety and site entry requirements, many of which exceed local requirements. We have hosted several successful vaccination drives in some countries where our employees live and work. During this period we have also transitioned many of our employees to remote working partially or full-time to protect those who must be on-site to do their jobs. Additionally, as external conditions improve, we have developed a global flexible work arrangement program which offers eligible employees the ability to work a combination of on-site and remotely. These remote work arrangements reduce the individual site population to further protect employees who must work on-site. We believe the combination of our remote work transitions and our robust on-site safety programs and initiatives has significantly mitigated the safety risks for all our workforce.
Employee Representation
A number of our employees are members of a labor union and in various countries, local law requires us to inform and consult with employee representatives on matters relating to labor conditions. We have not experienced any material strikes or labor disputes in the past and consider our employee relations to be good.
We also have employee-lead worker’s councils in various countries that provide input and oversight to many of the decisions made on behalf of employees.
Climate and Environment
As part of our commitment to reducing emissions and conserving the earth’s natural resources, environment is a key pillar in our Sustainability Policy and strategy. We set company-wide environmental targets to optimize our resource use and consumption, minimize waste and continuously improve. Our targets are set periodically, and we currently are in the process of evaluating and updating focused mid- and long-term targets on carbon footprint reduction, renewable energy consumption, and water and waste recycling.
See Part I, Item 1A. Risk Factors for a discussion of potential global environmental risks that may adversely affect our business operations, such as climate change or natural disasters.
Our commitment to enable a smarter, more sustainable world goes beyond our operations, and includes innovating product solutions that support the sustainability goals and objectives of our stakeholders. We monitor developments of global legislation by tracking current discussions, timelines, and the likelihood of new implementations. During the design and development phase of our new product solutions, we emphasize these potential requirements to coincide with new product introductions. This proactively timed approach supports the success of sustainable green technology for long- and short-term impact of NXP and our customers.
Additional information about our environment strategy, targets and metrics is included in our Corporate Sustainability Report, and can be found on our website1.
Available Information
Our main corporate website address is www.nxp.com. Copies of our filings with the United States Securities and Exchange Commission (SEC), including our annual report on Form 10-K, quarterly reports on Form 10-Q, current reports on Form 8-K, and amendments to reports filed pursuant to Sections 13(a) and 15(d) of the Securities Exchange Act of 1934, as amended (the “Exchange Act”), are available free of charge on our website within the "Investors Relations" section as soon as reasonably practicable after having been electronically filed or furnished to the SEC. All SEC filings are also available at the SEC's website at www.sec.gov. The information contained on these websites as referenced is not incorporated by reference into this filing. Further, the Company’s references to website URLs are intended to be inactive textual references only.
Item 1A. Risk Factors
Risks related to the coronavirus (COVID-19) pandemic
The extent to which the coronavirus (COVID-19) outbreak and measures taken in response thereto could materially adversely affect our financial condition and results of operations will depend on future developments, which are highly uncertain and are difficult to predict. The COVID-19 pandemic and measures taken in response have adversely impacted the Company's financial condition and results of operations.
The novel strain of the coronavirus identified in China in late 2019 has globally spread throughout other areas such as Asia, Europe, the Middle East, and North America and has resulted in authorities implementing numerous measures to try to contain the virus, such as travel bans and restrictions, quarantines, shelter in place orders, and shutdowns. These measures have adversely impacted and may further impact our workforce and operations, the operations of our customers, and those of our respective vendors and suppliers. We have significant manufacturing operations in China, Malaysia, Thailand, Singapore, Taiwan, The Netherlands and the U.S., and each of these countries has been affected by the outbreak and taken measures to try to contain it. There is considerable uncertainty regarding such measures and potential future measures, and restrictions on our access to our manufacturing facilities or on our support operations or workforce, or similar limitations for our vendors and suppliers, and restrictions or disruptions of transportation, such as reduced availability of air transport, port closures, and increased border controls or closures, could limit our capacity to meet customer demand and have a material adverse effect on our financial condition and results of operations.
The outbreak has significantly increased economic and demand uncertainty. We experienced a significant decline in revenue in the first half of 2020 related to the COVID-19 outbreak and then a swift rebound in demand beginning in the third quarter of 2020 and accelerating through the fourth quarter of 2021. The situation remains uncertain and the continued spread of COVID-19 or variants of COVID-19 may result in another economic
1 The contents of our website and our Corporate Sustainability Report and Sustainability Policy are referenced for general information only and are not incorporated by reference in this Form 10-K.
slowdown similar or worse than what we experienced in the first half of 2020, including the possibility that it could lead to a global recession. Risks related to a slowdown or recession are described in our risk factor titled “Significantly increased volatility and instability and unfavorable economic conditions may adversely affect our business” below.
The spread of COVID-19 caused us to modify our business practices (including employee travel, employee work locations, and cancellation of physical participation in meetings, events and conferences), and we may reinstitute these and additional measures as may be required by government authorities or that we determine are in the best interests of our employees, customers, partners, and suppliers as we continue to respond to the COVID-19 situation in the communities in which we operate. There is no certainty that such measures will be sufficient to mitigate the risks posed by the virus, and our ability to perform critical functions could be harmed.
The degree to which COVID-19 adversely impacts our future results will depend on future developments, which are highly uncertain and cannot be predicted, including, but not limited to, the duration and spread of the outbreak, its severity, the actions to contain the virus or treat its impact, and how quickly and to what extent normal economic and operating conditions can resume. Even after the COVID-19 outbreak has subsided, we may experience material adverse impacts to our business as a result of the global economic impact and any recession that has occurred or may occur in the future. To the extent the COVID-19 pandemic adversely affects our business, results of operations, financial condition and cash flows, it may also heighten many of the other risks described below. There are no comparable recent events that provide guidance as to the effect the spread of COVID-19 as a global pandemic may have, and, as a result, the ultimate impact of the outbreak on our operations and financial results is highly uncertain and subject to change.
Risks related to the semiconductor industry and the markets in which we participate
The semiconductor industry is highly cyclical.
Historically, the relationship between supply and demand in the semiconductor industry has caused a high degree of cyclicality in the semiconductor market. Semiconductor supply is partly driven by manufacturing capacity, which in the past has demonstrated alternating periods of substantial capacity additions and periods in which no or limited capacity was added. As a general matter, semiconductor companies are more likely to add capacity in periods when current or expected future demand is strong and margins are, or are expected to be, high. Investments in new capacity can result in overcapacity, which can lead to a reduction in prices and margins. In response, companies typically limit further capacity additions, eventually causing the market to be relatively undersupplied. In addition, demand for semiconductors varies, which can exacerbate the effect of supply fluctuations. As a result of this cyclicality, the semiconductor industry has in the past experienced significant downturns, such as in 1997/1998, 2001/2002 and in 2008/2009, often in connection with, or in anticipation of, maturing life cycles of semiconductor companies’ products and declines in general economic conditions. These downturns have been characterized by diminishing demand for end-user products, high inventory levels, under-utilization of manufacturing capacity and accelerated erosion of average selling prices. The foregoing risks have historically had, and may continue to have, a material adverse effect on our business, financial condition and results of operations.
Significantly increased volatility and instability and unfavorable economic conditions may adversely affect our business.
It is difficult for us, our customers and suppliers to forecast demand trends. We may be unable to accurately predict the extent or duration of cycles or their effect on our financial condition or result of operations and can give no assurance as to the timing, extent or duration of the current or future business cycles generally, or specific to the markets in which we participate. In the first half of 2020, demand in the automotive market steeply declined as a result of manufacturing shutdowns by automotive OEMs due to the coronavirus pandemic, resulting in an unforeseen negative impact to our results of operations. Beginning in the third quarter of 2020, demand rebounded more quickly than anticipated and accelerated through the fourth quarter of 2021, resulting in our inability to fully satisfy customer demand. In 2008 and 2009, Europe, the United States and international markets experienced increased volatility and instability related to the global financial crisis. In the event of a future decline in global economic conditions, our business, financial condition and results of operations could be materially adversely affected, and the resulting economic decline might disproportionately affect the markets in which we participate, further exacerbating a decline in our results of operations.
The semiconductor industry is highly competitive. If we fail to introduce new technologies and products in a timely manner, this could adversely affect our business.
The semiconductor industry is highly competitive and characterized by constant and rapid technological change, short product lifecycles, significant price erosion and evolving standards. Accordingly, the success o
Showing the first 8K of 72K characters. Open the full section
Item 1B. Unresolved Staff Comments
Not applicable.
Item 2. Properties
The Company's headquarters are located in Eindhoven, the Netherlands. As of February 24, 2022, the Company operates owned manufacturing facilities primarily in the United States, Netherlands, Malaysia, China, Thailand and Taiwan, as well as in Singapore (SSMC) together with our joint venture partner TSMC. The Company also owns or leases other properties in multiple countries for use as administrative, sales or research and development facilities. The Company believes its existing facilities and equipment are in good operating condition and adequate to meet our need for the near future.
Item 3. Legal Proceedings
The information set forth under the “Litigation” and “Environmental Remediation” captions of Note 15 to the Consolidated Financial Statements included in Part II, Item 8 of this Annual Report is incorporated herein by reference. For additional discussion of certain risks associated with legal proceedings, see Part I, Item 1A. Risk Factors.
Item 4. Mine Safety Disclosures
Not applicable.
Part II
Item 5. Market for Registrant’s Common Equity, Related Stockholder Matters and Issuer Purchases of Equity Securities
The Company's common stock is traded on the Nasdaq stock market under the symbol NXPI. On February 16, 2022 there were 14 shareholders of record and 741,000 beneficial shareholders of our common stock.
Dividends Per Common Share
The following table presents the quarterly dividends on our common stock for the periods indicated:
| 2021 | 2020 | ||||||||||
| First Quarter | 0.5625 | 0.375 | |||||||||
| Second Quarter | 0.5625 | 0.375 | |||||||||
| Third Quarter | 0.5625 | 0.375 | |||||||||
| Fourth Quarter | 0.5625 | 0.375 |
On January 31, 2022, the board of directors of NXP approved a 50 percent increase in the quarterly cash dividend to $0.845 per ordinary share to be paid in cash on April 6, 2022 to shareholders of record as of March 15, 2022. We currently expect to continue to pay dividends in the future.
Issuer Purchases of Equity Securities
In November 2019, the board of directors of NXP (the “Board”) approved the repurchase of shares up to a maximum of $2 billion (the "2019 Share Repurchase Program"). In addition, the Board approved the purchase of shares from participants in NXP's equity programs who trade shares as trade for tax and this authorization will remain in effect until terminated by the Board. In March 2021, the Board approved the repurchase of shares up to a maximum of $2 billion (the "2021 Share Repurchase Program"), and in August 2021, the Board increased the 2021 Share Repurchase Program authorization by $2 billion, for a total of $4 billion approved for the repurchase of shares under the 2021 Share Repurchase Program. In January 2022, the Board approved the repurchase of shares up to a maximum of $2 billion (the "2022 Share Repurchase Program").
The following table provides a summary of share repurchase activity during the three months ended December 31, 2021:
| Period | Total Number of Shares Purchased | Average Price Paid per Share | Number of Shares Purchased as Part of Publicly Announced Plans or Programs | Maximum Number of Shares That May Yet Be Purchased Under the Plans or Program | Number of Shares Purchased as Trade for Tax (1) | |||||||||||||||||||||||||||
| October 4, 2021 – November 7, 2021 | 2,164,950 | $195.24 | 1,548,400 | 9,286,006 | 616,550 | |||||||||||||||||||||||||||
| November 8, 2021 – December 5, 2021 | 971,221 | $220.28 | 971,225 | 8,226,693 | (4) | |||||||||||||||||||||||||||
| December 6, 2021 – December 31, 2020 | 502,822 | $225.55 | 502,949 | 7,704,856 | (127) | |||||||||||||||||||||||||||
| Total | 3,638,993 | 3,022,574 | 616,419 |
(1) Reflects shares surrendered by participants to satisfy tax withholding obligations in connection with the Company's equity programs.
Company Performance
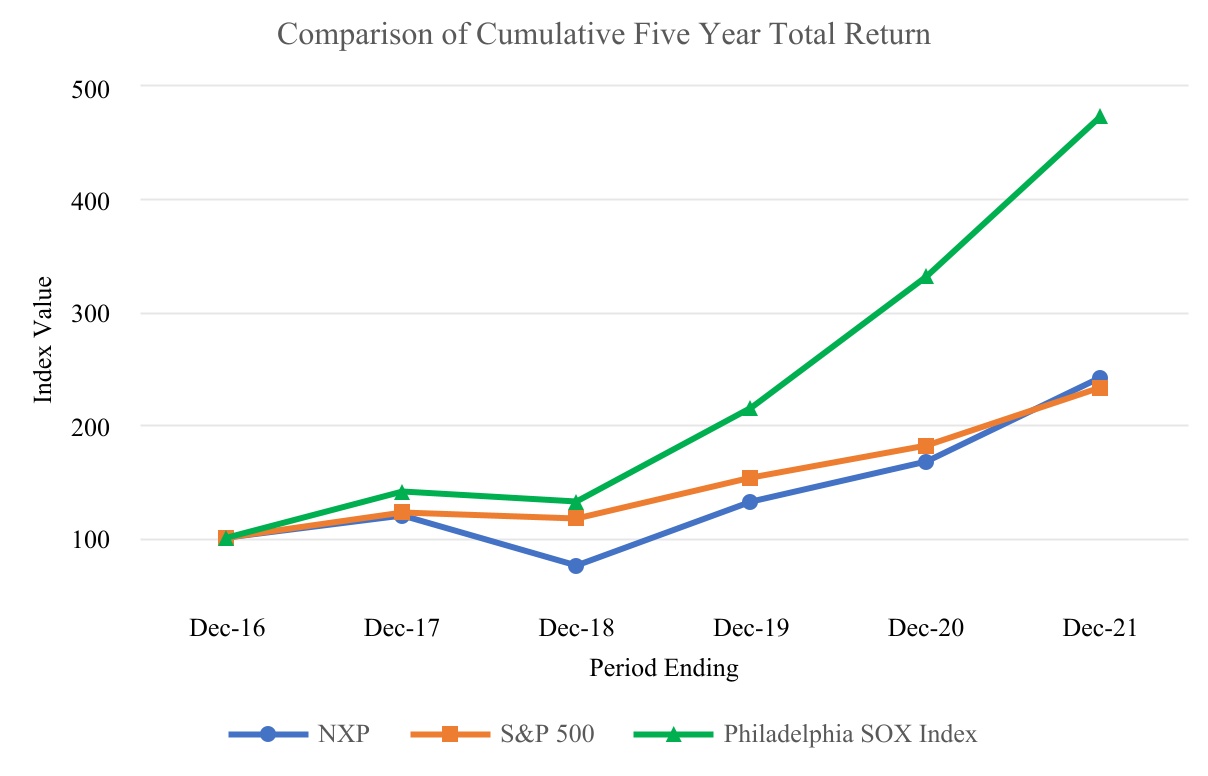
The following graph shows a comparison, since December 31, 2016 of cumulative total return for NXP, the Standard & Poor's 500 Index, and the Philadelphia Stock Exchange Semiconductor Index. The graph assumes $100 (not in millions) invested on December 31, 2016 in our common stock and each of the indices.
Item 6. [Reserved]
Item 7. Management’s Discussion and Analysis of Financial Condition and Results of Operations
Management’s discussion and analysis of financial condition and results of operations (MD&A) should be read in conjunction with the financial statements and the related notes that appear elsewhere in this document. This section of this Form 10-K generally discusses 2021 and 2020 items and year-to-year comparisons between 2021 and 2020. Discussions of 2019 items and year-to-year comparisons between 2020 and 2019 that are not included in this Form 10-K can be found in "Management's Discussion and Analysis of Financial Condition and Results of Operations" in Part II, Item 7 of our Annual Report on Form 10-K for the fiscal year ended December 31, 2020 as filed with the SEC on February 25, 2021.
Our MD&A is provided in addition to the accompanying consolidated financial statements and notes to assist readers in understanding our results of operations, financial condition and cash flows. MD&A is organized as follows:
-
Overview - Overall analysis of financial and other highlights to provide context for the MD&A
-
Results of Operations - An analysis of our financial results
-
Financial Condition, Liquidity and Capital Resources - An analysis of changes in our balance sheets and cash flows and a discussion of our financial condition and potential sources of liquidity
-
Critical Accounting Estimates - Accounting estimates that management believes are the most important to understanding the assumptions and judgments incorporated in our financial results and forecasts
-
Use of Certain Non-GAAP Financial Measures - A discussion of the non-GAAP measures used
NXP has one reportable segment representing the entity as a whole. Our segment represents groups of similar products that are combined on the basis of similar design and development requirements, product characteristics, manufacturing processes and distribution channels, and how management allocates resources and measures results. See Note 1 to the consolidated financial statements for more information regarding our segment.
Overview
| ($ in millions, unless otherwise stated) | Three Months Ended | Years Ended | |||||||||||||||||||||||||||||||||
| December 31, 2021 | October 3, 2021 | Increase/(decrease) | December 31, 2021 | December 31, 2020 | Increase/(decrease) | ||||||||||||||||||||||||||||||
| Revenue | 3,039 | 2,861 | 178 | 11,063 | 8,612 | 2,451 | |||||||||||||||||||||||||||||
| Gross profit | 1,707 | 1,583 | 124 | 6,067 | 4,235 | 1,832 | |||||||||||||||||||||||||||||
| Operating income (loss) | 807 | 711 | 96 | 2,583 | 418 | 2,165 | |||||||||||||||||||||||||||||
| Cash flow from operating activities | 785 | 924 | (139) | 3,077 | 2,482 | 595 | |||||||||||||||||||||||||||||
| Total debt | 10,572 | 9,593 | 979 | 10,572 | 7,609 | 2,963 | |||||||||||||||||||||||||||||
| Net debt | 7,742 | 7,290 | 452 | 7,742 | 5,334 | 2,408 | |||||||||||||||||||||||||||||
| Diluted weighted average number of shares outstanding | 268,545 | 271,359 | (2,814) | 275,646 | 283,809 | (8,163) | |||||||||||||||||||||||||||||
| Diluted net income per share | 2.24 | 1.91 | 0.33 | 6.79 | 0.18 | 6.61 | |||||||||||||||||||||||||||||
| Dividends per common share | 0.5625 | 0.5625 | — | 2.25 | 1.50 | 0.75 |
Revenue for 2021 was $11,063 million as compared to the $8,612 million reported in 2020, an increase of $2,451 million or an increase of 28.5% year-on-year, as a result of resurgent growth across all of the Company’s four focus end markets, with substantial growth in our strategic focused Automotive and Industrial & IoT end markets. The growth NXP experienced in 2021 was due to a combination of rebounding end market demand from the initial shock and widespread market disruption caused by the emergence of the COVID-19 pandemic in the first half of 2020 and accelerating adoption of the Company’s innovative new products and solutions. The year-on-year growth was due to higher unit volumes, as well as a higher average selling prices resulting from increases in input costs from NXP’s supplier base, which were passed onto our customers. The growth NXP experienced in 2021 began to clearly emerge at the end of the third quarter of 2020 and has continued to steadily accelerate through the fourth quarter of 2021. Even with the strong growth experienced in 2021, the Company believes customer demand will continue to outpace material supply, resulting in another positive year of growth into 2022.
Our gross profit percentage for 2021 increased to 54.8% from 49.2%, primarily due to the significant acceleration of revenue during the second half of 2021, after the drop of sales in 2020 due to the COVID-19 pandemic, which led to improved utilization, cost reductions and efficiencies, partly offset by higher personnel-related costs.
Revenue for the fourth quarter, which ended December 31, 2021 was $3,039 million as compared to $2,507 million for the fourth quarter ended December 31, 2020, an increase of $532 million or an increase of 21.2%. Revenue
in the fourth quarter of 2021 represented a historical record for NXP, the result of strong demand in a supply constrained market which was consistent with the trends seen in the first three quarters of 2021.
We continue to generate strong operating cash flows, with $3,077 million in cash flows from operations for 2021. We returned $4,577 million to our shareholders during the year in dividends and repurchases of common stock. Our cash position at the end of 2021 was $2,830 million. On November 18, 2021, the NXP Board of Directors approved a cash dividend of $0.5625 per common share for the fourth quarter of 2021.
Our global communities continue to face unprecedented challenges posed by the COVID-19 pandemic, but NXP has continued to actively respond by addressing the COVID-19 situation and its impact globally with global crisis response teams, working to mitigate the potential impacts to our people and our business. With our strong business model and with demonstrated financial discipline, which is a keystone of our culture, we continue to believe that we will emerge from this time well positioned for long-term growth as we continue to see strong customer interest in the breadth of our product portfolio, combined with solid design win awards. However, we cannot reasonably estimate the duration and severity of the pandemic or its ultimate impact on the global economy and our business and results.
Demand has come back more rapidly than we expected and our current focus is on looking after our customers and ensuring we ship as much product to them as possible. While we are encouraged by the rapid rebound in demand, we are still challenged by the impact of the global pandemic, including supply chain constraints and COVID outbreaks, and resulting government responses, in areas in which we operate. We are still of the view that the best course of action is to continue to focus on enabling our customers' success while simultaneously assuring the safety and health of all of
Showing the first 8K of 73K characters. Open the full section
Item 7A. Quantitative and Qualitative Disclosures About Market Risk
We are exposed to changes in interest rates and foreign currency exchange rates because we finance certain operations through fixed and variable rate debt instruments and denominate our transactions in a variety of foreign currencies. Changes in these rates may have an impact on future cash flow and earnings. We manage these risks through normal operating and financing activities and, when deemed appropriate, through the use of derivative financial instruments. We do not enter into financial instruments for trading or speculative purposes.
By using derivative instruments, we are subject to credit and market risk. The fair market value of the derivative instruments is determined by using valuation models whose inputs are derived using market observable inputs, including interest rate yield curves, as well as foreign exchange and commodity spot and forward rates, and reflects the asset or liability position as of the end of each reporting period. When the fair value of a derivative contract is positive, the counterparty owes us, thus creating a receivable risk for us. We are exposed to counterparty credit risk in the event of non-performance by counterparties to our derivative agreements. We minimize counterparty credit (or repayment) risk by entering into transactions with major financial institutions of investment grade credit rating. Our exposure to market risk is not hedged in a manner that completely eliminates the effects of changing market conditions on earnings or cash flow.
Interest Rate Risk
Our RCF Agreement has a $1,500 million borrowing capacity with a floating rate interest. As there are currently no borrowings under this facility, a hypothetical increase in LIBOR based interest rates would not have caused any change to our interest expense on our floating rate debt.
Additional information regarding our notes is provided in Note 2 - Significant Accounting Policies, and Note 13 - Debt, of our notes to the Consolidated Financial Statements included in Item 8. of this Annual Report is incorporated herein by reference.
Foreign Currency Risks
We are also exposed to market risk from changes in foreign currency exchange rates, which could affect operating results as well as our financial position and cash flows. We monitor our exposures to these market risks and generally employ operating and financing activities to offset these exposures where appropriate. If we do not have operating or financing activities to sufficiently offset these exposures, from time to time, we may employ derivative financial instruments such as swaps, collars, forwards, options or other instruments to limit the volatility to earnings and cash flows generated by these exposures. Derivative financial instruments are only used for hedging purposes and not for trading or speculative purposes. All counterparties to our derivatives contracts are major banking institutions. In the event of financial insolvency or distress of a counterparty to our derivative financial instruments, we may be unable to settle transactions if the counterparty does not provide us with sufficient collateral to secure its net settlement obligation to us, which could have a negative impact on our results. The Company measures all derivative financial instruments based on fair values derived from market prices of the instruments or from option pricing models, as appropriate and record these as assets or liabilities in the balance sheet. Changes in the fair values are recognized in the statement of operations immediately unless cash flow hedge accounting is applied. A summary of our foreign currency accounting policies is provided in Note 2 - Significant Accounting Policies, of our notes to the Consolidated Financial Statements included in Item 8. of this Annual Report is incorporated herein by reference.
At December 31, 2021 our net asset related to foreign currency forward contracts designated as hedges of foreign currency risk on certain operating expenditure transactions was $2 million. If our forecasted operating expenditures for currencies in which we hedge were to decline by 20% and foreign exchange rates were to change unfavorably by 20% in our hedged foreign currency, we would incur a negligible loss.
Financial assets and liabilities held by consolidated subsidiaries that are not denominated in the functional currency of those entities are subject to the effects of currency fluctuations and may affect reported earnings. As a global company, we face exposure to adverse movements in foreign currency exchange rates. We may hedge currency exposures associated with certain assets and liabilities denominated in nonfunctional currencies and certain anticipated nonfunctional currency transactions. As a result, we could experience unanticipated gains or losses on anticipated foreign currency cash flows, as well as economic loss with respect to the recoverability of investments.
Our primary foreign currency exposure relates to the U.S. dollar to euro exchange rate. However, our foreign currency exposures also relate, but are not limited, to the Chinese Yuan, the Japanese Yen, the Pound Sterling, the Malaysian Ringgit, the Singapore Dollar, the New Taiwan Dollar and the Thai Baht.
Item 8. Financial Statements and Supplementary Data
List of Financial Statements
| Report of independent registered public accounting firm | 54 | |||||||
| - Ernst & Young Accountants LLP; Eindhoven, the Netherlands; PCAOB ID: | 1396 | |||||||
| - KPMG Accountants N.V.; Amstelveen, the Netherlands; PCAOB ID: | 1012 | |||||||
| Consolidated Statements of Operations | 59 | |||||||
| Consolidated Statements of Comprehensive Income | 60 | |||||||
| Consolidated Balance Sheets | 61 | |||||||
| Consolidated Statements of Cash Flows | 62 | |||||||
| Consolidated Statements of Changes in Equity | 64 | |||||||
| Notes to the Consolidated Financial Statements | 65 |
Report of Independent Registered Public Accounting Firm
To the Shareholders and the Board of Directors of NXP Semiconductors N.V.
Opinion on the Financial Statements
We have audited the accompanying consolidated balance sheets of NXP Semiconductors N.V. (the Company) as of December 31, 2021 and 2020, the related consolidated statements of operations, comprehensive income, changes in equity and cash flows for each of the two years in the period ended December 31, 2021, and the related notes (collectively referred to as the “consolidated financial statements”). In our opinion, the consolidated financial statements present fairly, in all material respects, the financial position of the Company at December 31, 2021 and 2020, and the results of its operations and its cash flows for each of the two years in the period ended December 31, 2021, in conformity with U.S. generally accepted accounting principles.
We have also audited, in accordance with the standards of the Public Company Accounting Oversight Board (United States) (PCAOB), the Company's internal control over financial reporting as of December 31, 2021, based on criteria established in Internal Control-Integrated Framework issued by the Committee of Sponsoring Organizations of the Treadway Commission “(2013 framework)”, and our report dated February 24, 2022 expressed an adverse opinion thereon.
Basis for Opinion
These financial statements are the responsibility of the Company's management. Our responsibility is to express an opinion on the Company’s consolidated financial statements based on our audits. We are a public accounting firm registered with the PCAOB and are required to be independent with respect to the Company in accordance with the U.S. federal securities laws and the applicable rules and regulations of the Securities and Exchange Commission and the PCAOB.
We conducted our audits in accordance with the standards of the PCAOB. Those standards require that we plan and perform the audit to obtain reasonable assurance about whether the consolidated financial statements are free of material misstatement, whether due to error or fraud.
Our audits included performing procedures to assess the risks of material misstatement of the consolidated financial statements, whether due to error or fraud, and performing procedures that respond to those risks. Such procedures included examining, on a test basis, evidence regarding the amounts and disclosures in the consolidated financial statements. Our audits also included evaluating the accounting principles used and significant estimates made by management, as well as evaluating the overall presentation of the consolidated financial statements. We believe that our audits provide a reasonable basis for our opinion.
Critical Audit Matter
The critical audit matter communicated below is a matter arising from the current period audit of the financial statements that was communicated or required to be communicated to the audit committee and that: (1) relates to accounts or disclosures that are material to the financial statements and (2) involved our especially challenging, subjective or complex judgments. The communication of the critical audit matter does not alter in any way our opinion on the consolidated financial statements, taken as a whole, and we are not, by communicating the critical audit matter below, providing a separate opinion on the critical audit matter or on the accounts or disclosures to which it relates.
| Effect on financial statements of material weakness in internal control over financial reporting | |||||
| Description of the Matter | As disclosed in management’s report on internal control over financial reporting, the Company identified a material weakness as of December 31, 2021 associated with ineffective information technology general controls (ITGCs) in the areas of user access, change-management and IT operations over certain information technology (IT) systems that support the Company’s financial reporting processes. Automated and manual business process controls that are dependent on the affected ITGCs were also deemed ineffective, because they could have been adversely impacted to the extent that they rely upon information and configurations from the affected IT systems. This material weakness affects substantially all financial statement accounts. Auditing the significant financial statement accounts affected by the material weakness was determined to be a critical audit matter, because significant auditor judgment, including the assistance of IT professionals, was required to design and execute the incremental audit procedures related to the financial statement accounts that are reliant on IT systems impacted by the ineffective ITGCs and to assess the sufficiency of the procedures performed and evidence obtained. | ||||
| How We Addressed the Matter in Our Audit | We used significant judgment and involved our IT professionals to determine the timing, nature and extent of incremental procedures to be performed over financial statement accounts that are reliant on IT systems impacted by the ineffective ITGCs, including the impacted automated and manual business process controls. These incremental procedures were performed closer to the balance sheet date and included, among others, lowering our testing thresholds, increasing sample sizes and manually testing the completeness and accuracy of system reports or other information generated by the Company’s impacted IT systems, including increasing the extent to which items selected for testing were agreed to source documents. |
/s/ Ernst & Young Accountants LLP
We have served as the Company’s auditor since 2020.
Eindhoven, the Netherlands
February 24, 2022
Report of Independent Registered Public Accounting Firm
To the Shareholders and the Board of Directors of NXP Semiconductors N.V.
Opinion on Internal Control Over Financial Reporting
We have audited NXP Semiconductors N.V.’s internal control over financial reporting as of December 31, 2021, based on criteria established in Internal Control—Integrated Framework issued by the Committee of Sponsoring Organizations of the Treadway Commission (2013 framework) (the COSO criteria). In our opinion, because of the effect of the material weakness described below on the achievement of the objectives of the control criteria, NXP Semiconductors N.V. (the Company) has not maintained, in all material respects, effective internal control over financial reporting as of December 31, 2021, based on the COSO criteria.
A material weakness is a deficiency, or combination of deficiencies, in internal control over financial reporting, such that there is a reasonable possibility that a material misstatement of the c
Showing the first 8K of 191K characters. Open the full section
Item 9. Changes in and Disagreements With Accountants on Accounting and Financial Disclosure
Not applicable.
Item 9A. Controls and Procedures
Disclosure Controls and Procedures
As of the end of the period covered by this Annual Report, our management, with the participation of our chief executive officer and chief financial officer, conducted an evaluation pursuant to Rule 13a-15(e) and 15d-15(e) of the Exchange Act of the effectiveness of the design and operation of our disclosure controls and procedures. Based on this evaluation, our chief executive officer and chief financial officer concluded that as of the end of the period covered by this Annual Report the disclosure controls and procedures were not effective due to a material weakness in internal control over financial reporting, described below.
Management’s Report on Internal Control over Financial Reporting
The Company’s management is responsible for establishing and maintaining adequate internal control over financial reporting as defined in Rules 13a-15(f) and 15(d)-15(f) of the Exchange Act. The Company’s internal control over financial reporting is designed to provide reasonable assurance, not absolute assurance, regarding the reliability of financial reporting and the preparation of financial statements for external purposes in accordance with U.S. generally accepted accounting principles.
Because of its inherent limitations, internal control over financial reporting may not prevent or detect all misstatements. Moreover, projections of any evaluation of effectiveness to future periods are subject to the risk that controls may become inadequate because of changes in conditions, or that the degree of compliance with the policies or procedures may deteriorate.
Our management assessed the effectiveness of the Company’s internal control over financial reporting as of December 31, 2021 based on the criteria established in “Internal Control - Integrated Framework (2013)” by the Committee of Sponsoring Organizations of the Treadway Commission (COSO).
A material weakness is a deficiency, or a combination of deficiencies, in internal control over financial reporting, such that there is a reasonable possibility that a material misstatement of our annual or interim financial statements will not be prevented or detected on a timely basis.
The Company’s management identified a material weakness in our internal control over financial reporting associated with ineffective information technology general controls (ITGCs) in the areas of user access, change-management and IT operations over certain information technology (IT) systems that support the Company’s financial reporting processes. Management also deemed ineffective our automated and manual business process controls that are dependent on the affected ITGCs, because they could have been adversely impacted to the extent that they rely upon information and configurations from the affected IT systems. We believe that these control deficiencies were a result of: IT control processes lacking sufficient documentation such that the successful operation of ITGCs was overly dependent upon knowledge and actions of certain individuals for each applicable IT system; insufficient training of IT personnel on the importance of ITGCs; and risk-assessment processes being inadequate to identify and assess risks in IT environments that could impact internal control over financial reporting. The material weakness did not result in any identified misstatements to the financial statements, and there were no changes to previously released financial results. However, the deficiencies in IT General Controls created a more than remote possibility that a material misstatement to the Consolidated financial statements would not be prevented or detected on a timely basis. Based on this material weakness, our management concluded that as of December 31, 2021, the Company’s internal control over financial reporting was not effective.
Management has analyzed the material weaknesses and performed additional analysis and procedures in preparing our Consolidated financial statements. We have concluded that our Consolidated financial statements fairly present, in all material respects, our financial condition, results of operations and cash flows at and for the periods presented. Apart from the material weaknesses described above, NXP’s management has not identified any other deficiencies.
The Company’s independent registered public accounting firm, Ernst & Young Accountants LLP, has issued an adverse audit report on the effectiveness of the Company’s internal control over financial reporting as of December 31, 2021, which appears in Part II, Item 8 of this Form 10-K.
Remediation
Management has been implementing and continues to implement measures designed to ensure that control deficiencies contributing to the material weakness are remediated, such that these controls are designed, implemented, and operating effectively. These remediation actions are ongoing and include or are expected to include:
–Expanding controls and/or applying other appropriate procedures to address the design and operation of ITGCs on systems supporting our financial processes.
–Creating and filling functions with an emphasis on IT compliance and oversight.
–Developing a training program addressing ITGCs and policies, including educating control owners concerning the principles and requirements of each control, with a focus on those related to user access and change-management over IT systems impacting financial reporting.
–Developing and maintaining policy documentation underlying ITGCs to promote knowledge transfer upon personnel and function changes.
–Developing enhanced risk assessment and control identification procedures.
–Implementing an IT management review and testing plan to monitor ITGCs with a specific focus on systems supporting our financial reporting processes.
–Enhanced quarterly reporting on the remediation measures to the Audit Committee of the Board of Directors.
As we continue to evaluate and work to improve our internal control over financial reporting, we may decide to take additional measures to address control deficiencies or modify the remediation plans described above. We believe that these actions will remediate the material weakness, however the weakness will not be considered remediated until the applicable controls operate for a sufficient period of time and management has concluded, through testing, that these controls are operating effectively. Management believes the foregoing plans will effectively remediate the deficiencies constituting the material weaknesses and intends the remediation of this material weakness to be completed prior to the end of fiscal 2022. However, there is no assurance as to when such remediation will be completed. As the remediation plans are or continue to be implemented, management may take additional measures or modify the plan elements described above.
Inherent Limitations on Effectiveness of Controls
It should be noted that any control system, regardless of how well it is designed and operated, can provide only reasonable, not absolute, assurance that its objectives will be met. Because of inherent limitations, internal control over financial reporting may not prevent or detect misstatements. In addition, controls may become inadequate because of changes in conditions, or the degree of compliance with the policies or procedures may deteriorate. There can be no assurance that any design will succeed in achieving its stated goals under all potential future conditions, regardless of how remote.
Changes in Internal Control Over Financial Reporting
Except for the material weakness identified during the quarter, as of December 31, 2021, there were no other changes in the Company's internal control over financial reporting during the three and twelve month periods ended December 31, 2021, which were identified in connection with management's evaluation required by paragraph (d) of Rules 13a-15 and 15d-15 under the Exchange Act that have materially affected, or are reasonably likely to materially affect, our internal control over financial reporting.
Item 9B. Other Information
Not applicable.
Item 9C. Disclosure Regarding Foreign Jurisdictions that Prevent Inspections
Not applicable.
PART III
Item 10. Directors, Executive Officers and Corporate Governance
Information required by this Item regarding our directors, executive officers and governance, appears under the captions "Item 3: (Re-)appointment of Directors", "Executive Officers", "Corporate Governance" and "How our Board Governs and Is Governed", in the 2022 Proxy Statement to be filed with the SEC within 120 days after December 31, 2021 in connection with the solicitation of proxies for the Company’s 2022 annual meeting of shareholders, and is incorporated herein by reference.
Item 11. Executive Compensation
The captions entitled “Executive Compensation” and “How Our Directors Are Compensated” in our 2022 Proxy Statement to be filed with the SEC within 120 days after December 31, 2021, are incorporated herein by reference.
Item 12. Security Ownership of Certain Beneficial Owners and Management and Related Stockholder Matters
The captions entitled “Security Ownership of Certain Beneficial Owners and Management” and “Equity Compensation Plan Information” in our 2022 Proxy Statement to be filed with the SEC within 120 days after December 31, 2021, are incorporated herein by reference.
Item 13. Certain Relationships and Related Transactions, and Director Independence
The information under the captions "Certain Relationships and Related Party Transactions," "Item 3: (Re-)appointment of Directors" and "How our Board Governs and Is Governed" in the 2022 Proxy Statement to be filed with the SEC within 120 days after December 31, 2021, are incorporated herein by reference.
Item 14. Principal Accounting Fees and Services
The information under the captions "Independent Registered Public Accounting Firm," “Auditors' fees” and "Audit Committee Pre-Approval Policies" in the 2022 Proxy Statement to be filed with the SEC within 120 days after December 31, 2021, are incorporated herein by reference.
Part IV
Item 15. Exhibits and Financial Statement Schedules
(a) 1. Financial Statements:
See "List of Financial Statements" within the Consolidated Financial Statements
(a) 2. Financial Statement Schedules:
Not applicable or the required information is otherwise included in the Consolidated Financial Statements and accompanying notes.
(a) 3. Exhibits:
The exhibits listed on the index below are filed as part of, or hereby incorporated by reference into, this Form 10-K.
Item 16. Form 10-K Summary
Not applicable.
SIGNATURES
Pursuant to the requirements of Section 13 or 15(d) of the Securities Exchange Act of 1934, the registrant has duly caused this report to be signed on its behalf by the undersigned, thereunto duly authorized.
| Date: February 24, 2022 | ||||||||
| NXP Semiconductors N.V. | ||||||||
| By: | /s/ WILLIAM J. BETZ | |||||||
| William J. Betz, Executive Vice President and Chief Financial Officer | ||||||||
Power of Attorney
KNOW ALL PERSONS BY THESE PRESENTS, that each person whose signature appears below hereby constitutes and appoints each of Jennifer Wuamett and Timothy Shelhamer, as his or her true and lawful attorney-in-fact and agent, with full power of substitution and re-substitution, for him or her and in his or her name, place and stead, in any and all capacities, in connection with this Annual Report on Form 10-K, to sign any and all amendments to the Form 10-K, and to file the same, with all exhibits thereto, and other documents in connection therewith, with the Securities and Exchange Commission, granting unto said attorneys-in-fact and agents, each acting alone, full power and authority to do and perform each and every act and thing requisite and necessary to be done in and about the premises, as fully to all intents and purposes as he or she might or could do in person, hereby ratifying and confirming all that said attorneys-in-fact and agents, or their substitutes or substitute, may lawfully do or cause to be done by virtue hereof.
Pursuant to the requirements of the Securities Exchange Act of 1934, this report has been signed below by the following persons in the capacities indicated on February 24, 2022.
| /s/KURT SIEVERS | /s/WILLIAM J. BETZ | |||||||
| Kurt Sievers | William J. Betz | |||||||
| Executive Director, President and Chief Executive Officer | Executive Vice President and Chief Financial Officer | |||||||
| (Principal Executive Officer) | (Principal Financial Officer, Principal Accounting Officer) | |||||||
| /s/SIR PETER BONFIELD | /s/ANNETTE CLAYTON | |||||||
| Sir Peter Bonfield | Annette Clayton | |||||||
| Non-executive Director and Chair of the Board | Non-executive Director | |||||||
| /s/ANTHONY FOXX | /s/KENNETH A. GOLDMAN | |||||||
| Anthony Foxx | Kenneth A. Goldman | |||||||
| Non-executive Director | Non-executive Director | |||||||
| /s/JOSEF KAESER | /s/LENA OLVING | |||||||
| Josef Kaeser | Lena Olving | |||||||
| Non-executive Director | Non-executive Director | |||||||
| /s/PETER SMITHAM | /s/JULIE SOUTHERN | |||||||
| Peter Smitham | Julie Southern | |||||||
| Non-executive Director | Non-executive Director | |||||||
| /s/JASMIN STAIBLIN | /s/GREGORY L. SUMME | |||||||
| Jasmin Staiblin | Gregory L. Summe | |||||||
| Non-executive Director | Non-executive Director | |||||||
| /s/KARL-HENRIK SUNDSTRÖM | ||||||||
| Karl-Henrik Sundström | ||||||||
| Non-executive Director |