 filings.tools
NXP Semiconductors 10-Q 2021-10-03
Filed 2021-11-02. 8 sections, 148K characters. Original on sec.gov · Markdown · JSON
Cover and table of contents
UNITED STATES
SECURITIES AND EXCHANGE COMMISSION
Washington, D.C. 20549
FORM 10-Q
(Mark One)
☒ QUARTERLY REPORT PURSUANT TO SECTION 13 OR 15(d) OF THE SECURITIES EXCHANGE ACT OF 1934
For the quarterly period ended October 3, 2021
or
☐ TRANSITION REPORT PURSUANT TO SECTION 13 OR 15(d) OF THE SECURITIES EXCHANGE ACT OF 1934
For the transition period from to .
Commission File Number: 001-34841
NXP Semiconductors N.V.
(Exact name of registrant as specified in its charter)
| Netherlands | 98-1144352 | |||||||
| (State or other jurisdiction of incorporation or organization) | (I.R.S. employer identification number) | |||||||
| 60 High Tech Campus | 5656 AG | |||||||
| Eindhoven | ||||||||
| Netherlands | ||||||||
| (Address of principal executive offices) | (Zip code) |
| +31 | 40 | 2729999 | |||||||||
| (Registrant’s telephone number, including area code) |
Securities registered pursuant to Section 12(b) of the Act:
| Title of each class | Trading symbol(s) | Name of each exchange on which registered | ||||||
| Common shares, EUR 0.20 par value | NXPI | The Nasdaq Global Select Market |
Indicate by check mark whether the Registrant (1) has filed all reports required to be filed by Section 13 or 15(d) of the Securities Exchange Act of 1934 during the preceding 12 months (or for such shorter period that the Registrant was required to file such reports), and (2) has been subject to such filing requirements for the past 90 days.
Yes ☒ No ☐
Indicate by check mark whether the Registrant has submitted electronically every Interactive Data File required to be submitted pursuant to Rule 405 of Regulation S-T (§232.405 of this chapter) during the preceding 12 months (or for such shorter period that the Registrant was required to submit such files).
Yes ☒ No ☐
Indicate by check mark whether the Registrant is a large accelerated filer, an accelerated filer, a non-accelerated filer, a smaller reporting company, or an emerging growth company. See the definitions of “large accelerated filer,” “accelerated filer,” “smaller reporting company,” and “emerging growth company” in Rule 12b-2 of the Exchange Act.
| Large accelerated filer | ☒ | Accelerated filer | ☐ | ||||||||
| Non-accelerated filer | ☐ | Smaller reporting company | ☐ | ||||||||
| Emerging growth company | ☐ |
If an emerging growth company, indicate by check mark if the Registrant has elected not to use the extended transition period for complying with any new or revised financial accounting standards provided pursuant to Section 13(a) of the Exchange Act. ☐
Indicate by check mark whether the Registrant is a shell company (as defined in Rule 12b-2 of the Exchange Act).
Yes ☐ No ☒
As of October 29, 2021, there were 265,933,249 shares of our common stock, €0.20 par value per share, issued and outstanding.
NXP Semiconductors N.V.
Form 10-Q
For the Fiscal Quarter Ended October 3, 2021
TABLE OF CONTENTS
| Page | ||||||||
| Part I | ||||||||
| Item 1. | Financial Statements | 1 | ||||||
| Item 2. | Management’s Discussion and Analysis of Financial Condition and Results of Operations | 15 | ||||||
| Item 3. | Quantitative and Qualitative Disclosures About Market Risk | 25 | ||||||
| Item 4. | Controls and Procedures | 25 | ||||||
| Part II | ||||||||
| Item 1. | Legal Proceedings | 25 | ||||||
| Item 1A. | Risk Factors | 26 | ||||||
| Item 2. | Unregistered Sales of Equity Securities and Use of Proceeds | 26 | ||||||
| Item 5. | Other Information | 26 | ||||||
| Item 6. | Exhibits | 27 |
PART I — FINANCIAL INFORMATION
Item 1. Financial Statements
CONDENSED CONSOLIDATED STATEMENTS OF OPERATIONS (Unaudited)
($ in millions, unless otherwise stated)
| For the three months ended | For the nine months ended | ||||||||||||||||||||||
| October 3, 2021 | September 27, 2020 | October 3, 2021 | September 27, 2020 | ||||||||||||||||||||
| Revenue | 2,861 | 2,267 | 8,024 | 6,105 | |||||||||||||||||||
| Cost of revenue | (1,278) | (1,177) | (3,664) | (3,158) | |||||||||||||||||||
| Gross profit | 1,583 | 1,090 | 4,360 | 2,947 | |||||||||||||||||||
| Research and development | (492) | (438) | (1,429) | (1,265) | |||||||||||||||||||
| Selling, general and administrative | (243) | (203) | (699) | (658) | |||||||||||||||||||
| Amortization of acquisition-related intangible assets | (137) | (418) | (456) | (1,179) | |||||||||||||||||||
| Total operating expenses | (872) | (1,059) | (2,584) | (3,102) | |||||||||||||||||||
| Other income (expense) | — | 1 | — | 110 | |||||||||||||||||||
| Operating income (loss) | 711 | 32 | 1,776 | (45) | |||||||||||||||||||
| Financial income (expense): | |||||||||||||||||||||||
| Other financial income (expense) | (93) | (106) | (280) | (280) | |||||||||||||||||||
| Income (loss) before income taxes | 618 | (74) | 1,496 | (325) | |||||||||||||||||||
| Benefit (provision) for income taxes | (95) | 57 | (200) | 88 | |||||||||||||||||||
| Results relating to equity-accounted investees | 3 | (1) | — | (3) | |||||||||||||||||||
| Net income (loss) | 526 | (18) | 1,296 | (240) | |||||||||||||||||||
| Less: Net income (loss) attributable to non-controlling interests | 7 | 4 | 27 | 17 | |||||||||||||||||||
| Net income (loss) attributable to stockholders | 519 | (22) | 1,269 | (257) | |||||||||||||||||||
| Earnings per share data: | |||||||||||||||||||||||
| Net income (loss) per common share attributable to stockholders in $ | |||||||||||||||||||||||
| Basic | 1.95 | (0.08) | 4.66 | (0.92) | |||||||||||||||||||
| Diluted | 1.91 | (0.08) | 4.57 | (0.92) | |||||||||||||||||||
| Weighted average number of shares of common stock outstanding during the period (in thousands): | |||||||||||||||||||||||
| Basic | 266,557 | 279,467 | 272,314 | 279,511 | |||||||||||||||||||
| Diluted | 271,359 | 279,467 | 277,886 | 279,511 |
See accompanying notes to the Condensed Consolidated Financial Statements
CONDENSED CONSOLIDATED STATEMENTS OF COMPREHENSIVE INCOME
(Unaudited)
($ in millions, unless otherwise stated)
| For the three months ended | For the nine months ended | ||||||||||||||||||||||
| October 3, 2021 | September 27, 2020 | October 3, 2021 | September 27, 2020 | ||||||||||||||||||||
| Net income (loss) | 526 | (18) | 1,296 | (240) | |||||||||||||||||||
| Other comprehensive income (loss), net of tax: | |||||||||||||||||||||||
| Change in fair value cash flow hedges | (2) | 4 | (16) | 5 | |||||||||||||||||||
| Change in foreign currency translation adjustment | (23) | 37 | (56) | 14 | |||||||||||||||||||
| Change in net actuarial gain (loss) | — | (1) | — | (4) | |||||||||||||||||||
| Total other comprehensive income (loss) | (25) | 40 | (72) | 15 | |||||||||||||||||||
| Total comprehensive income (loss) | 501 | 22 | 1,224 | (225) | |||||||||||||||||||
| Less: Comprehensive income (loss) attributable to non-controlling interests | 7 | 4 | 27 | 17 | |||||||||||||||||||
| Total comprehensive income (loss) attributable to stockholders | 494 | 18 | 1,197 | (242) |
See accompanying notes to the Condensed Consolidated Financial Statements
CONDENSED CONSOLIDATED BALANCE SHEETS (Unaudited)
($ in millions, unless otherwise stated)
| October 3, 2021 | December 31, 2020 | |||||||||||||
| ASSETS | ||||||||||||||
| Current assets: | ||||||||||||||
| Cash and cash equivalents | 2,303 | 2,275 | ||||||||||||
| Accounts receivable, net | 979 | 765 | ||||||||||||
| Inventories, net | 1,173 | 1,030 | ||||||||||||
| Other current assets | 266 | 254 | ||||||||||||
| Total current assets | 4,721 | 4,324 | ||||||||||||
| Non-current assets: | ||||||||||||||
| Other non-current assets | 1,070 | 1,013 | ||||||||||||
| Property, plant and equipment, net of accumulated depreciation of $4,565 and $4,237 | 2,510 | 2,284 | ||||||||||||
| Identified intangible assets, net of accumulated amortization of $7,441 and $7,007 | 1,741 | 2,242 | ||||||||||||
| Goodwill | 9,968 | 9,984 | ||||||||||||
| Total non-current assets | 15,289 | 15,523 | ||||||||||||
| Total assets | 20,010 | 19,847 | ||||||||||||
| LIABILITIES AND EQUITY | ||||||||||||||
| Current liabilities: | ||||||||||||||
| Accounts payable | 1,140 | 991 | ||||||||||||
| Restructuring liabilities-current | 30 | 60 | ||||||||||||
| Other current liabilities | 1,269 | 966 | ||||||||||||
Showing the first 8K of 73K characters. Open the full section
Item 2. Management’s Discussion and Analysis of Financial Condition and Results of Operations
This interim Management’s Discussion and Analysis ("MD&A") should be read in conjunction with our consolidated financial statements and notes and the MD&A in our Annual Report on Form 10-K for the year ended December 31, 2020. This discussion contains forward-looking statements that involve a number of risks and uncertainties, including any statements that refer to projections of our future financial performance, our anticipated growth and trends in our businesses, uncertain events or assumptions, and other characterizations of future events or circumstances, including our response to the current global pandemic and the potential impact the pandemic will have on our operations, liquidity, customers, facilities and supply chain. Such statements are based on our current expectations and could be affected by the uncertainties and risk factors described throughout this filing, and in “Risk Factors” in Part I, Item 1A of our Annual Report on Form 10-K. Our actual results may differ materially from those contained in any forward-looking statements. We undertake no obligation to update any forward-looking statement to reflect subsequent events or circumstances.
Our MD&A is provided in addition to the accompanying consolidated financial statements and notes to assist readers in understanding our results of operations, financial condition and cash flows. MD&A is organized as follows:
-
Overview - Overall analysis of financial and other highlights to provide context for the MD&A
-
Results of Operations - An analysis of our financial results
-
Liquidity and Capital Resources - An analysis of changes in our balance sheets and cash flows
-
Contractual Obligations - An update on contractual obligations as of December 31, 2020
-
Off-balance Sheet Arrangements - An update on off-balance sheet arrangements as of December 31, 2020
Overview
| ($ in millions, unless otherwise stated) | Q3 2021 | Q3 2020 | YTD 2021 | YTD 2020 | |||||||||||||||||||||||||||||||||||||||||||
| Revenue | 2,861 | 2,267 | 8,024 | 6,105 | |||||||||||||||||||||||||||||||||||||||||||
| Gross profit | 1,583 | 1,090 | 4,360 | 2,947 | |||||||||||||||||||||||||||||||||||||||||||
| Operating income (loss) | 711 | 32 | 1,776 | (45) | |||||||||||||||||||||||||||||||||||||||||||
| Cash flow from operating activities | 924 | 527 | 2,292 | 1,453 | |||||||||||||||||||||||||||||||||||||||||||
| Total debt | 9,593 | 9,356 | 9,593 | 9,356 | |||||||||||||||||||||||||||||||||||||||||||
| Net debt | 7,290 | 5,790 | 7,290 | 5,790 | |||||||||||||||||||||||||||||||||||||||||||
| Diluted weighted average number of shares outstanding | 271,359 | 279,467 | 277,886 | 279,511 | |||||||||||||||||||||||||||||||||||||||||||
| Diluted net income per share | 1.91 | (0.08) | 4.57 | (0.92) | |||||||||||||||||||||||||||||||||||||||||||
| Dividends per common share | 0.5625 | 0.375 | 1.6875 | 1.125 |
Q3 2021 compared to Q3 2020
Revenue for the three months ended October 3, 2021 was $2,861 million compared to $2,267 million for the three months ended September 27, 2020, an increase of $594 million or an increase of 26.2% year-on-year. Revenue in the third quarter of 2021 represented a historical record for NXP, which is consistent with the trend seen in the second quarter of 2021. The continued strong revenue growth is primarily due to industry-wide growth in our end-markets as they continue to rebound from the initial shock and widespread market disruption caused by the emergence of the COVID-19 pandemic in the first half of 2020. Growth within the automotive end-market was driven by increased demand across our entire automotive portfolio from our distribution partners and demand from automotive customers to support the secular shift of electrification, advanced driver safety and assistance, and driver connectivity systems. This growth in the automotive end-market and strong demand in the Industrial & IoT end-market helped to drive the increased year-on-year performance.
Our gross profit percentage for the third quarter of 2021 increased from 48.1% in the third quarter of 2020 to 55.3%, primarily from the continued significant acceleration of revenue in the third quarter of 2021 compared to the same period in 2020, which led to improved loading, cost reductions and efficiencies, partly offset by higher personnel-related costs.
We continue to generate strong operating cash flows, with $924 million in cash flows from operations for the third quarter of 2021. We returned $1,309 million to our shareholders during the third quarter of 2021. Our cash position at the end of the third quarter of 2021 was $2,303 million. On August 26, 2021, the NXP Board of Directors approved a cash dividend of $0.5625 per common share for the third quarter of 2021.
YTD 2021 compared to YTD 2020
Revenue for the nine months ended October 3, 2021 was $8,024 million compared to $6,105 million for the nine months ended September 27, 2020, an increase of $1,919 million or an increase of 31.4%. Revenue in the first nine months of 2021 represented a historical record for NXP. The YTD 2021 growth compared to YTD 2020 was a result of the industry-wide growth after the initial shock and widespread disruption caused by the emergence of the COVID-19 pandemic, combined with company specific content growth in the automotive end-market as the automotive customers focus on secular shift due electrification, advanced driver safety and assistance, and driver connectivity. Additionally, strong performance in the Industrial & IoT and Mobile end-markets helped to underpin the year-on-year performance. The rebound in NXP’s revenue growth began to clearly emerge at the end of the calendar third quarter of 2020, and has continued to accelerate through the third quarter of 2021.
Our gross profit percentage for the nine months ended October 3, 2021 increased from 48.3% for the nine months ended September 27, 2020 to 54.3%, primarily from the significant acceleration of revenue in 2021 after the Covid crisis, and as such, improved loading and manufacturing efficiencies offset by higher personnel-related cost and a less favorable product mix.
Cash flow from operations for the first nine months of 2021 was $2,292 million. Total shareholder return for the first nine months of 2021 was $3,677 million. Our cash position remains solid, with the net proceeds of the $2 billion in Q2 2021 issued debt adding to our cash and cash equivalents.
Results of operations
The following table presents operating income for each of the three and nine month periods ended October 3, 2021 and September 27, 2020, respectively:
| ($ in millions, unless otherwise stated) | Q3 2021 | Q3 2020 | YTD 2021 | YTD 2020 | |||||||||||||||||||||||||||||||||||||||||||
| Revenue | 2,861 | 2,267 | 8,024 | 6,105 | |||||||||||||||||||||||||||||||||||||||||||
| % nominal growth | 26.2 | 0.1 | 31.4 | (7.2) | |||||||||||||||||||||||||||||||||||||||||||
| Gross profit | 1,583 | 1,090 | 4,360 | 2,947 | |||||||||||||||||||||||||||||||||||||||||||
| Research and development | (492) | (438) | (1,429) | (1,265) | |||||||||||||||||||||||||||||||||||||||||||
| Selling, general and administrative | (243) | (203) | (699) | (658) | |||||||||||||||||||||||||||||||||||||||||||
| Amortization of acquisition-related intangible assets | (137) | (418) | (456) | (1,179) | |||||||||||||||||||||||||||||||||||||||||||
| Other income (expense) | — | 1 | — | 110 | |||||||||||||||||||||||||||||||||||||||||||
| Operating income (loss) | 711 | 32 | 1,776 | (45) |
Revenue
Q3 2021 compared to Q3 2020
Revenue for the three months ended October 3, 2021 was $2,861 million compared to $2,267 million for the three months ended September 27, 2020, an increase of $594 million or an increase of 26.2% year-on-year. Revenue in the third quarter of 2021 represented a historical record for NXP. The continued strong revenue growth was a result of industry-wide growth as NXP began to recover in the year ago period from the challenging economic environment as a result of the COVID-19 pandemic. Growth within the automotive end-market was driven by increased demand across our entire automotive portfolio from our distribution partners and demand from automotive customers to support the secular shift of electrification, advanced driver safety and assistance, and driver connectivity systems. This growth in the automotive end-market and strong demand in the Industrial & IoT market helped to drive the increased year-on-year performance.
By end-market; revenue within Automotive was $1,455 million, an increase of 50.9% versus the year ago period. Within Industrial & IoT, revenue was $607 million, an increase of 18.1% versus the third quarter of 2020. In Mobile, revenue was $345 million, an increase of 2.4% versus the year ago period, and within Communications Infrastructure & Other, revenue was $454 million, an increase of 0.4% versus the year ago period. When aggregating all end-markets together, and reviewing sales channel performance, business transacted through NXP's third party distribution partners, which primarily services the long-tail, mass market, was $1,631 million, an increase of 31.2%. Sales to NXP's direct OEM and EMS customers was $1,191 million, an increase of 21.2% versus the third quarter of 2020. Revenue increased across all regions.
YTD 2021 compared to YTD 2020
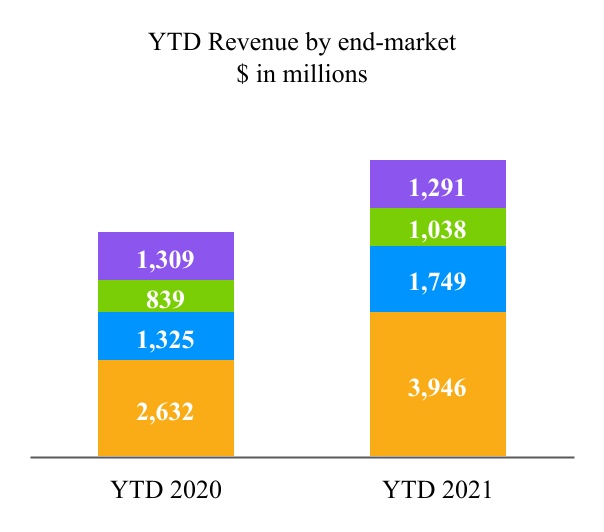
Revenue for the nine months ended October 3, 2021 was $8,024 million compared to $6,105 million for the nine months ended September 27, 2020, an increase of $1,919 million or an increase of 31.4%. Revenue in the first nine months of 2021 represented a historical record for NXP. The YTD 2021 growth compared to YTD 2020 was a result of the industry-wide growth from the continued demand in a supply constrained economic environment in 2021, while 2020 was negatively impacted by the challenging economic environment as a result of the COVID-19 pandemic. This combined with company specific content growth in the automotive end-market as the automotive customers focus on secular shift due electrification, advanced driver safety and assistance, and driver connectivity, and strong demand in the Industrial & IoT and Mobile markets helped to drive the growth in the year to date performance. The rebound in NXP’s revenue growth began to clearly emerge at the end of the calendar third quarter of 2020, and has continued to accelerate through the third quarter of 2021. Revenue increased in all regions.
Revenue by end-market was as follows:
| ($ in millions, unless otherwise stated) | Q3 2021 | Q3 2020 | Change | YTD 2021 | YTD 2020 | Change | |||||||||||||||||||||||||||||||||||||||||||||||
| Automotive | 1,455 | 964 | 50.9 | % | 3,946 | 2,632 | 49.9 | % | |||||||||||||||||||||||||||||||||||||||||||||
| Industrial & IoT | 607 | 514 | 18.1 | % | 1,749 | 1,325 | 32.0 | % | |||||||||||||||||||||||||||||||||||||||||||||
| Mobile | 345 | 337 | 2.4 | % | 1,038 | 839 | 23.7 | % | |||||||||||||||||||||||||||||||||||||||||||||
| Communication Infrastructure & Other | 454 | 452 | 0.4 | % | 1,291 | 1,309 | (1.4) | % | |||||||||||||||||||||||||||||||||||||||||||||
| Revenue | 2,861 | 2,267 | 26.2 | % | 8,024 | 6,105 | 31.4 | % |
Revenue by sales channel was as follows:
| ($ in millions, unless otherwise stated) | Q3 2021 | Q3 2020 | Change | YTD 2021 | YTD 2020 | Change | |||||||||||||||||||||||||||||||||||||||||||||||
| Distributors | 1,631 | 1,243 | 31.2 | % | 4,617 | 3,286 | 40.5 | % | |||||||||||||||||||||||||||||||||||||||||||||
| OEM/EMS | 1,191 | 983 | 21.2 | % | 3,295 | 2,695 | 22.3 | % | |||||||||||||||||||||||||||||||||||||||||||||
| Other | 39 | 41 | (4.9) | % | 112 | 124 | (9.7) | % | |||||||||||||||||||||||||||||||||||||||||||||
| Revenue | 2,861 | 2,267 | 26.2 | % | 8,024 | 6,105 | 31.4 | % |
Revenue by geographic region, which is based on the customer’s shipped-to location was as follows:
| ($ in millions, unless otherwise stated) | Q3 2021 | Q3 2020 | Change | YTD 2021 | YTD 2020 | Change | |||||||||||||||||||||||||||||||||||||||||||||||
| Greater China and Asia Pacific | 1,653 | 1,404 | 17.7 | % | 4,638 | 3,637 | 27.5 | % | |||||||||||||||||||||||||||||||||||||||||||||
| EMEA (Europe, the Middle East and Africa) | 536 | 383 | 39.9 | % | 1,464 | 1,089 | 34.4 | % | |||||||||||||||||||||||||||||||||||||||||||||
| Americas | 346 | 264 | 31.1 | % | 1,003 | 685 | 46.4 | % | |||||||||||||||||||||||||||||||||||||||||||||
| Japan | 210 | 142 | 47.9 | % | 587 | 458 | 28.2 | % | |||||||||||||||||||||||||||||||||||||||||||||
| South Korea | 116 | 74 | 56.8 | % | 332 | 236 | 40.7 | % | |||||||||||||||||||||||||||||||||||||||||||||
| Revenue | 2,861 | 2,267 | 26.2 | % | 8,024 | 6,105 | 31.4 | % |

| n | Automotive | n | Mobile | |||||||||||
| n | Industrial IoT | n | Comm Infra & Other |


| n | Distributors | n | Other | |||||||||||
| n | OEM/EMS |
Q3 2021 compared to Q3 2020
Revenue for the three months ended October 3, 2021 was $2,861 million compared to $2,267 million for the three months ended September 27, 2020, an increase of $594 million or an increase of 26.2% year-on-year. The increase within the third quarter is attributed to the continued recovery from the Covid pandemic in the same period a year ago and strengthening demand, across NXP’s Automotive, Industrial IoT, and Mobile end-markets, while the demand in the Communications Infrastructure & Other end-market stayed flat.
NXP’s revenue to distributors and direct OEM and EMS customers was $1,631 million and $1,191 million, respectively, representing increases of 31.2% and 21.2% versus the third quarter of 2020. Revenue increased across all regions.
Revenue from the Automotive end-market was $1,455 million, an increase of $491 million or 50.9% year-on-year. Within Automotive, customers are focused on the key functional pillars of safety, electrification and improved driver comfort to accelerate competitive differentiation. These broad functional areas are fundamentally enabled by the secular adoption of new and increased levels of semiconductor content, which is layered on top of a strong base of existing electronic content in modern automobiles. Furthermore, the increase in Automotive revenue during the third quarter of 2021 can be partially attributed to the ongoing recovery from the impacts of the COVID-19 pandemic, which began to rebound in the third quarter of 2020.
Revenue from the Industrial & IoT end-market was $607 million, an increase of $93 million or 18.1% year-on-year. The Industrial & IoT market is driven by the secular trend of multi-market OEMs seeking to enable secure, connected, high performance processing solutions at the edge of the network, whether it is in factory automation, smart building/smart home or the exploding plethora of connected IoT devices. The innovation in this market is being driven by thousands of relatively smaller customers, which NXP effectively services through its extended global distribution channel. During the third quarter of 2021, the year-on-year increase was driven by the continued growth in demand of NXP’s high performance industrial application processors, hybrid multi-core crossover processors, and low-power embedded microcontrollers, in addition to strong demand for the company’s analog high-speed interface devices and system security solutions.
Revenue from the Mobile end-market was $345 million with an increase of $8 million or 2.4% year-on-year. The year-on-year increase was driven by the continued strong adoption of secure mobile wallet solutions and the increased demand for embedded power solutions, which were offset by declines in our semi-custom secure interfaces sold to a premium handset customer. Our mobile customers are primarily serviced through our global distribution channels.
Revenue in the Communication Infrastructure and Other end-market was $454 million, an increase of $2 million or 0.4% year-on-year. The Communication Infrastructure and Other end-market is an amalgamation of three separate product portfolios, which service multiple markets, including cellular base stations; the network edge equipment, and the secure access, transit and government sponsored identification market. The increased demand for our secure identification, tagging, and access products, as well as access point connectivity solutions outweighed the year-on-year decline in demand for multi-core processors within the mass market for network edge solutions, as well as reduced revenue for smart RF antenna solutions within our cellular base station portfolio.
YTD 2021 compared to YTD 2020
Revenue for the nine months ended October 3, 2021 was $8,024 million compared to $6,105 for the nine months ended September 27, 2020, an increase of $1,919 million or an increase of 31.4%. The revenue level in the first nine months of 2021 represented a historical record for NXP. The YTD 2021 growth compared to YTD 2020 was a result of the industry-wide growth resulting from the continued demand in a supply constraint driven economic environment in 2021, while 2020 was negatively impacted by the challenging economic environment as a
result of the COVID-19 pandemic. This combined with company specific content growth in the automotive end-market as the automotive customers focus on secular shift due electrification, advanced driver safety and assistance, and driver connectivity, and strong demand in the Industrial & IoT and Mobile markets helped to drive the growth in the year-to-date performance, while Communications Infrastructure & Other remained flat. The rebound in NXP’s revenue growth began to clearly emerge at the end of the calendar third quarter of 2020 and has continued to accelerate through the third quarter of 2021.
NXP’s revenue to distributors and direct OEM and EMS customers was $4,617 million and $3,295 million, respectively, representing increases of 40.5% and 22.3% versus nine months ended of 2020. Revenue increased across all regions.
Revenue from the Automotive end-market was $3,946 million, an increase of $1,314 million or 49.9% from $2,632 million for the nine months ended September 27, 2020. The increase was due to increases across the entire automotive end-market product portfolio. From a channel perspective, the year-to-date increase was due to increased demand from the Company’s distribution partners and direct automotive customers.
Revenue from the Industrial & IoT end-market was $1,749 million for the nine months ended October 3, 2021, an increase of $424 million or 32.0%. The year-to-date- increase comparable to the nine months ended a year ago was driven by the continued strong adoption of NXP's high performance industrial application processors, hybrid multi-core crossover processors, and low-power embedded microcontrollers, and analog high-speed interface devices and system security solutions.
Revenue from the Mobile end-market, revenue was $1,038 million for the nine months ended October 3, 2021, an increase of $199 million or 23.7%. The YTD 2021 increase compared to the YTD 2020 was driven primarily by the continued adoption of secure mobile wallet solutions, and to a lesser degree increased demand for embedded mobile power solutions. The year-to-date increase comparison was modestly offset by the divestment of the Voice and Audio Solutions, which closed early in the first quarter of 2020. Our mobile customers are primarily serviced through our global distribution channels.
Revenue in the Communication Infrastructure and Other end-market was $1,291 million for the nine months ended October 3, 2021, declined $18 million or 1.4% year-to-date. The YTD 2021 decline compared to the YTD 2020 was due to a combination of reduced demand for multi-core processors within the mass market for network edge solutions, as well as reduced revenue for smart antenna solutions. This was offset by increased demand for our secure identification, tagging, and access products, as well as access point connectivity solutions.
Gross profit
Q3 2021 compared to Q3 2020
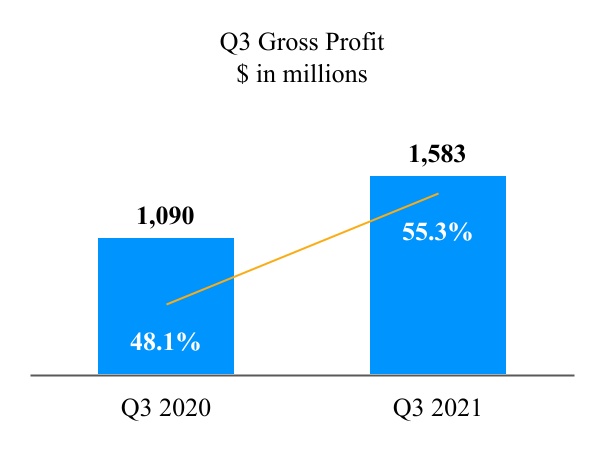
Gross profit for the three months ended October 3, 2021 was $1,583 million, or 55.3% of revenue, compared to $1,090 million, or 48.1% of revenue for the three months ended September 27, 2020. The increase of $493 million was driven by higher revenue as a result of accelerating demand and as such, improved loading and manufacturing efficiencies, partly offset by higher personnel-related costs, including variable compensation cost.
YTD 2021 compared to YTD 2020
Gross profit for the nine months ended October 3, 2021 was $4,360 million, or 54.3% of revenue, compared to $2,947 million, or 48.3% of revenue for the nine months ended September 27, 2020. The increase of $1,413 million was primarily driven by the significant higher revenue in the first nine months of 2021 compared to the first nine months of 2020 which is the result of accelerating demand and as such, improved loading and manufacturing efficiencies offset by higher personnel-related cost, including variable compensation cost, and a less favorable product mix.

Operating expenses
Q3 2021 compared to Q3 2020
Operating expenses for the three months ended October 3, 2021 totaled $872 million, or 30.5% of revenue, compared to $1,059 million, or 46.7% of revenue, for the three months ended September 27, 2020.
YTD 2021 compared to YTD 2020
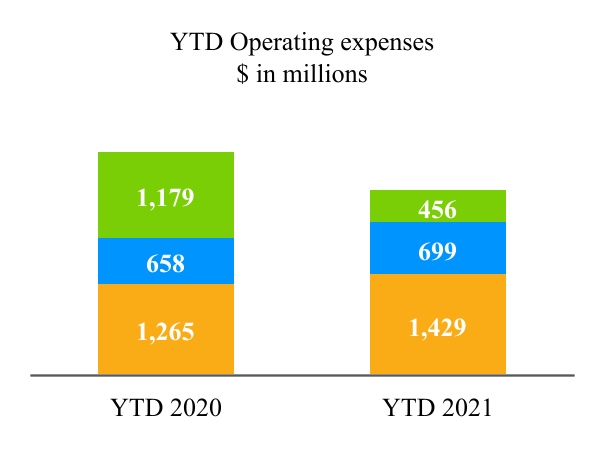
Operating expenses for the nine months ended October 3, 2021 totaled $2,584 million, or 32.2% of revenue, compared to $3,102 million, or 50.8% of revenue, for the nine months ended September 27, 2020.
The following table below presents the composition of operating expenses by line item in the statement of operations:
| ($ in millions, unless otherwise stated) | Q3 2021 | Q3 2020 | YTD 2021 | YTD 2020 | |||||||||||||||||||||||||||||||||||||||||||
| Research and development | 492 | 438 | 1,429 | 1,265 | |||||||||||||||||||||||||||||||||||||||||||
| Selling, general and administrative | 243 | 203 | 699 | 658 | |||||||||||||||||||||||||||||||||||||||||||
| Amortization of acquisition-related intangible assets | 137 | 418 | 456 | 1,179 | |||||||||||||||||||||||||||||||||||||||||||
| Total operating expenses | 872 | 1,059 | 2,584 | 3,102 |

| n | R&D | n | SG&A | n | Amortization acquisition-related |
Q3 2021 compared to Q3 2020
The decrease in operating expenses was a result of the following items:
Research and development (R&D) costs primarily consist of engineer salaries and wages (including share based compensation and other variable compensation), engineering related costs (including outside services, fixed-asset, IP and other licenses related costs), shared service center costs and other pre-production related expenses. R&D costs for the three months ended October 3, 2021 increased by $54 million, or 12.3%, when compared to the three months ended September 27, 2020 driven by:
+ higher personnel-related costs, including variable compensation costs; and
- lower restructuring costs.
Selling, general and administrative (SG&A) costs primarily consist of personnel salaries and wages (including share based compensation and other variable compensation), communication and IT related costs, fixed-asset related costs and sales and marketing costs (including travel expenses). SG&A costs for the three months ended October 3, 2021 increased by $40 million, or 19.7%, when compared to the three months ended September 27, 2020 mainly due to:
+ higher personnel-related costs, including variable compensation costs.
Amortization of acquisition-related intangible assets decreased by $281 million, or 67.2%, when compared to the three months ended September 27, 2020 driven by:
- certain intangibles became fully amortized during 2020.
YTD 2021 compared to YTD 2020
The decrease in operating expenses was a result of the following items:
Research and development (R&D) costs primarily consist of engineer salaries and wages (including share based compensation and other variable compensation), engineering related costs (including outside services, fixed-asset, IP and other licenses related costs), shared service center costs and other pre-production related expenses. R&D costs for the nine months ended October 3, 2021 increased by $164 million, or 13.0%, when compared to the nine months ended September 27, 2020 driven by:
+ higher personnel-related costs, including variable compensation costs;
- higher subsidies, offsetting research and development costs; and
- lower restructuring costs.
Selling, general and administrative (SG&A) costs primarily consist of personnel salaries and wages (including share based compensation and other variable compensation), communication and IT related costs, fixed-asset related costs and sales and marketing costs (including travel expenses). SG&A costs for the nine months ended October 3, 2021 increased with $41 million, or 6.2%, when compared to the nine months ended September 27, 2020 mainly due to:
+ higher personnel-related costs, including variable compensation costs; and
- lower share-based compensation expenses as a result of the CEO transition in 2020.
Amortization of acquisition-related intangible assets decreased by $723 million, or 61.3%, when compared to the nine months ended September 27, 2020 driven by:
- certain intangibles became fully amortized during 2020.
Other income (expense)
Income and expenses derived from manufacturing service arrangements (“MSA”) and transitional service arrangements (“TSA”) that are put into place when we divest a business or activity, are included in other income (expense). These arrangements are short-term in nature and are expected to decrease as the divested business or activity becomes more established.
The following table presents the split of other income (expense) for each of the three and nine month periods ended October 3, 2021 and September 27, 2020:
| ($ in millions) | Q3 2021 | Q3 2020 | YTD 2021 | YTD 2020 | |||||||||||||||||||||||||||||||
| Result from MSA and TSA arrangements | 1 | — | (1) | (1) | |||||||||||||||||||||||||||||||
| Other, net | (1) | 1 | 1 | 111 | |||||||||||||||||||||||||||||||
| Total | — | 1 | — | 110 |
Q3 2021 compared to Q3 2020
Other income (expense) reflects nil for the three month period ended October 3, 2021 and an income of $1 million for the three month period ended September 27, 2020.
YTD 2021 compared to YTD 2020
Other income (expense) reflects nil for the nine month period ended October 3, 2021, compared to an income of $110 million for the nine month period ended September 27, 2020. Included in 2020 is $110 million relating to the net gain on the sale of the Voice and Audio Solutions (VAS) assets.
Financial income (expense)
The following table presents the details of financial income and expenses:
| ($ in millions, unless otherwise stated) | Q3 2021 | Q3 2020 | YTD 2021 | YTD 2020 | |||||||||||||||||||||||||||||||||||||||||||
| Interest income | 1 | 3 | 3 | 11 | |||||||||||||||||||||||||||||||||||||||||||
| Interest expense | (96) | (100) | (273) | (276) | |||||||||||||||||||||||||||||||||||||||||||
| Total interest expense, net | (95) | (97) | (270) | (265) | |||||||||||||||||||||||||||||||||||||||||||
| Foreign exchange rate results | 3 | (5) | 3 | (6) | |||||||||||||||||||||||||||||||||||||||||||
| Miscellaneous financing costs/income and other, net | (1) | (4) | (13) | (9) | |||||||||||||||||||||||||||||||||||||||||||
| Total other financial income (expense) | 2 | (9) | (10) | (15) | |||||||||||||||||||||||||||||||||||||||||||
| Total | (93) | (106) | (280) | (280) |
Q3 2021 compared to Q3 2020
Financial income (expense) was an expense of $93 million in the third quarter of 2021 compared to an expense of $106 million in the third quarter of 2020. The change in financial income (expense) is primarily attributable to fair value adjustments in equity-accounted investees ($3 million), a decrease in interest expense ($4 million) as a result of refinancing activities, a decrease in interest income ($2 million) as a result of declining interest rates and favorable foreign exchange results ($8 million).
YTD 2021 compared to YTD 2020
Financial income (expense) was an expense of $280 million in the first nine months of 2021 compared to an expense of $280 million in the first nine months of 2020. The change in financial income (expense) is primarily attributable to a decrease in interest expense ($3 million) as a result of refinancing activities, favorable foreign exchange results ($9 million), offset by a decrease in interest income ($8 million) as a result of declining interest rates and an increase of non-service pension cost ($4 million).
Benefit (provision) for income taxes
Q3 2021 compared to Q3 2020
Our provision for income taxes was $95 million (15.4% effective tax rate) for the third quarter of 2021 compared to a benefit from income taxes of ($57 million) (77.0% effective tax rate) for the third quarter of 2020. The increase in the income tax expense was due to higher income before income taxes and due to the changes in certain estimates, offset by an increase in tax incentives as a result of the improved operational performance of the company.
YTD 2021 compared to YTD 2020
Our provision for income taxes for the first nine months of 2021 was $200 million (13.4% effective tax rate) compared to a benefit from income taxes of ($88 million) (27.1% effective tax rate) for the first nine months of 2020. The increase in the income tax expense was due to higher income before income taxes, offset by the net change in the valuation allowance between the two periods and an increase in tax incentives (both as a result of the improved operational performance of the company).
Net income (loss)
The following table presents the composition of net income for the periods reported:
| ($ in millions, unless otherwise stated) | Q3 2021 | Q3 2020 | YTD 2021 | YTD 2020 | |||||||||||||||||||||||||||||||||||||||||||
| Operating income (loss) | 711 | 32 | 1,776 | (45) | |||||||||||||||||||||||||||||||||||||||||||
| Financial income (expense) | (93) | (106) | (280) | (280) | |||||||||||||||||||||||||||||||||||||||||||
| Benefit (provision) for income taxes | (95) | 57 | (200) | 88 | |||||||||||||||||||||||||||||||||||||||||||
| Results relating to equity-accounted investees | 3 | (1) | — | (3) | |||||||||||||||||||||||||||||||||||||||||||
| Net income (loss) | 526 | (18) | 1,296 | (240) |
Liquidity and Capital Resources
We derive our liquidity and capital resources primarily from our cash flows from operations. We continue to generate strong positive operating cash flows. At the end of the third quarter of 2021, our cash balance was $2,303 million, an increase of $28 million compared to December 31, 2020. Taking into account the available amount of the Unsecured Revolving Credit Facility of $1,500 million, we had access to $3,803 million of liquidity as of October 3, 2021.
We currently use cash to fund operations, meet working capital requirements, for capital expenditures and for potential common stock repurchases, dividends and strategic investments. Based on past performance and current expectations, we believe that our current available sources of funds (including cash and cash equivalents, RCF Agreement, plus anticipated cash generated from operations) will be adequate to finance our operations, working capital requirements, capital expenditures and potential dividends for at least the next twelve months. Our capital expenditures were $501 million in the first nine months of 2021, compared to $288 million in the first nine months of 2020. During the nine month period ended October 3, 2021, we repurchased $3,265 million, or 17 million shares of our common stock pursuant to our share buyback programs at a weighted average price of $192.17 per share.
Our total debt amounted to $9,593 million as of Q3 2021, an increase of $1,984 million compared to December 31, 2020 ($7,609 million). Of this, short-term debt amounted to $999 million as of Q3 2021, compared to no short-term debt at December 31, 2020. On May 11, 2021, NXP issued 2.5% senior notes due in 2031 ($1 billion) and 3.25% senior notes due in 2041 ($1 billion).
At October 3, 2021, our cash balance was $2,303 million of which $217 million was held by SSMC, our consolidated joint venture company with TSMC. Under the terms of our joint venture agreement with TSMC, a portion of this cash can be distributed by way of a dividend to us, but 38.8% of the dividend will be paid to our joint venture partner. During the first nine months of 2021, no dividend was declared by SSMC. In 2020, $90 million has been declared by SSMC, which was distributed in the third quarter of 2020, with 38.8% being paid to our joint venture partner.
Cash flows
Our cash and cash equivalents during the first nine months of 2021 decreased by $34 million (excluding the effect of changes in exchange rates on our cash position of $(6) million) as follows:
| ($ in millions, unless otherwise stated) | YTD 2021 | YTD 2020 | |||||||||
| Net cash provided by (used for) operating activities | 2,292 | 1,453 | |||||||||
| Net cash (used for) provided by investing activities | (618) | (255) | |||||||||
| Net cash provided by (used for) financing activities | (1,640) | 1,330 | |||||||||
| Increase (decrease) in cash and cash equivalents | 34 | 2,528 |
Cash Flow from Operating Activities
For the first nine months of 2021 our operating activities provided $2,292 million in cash. This was primarily the result of net income of $1,296 million, adjustments to reconcile the net income of $1,227 million and changes in operating assets and liabilities of ($221) million. Adjustments to net income (loss) includes offsetting non-cash items, such as depreciation and amortization of $952 million, share-based compensation of $265 million and changes in deferred taxes of $6 million.
The change in operating assets and liabilities (working capital accounts) was attributable to the following:
The $214 million increase in receivables and other current assets was primarily driven by the increase in accounts receivable due to the linearity of revenue between the two periods, customer mix, and the related timing of cash collections in the first nine months of 2021 compared with the same period in 2020.
The $143 million increase in inventories was primarily related to increased production levels in order to attempt to align inventory on hand with the current revenue forecasts.
The $242 million increase in accounts payable and other liabilities for the nine months ended October 3, 2021 was primarily related to the increase in the accrual for variable compensation of $227 million as a result of improved operating results, $149 million in trade accounts payable as a result of increased demand, and $46 million in interest payable due to timing of interest payments; partially offset by the decrease of $14 million in lease liabilities, $37 million related to income and social tax payables, a $32 million reduction in restructuring liabilities, $24 million in personnel-related costs, all due to timing of payments, and $73 million of other net movements including the non-cash adjustment for capital expenditures and purchased IP.
For the first nine months of 2020 our operating activities provided $1,453 million in cash. This was primarily the result of net loss of ($240) million, adjustments to reconcile the net loss of $1,591 million and changes in operating assets and liabilities of $98 million. Adjustments to net loss includes offsetting non-cash items, such as depreciation and amortization of $1,672 million, share-based compensation of $295 million, amortization of the discount (premium) on debt and debt issuance costs of $6 million, a gain on sale of assets of ($111) million, results relating to equity-accounted investees of $3 million and changes in deferred taxes of ($274) million.
Cash Flow from Investing Activities
Net cash used for investing activities amounted to $618 million for the first nine months of 2021 and principally consisted of the cash outflows for capital expenditures of $501 million, $99 million for the purchase of identified intangible assets, $14 million for the purchase of equipment leased to others, $17 million for the net purchase of interests of businesses, partly offset by $7 million of insurance recoveries received for equipment damage and net proceeds of $6 million related to sales and purchases of investments.
Net cash used for investing activities amounted to $255 million for the first nine months of 2020 and principally consisted of the cash outflows for purchases of interests in businesses (net of cash) of $21 million, purchase of investments of $15 million, capital expenditures of $288 million and $95 million for the purchase of identified intangible assets, partly offset by proceeds of $161 million from the sale of businesses (net of cash), related to the the sale of our Voice and Audio Solutions assets.
Cash Flow from Financing Activities
Net cash used for financing activities was $1,640 million for the first nine months of 2021 compared to net cash provided by financing activities of $1,330 million for the first nine months of 2020, detailed in the table below:
| ($ in millions) | YTD 2021 | YTD 2020 | |||||||||
| Proceeds from the issuance of long-term debt | 2,000 | 2,000 | |||||||||
| Cash paid for debt issuance costs | (22) | (15) | |||||||||
| Dividends paid to non-controlling interests | — | (34) | |||||||||
| Dividends paid to common stockholders | (412) | (315) | |||||||||
| Cash proceeds from exercise of stock options and savings from ESPP | 60 | 64 | |||||||||
| Purchase of treasury shares | (3,265) | (370) | |||||||||
| Other, net | (1) | — | |||||||||
Contractual Obligations
The Company maintains purchase commitments with certain suppliers, primarily for raw materials, semi-finished goods and manufacturing services and for some non-production items. As of October 3, 2021, the Company had purchase commitments of $4,364 million, which are due through 2044.
| ($ in millions) | Total | 2021 | 2022 | 2023 | 2024 | 2025 | 2026 and thereafter | |||||||||||||||||||
| Long-term purchase obligations | 4,364 | 467 | 1,114 | 729 | 590 | 580 | 884 |
Our long-term obligations increased substantially as we locked in long-term supply with our key manufacturing partners.
Off-balance Sheet Arrangements
At the end of the third quarter of 2021, we had no off-balance sheet arrangements other than commitments resulting from normal business operations. None of these arrangements has or is likely to have a material effect on our financial condition, results of operations or cash flows.
Item 3. Quantitative and Qualitative Disclosures About Market Risk
There have been no material changes to the Company’s market risk during the first nine months of 2021. For a discussion of the Company’s exposure to market risk, refer to the Company’s market risk disclosures set forth in Part II, Item 7A, “Quantitative and Qualitative Disclosures About Market Risk” in our Annual Report on Form 10-K for the year ended December 31, 2020.
Item 4. Controls and Procedures
Evaluation of Disclosure Controls and Procedures
Our management, with the participation of the Chief Executive Officer and Chief Financial Officer (Certifying Officers), evaluated the effectiveness of the Company's disclosure controls and procedures (as defined in Rules 13a-15(e) or 15d-15(e) promulgated under the Securities Exchange Act of 1934, as amended) on October 3, 2021. Based on that evaluation, the Certifying Officers concluded the Company's disclosure controls and procedures were effective as of October 3, 2021.
Changes in Internal Control Over Financial Reporting
There were no changes in the Company's internal control over financial reporting during the three month period ended October 3, 2021, which were identified in connection with management's evaluation required by paragraph (d) of Rules 13a-15 and 15d-15 under the Exchange Act that have materially affected, or are reasonably likely to materially affect, our internal control over financial reporting.
PART II — OTHER INFORMATION
Item 1. Legal Proceedings
Not applicable.
Item 1A. Risk Factors
There have been no material changes from the risk factors previously disclosed in our Annual Report on Form 10-K for the year ended December 31, 2020.
Item 2. Unregistered Sales of Equity Securities and Use of Proceeds
Purchases of Equity Securities by the Issuer and Affiliated Purchasers
In August 2021, the board of directors of NXP (the “Board”) approved a $2 billion expansion of its 2021 share repurchase program. The new $2 billion share repurchase authorization is in addition to the $2 billion 2021 share repurchase program, authorized by the Board in March 2021. In addition, the Company purchases shares from participants in the Company’s equity programs who trade shares as trade for taxes. Under Dutch tax law, the repurchase of a company’s shares by an entity domiciled in the Netherlands results in a taxable event, unless a tax exemption applies. The tax on the repurchased shares is attributed to the shareholders, with NXP making the payment on the shareholders’ behalf. As such, the tax on the repurchased shares is accounted for within stockholders’ equity.
The following share repurchase activity occurred under these programs during the three months ended October 3, 2021:
| Period | Total Number of Shares Purchased | Average Price Paid per Share | Number of Shares Purchased as Part of Publicly Announced Buy Back Programs | Maximum Number of Shares That May Yet Be Purchased Under the Buy Back Program | Number of Shares Purchased as Trade for Tax (1) | ||||||||||||||||||||||||
| July 5, 2021 – August 8, 2021 | 5,800,443 | $199.37 | 5,037,477 | 1,789,023 | 762,966 | ||||||||||||||||||||||||
| August 9, 2021 – September 5, 2021 | — | $— | — | 11,185,519 | — | ||||||||||||||||||||||||
| September 6, 2021 – October 3, 2021 | — | $— | — | 12,351,100 | — | ||||||||||||||||||||||||
| Total | 5,800,443 | 5,037,477 | 762,966 |
(1) Reflects shares surrendered by participants to satisfy tax withholding obligations in connection with the Company's equity programs.
Item 5. Other Information
The Compensation Committee of the Board of Directors of NXP Semiconductors N.V. (the “Company”) has approved a form of Performance Restricted Stock Unit Award Agreement (attached as Exhibit 10.3 to this Report) for the award of equity grants to our employees, including the Company’s named executive officers. These equity awards will be granted under the NXP Semiconductors N.V. 2019 Omnibus Incentive Plan which was previously approved by the Company’s annual general meeting of shareholders.
Item 6. Exhibits
| Exhibit Number | Exhibit Description | |||||||||||||
| 3.1 | Articles of Association of NXP Semiconductors N.V. dated June 9, 2020 (incorporated by reference to Exhibit 3.1 to the Company’s Quarterly Report on Form 10-Q of NXP Semiconductors N.V., filed on July 28, 2020) | |||||||||||||
| 10.1+ | Employment Agreement dated August 25, 2021 between NXP USA, Inc. and Jennifer Wuamett (incorporated by reference to 10.1 to the Company’s Current Report on Form 8-K of NXP Semiconductors N.V., filed on August 26, 2021) | |||||||||||||
| 10.2+ | Employment Agreement dated October 12, 2021 between NXP USA, Inc. and Bill Betz (incorporated by reference to 10.1 to the Company’s Current Report on Form 8-K of NXP Semiconductors N.V., filed on October 12, 2021) | |||||||||||||
| 10.3*+ | Form of Performance Restricted Stock Unit Award Agreement | |||||||||||||
| 31.1* | Rule 13a-14(a) / 15d-14(a) Certification of Chief Executive Officer | |||||||||||||
| 31.2* | Rule 13a-14(a) / 15d-14(a) Certification of Chief Financial Officer | |||||||||||||
| 32.1* | Section 1350 Certifications of Chief Executive Officer and Chief Financial Officer | |||||||||||||
| 101 | The following materials from the Company’s Quarterly Report on Form 10-Q for the quarter ended October 3, 2021, formatted in iXBRL (Inline eXtensible Business Reporting Language): (i) Condensed Consolidated Statements of Operations for the three and nine months ended October 3, 2021 and September 27, 2020; (ii) Condensed Consolidated Statements of Comprehensive Income for the three and nine months ended October 3, 2021 and September 27, 2020; (iii) Condensed Consolidated Balance Sheets as of October 3, 2021 and December 31, 2020; (iv) Condensed Consolidated Statements of Cash Flows for the nine months ended October 3, 2021 and September 27, 2020; (v) Condensed Consolidated Statements of Changes in Equity for the three and nine months ended October 3, 2021 and September 27, 2020; and (vi) Notes to the Unaudited Condensed Consolidated Financial Statements. | |||||||||||||
| 104 | Cover Page Interactive Data File (formatted as Inline XBRL and contained in Exhibit 101). |
| * | Filed or furnished herewith. | ||||
| + | Indicates management contract or compensatory plan or arrangement. | ||||
SIGNATURE
Pursuant to the requirements of the Securities Exchange Act of 1934, the registrant has duly caused this report to be signed on its behalf by the undersigned, thereunto duly authorized.
Date: November 2, 2021
| NXP Semiconductors N.V. | |||||
| /s/ William J. Betz | |||||
| Name: William J. Betz, CFO | |||||
Exhibit 31.1
CERTIFICATION
I, Kurt Sievers, certify that:
1.I have reviewed this quarterly report on Form 10-Q of NXP Semiconductors N.V.;
2.Based on my knowledge, this report does not contain any untrue statement of a material fact or omit to state a material fact necessary to make the statements made, in light of the circumstances under which such statements were made, not misleading with respect to the period covered by this report;
3.Based on my knowledge, the financial statements, and other financial information included in this report, fairly present in all material respects the financial condition, results of operations and cash flows of the Registrant as of, and for, the periods presented in this report;
4.The Registrant’s other certifying officer and I are responsible for establishing and maintaining disclosure controls and procedures (as defined in Exchange Act Rules 13a-15(e) and 15d-15(e)) and internal control over financial reporting (as defined in Exchange Act Rules 13a-15(f) and 15d-15(f)) for the Registrant and have:
a)Designed such disclosure controls and procedures, or caused such disclosure controls and procedures to be designed under our supervision, to ensure that material information relating to the Registrant, including its consolidated subsidiaries, is made known to us by others within those entities, particularly during the period in which this report is being prepared;
b)Designed such internal control over financial reporting, or caused such internal control over financial reporting to be designed under our supervision, to provide reasonable assurance regarding the reliability of financial reporting and the preparation of financial statements for external purposes in accordance with generally accepted accounting principles;
c)Evaluated the effectiveness of the Registrant’s disclosure controls and procedures and presented in this report our conclusions about the effectiveness of the disclosure controls and procedures, as of the end of the period covered by this report based on such evaluation; and
d)Disclosed in this report any change in the Registrant’s internal control over financial reporting that occurred during the Registrant’s most recent fiscal quarter (the Registrant’s fourth fiscal quarter in the case of an annual report) that has materially affected, or is reasonably likely to materially affect, the Registrant’s internal control over financial reporting; and
5.The Registrant’s other certifying officer and I have disclosed, based on our most recent evaluation of internal control over financial reporting, to the Registrant’s auditors and the audit committee of the Registrant’s board of directors (or persons performing the equivalent functions):
a)All significant deficiencies and material weaknesses in the design or operation of internal control over financial reporting which are reasonably likely to adversely affect the Registrant’s ability to record, process, summarize, and report financial information; and
b)Any fraud, whether or not material, that involves management or other employees who have a significant role in the Registrant’s internal control over financial reporting.
Date: November 2, 2021
| By: | /s/ Kurt Sievers | |||||||
| Kurt Sievers | ||||||||
| President & Chief Executive Officer |
Exhibit 31.2
CERTIFICATION
I, William J. Betz, certify that:
1.I have reviewed this quarterly report on Form 10-Q of NXP Semiconductors N.V.;
2.Based on my knowledge, this report does not contain any untrue statement of a material fact or omit to state a material fact necessary to make the statements made, in light of the circumstances under which such statements were made, not misleading with respect to the period covered by this report;
3.Based on my knowledge, the financial statements, and other financial information included in this report, fairly present in all material respects the financial condition, results of operations and cash flows of the Registrant as of, and for, the periods presented in this report;
4.The Registrant’s other certifying officer and I are responsible for establishing and maintaining disclosure controls and procedures (as defined in Exchange Act Rules 13a-15(e) and 15d-15(e)) and internal control over financial reporting (as defined in Exchange Act Rules 13a-15(f) and 15d-15(f)) for the Registrant and have:
a)Designed such disclosure controls and procedures, or caused such disclosure controls and procedures to be designed under our supervision, to ensure that material information relating to the Registrant, including its consolidated subsidiaries, is made known to us by others within those entities, particularly during the period in which this report is being prepared;
b)Designed such internal control over financial reporting, or caused such internal control over financial reporting to be designed under our supervision, to provide reasonable assurance regarding the reliability of financial reporting and the preparation of financial statements for external purposes in accordance with generally accepted accounting principles;
c)Evaluated the effectiveness of the Registrant’s disclosure controls and procedures and presented in this report our conclusions about the effectiveness of the disclosure controls and procedures, as of the end of the period covered by this report based on such evaluation; and
d)Disclosed in this report any change in the Registrant’s internal control over financial reporting that occurred during the Registrant’s most recent fiscal quarter (the Registrant’s fourth fiscal quarter in the case of an annual report) that has materially affected, or is reasonably likely to materially affect, the Registrant’s internal control over financial reporting; and
5.The Registrant’s other certifying officer and I have disclosed, based on our most recent evaluation of internal control over financial reporting, to the Registrant’s auditors and the audit committee of the Registrant’s board of directors (or persons performing the equivalent functions):
a)All significant deficiencies and material weaknesses in the design or operation of internal control over financial reporting which are reasonably likely to adversely affect the Registrant’s ability to record, process, summarize, and report financial information; and
b)Any fraud, whether or not material, that involves management or other employees who have a significant role in the Registrant’s internal control over financial reporting.
Date: November 2, 2021
| By: | /s/ William J. Betz | |||||||
| William J. Betz | ||||||||
| Chief Financial Officer |
Exhibit 32.1
CERTIFICATIONS OF CHIEF EXECUTIVE OFFICER AND CHIEF FINANCIAL OFFICER
PURSUANT TO
18 U.S.C. SECTION 1350,
AS ADOPTED PURSUANT TO
SECTION 906 OF THE SARBANES-OXLEY ACT OF 2002
I, Kurt Sievers, certify, as of the date hereof, pursuant to 18 U.S.C. Section 1350, as adopted pursuant to Section 906 of the Sarbanes-Oxley Act of 2002, that the Quarterly Report of NXP Semiconductors N.V. on Form 10-Q for the period ended October 3, 2021 fully complies with the requirements of Section 13(a) or 15(d) of the Securities Exchange Act of 1934 and that information contained in such Form 10-Q fairly presents in all material respects the financial condition and results of operations of NXP Semiconductors N.V. at the dates and for the periods indicated.
Date: November 2, 2021
| By: | /s/ Kurt Sievers | |||||||
| Kurt Sievers | ||||||||
| President & Chief Executive Officer |
I, William J. Betz, certify, as of the date hereof, pursuant to 18 U.S.C. Section 1350, as adopted pursuant to Section 906 of the Sarbanes-Oxley Act of 2002, that the Quarterly Report of NXP Semiconductors N.V. on Form 10-Q for the period ended October 3, 2021 fully complies with the requirements of Section 13(a) or 15(d) of the Securities Exchange Act of 1934 and that information contained in such Form 10-Q fairly presents in all material respects the financial condition and results of operations of NXP Semiconductors N.V. at the dates and for the periods indicated.
Date: November 2, 2021
| By: | /s/ William J. Betz | |||||||
| William J. Betz | ||||||||
| Chief Financial Officer |