 filings.tools
Item 2. Management’s Discussion and Analysis of Financial Condition and Results of Operations
47K characters. Original on sec.gov ·
Item 2. Management’s Discussion and Analysis of Financial Condition and Results of Operations
This interim Management’s Discussion and Analysis ("MD&A") should be read in conjunction with our consolidated financial statements and notes and the MD&A in our Annual Report on Form 10-K for the year ended December 31, 2021. This discussion contains forward-looking statements that involve a number of risks and uncertainties, including any statements that refer to projections of our future financial performance, our anticipated growth and trends in our businesses, uncertain events or assumptions, and other characterizations of future events or circumstances, including the expected timeline to remediate the identified material weakness in our internal control over financial reporting, the uncertain nature, magnitude, and duration of hostilities stemming from Russia's recent military invasion of the Ukraine, and our response to the current global pandemic and the potential impact the pandemic will have on our operations, liquidity, customers, facilities and supply chain. Such statements are based on our current expectations and could be affected by the uncertainties and risk factors described throughout this filing, and in “Risk Factors” in Part I, Item 1A of our Annual Report on Form 10-K. Our actual results may differ materially from those contained in any forward-looking statements. We undertake no obligation to update any forward-looking statement to reflect subsequent events or circumstances.
Our MD&A is provided in addition to the accompanying consolidated financial statements and notes to assist readers in understanding our results of operations, financial condition and cash flows. MD&A is organized as follows:
-
Overview - Overall analysis of financial and other highlights to provide context for the MD&A
-
Results of Operations - An analysis of our financial results
-
Liquidity and Capital Resources - An analysis of changes in our balance sheets and cash flows
-
Information Regarding Guarantors of NXP - Financial information of the Obligor Group on a combined basis
Overview
| ($ in millions, unless otherwise stated) | Q2 2022 | Q2 2021 | YTD 2022 | YTD 2021 | |||||||||||||||||||
| Revenue | 3,312 | 2,596 | 6,448 | 5,163 | |||||||||||||||||||
| Gross profit | 1,882 | 1,422 | 3,659 | 2,777 | |||||||||||||||||||
| Operating income (loss) | 943 | 573 | 1,816 | 1,065 | |||||||||||||||||||
| Cash flow from operating activities | 819 | 636 | 1,675 | 1,368 | |||||||||||||||||||
| Total debt | 11,160 | 9,591 | 11,160 | 9,591 | |||||||||||||||||||
| Net debt | 7,615 | 6,681 | 7,615 | 6,681 | |||||||||||||||||||
| Diluted weighted average number of shares outstanding | 264,692 | 278,735 | 264,909 | 281,063 | |||||||||||||||||||
| Diluted net income per share | 2.53 | 1.42 | 5.01 | 2.67 | |||||||||||||||||||
| Dividends per common share | 0.8450 | 0.5625 | 1.6900 | 1.1250 |
Q2 2022 compared to Q2 2021
Revenue for the three months ended July 3, 2022 was $3,312 million compared to $2,596 million for the three months ended July 4, 2021, an increase of $716 million or an increase of 27.6% year-on-year. Revenue growth during the quarter was due to increased volumes of products shipped driven by the continued industry-wide demand for semiconductors across the company’s focused end markets, and the positive mix effects within the company’s focused end markets. Additionally, the company continued to experience the inflationary effects of increased input costs from its suppliers which were passed along to end customers in the form of higher average selling prices.
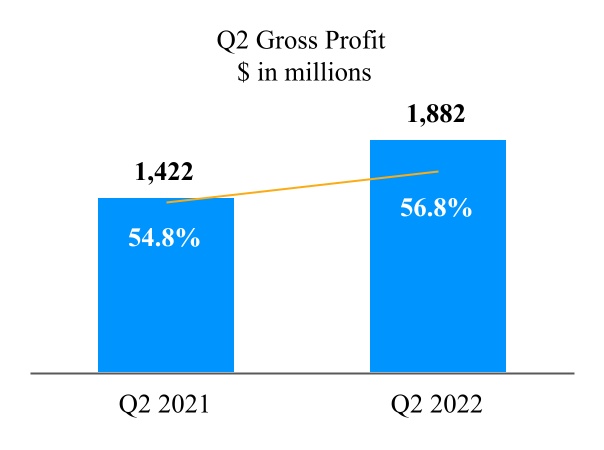
Our gross profit percentage for the second quarter of 2022 increased from 54.8% in the second quarter of 2021 to 56.8%, primarily from the continued significant acceleration of revenue in the second quarter of 2022 compared to the same period in 2021, which led to improved factory loading, increased manufacturing volumes, and higher sales prices, which were mostly offset by higher input costs.
We continue to generate strong operating cash flows, with $819 million in cash flows from operations for the second quarter of 2022. We returned $224 million to our shareholders during the second quarter of 2022. Our cash position at the end of the second quarter of 2022 was $3,545 million. This includes the net proceeds of the $1.5 billion of senior unsecured debt issued by NXP on May 16, 2022.
YTD 2022 compared to YTD 2021
Revenue for the six months ended July 3, 2022 was $6,448 million compared to $5,163 million for the six months ended July 4, 2021, an increase of $1,285 million or an increase of 24.9% year-on-year. The increase within the first half 2022 is attributed to strong demand, across all of the end markets.
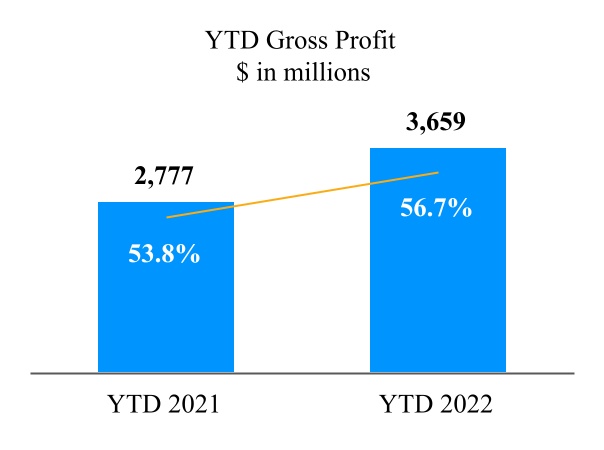
Our gross profit percentage for the six months ended July 3, 2022 increased from 53.8% for the six months ended July 4, 2021 to 56.7%, primarily from the continued significant acceleration of revenue in the first six months of 2022 compared to the same period in 2021, which led to improved factory loading, increased manufacturing volumes, and higher sales prices, which were mostly offset by higher input costs.
Cash flow from operations for the first six months of 2022 was $1,675 million. Total shareholder return for the first six months of 2022 was $925 million. Our cash position remains solid, with the net proceeds of the $1.5 billion in newly issued debt adding to our cash and cash equivalents.
Results of operations
The following table presents operating income for each of the three month periods ended July 3, 2022 and July 4, 2021, respectively:
| ($ in millions, unless otherwise stated) | Q2 2022 | Q2 2021 | YTD 2022 | YTD 2021 | |||||||||||||||||||
| Revenue | 3,312 | 2,596 | 6,448 | 5,163 | |||||||||||||||||||
| % nominal growth | 27.6 | 42.9 | 24.9 | 34.5 | |||||||||||||||||||
| Gross profit | 1,882 | 1,422 | 3,659 | 2,777 | |||||||||||||||||||
| Research and development | (542) | (476) | (1,060) | (937) | |||||||||||||||||||
| Selling, general and administrative | (265) | (234) | (516) | (456) | |||||||||||||||||||
| Amortization of acquisition-related intangible assets | (134) | (139) | (269) | (319) | |||||||||||||||||||
| Other income (expense) | 2 | — | 2 | — | |||||||||||||||||||
| Operating income (loss) | 943 | 573 | 1,816 | 1,065 |
Revenue
Q2 2022 compared to Q2 2021
Revenue for the three months ended July 3, 2022 was $3,312 million compared to $2,596 million for the three months ended July 4, 2021, an increase of $716 million or an increase of 27.6% year-on-year, with growth in all of the Company’s four focus end markets.
YTD 2022 compared to YTD 2021
Revenue for the six months ended July 3, 2022 was $6,448 million compared to $5,163 for the six months ended July 4, 2021, an increase of $1,285 million or 24.9%, with growth in all of the Company’s four end markets.
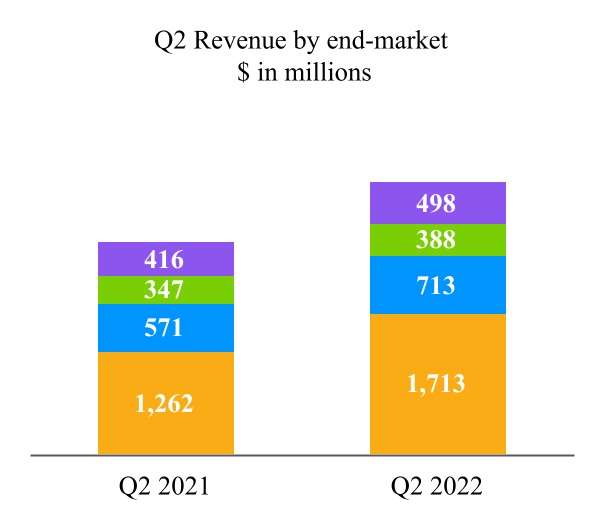
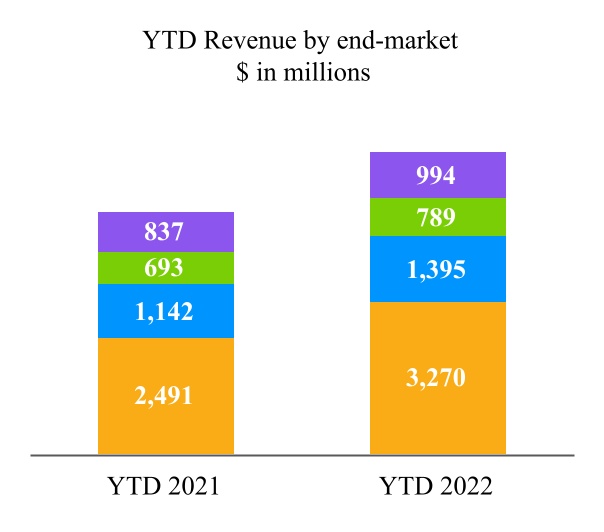
Revenue by end market was as follows:
| ($ in millions, unless otherwise stated) | Q2 2022 | Q2 2021 | Change | YTD 2022 | YTD 2021 | Change | |||||||||||||||||||||||||||||
| Automotive | 1,713 | 1,262 | 35.7 | % | 3,270 | 2,491 | 31.3 | % | |||||||||||||||||||||||||||
| Industrial & IoT | 713 | 571 | 24.9 | % | 1,395 | 1,142 | 22.2 | % | |||||||||||||||||||||||||||
| Mobile | 388 | 347 | 11.8 | % | 789 | 693 | 13.9 | % | |||||||||||||||||||||||||||
| Communication Infrastructure & Other | 498 | 416 | 19.7 | % | 994 | 837 | 18.8 | % | |||||||||||||||||||||||||||
| Revenue | 3,312 | 2,596 | 27.6 | % | 6,448 | 5,163 | 24.9 | % |
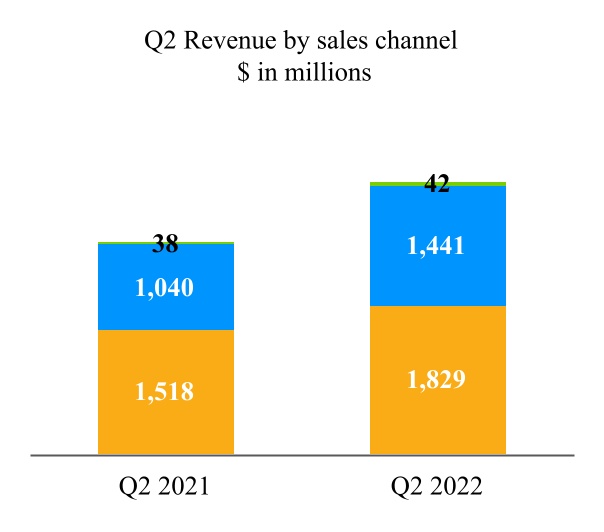
Revenue by sales channel was as follows:
| ($ in millions, unless otherwise stated) | Q2 2022 | Q2 2021 | Change | YTD 2022 | YTD 2021 | Change | |||||||||||||||||||||||||||||
| Distributors | 1,829 | 1,518 | 20.5 | % | 3,509 | 2,986 | 17.5 | % | |||||||||||||||||||||||||||
| OEM/EMS | 1,441 | 1,040 | 38.6 | % | 2,853 | 2,104 | 35.6 | % | |||||||||||||||||||||||||||
| Other | 42 | 38 | 10.5 | % | 86 | 73 | 17.8 | % | |||||||||||||||||||||||||||
| Revenue | 3,312 | 2,596 | 27.6 | % | 6,448 | 5,163 | 24.9 | % |
Revenue by geographic region, which is based on the customer’s shipped-to location was as follows:
| ($ in millions, unless otherwise stated) | Q2 2022 | Q2 2021 | Change | YTD 2022 | YTD 2021 | Change | |||||||||||||||||||||||||||||
| Greater China and Asia Pacific | 1,831 | 1,503 | 21.8 | % | 3,531 | 2,985 | 18.3 | % | |||||||||||||||||||||||||||
| EMEA (Europe, the Middle East and Africa) | 668 | 461 | 44.9 | % | 1,306 | 928 | 40.7 | % | |||||||||||||||||||||||||||
| Americas | 435 | 336 | 29.5 | % | 867 | 657 | 32.0 | % | |||||||||||||||||||||||||||
| Japan | 230 | 188 | 22.3 | % | 448 | 377 | 18.8 | % | |||||||||||||||||||||||||||
| South Korea | 148 | 108 | 37.0 | % | 296 | 216 | 37.0 | % | |||||||||||||||||||||||||||
| Revenue | 3,312 | 2,596 | 27.6 | % | 6,448 | 5,163 | 24.9 | % |
| n | Automotive | n | Mobile | |||||||||||
| n | Industrial IoT | n | Comm Infra & Other |

| n | Distributors | n | Other | |||||||||||
| n | OEM/EMS |
Q2 2022 compared to Q2 2021
The increase in revenue is attributed to the combination of ongoing demand, across NXP’s Automotive, Industrial IoT, Mobile, and the Communications Infrastructure & Other end markets, as well as the effects of increased input costs from NXP suppliers which were passed along to our end customers in the form of higher average selling prices.
From an end market perspective, the year-on-year growth within the Automotive end market was driven by strong demand across the entire automotive product portfolio in support of the secular shift of electrification, advanced driver safety and assistance, and driver connectivity systems. The growth within the Industrial & IoT market reflects the continued adoption of our complete secure, connected edge processing solutions which leverage our broad processor portfolio, complimented by connectivity, analog attach and security products. The growth within the Mobile end market was due to ongoing adoption of our secure embed transaction solutions along with the company’s growth in our advanced analog high speed interfaces. The growth within the Communication Infrastructure & Other end market was attributable to cellular base stations, the network edge equipment, and the secure access, transit and government sponsored identification market.
When aggregating all end markets together, and reviewing sales channel performance, business transacted through NXP's third party distribution partners was $1,829 million, an increase of 20.5%. Sales to NXP's direct OEM and EMS customers was $1,441 million, an
increase of 38.6% versus the second quarter of 2021.
From a geographic perspective, revenue increased across all regions.
Revenue from the Automotive end market was $1,713 million, an increase of $451 million or 35.7% year-on-year. Within Automotive, customers are focused on the key functional pillars of safety, electrification and improved driver comfort to accelerate competitive differentiation. These broad functional areas are fundamentally enabled by the secular adoption of new and increased levels of semiconductor content, which is layered on top of a strong base of existing electronic content in modern automobiles. The increase in Automotive revenue during the second quarter of 2022 can be attributed to strong demand for advanced analog, embedded processing and radar solutions.
Revenue from the Industrial & IoT end market was $713 million, an increase of $142 million or 24.9% year-on-year. The Industrial & IoT market is driven by the secular trend of multi-market OEMs seeking to enable secure, connected, high performance processing solutions at the edge of the network, whether it is in factory automation, smart building/smart home or the exploding plethora of connected IoT devices. The innovation in this market is being driven by thousands of relatively smaller customers, which NXP effectively services through its extended global distribution channel. During the second quarter of 2022, the year-on-year increase was driven by the continued demand for the company’s 32-bit ARM-based microcontrollers and crossover processors, and to a lesser degree industrial application processors. Additionally, the year-on-year increase was supported by demand for industrial analog products, and point-of-sale security solutions.
Revenue from the Mobile end market was $388 million with an increase of $41 million or 11.8% year-on-year. The year-on-year increase was driven by strong adoption of secure mobile wallet solutions and increased demand in our advanced analog high speed interfaces, which was offset by declines in advanced power systems driven by load switch demand decline. Our mobile customers are primarily serviced through our global distribution channels.
Revenue in the Communication Infrastructure & Other end market was $498 million, an increase of $82 million or 19.7% year-on-year. The Communication Infrastructure & Other end market is an amalgamation of three separate product portfolios, which service multiple end markets, including cellular base stations; the network edge equipment, and the secure access, transit and government sponsored identification market. The year-on-year growth in the second quarter of 2022 was driven by a combination of high performance RF Power amplifier products for cellular base-station applications, network edge equipment, and broad based demand for secure access and identification solutions. Offsetting these positive growth trends were declines in demand for the company’s smart antennae products used in the Android mobile handset market, as well as declines in demand for wireless access point solutions.
YTD 2022 compared to YTD 2021
The increase in revenue is primarily attributed to the combination of strong demand, from NXP’s Automotive, Industrial IoT, and the Communications Infrastructure & Other end markets, and to a lesser degree the Mobile end market. The year-to-date growth rates are also influenced by higher average pricing, which were the result of rising inflationary effects on input costs from NXP suppliers, and passed along to our end customers.
From an end market perspective, within the automotive end market the year-on-year growth was driven by strong demand for advanced analog, embedded processing and radar in support of the secular shift of electrification, advanced driver safety and assistance, and driver connectivity systems. The growth within the Industrial & IoT market reflects the successful continuation of adoption of our complete secure, connected edge processing solutions which leverage our broad processor portfolio, complimented by analog attach, connectivity, and security products. Growth within the Mobile end market was due to ongoing adoption of our secure embed transaction solutions along with the company’s growth in our advanced analog high speed interfaces. Growth within the Communication Infrastructure & Other end market was attributable to cellular base stations, the network edge equipment, and the secure access, transit and government sponsored identification market.
When aggregating all end markets together, and reviewing sales channel performance, business transacted through direct OEM and EMS customers was $2,853 million, an increase of 35.6% versus the first half of 2021. NXP's third party distribution partners was $3,509 million, an increase of 17.5%.
From a geographic perspective, revenue increased across all regions.
Revenue in the Automotive end market was $3,270 million, an increase of $779 million or 31.3% versus the year ago period due to the ongoing demand for our automotive products supporting the secular shift of electrification, advanced driver safety and assistance, and driver connectivity systems.
Revenue in the Industrial & IoT end market was $1,395 million, an increase of $253 million or 22.2% versus the year ago period primarily driven by the continued demand for the company’s 32-bit ARM-based microcontrollers and crossover processors, and to a lesser degree industrial application processors. Additionally, the year-on-year increase was supported by demand for industrial analog products, IoT connectivity and point-of-sale security solutions.
Revenue in the Mobile end market was $789 million, an increase of $96 million or 13.9% versus the year ago period due to strong adoption of secure mobile wallet solutions, and demand for our advanced analog high speed interfaces, offset by declines in embedded power solutions.
Revenue in the Communication Infrastructure & Other end market was $994 million, an increase of $157 million or 18.8% versus the year ago period due to a combination of strength from RF Power products levered to the secular build-out of 5G base stations, network edge equipment, and broad based demand for secure access and identification solutions. Offsetting these positive growth trends were declines in demand for the company’s smart antennae products used in the Android mobile handset market, as well as declines in demand for wireless access point solutions.
Gross profit
Q2 2022 compared to Q2 2021
Gross profit for the three months ended July 3, 2022 was $1,882 million, or 56.8% of revenue, compared to $1,422 million, or 54.8% of revenue for the three months ended July 4, 2021.The increase of $460 million in gross profit was driven by the significant higher revenue in the second quarter of 2022 compared to the second quarter of 2021, which led to improved factory loading, increased manufacturing volumes, and higher sales prices, which were mostly offset by higher input costs.
YTD 2022 compared to YTD 2021
Gross profit for the six months ended July 3, 2022 was $3,659 million, or 56.7% of revenue, compared to $2,777 million, or 53.8% of revenue for the six months ended July 4, 2021. The increase of $882 million was primarily driven by the significant higher revenue in the first half of 2022 compared to the first half of 2021, which led to improved factory loading, increased manufacturing volumes, and higher sales prices, which were mostly offset by higher input costs.
Operating expenses
Q2 2022 compared to Q2 2021
Operating expenses for the three months ended July 3, 2022 totaled $941 million, or 28.4% of revenue, compared to $849 million, or 32.7% of revenue, for the three months ended July 4, 2021.
YTD 2022 compared to YTD 2021
Operating expenses for the six months ended July 3, 2022 totaled $1,845 million, or 28.6% of revenue, compared to $1,712 million, or 33.2% of revenue, for the six months ended July 4, 2021.
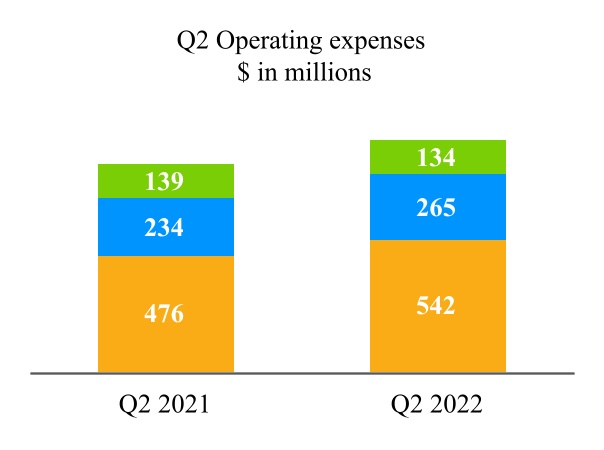
The following table below presents the composition of operating expenses by line item in the statement of operations:
| ($ in millions, unless otherwise stated) | Q2 2022 | Q2 2021 | YTD 2022 | YTD 2021 | |||||||||||||||||||
| Research and development | 542 | 476 | 1,060 | 937 | |||||||||||||||||||
| Selling, general and administrative | 265 | 234 | 516 | 456 | |||||||||||||||||||
| Amortization of acquisition-related intangible assets | 134 | 139 | 269 | 319 | |||||||||||||||||||
| Total operating expenses | 941 | 849 | 1,845 | 1,712 |

| n | R&D | n | SG&A | n | Amortization acquisition-related |
Q2 2022 compared to Q2 2021
The increase in operating expenses was a result of the following items:
Research and development (R&D) costs primarily consist of engineer salaries and wages (including share based compensation and other variable compensation), engineering related costs (including outside services, fixed-asset, IP and other licenses related costs), shared service center costs and other pre-production related expenses. R&D costs for the three months ended July 3, 2022 increased by $66 million, or 13.9%, when compared to the three months ended July 4, 2021 mainly driven by:
+ higher personnel-related costs, including variable compensation costs;
+ higher pre-production related expenses; and
+ higher professional services.
Selling, general and administrative (SG&A) costs primarily consist of personnel salaries and wages (including share based compensation and other variable compensation), communication and IT related costs, fixed-asset related costs and sales and marketing costs (including travel expenses). SG&A costs for the three months ended July 3, 2022 increased by $31 million, or 13.2%, when compared to the three months ended July 4, 2021 mainly due to:
+ higher legal expense; and
+ higher professional services.
Amortization of acquisition-related intangible assets decreased by $5 million, or 3.6%, when compared to the three months ended July 4, 2021 driven by:
- certain intangibles became fully amortized during 2021.
YTD 2022 compared to YTD 2021
The increase in operating expenses was a result of the following items:
Research and development (R&D) costs primarily consist of engineer salaries and wages (including share based compensation and other variable compensation), engineering related costs (including outside services, fixed-asset, IP and other licenses related costs), shared service center costs and other pre-production related expenses. R&D costs for the six months ended July 3, 2022 increased by $123 million, or 13.1%, when compared to the six months ended July 4, 2021 driven by:
+ higher personnel-related costs, including variable compensation costs;
+ higher pre-production related expenses; and
+ higher professional services .
Selling, general and administrative (SG&A) costs primarily consist of personnel salaries and wages (including share based compensation and other variable compensation), communication and IT related costs, fixed-asset related costs and sales and marketing costs (including travel expenses). SG&A costs for the six months ended July 3, 2022 increased by $60 million, or 13.2%, when compared to the six months ended July 4, 2021 mainly due to:
+ higher legal expense;
+ higher professional services; and
+ higher IT related expenses.
Amortization of acquisition-related intangible assets decreased by $50 million, or 15.7%, when compared to the six months ended July 4, 2021 driven by:
- an impairment charge in Q1 2021 as a result of the discontinuation of an IPR&D project.
Financial income (expense)
The following table presents the details of financial income and expenses:
| ($ in millions, unless otherwise stated) | Q2 2022 | Q2 2021 | YTD 2022 | YTD 2021 | |||||||||||||||||||
| Interest income | 6 | 1 | 8 | 2 | |||||||||||||||||||
| Interest expense | (106) | (90) | (210) | (177) | |||||||||||||||||||
| Total interest expense, net | (100) | (89) | (202) | (175) | |||||||||||||||||||
| Extinguishment of debt | (18) | — | (18) | — | |||||||||||||||||||
| Foreign exchange rate results | 3 | (1) | 3 | — | |||||||||||||||||||
| Miscellaneous financing costs/income and other, net | (13) | (10) | (16) | (12) | |||||||||||||||||||
| Total other financial income (expense) | (28) | (11) | (31) | (12) | |||||||||||||||||||
| Total | (128) | (100) | (233) | (187) |
Q2 2022 compared to Q2 2021
Financial income (expense) was an expense of $128 million in the second quarter of 2022 compared to an expense of $100 million in the second quarter of 2021. The change in financial income (expense) is primarily attributable to an increase in interest expense as a result of the net increase in debt, and debt extinguishment costs incurred in the second quarter of 2022. Higher interest rates resulted in an interest income increase in the second quarter of 2022.
YTD 2022 compared to YTD 2021
Financial income (expense) was an expense of $233 million in the first six months of 2022 compared to an expense of $187 million in the first six months of 2021. The change in financial income (expense) is primarily attributable to an increase in interest expense as a result of the net increase in debt, and debt extinguishment costs incurred in the second quarter of 2022. Higher interest rates resulted in an interest income increase in the second quarter of 2022.
Benefit (provision) for income taxes
Q2 2022 compared to Q2 2021
Our provision for income taxes was $129 million (15.8% effective tax rate) for the second quarter of 2022 compared to a provision for income taxes of $65 million (13.7% effective tax rate) for the second quarter of 2021. The increase in the income tax expense was due to higher income before income taxes as a result of the improved operational performance of the company, which was partly offset by an increase in tax incentives also taking into account the effect of specific US tax law that became effective as from 2022. In addition to this, in the second quarter of 2021 there was an income tax benefit due to a release of the valuation allowance and a lower taxable foreign exchange result.
YTD 2022 compared to YTD 2021
Our provision for income taxes for the first six months of 2022 was $243 million (15.4% effective tax rate) compared to a provision for income taxes of $105 million) (12.0% effective tax rate) for the first six months of 2021. The increase in the income tax expense was due to higher income before income taxes as a result of the improved operational performance of the company which was partly offset by an increase in tax incentives also taking into account the effect of specific US tax law that became effective as from 2022. In addition to this, in the first six months of 2021 there were income tax benefits due to changes in estimates of prior positions and a net change in the valuation allowance.
Net income (loss)
The following table presents the composition of net income for the periods reported:
| ($ in millions, unless otherwise stated) | Q2 2022 | Q2 2021 | YTD 2022 | YTD 2021 | |||||||||||||||||||
| Operating income (loss) | 943 | 573 | 1,816 | 1,065 | |||||||||||||||||||
| Financial income (expense) | (128) | (100) | (233) | (187) | |||||||||||||||||||
| Benefit (provision) for income taxes | (129) | (65) | (243) | (105) | |||||||||||||||||||
| Results relating to equity-accounted investees | (3) | (2) | 9 | (3) | |||||||||||||||||||
| Net income (loss) | 683 | 406 | 1,349 | 770 |
Liquidity and Capital Resources
We derive our liquidity and capital resources primarily from our cash flows from operations. We continue to generate strong positive operating cash flows. At the end of the second quarter of 2022, our cash balance was $3,545 million, an increase of $715 million compared to December 31, 2021. Taking into account the available amount of the Unsecured Revolving Credit Facility of $1,500 million, we had access to $5,045 million of liquidity as of July 3, 2022.
We currently use cash to fund operations, meet working capital requirements, for capital expenditures and for potential common stock repurchases, dividends and strategic investments. Based on past performance and current expectations, we believe that our current available sources of funds (including cash and cash equivalents, RCF Agreement, plus anticipated cash generated from operations) will be adequate to finance our operations, working capital requirements, capital expenditures and potential dividends for at least the next twelve months. Our capital expenditures were $548 million in the first six months of 2022, compared to $300 million in the first six months of 2021. During the six month period ended July 3, 2022, we repurchased $554 million, or 2.7 million shares of our common stock pursuant to our share buyback programs at a weighted average price of $207.77 per share.
Our total debt amounted to $11,160 million as of Q2 2022, an increase of $588 million compared to December 31, 2021 ($10,572 million). On May 16, 2022, NXP issued $500 million aggregate principal amount of 4.400% Senior Notes due in 2027 (the “4.400% 2027 Notes”) and $1 billion aggregate principal amount of 5.000% Senior Notes due in 2033 (the “2033 Notes”). The net proceeds of the 4.400% 2027 Notes, together with cash on hand, has been used to redeem the $900 million aggregate principal amount of outstanding dollar-denominated 4.625% Senior Unsecured Notes due 2023 in accordance with the terms of the indenture. NXP will allocate an amount equal to the net proceeds of the offering of the 2033 Notes to the financing of, in whole or in part, one or more eligible green projects. Pending allocation, NXP will temporarily hold the remaining net proceeds of the 2033 Notes as cash and other short-term securities or use for general corporate purposes, which may include capital expenditures, short-term debt repayment or equity buyback transactions.
Exchange Offers
In connection with the sale of (i) NXP B.V.’s and NXP Funding LLC’s 4.875% Senior Notes due 2024 (the “2024 Notes”), 5.350% Senior Notes due 2026 (the “5.350% 2026 Notes”) and 5.550% Senior Notes due 2028 (the “2028 Notes”) and (ii) NXP B.V.’s, NXP Funding LLC’s and NXP USA Inc.’s 2.700% Senior Notes due 2025 (the “2025 Notes”), 3.875% Senior Notes due 2026 (the “3.875% 2026 Notes”), 3.150% Senior Notes due 2027 (the “3.150% 2027 Notes”), 4.300% Senior Notes due 2029 (the “2029 Notes”), 3.400% Senior Notes due 2030 (the “2030 Notes”), 2.500% Senior Notes due 2031 (the “2031 Notes”), 2.650% Senior Notes due 2032 (the “2032 Notes”), 3.250% Senior Notes due 2041 (the “2041 Notes”), 3.125% Senior Notes due 2042 (the “2042 Notes”) and 3.250% Senior Notes due 2051 (the “2051 Notes”), which we collectively refer to as the “Notes”, the issuers of the Notes (the “Issuers”) entered into registration rights agreements pursuant to which the Issuers agreed, among other things, to use commercially reasonable efforts to file an exchange offer registration statement to exchange the Notes for new issues of substantially identical debt securities registered under the U.S. Securities Act of 1933 (the “Exchange Offers”).
On April 14, 2022, the registration statements on Form S-4 filed by the Issuers were declared effective by the SEC, registering the Exchange Offers. The Exchange Offers expired on May 16, 2022. Any outstanding Notes that were not tendered for exchange in the Exchange Offers remain outstanding and continue to accrue interest and are entitled to the rights and benefits that such holders have under the indentures related to such outstanding Notes, except for any rights under the applicable registration rights agreement which terminated upon consummation of the Exchange Offers. This exchange had no impact on our financial position, result of operations or cash flows.
At July 3, 2022, our cash balance was $3,545 million of which $193 million was held by SSMC, our consolidated joint venture company with TSMC. Under the terms of our joint venture agreement with TSMC, a portion of this cash can be distributed by way of a dividend to us, but 38.8% of the dividend will be paid to our joint venture partner.
Cash flows
Our cash and cash equivalents during the first six months of 2022 increased by $726 million as follows:
| ($ in millions, unless otherwise stated) | YTD 2022 | YTD 2021 | |||||||||
| Net cash provided by (used for) operating activities | 1,675 | 1,368 | |||||||||
| Net cash (used for) provided by investing activities | (617) | (370) | |||||||||
| Net cash provided by (used for) financing activities | (332) | (360) | |||||||||
| Increase (decrease) in cash and cash equivalents | 726 | 638 |
Cash Flow from Operating Activities
For the first six months of 2022 our operating activities provided $1,675 million in cash. This was primarily the result of net income of $1,349 million, adjustments to reconcile the net income of $723 million and changes in operating assets and liabilities of $(402) million. Adjustments to net income (loss) includes offsetting non-cash items, such as depreciation and amortization of $627 million, share-based compensation of $178 million and changes in deferred taxes of $(98) million.
The change in operating assets and liabilities was attributable to the following:
The $111 million increase in receivables and other current assets for the six months ended July 3, 2022 was mainly driven by the increase in accounts receivable due to the linearity of revenue between the two periods, customer mix, and the related timing of cash collections in the first six months of 2022 compared with the same period in 2021.
The $273 million increase in inventories for the six months ended July 3, 2022 was primarily related to increased production levels as we work to align inventory on hand with the current revenue forecasts.
The $270 million increase in accounts payable and other liabilities for the six months ended July 3, 2022 was primarily related to the increase of trade accounts payable of $210 million as a result of increased demand and timing, $20 million in interest payable due to timing of interest payments, $53 million in income and social tax payables, partially offset by $13 million of other net movements including the non-cash adjustment for capital expenditures and purchased IP.
The $288 million increase in other non-current assets for the six months ended July 3, 2022 was primarily related to prepayments to secure long-term production supply with multiple vendors.
For the first six months of 2021 our operating activities provided $1,368 million in cash. This was primarily the result of net income of $770 million, adjustments to reconcile the net income of $851 million and changes in operating assets and liabilities of $(252) million. Adjustments to net income (loss) includes offsetting non-cash items, such as depreciation and amortization of $646 million, share-based compensation of $184 million and changes in deferred taxes of $12 million.
Cash Flow from Investing Activities
Net cash used for investing activities amounted to $617 million for the first six months of 2022 and principally consisted of the cash outflows for capital expenditures of $548 million, $72 million for the purchase of identified intangible assets and $5 million for the purchase of equipment leased to others.
Net cash used for investing activities amounted to $370 million for the first six months of 2021 and principally consisted of the cash outflows for capital expenditures of $300 million and $72 million for the purchase of identified intangible assets, partly offset by net proceeds of $2 million related to sales and purchases of investments.
Cash Flow from Financing Activities
Net cash used for financing activities was $332 million for the first six months of 2022 compared to net cash provided by financing activities of $360 million for the first six months of 2021, detailed in the table below:
| ($ in millions) | YTD 2022 | YTD 2021 | |||||||||
| Repurchase of long-term debt | (917) | — | |||||||||
| Proceeds from the issuance of long-term debt | 1,496 | 2,000 | |||||||||
| Cash paid for debt issuance costs | (13) | (22) | |||||||||
| Dividends paid to common stockholders | (371) | (260) | |||||||||
| Cash proceeds from exercise of stock options and savings from ESPP | 28 | 31 | |||||||||
| Purchase of treasury shares | (554) | (2,108) | |||||||||
| Other, net | (1) | (1) |
Additional Capital Requirements
Expected working and other capital requirements are described in our Annual Report on Form 10-K for the fiscal year ended December 31, 2021 in Part II, Item 7, “Management’s Discussion and Analysis of Financial Condition and Results of Operations”. At July 3, 2022, other than for changes disclosed in the “Notes to Condensed Consolidated Financial Statements” and “Liquidity and Capital Resources” in this Quarterly Report, there have been no other material changes to our expected working and other capital requirements described in our Annual Report on Form 10-K for the fiscal year ended December 31, 2021.
Information Regarding Guarantors of NXP (unaudited)
Summarized Combined Financial Information for Guarantee of Securities of Subsidiaries
All debt instruments are guaranteed, fully and unconditionally, jointly and severally, by NXP Semiconductors N.V. and issued or guaranteed by NXP USA, Inc., NXP B.V. and NXP LLC, (together, the “Subsidiary Obligors” and together with NXP Semiconductors N.V., the “Obligor Group”). Other than the Subsidiary Obligors, none of the Company’s subsidiaries (together the “Non-Guarantor Subsidiaries”) guarantee the Notes. The Company consolidates the Subsidiary Obligors in its consolidated financial statements and each of the Subsidiary Obligors are wholly owned subsidiaries of the Company.
All of the existing guarantees by the Company rank equally in right of payment with all of the existing and future senior indebtedness of the Obligor Group. There are no significant restrictions on the ability of the Obligor Group to obtain funds from respective subsidiaries by dividend or loan.
The following tables present summarized financial information of the Obligor Group on a combined basis, with intercompany balances and transactions between entities of the Obligor Group eliminated and investments and equity in the earnings of the Non-Guarantor Subsidiaries excluded. The Obligor Group’s amounts due from, amounts due to, and intercompany transactions with Non-Guarantor Subsidiaries have been disclosed below the table, when material.
Summarized Statements of Income
| For the six months ended | |||||
| ($ in millions) | July 3, 2022 | ||||
| Revenue | 3,683 | ||||
| Gross Profit | 1,904 | ||||
| Operating income | 692 | ||||
| Net income | 253 |
Summarized Balance Sheets
| As of | |||||||||||
| ($ in millions) | July 3, 2022 | December 31, 2021 | |||||||||
| Current assets | 3,390 | 2,535 | |||||||||
| Non-current assets | 11,585 | 11,576 | |||||||||
| Total assets | 14,975 | 14,111 | |||||||||
| Current liabilities | 894 | 637 | |||||||||
| Non-current liabilities | 11,531 | 10,792 | |||||||||
| Total liabilities | 12,425 | 11,429 | |||||||||
| Obligor's Group equity | 2,550 | 2,682 | |||||||||
| Total liabilities and Obligor's Group equity | 14,975 | 14,111 |
NXP Semiconductors N.V. is the head of a fiscal unity for the corporate income tax and VAT that contains the most significant Dutch wholly-owned group companies. The Company is therefore jointly and severally liable for the tax liabilities of the tax entity as a whole, and as such the income tax expense of the Dutch fiscal unity has been included in the Net income of the Obligor Group.
The financial information of the Obligor Group includes sales executed through a Non-Guarantor Subsidiary single-billing entity as a sales agent on behalf of an entity in the Obligor Group. The Obligor Group has sales to non-guarantors (for the six months ended July 3, 2022: $365 million). The Obligor Group has amounts due from equity financing (July 3, 2022: $6,584 million; December 31, 2021: $5,167 million) and due to debt financing (July 3, 2022: $3,287 million; December 31, 2021: $3,053 million) with non-guarantor subsidiaries.
Previous: Item 1. Financial Statements · Next: Item 3. Quantitative and Qualitative Disclosures About Market Risk