 filings.tools
NXP Semiconductors 10-Q 2022-10-02
NXPI · CIK 1413447 · Form 10-Q · Period ended October 2, 2022 · Filed November 1, 2022
8 sections, 145K characters. Original on sec.gov · Markdown · JSON
Cover and table of contents
UNITED STATES
SECURITIES AND EXCHANGE COMMISSION
Washington, D.C. 20549
FORM 10-Q
(Mark One)
☒ QUARTERLY REPORT PURSUANT TO SECTION 13 OR 15(d) OF THE SECURITIES EXCHANGE ACT OF 1934
For the quarterly period ended October 2, 2022
or
☐ TRANSITION REPORT PURSUANT TO SECTION 13 OR 15(d) OF THE SECURITIES EXCHANGE ACT OF 1934
For the transition period from to .
Commission File Number: 001-34841
NXP Semiconductors N.V.
(Exact name of registrant as specified in its charter)
| Netherlands | 98-1144352 | |||||||
| (State or other jurisdiction of incorporation or organization) | (I.R.S. employer identification number) | |||||||
| 60 High Tech Campus | 5656 AG | |||||||
| Eindhoven | ||||||||
| Netherlands | ||||||||
| (Address of principal executive offices) | (Zip code) |
| +31 | 40 | 2729999 | |||||||||
| (Registrant’s telephone number, including area code) |
Securities registered pursuant to Section 12(b) of the Act:
| Title of each class | Trading symbol(s) | Name of each exchange on which registered | ||||||
| Common shares, EUR 0.20 par value | NXPI | The Nasdaq Global Select Market |
Indicate by check mark whether the Registrant (1) has filed all reports required to be filed by Section 13 or 15(d) of the Securities Exchange Act of 1934 during the preceding 12 months (or for such shorter period that the Registrant was required to file such reports), and (2) has been subject to such filing requirements for the past 90 days.
Yes ☒ No ☐
Indicate by check mark whether the Registrant has submitted electronically every Interactive Data File required to be submitted pursuant to Rule 405 of Regulation S-T (§232.405 of this chapter) during the preceding 12 months (or for such shorter period that the Registrant was required to submit such files).
Yes ☒ No ☐
Indicate by check mark whether the Registrant is a large accelerated filer, an accelerated filer, a non-accelerated filer, a smaller reporting company, or an emerging growth company. See the definitions of “large accelerated filer,” “accelerated filer,” “smaller reporting company,” and “emerging growth company” in Rule 12b-2 of the Exchange Act.
| Large accelerated filer | ☒ | Accelerated filer | ☐ | ||||||||
| Non-accelerated filer | ☐ | Smaller reporting company | ☐ | ||||||||
| Emerging growth company | ☐ |
If an emerging growth company, indicate by check mark if the Registrant has elected not to use the extended transition period for complying with any new or revised financial accounting standards provided pursuant to Section 13(a) of the Exchange Act. ☐
Indicate by check mark whether the Registrant is a shell company (as defined in Rule 12b-2 of the Exchange Act).
Yes ☐ No ☒
As of October 28, 2022, there were 259,134,862 shares of our common stock, €0.20 par value per share, issued and outstanding.
NXP Semiconductors N.V.
Form 10-Q
For the Fiscal Quarter Ended October 2, 2022
TABLE OF CONTENTS
| Page | ||||||||
| Part I | ||||||||
| Item 1. | Financial Statements | 1 | ||||||
| Item 2. | Management’s Discussion and Analysis of Financial Condition and Results of Operations | 14 | ||||||
| Item 3. | Quantitative and Qualitative Disclosures About Market Risk | 24 | ||||||
| Item 4. | Controls and Procedures | 25 | ||||||
| Part II | ||||||||
| Item 1. | Legal Proceedings | 25 | ||||||
| Item 1A. | Risk Factors | 26 | ||||||
| Item 2. | Unregistered Sales of Equity Securities and Use of Proceeds | 26 | ||||||
| Item 5. | Other Information | 26 | ||||||
| Item 6. | Exhibits | 27 |
PART I — FINANCIAL INFORMATION
Item 1. Financial Statements
CONDENSED CONSOLIDATED STATEMENTS OF OPERATIONS (Unaudited)
($ in millions, unless otherwise stated)
| For the three months ended | For the nine months ended | ||||||||||||||||||||||
| October 2, 2022 | October 3, 2021 | October 2, 2022 | October 3, 2021 | ||||||||||||||||||||
| Revenue | 3,445 | 2,861 | 9,893 | 8,024 | |||||||||||||||||||
| Cost of revenue | (1,478) | (1,278) | (4,267) | (3,664) | |||||||||||||||||||
| Gross profit | 1,967 | 1,583 | 5,626 | 4,360 | |||||||||||||||||||
| Research and development | (548) | (492) | (1,608) | (1,429) | |||||||||||||||||||
| Selling, general and administrative | (289) | (243) | (805) | (699) | |||||||||||||||||||
| Amortization of acquisition-related intangible assets | (131) | (137) | (400) | (456) | |||||||||||||||||||
| Total operating expenses | (968) | (872) | (2,813) | (2,584) | |||||||||||||||||||
| Other income (expense) | 2 | — | 4 | — | |||||||||||||||||||
| Operating income (loss) | 1,001 | 711 | 2,817 | 1,776 | |||||||||||||||||||
| Financial income (expense): | |||||||||||||||||||||||
| Extinguishment of debt | — | — | (18) | — | |||||||||||||||||||
| Other financial income (expense) | (98) | (93) | (313) | (280) | |||||||||||||||||||
| Income (loss) before income taxes | 903 | 618 | 2,486 | 1,496 | |||||||||||||||||||
| Benefit (provision) for income taxes | (149) | (95) | (392) | (200) | |||||||||||||||||||
| Results relating to equity-accounted investees | (4) | 3 | 5 | — | |||||||||||||||||||
| Net income (loss) | 750 | 526 | 2,099 | 1,296 | |||||||||||||||||||
| Less: Net income (loss) attributable to non-controlling interests | 12 | 7 | 34 | 27 | |||||||||||||||||||
| Net income (loss) attributable to stockholders | 738 | 519 | 2,065 | 1,269 | |||||||||||||||||||
| Earnings per share data: | |||||||||||||||||||||||
| Net income (loss) per common share attributable to stockholders in $ | |||||||||||||||||||||||
| Basic | 2.81 | 1.95 | 7.86 | 4.66 | |||||||||||||||||||
| Diluted | 2.79 | 1.91 | 7.80 | 4.57 | |||||||||||||||||||
| Weighted average number of shares of common stock outstanding during the period (in thousands): | |||||||||||||||||||||||
| Basic | 262,180 | 266,557 | 262,620 | 272,314 | |||||||||||||||||||
| Diluted | 264,705 | 271,359 | 264,838 | 277,886 |
See accompanying notes to the Condensed Consolidated Financial Statements
CONDENSED CONSOLIDATED STATEMENTS OF COMPREHENSIVE INCOME
(Unaudited)
($ in millions, unless otherwise stated)
| For the three months ended | For the nine months ended | ||||||||||||||||||||||
| October 2, 2022 | October 3, 2021 | October 2, 2022 | October 3, 2021 | ||||||||||||||||||||
| Net income (loss) | 750 | 526 | 2,099 | 1,296 | |||||||||||||||||||
| Other comprehensive income (loss), net of tax: | |||||||||||||||||||||||
| Change in fair value cash flow hedges | (13) | (2) | (25) | (16) | |||||||||||||||||||
| Change in foreign currency translation adjustment | (78) | (23) | (165) | (56) | |||||||||||||||||||
| Change in net actuarial gain (loss) | 1 | — | — | — | |||||||||||||||||||
| Total other comprehensive income (loss) | (90) | (25) | (190) | (72) | |||||||||||||||||||
| Total comprehensive income (loss) | 660 | 501 | 1,909 | 1,224 | |||||||||||||||||||
| Less: Comprehensive income (loss) attributable to non-controlling interests | 12 | 7 | 34 | 27 | |||||||||||||||||||
| Total comprehensive income (loss) attributable to stockholders | 648 | 494 | 1,875 | 1,197 |
See accompanying notes to the Condensed Consolidated Financial Statements
CONDENSED CONSOLIDATED BALANCE SHEETS (Unaudited)
($ in millions, unless otherwise stated)
| October 2, 2022 | December 31, 2021 | |||||||||||||
| ASSETS | ||||||||||||||
| Current assets: | ||||||||||||||
| Cash and cash equivalents | 3,759 | 2,830 | ||||||||||||
| Accounts receivable, net | 1,012 | 923 | ||||||||||||
| Inventories, net | 1,581 | 1,189 | ||||||||||||
| Other current assets | 351 | 286 | ||||||||||||
| Total current assets | 6,703 | 5,228 | ||||||||||||
| Non-current assets: | ||||||||||||||
| Other non-current assets | 1,940 | 1,346 | ||||||||||||
| Property, plant and equipment, net of accumulated depreciation of $5,055 and $4,676 | 2,971 | 2,635 | ||||||||||||
| Identified intangible assets, net of accumulated amortization of $2,729 and $3,021 | 1,417 | 1,694 | ||||||||||||
| Goodwill | 9,909 | 9,961 | ||||||||||||
| Total non-current assets | 16,237 | 15,636 | ||||||||||||
| Total assets | 22,940 | 20,864 | ||||||||||||
| LIABILITIES AND EQUITY | ||||||||||||||
| Current liabilities: | ||||||||||||||
| Accounts payable | 1,534 | 1,252 | ||||||||||||
| Restructuring liabilities-current | 8 | 25 | ||||||||||||
| Other current liabilities | 1,677 |
Showing the first 8K of 70K characters. Open the full section
Item 2. Management’s Discussion and Analysis of Financial Condition and Results of Operations
This interim Management’s Discussion and Analysis ("MD&A") should be read in conjunction with our consolidated financial statements and notes and the MD&A in our Annual Report on Form 10-K for the year ended December 31, 2021. This discussion contains forward-looking statements that involve a number of risks and uncertainties, including any statements that refer to projections of our future financial performance, our anticipated growth and trends in our businesses, uncertain events or assumptions, and other characterizations of future events or circumstances, including the expected timeline to remediate the identified material weakness in our internal control over financial reporting, the uncertain nature, magnitude, and duration of hostilities stemming from Russia's recent military invasion of the Ukraine, and our response to the current global pandemic and the potential impact the pandemic will have on our operations, liquidity, customers, facilities and supply chain. Such statements are based on our current expectations and could be affected by the uncertainties and risk factors described throughout this filing, and in “Risk Factors” in Part I, Item 1A of our Annual Report on Form 10-K. Our actual results may differ materially from those contained in any forward-looking statements. We undertake no obligation to update any forward-looking statement to reflect subsequent events or circumstances.
Our MD&A is provided in addition to the accompanying consolidated financial statements and notes to assist readers in understanding our results of operations, financial condition and cash flows. MD&A is organized as follows:
-
Overview - Overall analysis of financial and other highlights to provide context for the MD&A
-
Results of Operations - An analysis of our financial results
-
Liquidity and Capital Resources - An analysis of changes in our balance sheets and cash flows
-
Information Regarding Guarantors of NXP - Financial information of the Obligor Group on a combined basis
Overview
| ($ in millions, unless otherwise stated) | Q3 2022 | Q3 2021 | YTD 2022 | YTD 2021 | |||||||||||||||||||
| Revenue | 3,445 | 2,861 | 9,893 | 8,024 | |||||||||||||||||||
| Gross profit | 1,967 | 1,583 | 5,626 | 4,360 | |||||||||||||||||||
| Operating income (loss) | 1,001 | 711 | 2,817 | 1,776 | |||||||||||||||||||
| Cash flow from operating activities | 1,144 | 924 | 2,819 | 2,292 | |||||||||||||||||||
| Total debt | 11,162 | 9,593 | 11,162 | 9,593 | |||||||||||||||||||
| Net debt | 7,403 | 7,290 | 7,403 | 7,290 | |||||||||||||||||||
| Diluted weighted average number of shares outstanding | 264,705 | 271,359 | 264,838 | 277,886 | |||||||||||||||||||
| Diluted net income per share | 2.79 | 1.91 | 7.80 | 4.57 | |||||||||||||||||||
| Dividends per common share | 0.8450 | 0.5625 | 2.5350 | 1.6875 |
Q3 2022 compared to Q3 2021
Revenue for the three months ended October 2, 2022 was $3,445 million compared to $2,861 million for the three months ended October 3, 2021, an increase of $584 million or an increase of 20.4% year-on-year. Revenue growth during the quarter was due to increased volumes of products shipped driven by the continued industry-wide demand for semiconductors across most of the Company’s focused end markets. Additionally, the Company continued to experience the inflationary effects of increased input costs from its suppliers which were passed along to end customers in the form of higher average selling prices.
Our gross profit percentage for the third quarter of 2022 increased from 55.3% in the third quarter of 2021 to 57.1%, primarily from the continued significant acceleration of revenue in the third quarter of 2022 compared to the same period in 2021, which led to improved factory loading, increased manufacturing volumes, and higher sales prices, which were mostly offset by higher input costs.
We continue to generate strong operating cash flows, with $1,144 million in cash flows from operations for the third quarter of 2022. We returned $589 million to our shareholders during the third quarter of 2022. Our cash position at the end of the third quarter of 2022 was $3,759 million.
YTD 2022 compared to YTD 2021
Revenue for the nine months ended October 2, 2022 was $9,893 million compared to $8,024 million for the nine months ended October 3, 2021, an increase of $1,869 million or an increase of 23.3% year-on-year. The increase is attributed to strong demand and inflationary effects of increased input costs from its suppliers which were passed along to end customers in the form of higher average selling prices, across all end markets.
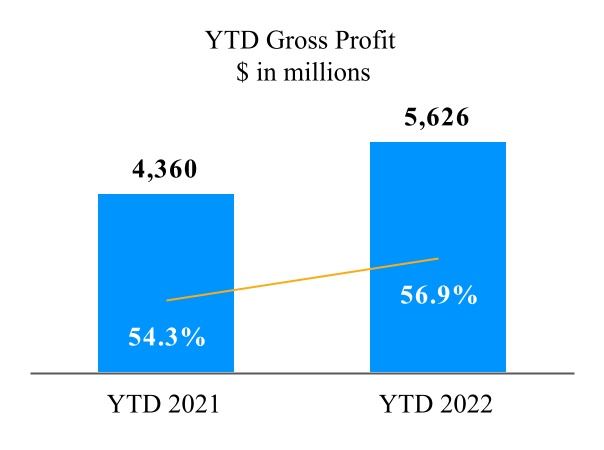
Our gross profit percentage for the nine months ended October 2, 2022 increased from 54.3% for the nine months ended October 3, 2021 to 56.9%, primarily from the continued significant acceleration of revenue in the first nine months of 2022 compared to the same period in 2021, which led to improved factory loading, increased manufacturing volumes, and higher sales prices, which were mostly offset by higher input costs.
Cash flow from operations for the first nine months of 2022 was $2,819 million. Total shareholder return for the first nine months of 2022 was $1,514 million. Our cash position remains solid, with the net proceeds of the $1.5 billion in issued debt in the second quarter of 2022 adding to our cash and cash equivalents.
Results of operations
The following table presents operating income for each of the three and nine month periods ended October 2, 2022 and October 3, 2021, respectively:
| ($ in millions, unless otherwise stated) | Q3 2022 | Q3 2021 | YTD 2022 | YTD 2021 | |||||||||||||||||||
| Revenue | 3,445 | 2,861 | 9,893 | 8,024 | |||||||||||||||||||
| % nominal growth | 20.4 | 26.2 | 23.3 | 31.4 | |||||||||||||||||||
| Gross profit | 1,967 | 1,583 | 5,626 | 4,360 | |||||||||||||||||||
| Research and development | (548) | (492) | (1,608) | (1,429) | |||||||||||||||||||
| Selling, general and administrative | (289) | (243) | (805) | (699) | |||||||||||||||||||
| Amortization of acquisition-related intangible assets | (131) | (137) | (400) | (456) | |||||||||||||||||||
| Other income (expense) | 2 | — | 4 | — | |||||||||||||||||||
| Operating income (loss) | 1,001 | 711 | 2,817 | 1,776 |
Revenue
Q3 2022 compared to Q3 2021
Revenue for the three months ended October 2, 2022 was $3,445 million compared to $2,861 million for the three months ended October 3, 2021, an increase of $584 million or an increase of 20.4% year-on-year, with growth in all of the Company’s four focus end markets.
YTD 2022 compared to YTD 2021
Revenue for the nine months ended October 2, 2022 was $9,893 million compared to $8,024 million for the nine months ended October 3, 2021, an increase of $1,869 million or 23.3%, with growth in all of the Company’s four end markets.
Revenue by end market was as follows:
| ($ in millions, unless otherwise stated) | Q3 2022 | Q3 2021 | Change | YTD 2022 | YTD 2021 | Change | |||||||||||||||||||||||||||||
| Automotive | 1,804 | 1,455 | 24.0 | % | 5,074 | 3,946 | 28.6 | % | |||||||||||||||||||||||||||
| Industrial & IoT | 713 | 607 | 17.5 | % | 2,108 | 1,749 | 20.5 | % | |||||||||||||||||||||||||||
| Mobile | 410 | 345 | 18.8 | % | 1,199 | 1,038 | 15.5 | % | |||||||||||||||||||||||||||
| Communication Infrastructure & Other | 518 | 454 | 14.1 | % | 1,512 | 1,291 | 17.1 | % | |||||||||||||||||||||||||||
| Revenue | 3,445 | 2,861 | 20.4 | % | 9,893 | 8,024 | 23.3 | % |
Revenue by sales channel was as follows:
| ($ in millions, unless otherwise stated) | Q3 2022 | Q3 2021 | Change | YTD 2022 | YTD 2021 | Change | |||||||||||||||||||||||||||||
| Distributors | 1,876 | 1,631 | 15.0 | % | 5,385 | 4,617 | 16.6 | % | |||||||||||||||||||||||||||
| OEM/EMS | 1,525 | 1,191 | 28.0 | % | 4,378 | 3,295 | 32.9 | % | |||||||||||||||||||||||||||
| Other | 44 | 39 | 12.8 | % | 130 | 112 | 16.1 | % | |||||||||||||||||||||||||||
| Revenue | 3,445 | 2,861 | 20.4 | % | 9,893 | 8,024 | 23.3 | % |
Revenue by geographic region, which is based on the customer’s shipped-to location was as follows:
| ($ in millions, unless otherwise stated) | Q3 2022 | Q3 2021 | Change | YTD 2022 | YTD 2021 | Change | |||||||||||||||||||||||||||||
| Greater China and Asia Pacific | 1,923 | 1,653 | 16.3 | % | 5,454 | 4,638 | 17.6 | % | |||||||||||||||||||||||||||
| EMEA (Europe, the Middle East and Africa) | 672 | 536 | 25.4 | % | 1,978 | 1,464 | 35.1 | % | |||||||||||||||||||||||||||
| Americas | 468 | 346 | 35.3 | % | 1,335 | 1,003 | 33.1 | % | |||||||||||||||||||||||||||
| Japan | 200 | 210 | (4.8) | % | 648 | 587 | 10.4 | % | |||||||||||||||||||||||||||
| South Korea | 182 | 116 | 56.9 | % | 478 | 332 | 44.0 | % | |||||||||||||||||||||||||||
| Revenue | 3,445 | 2,861 | 20.4 | % | 9,893 | 8,024 | 23.3 | % |
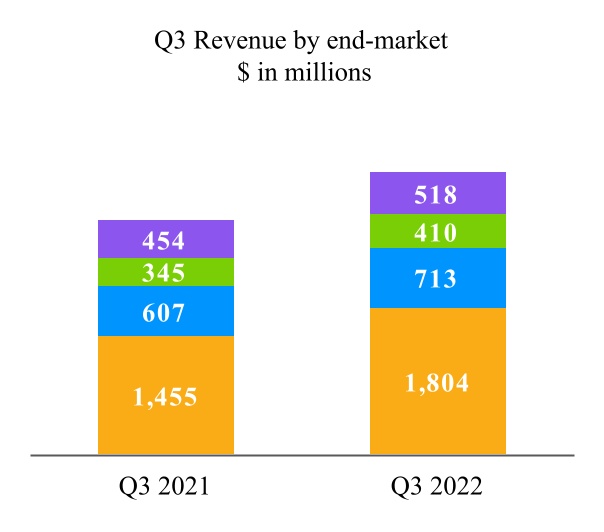
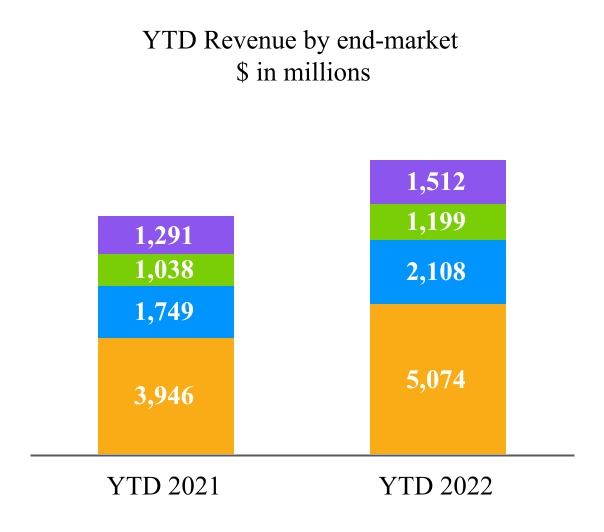
| n | Automotive | n | Mobile | |||||||||||
| n | Industrial IoT | n | Comm Infra & Other |
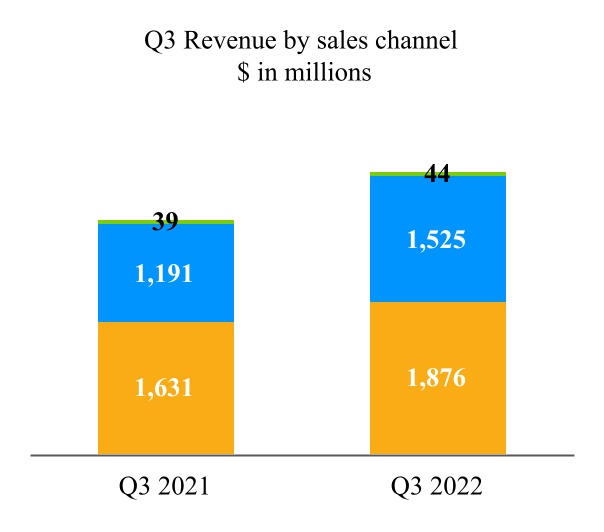
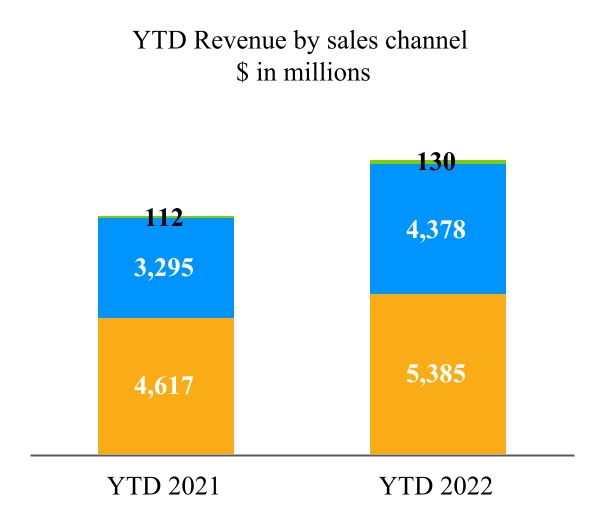
| n | Distributors | n | Other | |||||||||||
| n | OEM/EMS |
Q3 2022 compared to Q3 2021
The increase in revenue is attributed to the combination of ongoing demand, across NXP’s Automotive, Mobile, and the Communications Infrastructure & Other end markets. While trends in the Industrial IoT end market experienced slower demand versus the year ago period. Furthermore, the effects of increased input costs from NXP suppliers which were passed along to our end customers in the form of higher average selling prices across all end markets.
From an end market perspective, the year-on-year growth within the Automotive end market was across the automotive product portfolio in support of the secular shift of electrification, advanced driver safety and assistance, and driver connectivity systems. The growth within the Industrial & IoT market reflects the adoption of our complete secure, connected edge processing solutions which leverage our broad processor portfolio, complimented by connectivity, analog attach and security products. The growth within the Mobile end market was due to ongoing adoption of our secure embed transaction solutions along with the Company’s growth in our advanced analog high-speed interfaces. The growth within the Communication Infrastructure & Other end market was attributable to the network edge equipment, the transit and access solutions, RFID tagging solutions, and cellular base stations. Offsetting these positive growth trends were declines in demand for the Company’s wireless access point solutions, as well as declines in demand for Company’s smart antennae products used in the Android mobile handset market, secure payment, and identification solutions.
When aggregating all end markets together, and reviewing sales channel performance, business transacted through NXP's direct OEM and EMS customers was $1,525 million, an increase of 28.0%. Sales to NXP's third party distribution partners was $1,876 million, an increase of 15.0% versus the third quarter of 2021.
From a geographic perspective, revenue increased across all regions, with the exception of Japan showing a decline within the Automotive end market.
Revenue from the Automotive end market was $1,804 million, an increase of $349 million or 24.0% year-on-year. Within Automotive, customers are focused on the key functional pillars of safety, electrification and improved driver comfort to accelerate competitive differentiation. These broad functional areas are fundamentally enabled by the secular adoption of new and increased levels of semiconductor content, which is layered on top of a strong base of existing electronic content in modern automobiles. The increase in Automotive revenue during the third quarter of 2022 can be attributed to strong growth for advanced analog, automotive processing and radar solutions.
Revenue from the Industrial & IoT end market was $713 million, an increase of $106 million or 17.5% year-on-year. The Industrial & IoT market is driven by the secular trend of multi-market OEMs seeking to enable secure, connected, high performance processing solutions at the edge of the network, whether it is in factory automation, smart building/smart home or the exploding plethora of connected IoT devices. The innovation in this market is being driven by thousands of relatively smaller customers, which NXP effectively services through its extended global distribution channel. During the third quarter of 2022, the year-on-year increase was driven by the demand for the Company’s crossover processors, 32-bit ARM-based microcontrollers, application processors, industrial analog products, IoT connectivity and point-of-sale security solutions.
Revenue from the Mobile end market was $410 million with an increase of $65 million or 18.8% year-on-year. The year-on-year increase was driven by strong adoption of secure mobile wallet solutions and increased demand in our advanced analog high-speed interfaces, which was offset by declines in advanced power systems driven by load switch demand decline. Our mobile customers are primarily serviced through our global distribution channels.
Revenue in the Communication Infrastructure & Other end market was $518 million, an increase of $64 million or 14.1% year-on-year. The Communication Infrastructure & Other end market is an amalgamation of three separate product portfolios, which service multiple end markets, including cellular base stations, the network edge equipment, and the secure access, transit and government sponsored identification market. The growth within the Communication Infrastructure & Other end market was attributable to the network edge equipment, the transit and access solutions, RFID tagging solutions, and cellular base stations. Offsetting these positive growth trends were declines in demand for the Company’s wireless access point solutions, as well as declines in demand for Company’s smart antennae products used in the Android mobile handset market, secure payment, and identification solutions.
YTD 2022 compared to YTD 2021
The increase in revenue is attributed to the combination of strong demand across all of NXP’s end markets, and higher average pricing, which were the result of rising inflationary effects on input costs from NXP suppliers passed along to our end customers.
From an end market perspective, within the automotive end market the year-on-year growth was attributable to advanced analog, automotive processing and radar in support of the secular shift of electrification, advanced driver safety and assistance, and driver connectivity systems. The growth within the Industrial & IoT market reflects the successful continuation of adoption of our complete secure, connected edge processing solutions which leverage our broad processor portfolio, complimented by analog attach, connectivity, and security products. Growth within the Mobile end market was due to ongoing adoption of our secure embed transaction solutions along with the Company’s growth in our advanced analog high-speed interfaces. The growth within the Communication Infrastructure & Other end market was attributable to the network edge equipment, cellular base stations, the transit and access solutions, and RFID tagging solutions. Offsetting these positive growth trends were declines in demand for the Company’s smart antennae products used in the Android mobile handset market, as well as declines in demand for the Company’s wireless access point solutions, and secure payment.
When aggregating all end markets together, and reviewing sales channel performance, business transacted through direct OEM and EMS customers was $4,378 million, an increase of 32.9% versus the year ago period. NXP's third party distribution partners was $5,385 million, an increase of 16.6%.
From a geographic perspective, revenue increased across all regions.
Revenue in the Automotive end market was $5,074 million, an increase of $1,128 million or 28.6% versus the year ago period due to the ongoing demand for our automotive products supporting the secular shift of electrification, advanced driver safety and assistance, and driver connectivity systems.
Revenue in the Industrial & IoT end market was $2,108 million, an increase of $359 million or 20.5% versus the year ago period driven by the continued demand for the Company’s crossover processors and 32-bit ARM-based microcontrollers, industrial analog products, application processors, and IoT connectivity and point-of-sale security solutions.
Revenue in the Mobile end market was $1,199 million, an increase of $161 million or 15.5% versus the year ago period due to strong adoption of secure mobile wallet solutions, and demand for our advanced analog high-speed interfaces, offset by declines in embedded power solutions.
Revenue in the Communication Infrastructure & Other end market was $1,512 million, an increase of $221 million or 17.1% versus the year ago period due to a combination of strength from RF Power products levered to network edge equipment, the secular build-out of 5G base
stations, and the ongoing demand for transit market. Offsetting these positive growth trends were declines in demand for the Company’s smart antennae products used in the Android mobile handset market, as well as declines in demand for wireless access point solutions, and secure payment.
Gross profit
Q3 2022 compared to Q3 2021
Gross profit for the three months ended October 2, 2022 was $1,967 million, or 57.1% of revenue, compared to $1,583 million, or 55.3% of revenue for the three months ended October 3, 2021.The increase of $384 million in gross profit was driven by the significant higher revenue in the third quarter of 2022 compared to the third quarter of 2021, which led to improved factory loading, increased manufacturing volumes, and higher sales prices, which were mostly offset by higher input costs.
YTD 2022 compared to YTD 2021
Gross profit for the nine months ended October 2, 2022 was $5,626 million, or 56.9% of revenue, compared to $4,360 million, or 54.3% of revenue for the nine months ended October 3, 2021. The increase of $1,266 million was primarily driven by the significant higher revenue in the first nine months of 2022 compared to the first nine months of 2021, which led to improved factory loading, increased manufacturing volumes, and higher sales prices, which were mostly offset by higher input costs.

Operating expenses
Q3 2022 compared to Q3 2021
Operating expenses for the three months ended October 2, 2022 totaled $968 million, or 28.1% of revenue, compared to $872 million, or 30.5% of revenue, for the three months ended October 3, 2021.
YTD 2022 compared to YTD 2021
Operating expenses for the nine months ended October 2, 2022 totaled $2,813 million, or 28.4% of revenue, compared to $2,584 million, or 32.2% of revenue, for the nine months ended October 3, 2021.
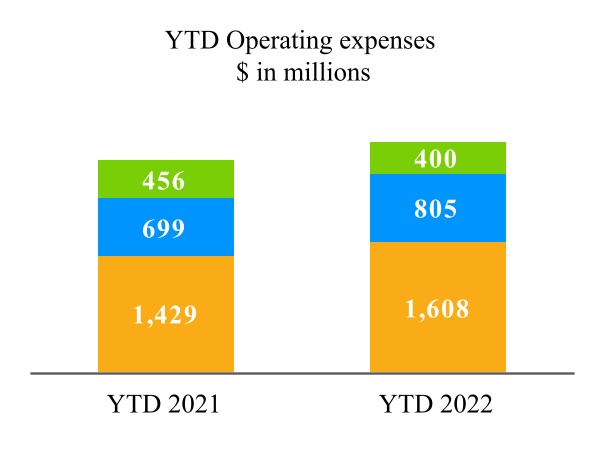
The following table below presents the composition of operating expenses by line item in the statement of operations:
| ($ in millions, unless otherwise stated) | Q3 2022 | Q3 2021 | YTD 2022 | YTD 2021 | |||||||||||||||||||
| Research and development | 548 | 492 | 1,608 | 1,429 | |||||||||||||||||||
| Selling, general and administrative | 289 | 243 | 805 | 699 | |||||||||||||||||||
| Amortization of acquisition-related intangible assets | 131 | 137 | 400 | 456 | |||||||||||||||||||
| Total operating expenses | 968 | 872 | 2,813 | 2,584 |

| n | R&D | n | SG&A | n | Amortization acquisition-related |
Q3 2022 compared to Q3 2021
The increase in operating expenses was a result of the following items:
Research and development (R&D) costs primarily consist of engineer salaries and wages (including share based compensation and other variable compensation), engineering related costs (including outside services, fixed-asset, IP and other licenses related costs), shared service center costs and other pre-production related expenses. R&D costs for the three months ended October 2, 2022 increased by $56 million, or 11.4%, when compared to the three months ended October 3, 2021 mainly driven by:
+ higher personnel-related costs, including variable compensation costs;
+ higher pre-production related expenses;
+ higher professional services; and
+ higher travel expense.
Selling, general and administrative (SG&A) costs primarily consist of personnel salaries and wages (including share based compensation and other variable compensation), communication and IT related costs, fixed-asset related costs and sales and marketing costs (including travel expenses). SG&A costs for the three months ended October 2, 2022 increased by $46 million, or 18.9%, when compared to the three months ended October 3, 2021 mainly due to:
+ higher personnel-related costs, including variable compensation costs;
+ higher professional services;
+ higher legal expense; and
+ higher travel expense.
Amortization of acquisition-related intangible assets decreased by $6 million, or 4.4%, when compared to the three months ended October 3, 2021 driven by:
- certain intangibles became fully amortized during 2021.
YTD 2022 compared to YTD 2021
The increase in operating expenses was a result of the following items:
Research and development (R&D) costs primarily consist of engineer salaries and wages (including share based compensation and other variable compensation), engineering related costs (including outside services, fixed-asset, IP and other licenses related costs), shared service center costs and other pre-production related expenses. R&D costs for the nine months ended October 2, 2022 increased by $179 million, or 12.5%, when compared to the nine months ended October 3, 2021 driven by:
+ higher personnel-related costs, including variable compensation costs;
+ higher pre-production related expenses; and
+ higher professional services .
Selling, general and administrative (SG&A) costs primarily consist of personnel salaries and wages (including share based compensation and other variable compensation), communication and IT related costs, fixed-asset related costs and sales and marketing costs (including travel expenses). SG&A costs for the nine months ended October 2, 2022 increased by $106 million, or 15.2%, when compared to the nine months ended October 3, 2021 mainly due to:
+ higher legal expense;
+ higher professional services;
+ higher travel expense; and
+ higher IT related expenses.
Amortization of acquisition-related intangible assets decreased by $56 million, or 12.3%, when compared to the nine months ended October 3, 2021 driven by:
- an impairment charge in Q1 2021 as a result of the discontinuation of an IPR&D project; and
- certain intangibles became fully amortized during 2021.
Financial income (expense)
The following table presents the details of financial income and expenses:
| ($ in millions, unless otherwise stated) | Q3 2022 | Q3 2021 | YTD 2022 | YTD 2021 | |||||||||||||||||||
| Interest income | 21 | 1 | 29 | 3 | |||||||||||||||||||
| Interest expense | (109) | (96) | (319) | (273) | |||||||||||||||||||
| Total interest expense, net | (88) | (95) | (290) | (270) | |||||||||||||||||||
| Extinguishment of debt | — | — | (18) | — | |||||||||||||||||||
| Foreign exchange rate results | (1) | 3 | 2 | 3 | |||||||||||||||||||
| Miscellaneous financing costs/income and other, net | (9) | (1) | (25) | (13) | |||||||||||||||||||
| Total other financial income (expense) | (10) | 2 | (41) | (10) | |||||||||||||||||||
| Total | (98) | (93) | (331) | (280) |
Q3 2022 compared to Q3 2021
Financial income (expense) was an expense of $98 million in the third quarter of 2022 compared to an expense of $93 million in the third quarter of 2021. The change in financial income (expense) is primarily attributable to an increase in interest expense as a result of the net increase in debt. Higher interest rates resulted in an interest income increase in the third quarter of 2022. Miscellaneous cost mainly increased due to fair value adjustments in equity accounted investees.
YTD 2022 compared to YTD 2021
Financial income (expense) was an expense of $331 million in the first nine months of 2022 compared to an expense of $280 million in the first nine months of 2021. The change in financial income (expense) is primarily attributable to an increase in interest expense as a result of the net increase in debt, and debt extinguishment costs incurred in the second quarter of 2022. Higher interest rates resulted in an interest income increase in the first nine months of of 2022. Miscellaneous cost mainly increased due to fair value adjustments in equity accounted investees.
Benefit (provision) for income taxes
Q3 2022 compared to Q3 2021
Our provision for income taxes was $149 million (16.5% effective tax rate) for the third quarter of 2022 compared to a provision for income taxes of $95 million (15.4% effective tax rate) for the third quarter of 2021. The increase in the income tax expense was due to higher income before income taxes as a result of the improved operational performance of the Company, which was partly offset by an increase in tax incentives also taking into account the effect of specific US tax law that became effective as from 2022. In addition to this, there is a higher tax expense in the third quarter of 2022 compared to the same period in 2021 due to unfavorable foreign currency-effects and an excess tax benefit.
YTD 2022 compared to YTD 2021
Our provision for income taxes for the first nine months of 2022 was $392 million (15.8% effective tax rate) compared to a provision for income taxes of $200 million) (13.4% effective tax rate) for the first nine months of 2021. The increase in the income tax expense was due to higher income before income taxes as a result of the improved operational performance of the Company which was partly offset by an increase in tax incentives also taking into account the effect of specific US tax law that became effective as from 2022. In addition to this, there is a higher tax expense in the first nine months of 2022 compared to the same period in 2021 due to unfavorable foreign currency effects in 2022 and favorable items in 2021 related to changes in estimates of prior positions, an excess tax benefit and a net change in the valuation allowance that led to a lower tax expense.
Net income (loss)
The following table presents the composition of net income for the periods reported:
| ($ in millions, unless otherwise stated) | Q3 2022 | Q3 2021 | YTD 2022 | YTD 2021 | |||||||||||||||||||
| Operating income (loss) | 1,001 | 711 | 2,817 | 1,776 | |||||||||||||||||||
| Financial income (expense) | (98) | (93) | (331) | (280) | |||||||||||||||||||
| Benefit (provision) for income taxes | (149) | (95) | (392) | (200) | |||||||||||||||||||
| Results relating to equity-accounted investees | (4) | 3 | 5 | — | |||||||||||||||||||
| Net income (loss) | 750 | 526 | 2,099 | 1,296 |
Liquidity and Capital Resources
We derive our liquidity and capital resources primarily from our cash flows from operations. We continue to generate strong positive operating cash flows. At the end of the third quarter of 2022, our cash balance was $3,759 million, an increase of $929 million compared to December 31, 2021. Taking into account the available amount of the Unsecured Revolving Credit Facility of $2,500 million, we had access to $6,259 million of liquidity as of October 2, 2022.
We currently use cash to fund operations, meet working capital requirements, for capital expenditures and for potential common stock repurchases, dividends and strategic investments. Based on past performance and current expectations, we believe that our current available sources of funds (including cash and cash equivalents, RCF Agreement of $2.5 billion, plus anticipated cash generated from operations) will be adequate to finance our operations, working capital requirements, capital expenditures and potential dividends for at least the next twelve months. Our capital expenditures were $830 million in the first nine months of 2022, compared to $501 million in the first nine months of 2021. During the nine month period ended October 2, 2022, we repurchased 5.2 million shares of our common stock pursuant to our share buyback programs at a weighted average price of $184.66 per share for $955 million in cash and payables.
Our total debt amounted to $11,162 million as of Q3 2022, an increase of $590 million compared to December 31, 2021 ($10,572 million). On May 16, 2022, NXP issued $500 million aggregate principal amount of 4.400% Senior Notes due in 2027 (the “4.400% 2027 Notes”) and $1 billion aggregate principal amount of 5.000% Senior Notes due in 2033 (the “2033 Notes”). The net proceeds of the 4.400% 2027 Notes, together with cash on hand, has been used to redeem the $900 million aggregate principal amount of outstanding dollar-denominated 4.625% Senior Unsecured Notes due 2023 in accordance with the terms of the indenture. NXP will allocate an amount equal to the net proceeds of the offering of the 2033 Notes to the financing of, in whole or in part, one or more eligible green projects. Pending allocation, NXP will temporarily hold the remaining net proceeds of the 2033 Notes as cash and other short-term securities or use for general corporate purposes, which may include capital expenditures, short-term debt repayment or equity buyback transactions.
Revolving Credit Facility
On August 26, 2022, NXP B.V., together with NXP Funding LLC, amended and restated its revolving credit agreement entered into on June 11, 2019. The amended and restated revolving credit agreement provides for $2.5 billion of senior unsecured revolving credit commitments and is scheduled to mature on August 26, 2027.
Exchange Offers
In connection with the sale of (i) NXP B.V.’s and NXP Funding LLC’s 4.875% Senior Notes due 2024 (the “2024 Notes”), 5.350% Senior Notes due 2026 (the “5.350% 2026 Notes”) and 5.550% Senior Notes due 2028 (the “2028 Notes”) and (ii) NXP B.V.’s, NXP Funding LLC’s and NXP USA Inc.’s 2.700% Senior Notes due 2025 (the “2025 Notes”), 3.875% Senior Notes due 2026 (the “3.875% 2026 Notes”), 3.150% Senior Notes due 2027 (the “3.150% 2027 Notes”), 4.300% Senior Notes due 2029 (the “2029 Notes”), 3.400% Senior Notes due 2030 (the “2030 Notes”), 2.500% Senior Notes due 2031 (the “2031 Notes”), 2.650% Senior Notes due 2032 (the “2032 Notes”), 3.250% Senior Notes due 2041 (the “2041 Notes”), 3.125% Senior Notes due 2042 (the “2042 Notes”) and 3.250% Senior Notes due 2051 (the “2051 Notes”), which we collectively refer to as the “Notes”, the issuers of the Notes (the “Issuers”) entered into registration rights agreements pursuant to which the Issuers agreed, among other things, to use commercially reasonable efforts to file an exchange offer registration statement to exchange the Notes for new issues of substantially identical debt securities registered under the U.S. Securities Act of 1933 (the “Exchange Offers”).
On April 14, 2022, the registration statements on Form S-4 filed by the Issuers were declared effective by the SEC, registering the Exchange Offers. The Exchange Offers expired on May 16, 2022. Any outstanding Notes that were not tendered for exchange in the Exchange Offers remain outstanding and continue to accrue interest and are entitled to the rights and benefits that such holders have under the indentures related to such outstanding Notes, except for any rights under the applicable registration rights agreement which terminated upon consummation of the Exchange Offers. This exchange had no impact on our financial position, result of operations or cash flows.
At October 2, 2022, our cash balance was $3,759 million of which $215 million was held by SSMC, our consolidated joint venture company with TSMC. Under the terms of our joint venture agreement with TSMC, a portion of this cash can be distributed by way of a dividend to us, but 38.8% of the dividend will be paid to our joint venture partner.
Cash flows
Our cash and cash equivalents during the first nine months of 2022 increased by $951 million (excluding the effect of changes in exchange rates on our cash position of $(22) million) as follows:
| ($ in millions, unless otherwise stated) | YTD 2022 | YTD 2021 | |||||||||
| Net cash provided by (used for) operating activities | 2,819 | 2,292 | |||||||||
| Net cash (used for) provided by investing activities | (977) | (618) | |||||||||
| Net cash provided by (used for) financing activities | (891) | (1,640) | |||||||||
| Increase (decrease) in cash and cash equivalents | 951 | 34 |
Cash Flow from Operating Activities
For the first nine months of 2022 our operating activities provided $2,819 million in cash. This was primarily the result of net income of $2,099 million, adjustments to reconcile the net income of $1,043 million and changes in operating assets and liabilities of $(337) million. Adjustments to net income (loss) includes offsetting non-cash items, such as depreciation and amortization of $948 million, share-based compensation of $267 million and changes in deferred taxes of $(196) million.
The change in operating assets and liabilities was attributable to the following:
The $165 million increase in receivables and other current assets for the nine months ended October 2, 2022 was mainly driven by the increase in accounts receivable due to the linearity of revenue between the two periods, customer mix, and the related timing of cash collections in the first nine months of 2022 compared with the same period in 2021.
The $392 million increase in inventories for the nine months ended October 2, 2022 was primarily related to increased production levels as we work to align inventory on hand with the current revenue forecasts.
The $545 million increase in accounts payable and other liabilities for the nine months ended October 2, 2022 was primarily related to the increase of trade accounts payable of $282 million as a result of increased demand and timing, $68 million in interest payable due to timing of interest payments, $145 million in income and social tax payables related to regulatory changes, and $51 million related to accruals for employee compensation; partially offset by $1 million of other net movements including the non-cash adjustment for capital expenditures and purchased IP.
The $325 million increase in other non-current assets for the nine months ended October 2, 2022 was primarily related to prepayments to secure long-term production supply with multiple vendors.
For the first nine months of 2021 our operating activities provided $2,292 million in cash. This was primarily the result of net income of $1,296 million, adjustments to reconcile the net income of $1,227 million and changes in operating assets and liabilities of $(221) million. Adjustments to net income (loss) includes offsetting non-cash items, such as depreciation and amortization of $952 million, share-based compensation of $265 million and changes in deferred taxes of $6 million.
Cash Flow from Investing Activities
Net cash used for investing activities amounted to $977 million for the first nine months of 2022 and principally consisted of the cash outflows for capital expenditures of $830 million, $122 million for the purchase of identified intangible assets and $27 million for the net purchase of interests of businesses.
Net cash used for investing activities amounted to $618 million for the first nine months of 2021 and principally consisted of the cash outflows for capital expenditures of $501 million and $99 million for the purchase of identified intangible assets, $14 million for the purchase of equipment leased to others, $17 million for the net purchase of interests of businesses, partly offset by $7 million of insurance recoveries received for equipment damage.
Cash Flow from Financing Activities
Net cash used for financing activities was $891 million for the first nine months of 2022 compared to net cash provided by financing activities of $1,640 million for the first nine months of 2021, detailed in the table below:
| ($ in millions) | YTD 2022 | YTD 2021 | |||||||||
| Repurchase of long-term debt | (917) | — | |||||||||
| Proceeds from the issuance of long-term debt | 1,496 | 2,000 | |||||||||
| Cash paid for debt issuance costs | (13) | (22) | |||||||||
| Dividends paid to common stockholders | (594) | (412) | |||||||||
| Cash proceeds from exercise of stock options and savings from ESPP | 58 | 60 | |||||||||
| Purchase of treasury shares | (920) | (3,265) | |||||||||
| Other, net | (1) | (1) |
Additional Capital Requirements
Expected working and other capital requirements are described in our Annual Report on Form 10-K for the fiscal year ended December 31, 2021 in Part II, Item 7, “Management’s Discussion and Analysis of Financial Condition and Results of Operations”. At October 2, 2022, other than for changes disclosed in the “Notes to Condensed Consolidated Financial Statements” and “Liquidity and Capital Resources” in this Quarterly Report, there have been no other material changes to our expected working and other capital requirements described in our Annual Report on Form 10-K for the fiscal year ended December 31, 2021.
Information Regarding Guarantors of NXP (unaudited)
Summarized Combined Financial Information for Guarantee of Securities of Subsidiaries
All debt instruments are guaranteed, fully and unconditionally, jointly and severally, by NXP Semiconductors N.V. and issued or guaranteed by NXP USA, Inc., NXP B.V. and NXP LLC, (together, the “Subsidiary Obligors” and together with NXP Semiconductors N.V., the “Obligor Group”). Other than the Subsidiary Obligors, none of the Company’s subsidiaries (together the “Non-Guarantor Subsidiaries”) guarantee the Notes. The Company consolidates the Subsidiary Obligors in its consolidated financial statements and each of the Subsidiary Obligors are wholly owned subsidiaries of the Company.
All of the existing guarantees by the Company rank equally in right of payment with all of the existing and future senior indebtedness of the Obligor Group. There are no significant restrictions on the ability of the Obligor Group to obtain funds from respective subsidiaries by dividend or loan.
The following tables present summarized financial information of the Obligor Group on a combined basis, with intercompany balances and transactions between entities of the Obligor Group eliminated and investments and equity in the earnings of the Non-Guarantor Subsidiaries excluded. The Obligor Group’s amounts due from, amounts due to, and intercompany transactions with Non-Guarantor Subsidiaries have been disclosed below the table, when material.
Summarized Statements of Income
| For the nine months ended | |||||
| ($ in millions) | October 2, 2022 | ||||
| Revenue | 5,731 | ||||
| Gross Profit | 2,938 | ||||
| Operating income | 1,115 | ||||
| Net income | 452 |
Summarized Balance Sheets
| As of | |||||||||||
| ($ in millions) | October 2, 2022 | December 31, 2021 | |||||||||
| Current assets | 3,617 | 2,535 | |||||||||
| Non-current assets | 11,572 | 11,576 | |||||||||
| Total assets | 15,189 | 14,111 | |||||||||
| Current liabilities | 1,057 | 637 | |||||||||
| Non-current liabilities | 11,532 | 10,792 | |||||||||
| Total liabilities | 12,589 | 11,429 | |||||||||
| Obligor's Group equity | 2,600 | 2,682 | |||||||||
| Total liabilities and Obligor's Group equity | 15,189 | 14,111 |
NXP Semiconductors N.V. is the head of a fiscal unity for the corporate income tax and VAT that contains the most significant Dutch wholly-owned group companies. The Company is therefore jointly and severally liable for the tax liabilities of the tax entity as a whole, and as such the income tax expense of the Dutch fiscal unity has been included in the Net income of the Obligor Group.
The financial information of the Obligor Group includes sales executed through a Non-Guarantor Subsidiary single-billing entity as a sales agent on behalf of an entity in the Obligor Group. The Obligor Group has sales to non-guarantors (for the nine months ended October 2, 2022: $582 million). The Obligor Group has amounts due from equity financing (October 2, 2022: $5,051 million; December 31, 2021: $5,167 million) and due to debt financing (October 2, 2022: $2,123 million; December 31, 2021: $3,053 million) with non-guarantor subsidiaries.
Item 3. Quantitative and Qualitative Disclosures About Market Risk
There have been no material changes to the Company’s market risk during the first nine months of 2022. For a discussion of the Company’s exposure to market risk, refer to the Company’s market risk disclosures set forth in Part II, Item 7A, “Quantitative and Qualitative Disclosures About Market Risk” in our Annual Report on Form 10-K for the year ended December 31, 2021.
Item 4. Controls and Procedures
Evaluation of Disclosure Controls and Procedures
Our management, with the participation of the Chief Executive Officer and Chief Financial Officer (Certifying Officers), evaluated the effectiveness of the Company's disclosure controls and procedures (as defined in Rules 13a-15(e) or 15d-15(e) promulgated under the Securities Exchange Act of 1934, as amended) on October 2, 2022. Based on that evaluation, the Certifying Officers concluded the Company's disclosure controls and procedures were not effective as of such date due to a material weakness in internal control over financial reporting that was disclosed in our Annual Report on Form 10-K for the fiscal year ended December 31, 2021.
Ongoing Remediation of Previously Identified Material Weakness
As previously described in Part II, Item 9A of our Annual Report on Form 10-K for the fiscal year ended December 31, 2021, we are implementing measures designed to ensure that control deficiencies contributing to the previously disclosed material weakness are remediated, such that these controls are designed, implemented, and operating effectively. These remediation actions are ongoing, whereas we have expanded our controls or control designs based on updated enhanced risk assessments, put in place policies and implemented training programs, expanded our team and engaged an advisor, and have enhanced both our reporting and our internal quality review on control execution. The remediation actions, including those listed above, remain in process where further modifications are necessary to address the material weakness. We expect these changes to materially improve our internal controls.
The weakness will not be considered remediated until the applicable controls operate for a sufficient period of time and management has concluded, through testing, that these controls are operating effectively. Management believes the remediation of this material weakness will be completed prior to the end of fiscal 2022. However, there is no assurance as to when such remediation will be completed.
Changes in Internal Control Over Financial Reporting
As noted above, the Company has been implementing measures to remediate the material weakness in our internal control over financial reporting. Other than the remediation efforts underway, there were no changes in the Company's internal control over financial reporting during the three month period ended October 2, 2022, which were identified in connection with management's evaluation required by paragraph (d) of Rules 13a-15 and 15d-15 under the Exchange Act that have materially affected, or are reasonably likely to materially affect, our internal control over financial reporting.
PART II — OTHER INFORMATION
Item 1. Legal Proceedings
Not applicable.
Item 1A. Risk Factors
Our global business operations expose us to international business risks that could adversely affect our business
If any of the following international business risks were to materialize or become worse, they could have a material adverse effect on our business, financial condition and results of operations:
-
negative economic developments in economies around the world and the instability of governments and international trade arrangements, such as the increase of barriers to international trade including the imposition of tariffs on imports by the United States and China, the withdrawal of the United Kingdom from the European Union, enhanced export controls on certain products and sanctions on certain industry sectors and parties in Russia and the sovereign debt crisis in certain European countries;
-
social and political instability in a number of countries around the world, including continued hostilities and civil unrest in the Middle East and the Ukraine. The instability may have a negative effect on our business, financial condition and operations via our customers and global supply chain and volatility in energy prices and the financial markets;
-
potential terrorist attacks;
-
epidemics and pandemics, such as the coronavirus outbreak, which may adversely affect our workforce, as well as our suppliers and customers;
-
adverse changes in government policies, especially those affecting trade and investment;
-
volatility in foreign currency exchange rates, in particular with respect to the U.S. dollar, and transfer restrictions, in particular in China; and
-
threats that our operations or property could be subject to nationalization and expropriation.
In addition, Russia’s recent invasion of Ukraine has led to sanctions, export controls and other penalties being levied by the United States, European Union and other countries against Russia, Belarus, the Crimea Region of Ukraine, the so-called Donetsk People’s Republic, and the so-called Luhansk People’s Republic. Additional potential sanctions and penalties have also been proposed and/or threatened. Russian military actions and the resulting sanctions could adversely affect the global economy and financial markets. Any Russian response could also disrupt commercial and financial transactions. Further, conflict between Ukraine and Russia could adversely impact the global supply chain, disrupt our operations, or negatively impact the demand for our products in our primary end markets. Any such disruption could result in an adverse impact to our financial results.
For a description of other applicable risk factors, please refer to Part I, Item 1A: “Risk Factors” of our Annual Report on Form 10-K for the year ended December 31, 2021.
Item 2. Unregistered Sales of Equity Securities and Use of Proceeds
Purchases of Equity Securities by the Issuer and Affiliated Purchasers
In January 2022, the board of directors of NXP (the “Board”) approved a new $2 billion 2022 share repurchase program. The new $2 billion share repurchase authorization is in addition to the $4 billion 2021 share repurchase program previously authorized by the Board. In addition, the Company purchases shares from participants in the Company’s equity programs who trade shares as trade for taxes.
The following share repurchase activity occurred under these programs during the three months ended October 2, 2022:
| Period | Total Number of Shares Purchased | Average Price Paid per Share | Number of Shares Purchased as Part of Publicly Announced Buy Back Programs | Maximum Number of Shares That May Yet Be Purchased Under the Buy Back Program | Number of Shares Purchased as Trade for Tax (1) | ||||||||||||||||||||||||
| July 4, 2022 – August 7, 2022 | 17,125 | $181.53 | — | 17,663,112 | 17,125 | ||||||||||||||||||||||||
| August 8, 2022 – September 4, 2022 | 655,429 | $164.34 | 655,410 | 19,095,814 | 19 | ||||||||||||||||||||||||
| September 5, 2022 – October 2, 2022 | 1,828,747 | $158.25 | 1,828,747 | 19,060,244 | — | ||||||||||||||||||||||||
| Total | 2,501,301 | 2,484,157 | 17,144 |
(1) Reflects shares surrendered by participants to satisfy tax withholding obligations in connection with the Company's equity programs.
Item 5. Other Information
Not applicable.
Item 6. Exhibits
| Exhibit Number | Exhibit Description | |||||||||||||
| 3.1 | Articles of Association of NXP Semiconductors N.V. dated June 9, 2020 (incorporated by reference to Exhibit 3.1 to the Company’s Quarterly Report on Form 10-Q of NXP Semiconductors N.V., filed on July 28, 2020) | |||||||||||||
| 10.1 | Amended and Restated Revolving Credit Agreement, dated as of August 26, 2022, among NXP B.V., NXP Funding LLC, the several lenders from time to time parties thereto, and Barclays Bank PLC, as administrative agent (incorporated by reference to Exhibit 10.1 to the Company’s Current Report on Form 8-K of NXP Semiconductors N.V. filed on August 29, 2022). | |||||||||||||
| 10.2 | Amended and Restated Guaranty Agreement, dated as of August 26, 2022, among NXP Semiconductors N.V., NXP USA, Inc. and Barclays Bank PLC, as administrative agent (incorporated by reference to Exhibit 10.2 to the Company’s Current Report on Form 8-K of NXP Semiconductors N.V. filed on August 29, 2022). | |||||||||||||
| 10.3*+ | Form of Performance Restricted Stock Unit Award Agreement | |||||||||||||
| 31.1* | Rule 13a-14(a) / 15d-14(a) Certification of Chief Executive Officer | |||||||||||||
| 31.2* | Rule 13a-14(a) / 15d-14(a) Certification of Chief Financial Officer | |||||||||||||
| 32.1* | Section 1350 Certifications of Chief Executive Officer and Chief Financial Officer | |||||||||||||
| 101 | The following materials from the Company’s Quarterly Report on Form 10-Q for the quarter ended October 2, 2022, formatted in iXBRL (Inline eXtensible Business Reporting Language): (i) Condensed Consolidated Statements of Operations for the three and nine months ended October 2, 2022 and October 3, 2021; (ii) Condensed Consolidated Statements of Comprehensive Income for the three and nine months ended October 2, 2022 and October 3, 2021; (iii) Condensed Consolidated Balance Sheets as of October 2, 2022 and December 31, 2021; (iv) Condensed Consolidated Statements of Cash Flows for the nine months ended October 2, 2022 and October 3, 2021; (v) Condensed Consolidated Statements of Changes in Equity for the three and nine months ended October 2, 2022 and October 3, 2021; and (vi) Notes to the Unaudited Condensed Consolidated Financial Statements. | |||||||||||||
| 104 | Cover Page Interactive Data File (formatted as Inline XBRL and contained in Exhibit 101). |
| * | Filed or furnished herewith. | ||||
| + | Indicates management contract or compensatory plan or arrangement. | ||||
SIGNATURE
Pursuant to the requirements of the Securities Exchange Act of 1934, the registrant has duly caused this report to be signed on its behalf by the undersigned, thereunto duly authorized.
Date: November 1, 2022
| NXP Semiconductors N.V. | |||||
| /s/ William J. Betz | |||||
| Name: William J. Betz, CFO | |||||
Exhibit 31.1
CERTIFICATION
I, Kurt Sievers, certify that:
1.I have reviewed this quarterly report on Form 10-Q of NXP Semiconductors N.V.;
2.Based on my knowledge, this report does not contain any untrue statement of a material fact or omit to state a material fact necessary to make the statements made, in light of the circumstances under which such statements were made, not misleading with respect to the period covered by this report;
3.Based on my knowledge, the financial statements, and other financial information included in this report, fairly present in all material respects the financial condition, results of operations and cash flows of the Registrant as of, and for, the periods presented in this report;
4.The Registrant’s other certifying officer and I are responsible for establishing and maintaining disclosure controls and procedures (as defined in Exchange Act Rules 13a-15(e) and 15d-15(e)) and internal control over financial reporting (as defined in Exchange Act Rules 13a-15(f) and 15d-15(f)) for the Registrant and have:
a)Designed such disclosure controls and procedures, or caused such disclosure controls and procedures to be designed under our supervision, to ensure that material information relating to the Registrant, including its consolidated subsidiaries, is made known to us by others within those entities, particularly during the period in which this report is being prepared;
b)Designed such internal control over financial reporting, or caused such internal control over financial reporting to be designed under our supervision, to provide reasonable assurance regarding the reliability of financial reporting and the preparation of financial statements for external purposes in accordance with generally accepted accounting principles;
c)Evaluated the effectiveness of the Registrant’s disclosure controls and procedures and presented in this report our conclusions about the effectiveness of the disclosure controls and procedures, as of the end of the period covered by this report based on such evaluation; and
d)Disclosed in this report any change in the Registrant’s internal control over financial reporting that occurred during the Registrant’s most recent fiscal quarter (the Registrant’s fourth fiscal quarter in the case of an annual report) that has materially affected, or is reasonably likely to materially affect, the Registrant’s internal control over financial reporting; and
5.The Registrant’s other certifying officer and I have disclosed, based on our most recent evaluation of internal control over financial reporting, to the Registrant’s auditors and the audit committee of the Registrant’s board of directors (or persons performing the equivalent functions):
a)All significant deficiencies and material weaknesses in the design or operation of internal control over financial reporting which are reasonably likely to adversely affect the Registrant’s ability to record, process, summarize, and report financial information; and
b)Any fraud, whether or not material, that involves management or other employees who have a significant role in the Registrant’s internal control over financial reporting.
Date: November 1, 2022
| By: | /s/ Kurt Sievers | |||||||
| Kurt Sievers | ||||||||
| President & Chief Executive Officer |
Exhibit 31.2
CERTIFICATION
I, William J. Betz, certify that:
1.I have reviewed this quarterly report on Form 10-Q of NXP Semiconductors N.V.;
2.Based on my knowledge, this report does not contain any untrue statement of a material fact or omit to state a material fact necessary to make the statements made, in light of the circumstances under which such statements were made, not misleading with respect to the period covered by this report;
3.Based on my knowledge, the financial statements, and other financial information included in this report, fairly present in all material respects the financial condition, results of operations and cash flows of the Registrant as of, and for, the periods presented in this report;
4.The Registrant’s other certifying officer and I are responsible for establishing and maintaining disclosure controls and procedures (as defined in Exchange Act Rules 13a-15(e) and 15d-15(e)) and internal control over financial reporting (as defined in Exchange Act Rules 13a-15(f) and 15d-15(f)) for the Registrant and have:
a)Designed such disclosure controls and procedures, or caused such disclosure controls and procedures to be designed under our supervision, to ensure that material information relating to the Registrant, including its consolidated subsidiaries, is made known to us by others within those entities, particularly during the period in which this report is being prepared;
b)Designed such internal control over financial reporting, or caused such internal control over financial reporting to be designed under our supervision, to provide reasonable assurance regarding the reliability of financial reporting and the preparation of financial statements for external purposes in accordance with generally accepted accounting principles;
c)Evaluated the effectiveness of the Registrant’s disclosure controls and procedures and presented in this report our conclusions about the effectiveness of the disclosure controls and procedures, as of the end of the period covered by this report based on such evaluation; and
d)Disclosed in this report any change in the Registrant’s internal control over financial reporting that occurred during the Registrant’s most recent fiscal quarter (the Registrant’s fourth fiscal quarter in the case of an annual report) that has materially affected, or is reasonably likely to materially affect, the Registrant’s internal control over financial reporting; and
5.The Registrant’s other certifying officer and I have disclosed, based on our most recent evaluation of internal control over financial reporting, to the Registrant’s auditors and the audit committee of the Registrant’s board of directors (or persons performing the equivalent functions):
a)All significant deficiencies and material weaknesses in the design or operation of internal control over financial reporting which are reasonably likely to adversely affect the Registrant’s ability to record, process, summarize, and report financial information; and
b)Any fraud, whether or not material, that involves management or other employees who have a significant role in the Registrant’s internal control over financial reporting.
Date: November 1, 2022
| By: | /s/ William J. Betz | |||||||
| William J. Betz | ||||||||
| Chief Financial Officer |
Exhibit 32.1
CERTIFICATIONS OF CHIEF EXECUTIVE OFFICER AND CHIEF FINANCIAL OFFICER
PURSUANT TO
18 U.S.C. SECTION 1350,
AS ADOPTED PURSUANT TO
SECTION 906 OF THE SARBANES-OXLEY ACT OF 2002
I, Kurt Sievers, certify, as of the date hereof, pursuant to 18 U.S.C. Section 1350, as adopted pursuant to Section 906 of the Sarbanes-Oxley Act of 2002, that the Quarterly Report of NXP Semiconductors N.V. on Form 10-Q for the period ended October 2, 2022 fully complies with the requirements of Section 13(a) or 15(d) of the Securities Exchange Act of 1934 and that information contained in such Form 10-Q fairly presents in all material respects the financial condition and results of operations of NXP Semiconductors N.V. at the dates and for the periods indicated.
Date: November 1, 2022
| By: | /s/ Kurt Sievers | |||||||
| Kurt Sievers | ||||||||
| President & Chief Executive Officer |
I, William J. Betz, certify, as of the date hereof, pursuant to 18 U.S.C. Section 1350, as adopted pursuant to Section 906 of the Sarbanes-Oxley Act of 2002, that the Quarterly Report of NXP Semiconductors N.V. on Form 10-Q for the period ended October 2, 2022 fully complies with the requirements of Section 13(a) or 15(d) of the Securities Exchange Act of 1934 and that information contained in such Form 10-Q fairly presents in all material respects the financial condition and results of operations of NXP Semiconductors N.V. at the dates and for the periods indicated.
Date: November 1, 2022
| By: | /s/ William J. Betz | |||||||
| William J. Betz | ||||||||
| Chief Financial Officer |