 filings.tools
Item 2. Management’s Discussion and Analysis of Financial Condition and Results of Operations
39K characters. Original on sec.gov · Markdown
Item 2. Management’s Discussion and Analysis of Financial Condition and Results of Operations
Management’s Discussion and Analysis (MD&A) should be read in conjunction with our consolidated financial statements and notes and the MD&A in our Annual Report on Form 10-K for the year ended December 31, 2022, and the financial statements and the related notes that appear elsewhere in this document. This discussion contains forward-looking statements that involve a number of risks and uncertainties, including any statements that refer to projections of our future financial performance, our anticipated growth and trends in our businesses, uncertain events or assumptions, and other characterizations of future events or circumstances. Such statements are based on our current expectations and could be affected by the uncertainties and risk factors described throughout this filing and in Part I, Item 1A “Risk Factors” of our Annual Report on Form 10-K. Our actual results may differ materially from those contained in any forward-looking statements. We undertake no obligation to update any forward-looking statement to reflect subsequent events or circumstances.
Overview
Q3 2023 compared to Q2 2023
Revenue for the three months ended October 1, 2023 was $3,434 million compared to $3,299 million for the three months ended July 2, 2023, an increase of $135 million or 4.1% quarter-on-quarter. NXP experienced growth in the Mobile end market of $93 million or 32.7%, Industrial IoT our end market of $29 million or 5.0%, and Automotive end market of $25 million or 1.3%. The positive trends were offset by declines in the Communications Infrastructure & Other end market of $12 million or 2.1%.
When aggregating all end markets together and reviewing sales channel performance, revenues through NXP's third party distribution partners was $1,947 million, an increase of $268 million or 16.0% compared to the previous period. Revenues through NXP's third party direct OEM and EMS customers was $1,463 million, a decline of $133 million or 8.3% versus the previous period.
From a geographic perspective, revenue increased across the China and EMEA regions, remaining flat in the Americas region, and declining in the Asia Pacific regions.
Our gross profit percentage for the three months ended October 1, 2023 of 57.2% was relatively consistent compared with 57.0% for the three months ended July 2, 2023.
Operating income for the three months ended October 1, 2023 was $992 million compared to $937 million for the three months ended July 2, 2023, an increase of $55 million or 5.9%. Higher revenue drove the sequential increase.
We continue to generate strong operating cash flows with our operating activities providing $988 million in cash flow in the third quarter of 2023, while we returned $568 million to our shareholders during the same period. Our cash position at the end of the third quarter of 2023 was $4,042 million.
Results of operations
The following table presents operating income for each of the three and nine month periods ended October 1, 2023 and October 2, 2022, respectively:
| ($ in millions, unless otherwise stated) | Q3 2023 | Q3 2022 | Increase/decrease | YTD 2023 | YTD 2022 | Increase/decrease | |||||||||||||||||||||||||||||||||||||||||
| Revenue | 3,434 | 3,445 | (11) | 9,854 | 9,893 | (39) | |||||||||||||||||||||||||||||||||||||||||
| % nominal growth | (0.3) | 20.4 | (20.7) | (0.4) | 23.3 | (23.7) | |||||||||||||||||||||||||||||||||||||||||
| Gross profit | 1,965 | 1,967 | (2) | 5,616 | 5,626 | (10) | |||||||||||||||||||||||||||||||||||||||||
| Gross margin | 57.2 | % | 57.1 | % | 0.1 | ppt | 57.0 | % | 56.9 | % | 0.1 | ppt | |||||||||||||||||||||||||||||||||||
| Research and development | (601) | (548) | (53) | (1,767) | (1,608) | (159) | |||||||||||||||||||||||||||||||||||||||||
| Selling, general and administrative | (294) | (289) | (5) | (848) | (805) | (43) | |||||||||||||||||||||||||||||||||||||||||
| Amortization of acquisition-related intangible assets | (71) | (131) | 60 | (237) | (400) | 163 | |||||||||||||||||||||||||||||||||||||||||
| Other income (expense) | (7) | 2 | (9) | (10) | 4 | (14) | |||||||||||||||||||||||||||||||||||||||||
| Operating income (loss) | 992 | 1,001 | (9) | 2,754 | 2,817 | (63) | |||||||||||||||||||||||||||||||||||||||||
| Financial income (expense) | (75) | (98) | 23 | (231) | (331) | 100 | |||||||||||||||||||||||||||||||||||||||||
| Benefit (provision) for income taxes | (123) | (149) | 26 | (399) | (392) | (7) | |||||||||||||||||||||||||||||||||||||||||
| Results relating to equity-accounted investees | (2) | (4) | 2 | (5) | 5 | (10) | |||||||||||||||||||||||||||||||||||||||||
| Net income (loss) | 792 | 750 | 42 | 2,119 | 2,099 | 20 | |||||||||||||||||||||||||||||||||||||||||
| Less: Net income (loss) attributable to non-controlling interests | 5 | 12 | (7) | 19 | 34 | (15) | |||||||||||||||||||||||||||||||||||||||||
| Net income (loss) attributable to stockholders | 787 | 738 | 49 | 2,100 | 2,065 | 35 | |||||||||||||||||||||||||||||||||||||||||
| Diluted earnings per share | 3.01 | 2.79 | 0.22 | 8.03 | 7.80 | 0.23 |
Revenue
Q3 2023 compared to Q3 2022
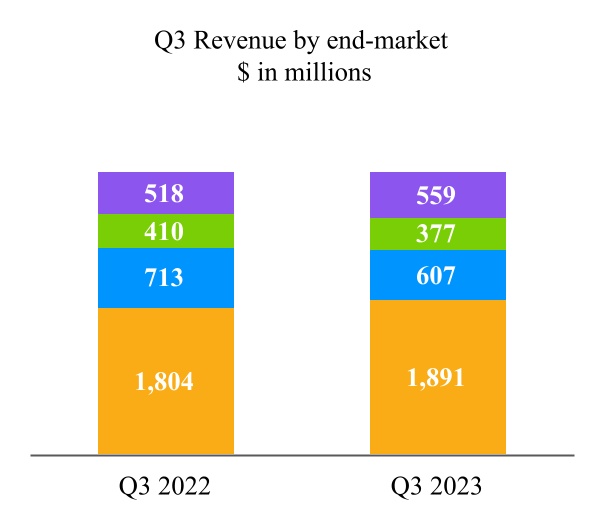
Revenue for the three months ended October 1, 2023 was $3,434 million compared to $3,445 million for the three months ended October 2, 2022, a decrease of $11 million or 0.3%. NXP experienced growth in its Automotive and Communication Infrastructure & Other end markets, which were offset by declines in the Industrial IoT and the Mobile end markets versus the year ago period.
YTD 2023 compared to YTD 2022
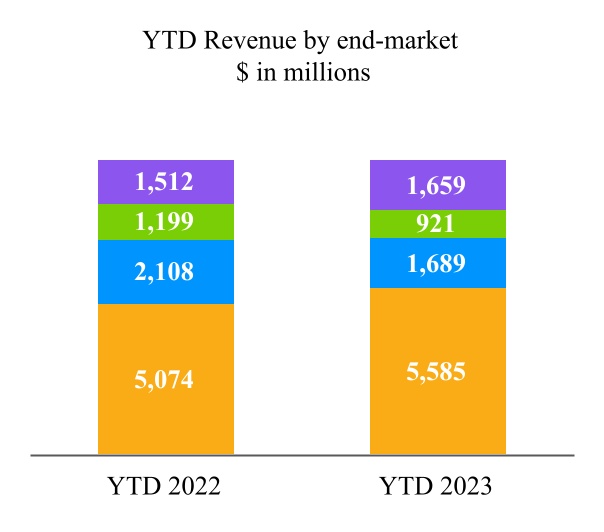
Revenue for the nine months ended October 1, 2023 was $9,854 million compared to $9,893 million for the nine months ended October 2, 2022, a decrease of $39 million or 0.4%. NXP experienced growth in its Automotive and Communication Infrastructure & Other end markets which were offset by declines in the Industrial IoT and the Mobile end markets versus the year ago period.
Revenue by end market was as follows:
| ($ in millions, unless otherwise stated) | Q3 2023 | Q3 2022 | % change | YTD 2023 | YTD 2022 | % change | |||||||||||||||||||||||||||||
| Automotive | 1,891 | 1,804 | 4.8 | % | 5,585 | 5,074 | 10.1 | % | |||||||||||||||||||||||||||
| Industrial & IoT | 607 | 713 | (14.9) | % | 1,689 | 2,108 | (19.9) | % | |||||||||||||||||||||||||||
| Mobile | 377 | 410 | (8.0) | % | 921 | 1,199 | (23.2) | % | |||||||||||||||||||||||||||
| Communication Infrastructure & Other | 559 | 518 | 7.9 | % | 1,659 | 1,512 | 9.7 | % | |||||||||||||||||||||||||||
| Revenue | 3,434 | 3,445 | (0.3) | % | 9,854 | 9,893 | (0.4) | % |
| n | Automotive | n | Mobile | |||||||||||
| n | Industrial IoT | n | Comm Infra & Other |
\
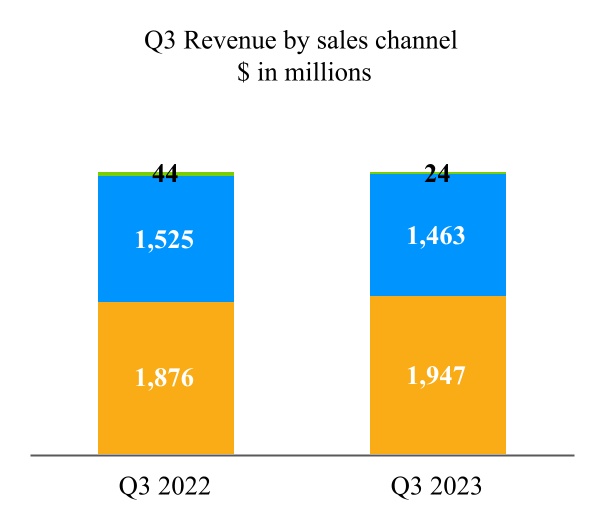
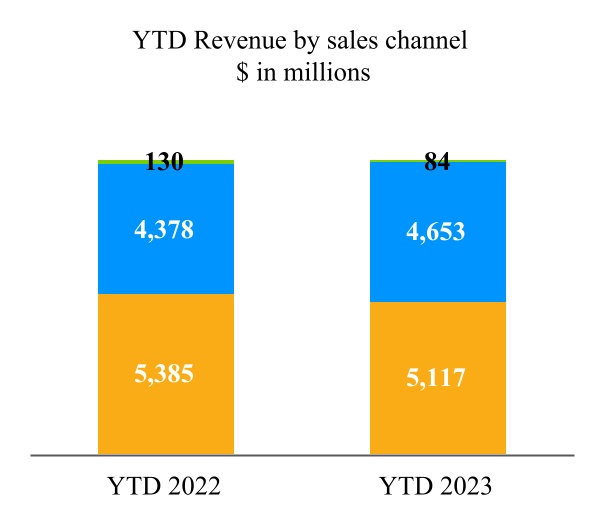
Revenue by sales channel was as follows:
| ($ in millions, unless otherwise stated) | Q3 2023 | Q3 2022 | % change | YTD 2023 | YTD 2022 | % change | |||||||||||||||||||||||||||||
| Distributors | 1,947 | 1,876 | 3.8 | % | 5,117 | 5,385 | (5.0) | % | |||||||||||||||||||||||||||
| OEM/EMS | 1,463 | 1,525 | (4.1) | % | 4,653 | 4,378 | 6.3 | % | |||||||||||||||||||||||||||
| Other | 24 | 44 | (45.5) | % | 84 | 130 | (35.4) | % | |||||||||||||||||||||||||||
| Revenue | 3,434 | 3,445 | (0.3) | % | 9,854 | 9,893 | (0.4) | % |
| n | Distributors | n | Other | ||||||||||||||
| n | OEM/EMS |
Revenue by geographic region, which is based on the customer’s shipped-to location was as follows:
| ($ in millions, unless otherwise stated) | Q3 2023 | Q3 2022 | % change | YTD 2023 | YTD 2022 | % change | |||||||||||||||||||||||||||||
| China 1) | 1,150 | 1,260 | (8.7) | % | 3,128 | 3,502 | (10.7) | % | |||||||||||||||||||||||||||
| APAC, excluding China | 906 | 1,046 | (13.4) | % | 2,839 | 3,080 | (7.8) | % | |||||||||||||||||||||||||||
| EMEA (Europe, the Middle East and Africa) | 866 | 672 | 28.9 | % | 2,388 | 1,978 | 20.7 | % | |||||||||||||||||||||||||||
| Americas | 512 | 467 | 9.6 | % | 1,499 | 1,333 | 12.5 | % | |||||||||||||||||||||||||||
| Revenue | 3,434 | 3,445 | (0.3) | % | 9,854 | 9,893 | (0.4) | % | |||||||||||||||||||||||||||
| 1) China includes Mainland China and Hong Kong |
Q3 2023 compared to Q3 2022
When aggregating all end markets together, and reviewing sales channel performance, revenues through NXP’s third party distribution partners was $1,947 million, an increase of 3.8% versus the year ago period. Revenues through direct OEM and EMS customers was $1,463 million, a decrease of 4.1% versus the year ago period.
From a geographic perspective, revenue declined year-on-year in the China and in Asia Pacific regions, while revenue increased in the EMEA and Americas regions.
Revenue in the Automotive end market was $1,891 million, an increase of $87 million or 4.8% versus the year ago period. The increase in the Automotive end market revenue can be attributed to growth in advanced analog and processors. Offsetting these positive growth trends were declines in our ADAS – Safety products.
Revenue in the Industrial & IoT end market was $607 million, a decrease of $106 million or 14.9% versus the year ago period. Within the Industrial & IoT end market the year-on-year decline was across the entire product portfolio, including processors, advanced analog, connectivity, and security.
Revenue in the Mobile end market was $377 million, a decrease of $33 million or 8.0% versus the year ago period. The decrease in the Mobile end market revenue was from declines in our advanced analog and mobile wallet, offset by growth in connectivity.
Revenue in the Communication Infrastructure & Other end market was $559 million, an increase of $41 million or 7.9% versus the year ago period. The increase in revenue was due to growth in secure cards. Offsetting these positive growth trends were declines in our RF power products and processors.
YTD 2023 compared to YTD 2022
When aggregating all end markets together, and reviewing sales channel performance, revenues through NXP’s third party distribution partners was $5,117 million, a decrease of 5.0% versus the year ago period. Revenues through direct OEM and EMS customers was $4,653 million, an increase of 6.3% versus the year ago period.
From a geographic perspective, revenue declined in China and in Asia Pacific regions, while revenues increased in the EMEA and Americas regions.
Revenue in the Automotive end market was $5,585 million, an increase of $511 million or 10.1% versus the year ago period. The increase in the Automotive end market year-to-date revenues can be attributed to growth in processors, advanced analog, and connectivity. Offsetting these positive growth trends were declines in our ADAS – Safety products.
Revenue in the Industrial & IoT end market was $1,689 million, a decrease of $419 million or 19.9% versus the year ago period. Within the Industrial & IoT end market the year-to-date decline was across the entire product portfolio, including processors, advanced analog, connectivity, and security.
Revenue in the Mobile end market was $921 million, a decrease of $278 million or 23.2% versus the year ago period. The decrease in the Mobile end market revenue was from declines in our advanced analog and mobile wallet, offset by growth in connectivity.
Revenue in the Communication Infrastructure & Other end market was $1,659 million, an increase of $147 million or 9.7% versus the year ago period. The increase in revenue was growth in secure cards and processors. Offsetting these positive growth trends were declines in our RF power products.
Gross profit
Q3 2023 compared to Q3 2022
Gross profit for the three months ended October 1, 2023 was $1,965 million, or 57.2% of revenue, compared to $1,967 million, or 57.1% of revenue for the three months ended October 2, 2022, resulting from inflationary effects of increased input costs from suppliers which were passed along to end customers.
YTD 2023 compared to YTD 2022
Gross profit for the nine months ended October 1, 2023 was $5,616 million, or 57.0% of revenue, compared to $5,626 million, or 56.9% of revenue for the nine months ended October 2, 2022, resulting from inflationary effects of increased input costs from suppliers which were passed along to end customers.
Operating expenses
Research and development
| ($ in millions, unless otherwise stated) | Q3 2023 | Q3 2022 | % change | YTD 2023 | YTD 2022 | % change | |||||||||||||||||||||||||||||
| Research and development | 601 | 548 | 9.7 | % | 1,767 | 1,608 | 9.9 | % | |||||||||||||||||||||||||||
| As a percentage of revenue | 17.5 | % | 15.9 | % | 1.6 | ppt | 17.9 | % | 16.3 | % | 1.6 | ppt |
Q3 2023 compared to Q3 2022
R&D costs for the three months ended October 1, 2023 increased by $53 million, or 9.7%, when compared to the three months ended October 2, 2022 mainly driven by:
+ higher personnel-related costs;
+ higher variable compensation costs; and
- lower pre-production related expenses.
YTD 2023 compared to YTD 2022
R&D costs for the nine months ended October 1, 2023 increased by $159 million, or 9.9%, when compared to the nine months ended October 2, 2022 mainly driven by:
+ higher personnel-related costs;
+ higher restructuring costs;
+ higher IP and other licenses related costs; and
- lower pre-production related expenses.
Selling, general and administrative
| ($ in millions, unless otherwise stated) | Q3 2023 | Q3 2022 | % change | YTD 2023 | YTD 2022 | % change | |||||||||||||||||||||||||||||
| Selling, general and administrative | 294 | 289 | 1.7 | % | 848 | 805 | 5.3 | % | |||||||||||||||||||||||||||
| As a percentage of revenue | 8.6 | % | 8.4 | % | 0.2 | ppt | 8.6 | % | 8.1 | % | 0.5 | ppt |
Q3 2023 compared to Q3 2022
SG&A costs for the three months ended October 1, 2023 increased by $5 million, or 1.7%, when compared to the three months ended October 2, 2022 mainly due to:
+ higher legal expense.
YTD 2023 compared to YTD 2022
SG&A costs for the nine months ended October 1, 2023 increased by $43 million, or 5.3%, when compared to the nine months ended October 2, 2022 mainly due to:
+ higher personnel-related costs;
+ higher legal expense;
+ higher communication & IT cost;
+ higher travel expense; and
- lower variable compensation costs.
Amortization of acquisition-related intangible assets
| ($ in millions, unless otherwise stated) | Q3 2023 | Q3 2022 | % change | YTD 2023 | YTD 2022 | % change | |||||||||||||||||||||||||||||
| Amortization of acquisition-related intangible assets | 71 | 131 | (45.8) | % | 237 | 400 | (40.8) | % | |||||||||||||||||||||||||||
| As a percentage of revenue | 2.1 | % | 3.8 | % | (1.7) | ppt | 2.4 | % | 4.0 | % | (1.6) | ppt |
Q3 2023 compared to Q3 2022
Amortization of acquisition-related intangible assets for the three months ended October 1, 2023 decreased by $60 million, or 45.8%, when compared to the three months ended October 2, 2022 driven by:
- certain intangibles became fully amortized during 2022.
YTD 2023 compared to YTD 2022
Amortization of acquisition-related intangible assets for the nine months ended October 1, 2023 decreased by $163 million, or 40.8%, when compared to the nine months ended October 2, 2022 driven by:
- certain intangibles became fully amortized during 2022.
Financial income (expense)
The following table presents the details of financial income and expenses:
| ($ in millions, unless otherwise stated) | Q3 2023 | Q3 2022 | YTD 2023 | YTD 2022 | |||||||||||||||||||
| Interest income | 49 | 21 | 134 | 29 | |||||||||||||||||||
| Interest expense | (109) | (109) | (329) | (319) | |||||||||||||||||||
| Total other financial income/ (expense) | (15) | (10) | (36) | (41) | |||||||||||||||||||
| Total | (75) | (98) | (231) | (331) |
Interest income
Q3 2023 compared to Q3 2022
Interest income increased due to higher interest rates and to a lesser extent by a higher level of cash.
YTD 2023 compared to YTD 2022
Interest income increased due to higher interest rates and to a lesser extent by a higher level of cash.
Interest expense
Q3 2023 compared to Q3 2022
Interest expense remained flat.
YTD 2023 compared to YTD 2022
Interest expense increased due to the issuance of $1.5 billion of senior unsecured notes partially offset by the redemption of $900 million of senior unsecured notes in the second quarter of 2022.
Other, net
Q3 2023 compared to Q3 2022
Other, net, mainly increased due to foreign currency results (a loss of $5 million in the third quarter of 2023 versus a loss of $1 million in the third quarter of 2022).
YTD 2023 compared to YTD 2022
Other, net, decreased due to debt extinguishment cost of $18 million in the second quarter of 2022 and higher foreign currency results (a loss of $15 million in the first nine months of 2023 versus a profit of $2 million in the first nine months of 2022) Also included are fair value adjustments in equity securities (a profit of $1 million in the first nine months of 2023 versus a loss of $6 million in the first nine months of 2022).
Benefit (provision) for income taxes
| Q3 2023 | Q3 2022 | YTD 2023 | YTD 2022 | ||||||||||||||||||||||||||||||||
| Benefit (provision) for income taxes | (123) | (149) | (399) | (392) | |||||||||||||||||||||||||||||||
| Effective tax rate | 13.4 | % | 16.5 | % | 15.8 | % | 15.8 | % | |||||||||||||||||||||||||||
| Statutory income tax rate in the Netherlands | 25.8 | % | 25.8 | % | 25.8 | % | 25.8 | % |
Beginning with the first quarter of 2023, NXP was in a position to make a reliable estimate of its annual effective tax rate. This estimated annual effective tax rate ("EAETR") is then applied to the year-to-date Income (loss) before income taxes excluding discrete items, to determine the year-to-date benefit (provision) for income taxes. The income tax effects of any discrete items are recognized in the interim period in which they occur. As the year progresses, the Company continually refines the EAETR based upon actual events and the
apportionment of our earnings (loss). This continual estimation process periodically may result in a change to our EAETR for the year. When this occurs, we adjust on an accumulated basis the benefit (provision) for income taxes during the quarter in which the change occurs.
Our provision for income taxes for 2023 is based on our EAETR of 16.1%, which is lower than the Netherlands statutory tax rate of 25.8%, primarily due to tax benefits from the Netherlands and foreign tax incentives.
Q3 2023 compared to Q3 2022
The effective tax rate of 13.4% for the third quarter of 2023 was lower than the EAETR due to the income tax benefit for discrete items of $12 million. The discrete items are primarily related to changes in estimates for previous years, and the impact of foreign currency on income tax related items. Compared to prior quarters, the EAETR was lower due to a recapture of $13 million tax benefit in the third quarter primarily as a result of new guidance released by the Internal Revenue Service to clarify the treatment of specified research and experimental expenditures under Section 174.
YTD 2023 compared to YTD 2022
For the first nine months of 2023 the effective tax rate of 15.8% was lower than 16.1% due to the net result of favorable discrete items of $8 million.
The effective tax rate of 15.8% for the first nine months of 2022 was equal to the current period of 15.8%.
Liquidity and Capital Resources
We derive our liquidity and capital resources primarily from our cash flows from operations. We continue to generate strong positive operating cash flows. At the end of the third quarter of 2023, our cash balance was $4,042 million, an increase of $197 million compared to December 31, 2022. Taking into account the available amount of the Unsecured Revolving Credit Facility of $2,500 million, we had access to $6,542 million of liquidity as of October 1, 2023. We currently use cash to fund operations, meet working capital requirements, for capital expenditures and for potential common stock repurchases, dividends and strategic investments. Based on past performance and current expectations, we believe that our current available sources of funds (including cash and cash equivalents, RCF Agreement of $2.5 billion, plus anticipated cash generated from operations) will be adequate to finance our operations, working capital requirements, capital expenditures and potential dividends for at least the next twelve months.
| ($ in millions, unless otherwise stated) | YTD 2023 | YTD 2022 | |||||||||
| Cash from operations | 2,376 | 2,819 | |||||||||
| Capital expenditures | 652 | 830 | |||||||||
| Cash to shareholders | 1,364 | 1,514 |
Cash and cash equivalents
At October 1, 2023, our cash balance was $4,042 million of which $225 million was held by SSMC, our consolidated joint venture company with TSMC. Under the terms of our joint venture agreement with TSMC, a portion of this cash can be distributed by way of a dividend to us, but 38.8% of the dividend will be paid to our joint venture partner.
Capital expenditures
Our cash outflows for capital expenditures were $652 million in the first nine months of 2023, compared to $830 million in the first nine months of 2022.
Capital return
Under our Quarterly Dividend Program, interim dividends of $0.845 per ordinary share were paid on January 6, 2023 ($219 million), dividends of $1.014 per ordinary share were paid on April 5, 2023 ($264 million) and dividends of $1.014 per ordinary share were paid on July 6, 2023 ($262 million).
Outstanding indebtedness
Our total debt amounted to $11,172 million as of Q3 2023, an increase of $7 million compared to December 31, 2022 ($11,165 million), with net debt amounting to $7,130 million. Our current debt amounted to $999 million as of Q3 2023 and consists of our 4.875% Senior Unsecured Notes due March 2024, which we currently expect to retire when it comes due with cash on hand.
Cash flows
Our cash and cash equivalents during the first nine months of 2023 increased by $201 million (excluding the effect of changes in exchange rates on our cash position of $(4) million as follows:
| ($ in millions, unless otherwise stated) | YTD 2023 | YTD 2022 | |||||||||
| Net cash provided by (used for) operating activities | 2,376 | 2,819 | |||||||||
| Net cash (used for) provided by investing activities | (879) | (977) | |||||||||
| Net cash provided by (used for) financing activities | (1,296) | (891) | |||||||||
| Increase (decrease) in cash and cash equivalents | 201 | 951 |
Cash Flow from Operating Activities
For the first nine months of 2023 our operating activities provided $2,376 million in cash. This was primarily the result of net income of $2,119 million, adjustments to reconcile the net income of $982 million and changes in operating assets and liabilities of $(746) million. Adjustments to net income (loss) includes offsetting non-cash items, such as depreciation and amortization of $837 million, share-based compensation of $304 million and changes in deferred taxes of $(170) million. Changes in operating assets and liabilities were primarily driven by a $359 million increase in inventories due to improved supply capabilities, $118 million increase in receivables and other current assets from prepayments to secure production supply with multiple vendors, and $220 million decrease in accounts payable and other liabilities as a result of timing related to payments.
For the first nine months of 2022 our operating activities provided $2,819 million in cash. This was primarily the result of net income of $2,099 million, adjustments to reconcile the net income of $1,043 million and changes in operating assets and liabilities of $(337) million. Adjustments to net income (loss) includes offsetting non-cash items, such as depreciation and amortization of $948 million, share-based compensation of $267 million and changes in deferred taxes of $(196) million. Changes in operating assets and liabilities were primarily driven by a $392 million increase in inventories due to increased production levels in order to align inventory on hand with expected demand, $165 million increase in receivables and other current assets due to the linearity of revenue between the two periods, customer mix, and the related timing of cash collection, $325 million increase in other non-current assets from prepayments to secure long-term production supply with multiple vendors; partially offset by $545 million increase in accounts payable and other liabilities as a result of timing related to payments.
Cash Flow from Investing Activities
Net cash used for investing activities amounted to $879 million for the first nine months of 2023 and principally consisted of the cash outflows for capital expenditures of $652 million, $135 million for the purchase of identified intangible assets, and $93 million for the purchase of investments.
Net cash used for investing activities amounted to $977 million for the first nine months of 2022 and principally consisted of the cash outflows for capital expenditures of $830 million, $122 million for the purchase of identified intangible assets, and $27 million for the net purchase of interests of businesses.
Cash Flow from Financing Activities
Net cash used for financing activities was $1,296 million for the first nine months of 2023 was primarily driven by the dividend payment to common stockholders of $745 million, and purchase of treasury shares and restricted stock unit holdings of $619 million; partially offset by the $70 million proceeds from the issuance of common stock through stock plans.
Net cash used for financing activities was $891 million for the first nine months of 2022 was primarily driven by the repurchase of long-term debt of $917 million, purchase of treasury shares and restricted stock unit holdings of $920 million, dividend payment to common stockholders of $594 million; partially offset by the proceeds from the issuance of long-term debt of $1,496 million.
Additional Capital Requirements
Expected working and other capital requirements are described in our Annual Report on Form 10-K for the fiscal year ended December 31, 2022 in Part II, Item 7, “Management’s Discussion and Analysis of Financial Condition and Results of Operations”. At October 1, 2023, other than for changes disclosed in the “Notes to Condensed Consolidated Financial Statements” and “Liquidity and Capital Resources” in this Quarterly Report, there have been no other material changes to our expected working and other capital requirements described in our Annual Report on Form 10-K for the fiscal year ended December 31, 2022.
Information Regarding Guarantors of NXP (unaudited)
Summarized Combined Financial Information for Guarantee of Securities of Subsidiaries
All debt instruments are guaranteed, fully and unconditionally, jointly and severally, by NXP Semiconductors N.V. and issued or guaranteed by NXP USA, Inc., NXP B.V. and NXP LLC, (together, the “Subsidiary Obligors” and together with NXP Semiconductors N.V., the “Obligor Group”). Other than the Subsidiary Obligors, none of the Company’s subsidiaries (together the “Non-Guarantor Subsidiaries”) guarantee the Notes. The Company consolidates the Subsidiary Obligors in its consolidated financial statements and each of the Subsidiary Obligors are wholly owned subsidiaries of the Company.
All of the existing guarantees by the Company rank equally in right of payment with all of the existing and future senior indebtedness of the Obligor Group. There are no significant restrictions on the ability of the Obligor Group to obtain funds from respective subsidiaries by dividend or loan.
The following tables present summarized financial information of the Obligor Group on a combined basis, with intercompany balances and transactions between entities of the Obligor Group eliminated and investments and equity in the earnings of the Non-Guarantor Subsidiaries excluded. The Obligor Group’s amounts due from, amounts due to, and intercompany transactions with Non-Guarantor Subsidiaries have been disclosed below the table, when material.
Summarized Statements of Income
| For the nine months ended | |||||
| ($ in millions) | October 1, 2023 | ||||
| Revenue | 5,966 | ||||
| Gross Profit | 3,001 | ||||
| Operating income | 1,154 | ||||
| Net income | 539 |
Summarized Balance Sheets
| As of | |||||||||||
| ($ in millions) | October 1, 2023 | December 31, 2022 | |||||||||
| Current assets | 4,003 | 3,740 | |||||||||
| Non-current assets | 11,655 | 11,572 | |||||||||
| Total assets | 15,658 | 15,312 | |||||||||
| Current liabilities | 1,937 | 1,067 | |||||||||
| Non-current liabilities | 10,561 | 11,528 | |||||||||
| Total liabilities | 12,498 | 12,595 | |||||||||
| Obligor's Group equity | 3,160 | 2,717 | |||||||||
| Total liabilities and Obligor's Group equity | 15,658 | 15,312 |
NXP Semiconductors N.V. is the head of a fiscal unity for the corporate income tax and VAT that contains the most significant Dutch wholly-owned group companies. The Company is therefore jointly and severally liable for the tax liabilities of the tax entity as a whole, and as such the income tax expense of the Dutch fiscal unity has been included in the Net income of the Obligor Group.
The financial information of the Obligor Group includes sales executed through a Non-Guarantor Subsidiary single-billing entity as a sales agent on behalf of an entity in the Obligor Group. The Obligor Group has sales to non-guarantors (for the nine months ended October 1, 2023: $614 million). The Obligor Group has amounts due from equity financing (October 1, 2023: $5,463 million; December 31, 2022: $5,210 million) and due to debt financing (October 1, 2023: $1,709 million; December 31, 2022: $2,629 million) with non-guarantor subsidiaries.
Previous: Item 1. Financial Statements · Next: Item 3. Quantitative and Qualitative Disclosures About Market Risk