 filings.tools
NXP Semiconductors 20-F 2013-12-31
Filed 2014-02-28. 18 sections, 616K characters. Original on sec.gov · Markdown · JSON
Cover and table of contents
20-F 1 d625545d20f.htm 20-F
Table of Contents
As filed with the Securities and Exchange Commission on February 28, 2014
UNITED STATES
SECURITIES AND EXCHANGE COMMISSION
WASHINGTON, D.C. 20549
FORM 20-F
| ¨ | REGISTRATION STATEMENT PURSUANT TO SECTION 12(b) OR (g) OF THE SECURITIES EXCHANGE ACT OF 1934 |
|---|
OR
| x | ANNUAL REPORT PURSUANT TO SECTION 13 OR 15(d) OF THE SECURITIES EXCHANGE ACT OF 1934 |
|---|
For the fiscal year ended December 31, 2013
OR
| ¨ | TRANSITION REPORT PURSUANT TO SECTION 13 OR 15(d) OF THE SECURITIES EXCHANGE ACT OF 1934 |
|---|
For the transition period from to
OR
| ¨ | SHELL COMPANY REPORT PURSUANT TO SECTION 13 OR 15(d) OF THE SECURITIES EXCHANGE ACT OF 1934 |
|---|
Date of event requiring this shell company report
Commission file number 001-34841
NXP Semiconductors N.V.
(Exact name of Registrant as specified in its charter)
The Netherlands
(Jurisdiction of incorporation or organization)
High Tech Campus 60, Eindhoven 5656 AG, the Netherlands
(Address of principal executive offices)
Jean Schreurs, SVP and Senior Corporate Counsel, High Tech Campus 60, 5656 AG, Eindhoven, the Netherlands
Telephone: +31 40 2728686 / E-mail: jean.schreurs@nxp.com
(Name, Telephone, E-mail and/or Facsimile number and Address of Company Contact Person)
Securities registered or to be registered pursuant to Section 12(b) of the Act.
| Title of each class | Name of each exchange on which registered | |
| Common shares—par value euro (EUR) 0.20 per share | The NASDAQ Global Select Market |
Securities registered or to be registered pursuant to Section 12(g) of the Act.
None
Securities for which there is a reporting obligation pursuant to Section 15(d) of the Act.
Common shares—par value EUR 0.20 per share
(Title of class)
Indicate the number of outstanding shares of each of the issuer’s classes of capital or common stock as of the close of the period covered by the Annual Report.
| Class | Outstanding at December 31, 2013 | |
| Ordinary shares, par value EUR 0.20 per share | 251,751,500 shares |
Indicate by check mark if the registrant is a well-known seasoned issuer, as defined in Rule 405 of the Securities Act. x Yes ¨ No
If this report is an annual or transition report, indicate by check mark if the registrant is not required to file reports pursuant to Section 13 or 15(d) of the Securities Exchange Act of 1934. ¨ Yes x No
Note—Checking the box above will not relieve any registrant required to file reports pursuant to Section 13 or 15(d) of the Securities Exchange Act of 1934 from their obligations under those Sections.
Indicate by check mark whether the registrant (1) has filed all reports required to be filed by Section 13 or 15(d) of the Securities Exchange Act of 1934 during the preceding 12 months (or for such shorter period that the registrant was required to file such reports), and (2) has been subject to such filing requirements for the past 90 days. x Yes ¨ No
Indicate by check mark whether the registrant has submitted electronically and posted on its corporate Web site, if any, every Interactive Data File required to be submitted and posted pursuant to Rule 405 of Regulation S-T (§232.405 of this chapter) during the preceding 12 months (or for such shorter period that the registrant was required to submit and post such files). x Yes ¨ No
Indicate by check mark whether the registrant is a large accelerated filer, an accelerated filer, or a non-accelerated filer. See definition of “accelerated filer and large accelerated filer” in Rule 12b-2 of the Exchange Act. (Check one)
Large accelerated filer x Accelerated filer ¨ Non-accelerated filer ¨
Indicate by check mark which basis of accounting the registrant has used to prepare the financial statements included in this filing:
| U.S. GAAP x | International Financial Reporting Standards as issued by the International Accounting Standards Board ¨ | Other ¨ |
If “Other” has been checked in response to the previous question, indicate by check mark which financial statement item the registrant has elected to follow. Item 17 ¨ Item 18 ¨
If this is an Annual Report, indicate by check mark whether the registrant is a shell company (as defined in Rule 12b-2 of the Exchange Act). ¨ Yes x No
Table of Contents
TABLE OF CONTENTS
Table of Contents
Table of Contents
Introduction
This Annual Report contains forward-looking statements that contain risks and uncertainties. Our actual results may differ significantly from future results as a result of factors such as those set forth in Part I. Item 3D. Risk Factors and Part I, Item 5G. Safe Harbor.
The financial information included in this Annual Report is based on United States Generally Accepted Accounting Principles (U.S. GAAP), unless otherwise indicated.
In presenting and discussing our financial position, operating results and cash flows, management uses certain non-U.S. GAAP financial measures. These non-U.S. GAAP financial measures should not be viewed in isolation or as alternatives to the equivalent U.S. GAAP measures and should be used in conjunction with the most directly comparable U.S. GAAP measures. A discussion of non-U.S. GAAP measures included in this Annual Report and a reconciliation of such measures to the most directly comparable U.S. GAAP measures are set forth under “Use of Certain Non-U.S. GAAP Financial Measures” contained in this report under Part I, Item 5A. Operating Results.
Unless otherwise required, all references herein to “we”, “our”, “us”, “NXP” and the “Company” are to NXP Semiconductors N.V. and its consolidated subsidiaries.
A glossary of abbreviations and technical terms used in this Annual Report is set forth on page 96.
Table of Contents
PART I
Item 1. Identity of Directors, Senior Management and Advisers
| --- | --- |
Not applicable.
Item 2. Offer Statistics and Expected Timetable
| --- | --- |
Not applicable.
Item 3. Key Information
| --- | --- |
A. Selected Financial Data
The following table presents a summary of our selected historical consolidated financial data. We prepare our financial statements in accordance with U.S. GAAP.
The results of operations for prior years are not necessarily indicative of the results to be expected for any future period.
Table of Contents
The selected historical consolidated financial data should be read in conjunction with the discussion under Part I, Item 5A. Operating Results and the Consolidated Financial Statements and the accompanying Notes included elsewhere in this Annual Report.
| As of and for the years ended December 31, | ||||||||||||||||||||
| ($ in millions unless otherwise stated) | 2013 | 2012 | 2011 | 2010 | 2009(1) | |||||||||||||||
| Consolidated Statements of Operations: | ||||||||||||||||||||
| Revenue | 4,815 | 4,358 | 4,194 | 4,402 | 3,519 | |||||||||||||||
| Operating income (loss) | 651 | 412 | 357 | 273 | (931 | ) | ||||||||||||||
| Financial income (expense)-net | (274 | ) | (437 | ) | (257 | ) | (628 | ) | 682 | |||||||||||
| Income (loss) from continuing operations attributable to stockholders | 348 | (116 | ) | (44 | ) | (515 | ) | (199 | ) | |||||||||||
| Income (loss) from discontinued operations attributable to stockholders | — | 1 | 434 | 59 | 32 | |||||||||||||||
| Net income (loss) attributable to stockholders | 348 | (115 | ) | 390 | (456 | ) | (167 | ) | ||||||||||||
| Per share data(2)(3): | ||||||||||||||||||||
| Basic earnings per common share attributable to stockholders in $ | ||||||||||||||||||||
| - Income (loss) from continuing operations | 1.40 | (0.46 | ) | (0.17 | ) | (2.25 | ) | (0.93 | ) | |||||||||||
| - Income (loss) from discontinued operations | — | — | 1.74 | 0.26 | 0.15 | |||||||||||||||
| - Net income (loss) | 1.40 | (0.46 | ) | 1.57 | (1.99 | ) | (0.78 | ) | ||||||||||||
| Diluted earnings per common share attributable to stockholders in $ | ||||||||||||||||||||
| - Income (loss) from continuing operations | 1.36 | (0.46 | ) | (0.17 | ) | (2.25 | ) | (0.93 | ) | |||||||||||
| - Income (loss) from discontinued operations | — | — | 1.74 | 0.26 | 0.15 | |||||||||||||||
| - Net income (loss) | 1.36 | (0.46 | ) | 1.57 | (1.99 | ) | (0.78 | ) | ||||||||||||
| Weighted average number of shares of common stock outstanding during the year (in thousands) | ||||||||||||||||||||
| - Basic | 248,526 | 248,064 | 248,812 | 229,280 | 215,252 | |||||||||||||||
| - Diluted | 255,050 | 248,064 | (4) | 248,812 | (4) | 229,280 | (4) | 215,252 | (4) | |||||||||||
| Consolidated balance sheet data: | ||||||||||||||||||||
| Cash and cash equivalents | 670 | 617 | 743 | 898 | 1,026 | |||||||||||||||
| Total assets | 6,449 | 6,439 | 6,612 | 7,637 | 8,579 | |||||||||||||||
| Net assets | 1,546 | 1,284 | 1,357 | 1,219 | 1,041 | |||||||||||||||
| Working capital(5) | 939 | 765 | 969 | 811 | 870 | |||||||||||||||
| Total debt(6) | 3,321 | 3,492 | 3,799 | 4,551 | 5,283 | |||||||||||||||
| Total stockholders’ equity | 1,301 | 1,049 | 1,145 | 986 | 843 | |||||||||||||||
| Common stock | 51 | 51 | 51 | 51 | 42 | |||||||||||||||
| Other operating data: | ||||||||||||||||||||
| Capital expenditures | (215 | ) | (251 | ) | (221 | ) | (258 | ) | (92 | ) | ||||||||||
| Depreciation and amortization(7) | 514 | 533 | 591 | 684 | 887 | |||||||||||||||
| Consolidated statements of cash flows data: | ||||||||||||||||||||
| Net cash provided by (used for): | ||||||||||||||||||||
| Operating activities | 891 | 722 | 175 | 361 | (701 | ) | ||||||||||||||
| Investing activities | (240 | ) | (243 | ) | (202 | ) | (269 | ) | 63 | |||||||||||
| Financing activities | (598 | ) | (574 | ) | (926 | ) | (157 | ) | (109 | ) | ||||||||||
| Net cash provided by (used for) continuing operations | 53 | (95 | ) | (953 | ) | (65 | ) | (747 | ) | |||||||||||
| Net cash provided by (used for) discontinued operations | — | (45 | ) | 809 | (5 | ) | — |
| (1) | The financial data for 2009 have been restated to reflect the effect of the sale of the Sound Solutions business in 2011 as discontinued operations. |
|---|
Table of Contents
| (2) | On August 2, 2010, we amended our articles of association in order to effect a 1-for-20 reverse stock split, decreasing the number of shares of common stock outstanding from approximately 4.3 billion to approximately 215 million and increasing the par value of the shares of common stock from €0.01 to €0.20. In all periods presented, basic and diluted weighted average shares outstanding and earnings per share have been calculated to reflect the 1-for-20 reverse stock split. |
|---|
| (3) | The Company has not paid any dividends during the periods presented. |
|---|
| (4) | Due to our net losses from continuing operations attributable to stockholders in the periods from 2009 to 2012, all potentially dilutive securities have been excluded from the calculation of diluted earnings per common share because their effect would be anti-dilutive. |
|---|
| (5) | Working capital is calculated as current assets less current liabilities (excluding short-term debt). |
|---|
| (6) | As adjusted for our cash and cash equivalents our net debt was calculated as follows: |
|---|
| ($ in millions) | 2013 | 2012 | 2011 | 2010 | 2009 | |||||||||||||||
| Long-term debt | 3,281 | 3,185 | 3,747 | 4,128 | 4,673 | |||||||||||||||
| Short-term debt | 40 | 307 | 52 | 423 | 610 | |||||||||||||||
| Total debt | 3,321 | 3,492 | 3,799 | 4,551 | 5,283 | |||||||||||||||
| Less: cash and cash equivalents | (670 | ) | (617 | ) | (743 | ) | (898 | ) | (1,026 | ) | ||||||||||
| Net debt | 2,651 |
Showing the first 8K of 98K characters. Open the full section
Item 4. Information on the Company
| --- | --- |
A.****History and Development of the Company
Name and History
Our legal name is NXP Semiconductors N.V. and our commercial name is “NXP” or “NXP Semiconductors”.
We were incorporated in the Netherlands as a Dutch private company with limited liability (besloten vennootschap met beperkte aansprakelijkheid) under the name KASLION Acquisition B.V. on August 2, 2006, in connection with the sale by Philips of 80.1% of its semiconductor business to the “Private Equity Consortium”. For a list of the specific funds that hold our common stock and their respective share ownership, see Part I, Item 7A. Major Shareholders elsewhere in this document. Initially, the Private Equity Consortium invested in our Company through KASLION Holding B.V., a Dutch private company with limited liability.
On May 21, 2010, we converted into a Dutch public company with limited liability (naamloze vennootschap) and changed our name to NXP Semiconductors N.V. Concurrently, we amended our articles of association in order to effect a 1-for-20 reverse stock split of our shares of common stock.
In August 2010, we made an initial public offering of 34 million shares of our common stock and listed our common stock on the NASDAQ Global Select Market.
On March 31, 2011, certain of our stockholders offered 30 million shares of our common stock, priced at $30.00 per share. The underwriters of the offering exercised in full their option to purchase from the selling stockholders 4,431,000 additional shares of common stock at the secondary offering price. We did not receive any proceeds from this secondary offering. The settlement date for the offering was April 5, 2011. On February 4, 2013, certain of our stockholders offered 30 million shares of our common stock, priced at $30.35 per share. The settlement date for the offering was February 7, 2013. On March 8, 2013, certain of our stockholders offered 25 million shares of our common stock, priced at $31.40 per share. The settlement date for the offering was March 13, 2013. On September 13, 2013, certain of our stockholders offered 25 million shares of our common stock, priced at $37.65 per share. The settlement date for the offering was September 18, 2013. On December 11, 2013 certain of our stockholders offered 25 million shares of our common stock priced at $42.50 per share. The settlement date for the offering was December 13, 2013. We did not receive any proceeds from these secondary offerings either.
We are a holding company whose only material assets are the direct ownership of 100% of the shares of NXP B.V., a Dutch private company with limited liability (besloten vennootschap met beperkte aansprakelijkheid).
Our corporate seat is in Eindhoven, the Netherlands. Our principal executive office is at High Tech Campus 60, 5656 AG Eindhoven, the Netherlands, and our telephone number is +31 40 2729233. Our registered agent in the United States is NXP Semiconductors USA, Inc., 411 East Plumeria Drive, San Jose, CA 95134, United States of America, phone number +1 408 5185400.
OPEX Reduction Program
During the fourth quarter of 2012 NXP adopted a cost savings and restructuring initiative designed to improve operational efficiency and to competitively position the Company for sustainable growth. This initiative primarily relates to a worldwide workforce reduction of approximately 650 employees, with the majority of the headcount reductions in Europe and the United States. For additional information regarding our restructuring initiatives please refer to Note 14 to the Consolidated Financial Statements included in Part III, Item 18 of this Report.
Table of Contents
Reporting Segments
NXP is organized into two market oriented reportable segments, High Performance Mixed Signal (“HPMS”) and Standard Products (“SP”). Corporate and Other represents the remaining portion to reconcile to the Consolidated Financial Statements. You can find a description of each of our reportable segments below. We also have a manufacturing group that manages our manufacturing and supply chain activities. Prior to January 1, 2013 we had three reportable segments: HPMS, SP and Manufacturing Operations. During the first quarter of 2013 we moved our General Purpose Logic Product Line from our HPMS segment (Portable & Computing) to our SP segment; and our NXP software product line to our HPMS Segment (Industrial & Infrastructure) from Corporate and Other. We also determined in the fourth quarter of 2013 that Manufacturing Operations no longer meets the criteria for separate reporting as a reportable segment and consequently, its results are now reflected within Corporate and Other. As a result of the above changes to the composition of our operating and reportable segments, corresponding information for prior periods have been reclassified to conform to the current period presentation.
B.****Business Overview
Our Company
We are a global semiconductor company and a long-standing supplier in the industry, with over 50 years of innovation and operating history. We provide leading High Performance Mixed Signal and Standard Product solutions that leverage our deep application insight and our technology and manufacturing expertise in security, interface, RF, analog, power management and digital processing products. Our product solutions are used in a wide range of applications such as: automotive, identification, wireless infrastructure, lighting, industrial, mobile, consumer and computing. We engage with leading original equipment manufacturers (“OEMs”) worldwide and 64% of our revenue in 2013 was derived from Asia Pacific (excluding Japan).
Since our separation from Koninklijke Philips Electronics N.V. (“Philips”) in 2006, we have significantly repositioned our business to focus on High Performance Mixed Signal solutions and have implemented a restructuring program and taken other restructuring initiatives aimed at achieving a world-class cost structure and streamlined processes. As of December 31, 2013, we had 25,691 full-time equivalent employees located in over 25 countries, with research and development activities in Asia, Europe and the United States, and manufacturing facilities in Asia and Europe. For the year ended December 31, 2013, we generated revenue of $4,815 million.
Markets, applications and products
We sell two categories of products, High Performance Mixed Signal product solutions and Standard Products. The first category, which consists of highly differentiated application-specific High Performance Mixed Signal semiconductors and system solutions, accounted for 76% of our total product revenue in 2013. We believe that High Performance Mixed Signal is an attractive market in terms of growth, barriers to entry, relative business and pricing stability and capital intensity. The second of our product categories, Standard Products, accounted for 24% of our total product revenue in 2013, and consists of devices that can be incorporated in many different types of electronics equipment and that are typically sold to a wide variety of customers, both directly and through distributors. Manufacturing cost, supply chain efficiency and continuous improvement of manufacturing processes drive the profitability of our Standard Products.
High Performance Mixed Signal
We focus on developing products and system and sub-system solutions that are innovative and allow our customers to bring their end products to market more quickly. Our products, particularly our application system and sub-system solutions, help our customers design critical parts of their end products and thus help many of them to differentiate themselves based on feature performance, advanced functionality, cost or time-to-market.
Table of Contents
We leverage our technical expertise in the areas of RF, analog, power management, interface, security technologies and digital processing across our priority applications markets. Our strong RF capabilities are utilized in our high performance RF for wireless infrastructure and industrial applications, television tuners, car security and car radio products and contactless identification products. Our power technologies and capabilities are applied in our lighting products, AC-DC power conversion and audio power products, while our ability to design ultra-low power semiconductors is used in a wide range of our products including our consumer, mobile, identification, healthcare products and our microcontrollers. Our high-speed interface design skills are applied in our interface products business, and our security solutions are used in our identification, microcontroller, telematics and smart metering products and solutions. Finally, our digital processing capabilities are used in our Auto DSPs, the products leveraging our Coolflux ultra-low power DSPs, such as in our hearing aid business, and our microcontroller based products. In addition, our digital processing knowledge is used to design High Performance Mixed Signal solutions that leverage other suppliers’ digital processing products.
In 2012, we organized the High Performance Mixed Signal segment into four Business Units named: Automotive, Identification, Infrastructure & Industrial and Portable & Computing. The below table provides an overview of the key applications per Business Unit, the leading market positions and our key customers.
| Automotive | Identification | Infrastructure & Industrial | Portable & Computing | |||||
| Key applications | • Car access & immobilizers • In vehicle networking • Car entertainment • Telematics • ABS • Transmission/throttle control • Automotive Lighting | • Secure identity • Secure transactions • Tagging & authentication | • Wireless base stations • Satellite & CATV infra • Radar • Power supplies • Lighting • Personal Healthcare • TV & Set-top boxes • Mobile Handsets | • Mobile handset • Tablet • Monitor • Personal computer • Smart metering • White goods & home appliances • Pachinko machines • Medical • Industrial • Consumer | ||||
| Selected market leading positions | • #1 Can/LIN/ Flex Ray in-vehicle networking • #1 passive keyless entry/ immobilizers • #1 car radio | • #1 e-Government • #1 Transport & Access management • #1 Banking • #1 NFC | • #2 in RF Power • #1 in silicon tuners | • # 3 in interface | ||||
| Key OEM customers | • Becker • Bosch • Clarion • Continental • Delphi • Fujitsu Ten • Hyundai • Mitsubishi • Panasonic • Visteon | • Austria Card • Avery Dennison • Gemalto • Giesecke • HTC • Kona • Oberthur • Samsung • Smartrac • Sony | • Alcatel • Changhong • Ericsson • HTC • Huawei • Lite-on • NSN • Philips • Samsung • ZTE | • Apple • Cisco • Continental • Flextronics • Foxconn • Huawei • Samsung • Wistron • ZLG Electronics • ZTE |
The customers listed above represent in alphabetical order our key OEM, ODM and electronic manufacturing services customers based on 2013 revenue. Key distributors across these applications are Arrow, Avnet, Edom, Vitec and WPG. These distributors represent our top five distributors in terms of revenue in 2013 in the High Performance Mixed Signal segment.
Table of Contents
Automotive****. In the automotive market we are a leader in in-vehicle networking, car passive keyless entry and immobilization, and car radio and car audio amplifiers. We also have an emerging business in car solid state lighting drivers and are investing in growth areas, such as Car2X communication products which relate to autonomous driving.
In the can/LIN/FlexRay in-vehicle networking market, we are the market leader, having played a defining role in setting the can/LIN and more recently FlexRay standards. We are a leading supplier to major OEMs and continue to drive new system concepts, such as partial networking for enhanced energy efficiency. In the car access and immobilizers market, we lead the development of new passive keyless entry/start and two-way key concepts with our customers and, as a result, we are a key supplier to almost all car OEMs for those products. We are the market leader in AM/FM car radio chip sets.
Our leadership in mid- and high-end car radio is driven by excellent reception performance, whereas in the low-end and after-market car radio, our leadership is driven by our one-chip radio solutions that offer ease of implementation and low cost of ownership. In digital reception, we have developed multi-standard radios based on our software-defined radio implementation. Based on these software-defined radio technology, we are developing Car2X communication products. In addition, we provide class-AB and class-D audio amplifiers and power analog products for car entertainment. We leverage our proprietary processes for automotive, high-voltage, RF and non-volatile processes as well as our technology standards and leading edge security IP developed by our identification business, to deliver our automotive solutions. We are compliant with all globally relevant automotive quality standards (such as ISO/TS16949 and VDA6.3).
In 2013, we made (together with Cisco), a strategic investment in Cohda Wireless, an equipment vendor in the Intelligent Transport Systems (ITS) market with whom we co-operate for Car2X solutions. In December 2013, we announced a joint venture with Datang Telecom, targeting the China domestic hybrid and electrical car market. In December 2013, we also announced the intended sale of our Telematics Module business to Telit communications.
For the full year 2013, we had High Performance Mixed Signal revenue of $1,019 million in automotive applications, compared to $939 million in 2012, which represents a 8.5% year over year increase. According to Strategy Analytics, the total market for automotive semiconductors was $25.7 billion in 2012, and projects it will grow at a compounded annual growth rate of 7.1% between 2012 and 2016. According to Strategy Analytics’ estimates we were the fifth largest supplier of automotive semiconductors worldwide in 2012.
Identification****. Based on revenue in 2013, we have the leading position in the overall identification chip market segment, and are especially well positioned in the faster growing contactless identification IC market.
We address all segments of the market, except for the commodity SIM market. We are the largest supplier world-wide of IC’s for e-government, transportation and access management and NFC. For example, we supply to approximately 85% of worldwide e-passport projects, and our MIFARE product is used in approximately 70% of the public transport systems that have adopted electronic ticketing. We have led the development and standard setting of near field communications (NFC), which is a rapidly growing standard for secure short-range connectivity that has been established to enable secure transactions between mobile devices and point-of-sale terminals or other devices. Our leadership in the identification market is based on the strength of our security, end-to-end system contactless read speed performance, our ability to drive new standard settings and the breadth of our product portfolio. Key growth drivers will be further adoption of security ICs in governmental documents and payment cards, adoption of new security standards and the need for multi-application solutions in existing smart card markets.
For the full year 2013, we had High Performance Mixed Signal revenue of $1,297 million in identification applications, compared to $986 million in 2012, which represents a 31.5% year over year growth. According to ABI Research, the market size for identification ICs was $2.7 billion in 2012, and is expected to grow at a compounded annual rate of 15% to $4.8 billion in 2016.
Table of Contents
Infrastructure and Industrial****. We have a leading market position in high-performance radio frequency solutions, are the market leader in silicon tuners, have a broad portfolio in lighting drivers and strong positions in selected niche segments of the AC-DC power conversion and personal healthcare markets. In addition, we have an emerging business in low power connectivity and mobile audio. Our overall revenue in these businesses was $729 million in 2013 versus $634 million in 2012, which represents an increase of 15.0% year over year.
Our leading high-performance radio frequency business mainly provides RF front-end solutions for markets, such as mobile base stations, wireless connectivity, satellite and CATV infrastructure and receivers, industrial applications, and to a lesser extent addresses the military and aerospace markets. We have a leading position in RF Power Amplifiers and significant sales in Small Signal RF discretes and RF ICs for mobile, consumer electronics and cable television infrastructure, while we have emerging businesses in RF ICs for mobile base stations and monolithic microwave ICs (“MMICs”). Our leadership is based on our world-class proprietary RF process technologies and technology advancements that drive overall system performance, such as power scaling in mobile base stations. We are engaged with the majority of the largest customers in mobile base stations and in several other application areas. Key growth drivers for our high-performance RF business include infrastructure build-outs driven by the substantial growth in mobile data use and digital broadcast adoption, infrastructure development of developing countries, including China, 4G roll out, new radar implementations, and our expansion into new product markets such as wireless communications LNAs and infrastructure MMICs. We estimate that the market for RF Power Amplifiers is $1 billion in 2012 and is expected to grow with a compounded annual growth rate of 5.7% till 2016.
We are the leader in silicon tuners for televisions and set-top boxes. Our market strengths are our specialty RF process technology, decades of experience in designing tuners that work under all broadcasting standards and conditions across the world, and our innovations in new broadcasting standards. Key growth drivers for our products in these markets include the adoption of silicon tuners by TV manufacturers, penetration of new broadcast standards such as DVB-T2, DVB-C2 and DOCSIS 3.0, and the adoption of multi-tuner applications. The market for silicon tuners was $0.3 billion in 2012, and is expected to stay at this level in the period between 2012 and 2016.
In lighting, we have a broad driver portfolio serving all main segments in general lighting applications. Our strength in lighting ICs is based on our leading-edge high-voltage power analog process technologies and system optimization concepts, such as our patented technology to develop sensors-less temperature-controlled LED drivers. The lighting IC market is a high growth market, partly driven by government regulations around the world that ban or discourage the use of incandescent light bulbs and encourage or mandate CFL and LED lighting solutions and by energy-savings conscious customers.
We are a key player in high efficiency AC-DC power conversion ICs for notebook personal computers (our “green chip” solutions), and are expanding our offering into mobile device chargers. Our strength in AC-DC power conversion is based on our leading edge high-voltage power analog process technologies and engineering capabilities in designing high efficiency power conversion products. Due to worldwide conservation efforts, many countries, states and local governments have adopted regulations that increase the demand for higher power efficiency solutions in computing and consumer applications, especially in power conversion.
Our personal healthcare revenue is generated by our hearing aid products, which leverage our proprietary ultra low power Coolflux DSP, our low power audio IC design capabilities and our magnetic induction radio technology. We design customer-specific ICs for major hearing aid OEMs, and many of these customers fund our product development efforts.
In addition, we have two emerging product areas, one focused on the mobile audio market and the other on the low power connectivity market. Our mobile audio business focuses on smart speaker drivers and leverages many of the same core technologies and competencies as our personal healthcare business. In 2012 we started shipping to a key smart phone OEMs, followed by many other design wins. Our low power connectivity business started in 2010 through the acquisition of Jennic, which brought us a portfolio of 802.15.4-based low power
Table of Contents
connectivity ICs with a broad range of both the Zigbee standard-based as well as proprietary protocol stacks. With this portfolio we target the emerging Internet of Things market, starting with application solutions for smart lighting, smart energy, wireless remote controls & switches and healthcare monitoring.
We also sell software solutions for mobile phones through our NXP Software business.
The NXP Software solutions business develops audio solutions that enable mobile device manufacturers to produce differentiated hand held products that enhance the end-user experience. Our software has been incorporated into over 1 billion mobile devices produced by many of the world’s leading mobile device manufacturers.
Portable and Computing. We are a top three supplier in the fragmented interface market and have a strong portfolio in 32-bit ARM microcontrollers. Our overall High Performance Mixed Signal revenue in these businesses was $488 million in 2013, compared to $417 million in 2012, which represents a 17.0% year over year growth.
In microcontrollers, we have a strong position in multi-purpose 32-bit ARM microcontrollers serving a broad array of applications. ARM processor cores have been gaining momentum in the general purpose MCU market during the past few years. Our competitive advantage is based on having been a launching partner for several low power ARM microcontroller cores, our rich portfolio of analog and security IP, which we integrate with the ARM core into a family of microcontroller products, and our distribution leverage based on our ability to offer a full microcontroller software development kit. Our ARM Cortex M0-based products achieve pricing levels that places it squarely in competition with 8-bit microcontrollers, while offering better performance in terms of processing speed and system power consumption, expanding the addressable market for 32-bit ARM microcontrollers at the expense of 8-bit ARM microcontrollers. In 2013 we ramped up a major design win with one of the leading smart phone OEMs. Gartner3 estimates the worldwide market for Microcontrollers 32-bit to be $5.2 billion in 2012, and expects a compounded annual growth rate of 6.1% between 2012 and 20161 .
The interface products market is highly fragmented with niche markets around each of the established interface standards, where overall we were the 3rd ranked player2 in 2012 for worldwide shipments of Interface ICs. Our products address many interface standards and we serve various applications across the mobile, computing, industrial, consumer and automotive markets. We have broad product portfolios in five interface segments, being UARTs and bridges, I2C and SPI LED controllers, low power real-time clocks and watch ICs, HDMI switches and transceivers, and display port multiplexers. Our core competencies are the design of high speed interfaces, high voltage design needed for LED and LCD drivers, ultra low power design for real-time clocks and watch ICs, and our ability to engage with leading OEMs in defining new interface standards and product designs. While we successfully engage with leading OEMs to drive our innovation roadmaps, we generate a large part of our revenue by subsequently selling these products to a very broad customer base, which we serve through our distribution channel. We are engaged in development activities and standard setting initiatives with many of the innovation leaders in each of these markets. Key growth drivers will be the adoption rate of new high-speed interface standards such as display port and USB, and application specific interface products for the mobile market. According to Gartner, the worldwide Interface IC market is projected to grow at a 2.6% compounded annual rate between 2012 and 2016, from a revenue base of $1.4 billion in 20123.
Standard Products
Our Standard Products business supplies a broad range of standard semiconductor components, such as small signal discretes, power discretes, protection and signal conditioning devices and standard logic devices, which we largely produce in dedicated in-house high-volume manufacturing operations. Our portfolio consists of a large variety of catalog products, using widely-known production techniques, with characteristics that are largely standardized throughout the industry as well as leading discrete solutions especially in the field of ESD protection / EMI filtering and low loss rectification and power switching. Our Standard Products are often sold as separate components, but in many cases, are used in conjunction with our High Performance Mixed Signal
Table of Contents
solutions, often within the same subsystems. Further, we are able to leverage customer engagements where we provide standard products devices, as discrete components, within a system to identify and pursue potential High Performance Mixed Signal opportunities.
Our products are sold both directly to OEMs as well as through distribution, and are primarily differentiated on cost, packaging type and miniaturization, and supply chain performance. Alternatively, our innovative products include “design-in” products, which require significant engineering effort to be designed into an application solution. For these products, our efforts make it more difficult for a competitor to easily replace our product, which makes these businesses more predictable in terms of revenue and pricing than is typical for standard products.
Our key product applications, markets and customers are described in the table below.
| Key Products | • SS Transistors and Diodes • SS MOS • Power MOS • Bipolar Power Transistors • Thyristors • Rectifiers • Interface protection devices • General Purpose Logic | |
| Key OEM and electronic manufacturing services (EMS) customers | • Apple • Asustek • Bosch • Continental • Delphi • Delta Electronics • Flextronics • LGE • Philips • Samsung |
The customers listed above in alphabetical order represent our key OEM and electronic manufacturing services customers based on 2013 revenue. Key distributors across these applications are Arrow, Avnet, Future and WPG. These distributors represent our top four distributors in terms of revenue in 2013 in the Standard Products segment.
In 2013, our Standard Products business generated net revenue of $1,145 million, compared to $1,168 million in 2012, which represents a 2.0% year over year decline.
We are the number two global supplier of small-signal discretes with one of the broadest product portfolios in the industry. We have a strong position due to our strong cost competitiveness, supply chain performance, leverage of our OEM relationships and a broadening portfolio. We are focusing on expanding our share of higher margin products in this business. In addition, we are also building a small signal MOSFET product line, which leverages our small signal transistors and diodes packaging operations and strong customer relationships. In addition to our small signal discretes products, we have a Power MOSFET product line, which is focused on the low-voltage segment of the market. The majority of our revenue in Power MOSFETs is to automotive customers.
| 1 | Source: Gartner, Inc., Semiconductor Forecast Database, 4Q13 Update, December, 2013. |
|---|
| 2 | Source: Gartner, Inc., Market Share, Semiconductor Applications, Worldwide, 2012, April 2013. |
|---|
| 3 | The Gartner Report(s) described herein, (the “Gartner Report(s)”) represent(s) data, research opinion or viewpoints published, as part of a syndicated subscription service, by Gartner, Inc. (“Gartner”) , and are not representations of fact. Each Gartner Report speaks as of its original publication date (and not as of the date of this Filing) and the opinions expressed in the Gartner Report(s) are subject to change without notice. |
|---|
Table of Contents
We have recently introduced a new range of Automotive Power MOSFET products in our Trench 6 manufacturing process. Finally, we have small bipolar power, thyristor and rectifier product lines, which are focused on specific applications, such as white goods and power supplies, and are sold as part of our overall High Performance Mixed Signal application solutions. We estimate that the market for discretes, excluding RF & Microwave, was $18 billion in 2012 and is expected to grow at a compounded annual rate of 3%, between 2012 and 2016.
Next to discrete semiconductors, the Standard Products segment also includes Standard Logic ICs. We have a number 2 position in Standard Logic IC markets based on worldwide revenue for 20121, which we leverage in a large number of our High Performance Mixed Signal solutions. We offer several product families for low-voltage applications in communication equipment, personal computers, personal computer peripherals and consumer and portable electronics. Our 3V and 5V families hold a leading share of the logic market. We are currently expanding the higher margin product range in this business by expanding, among others, our switches and translators (or custom logic) portfolio and optimizing our manufacturing. Gartner sizes the worldwide Standard Logic market at $1.5 billion in 2012, and is estimated to grow with compound annual rate of 3.3% between 2012 and 20163.
Corporate and Other
We manufacture integrated circuits and discrete semiconductors through a combination of wholly owned manufacturing facilities, manufacturing facilities operated jointly with other semiconductor companies and third-party foundries and assembly and test subcontractors. Our manufacturing operations primarily focus on manufacturing and supplying products to our High Performance Mixed Signal and Standard Products businesses. We manage our manufacturing assets together through one centralized organization to ensure we realize scale benefits in asset utilization, purchasing volumes and overhead leverage across businesses.
In the future, we expect to outsource an increased part of our internal demand for wafer foundry and packaging services to third-party manufacturing sources in order to increase our flexibility to accommodate increased demand mainly in our High Performance Mixed Signal and to a lesser extent in Standard Products businesses.
The manufacturing of a semiconductor involves several phases of production, which can be broadly divided into “front-end” and “back-end” processes. Front-end processes take place at highly complex wafer manufacturing facilities (called fabrication plants or “wafer fabs”), and involve the imprinting of substrate silicon wafers with the precise circuitry required for semiconductors to function. The front-end production cycle requires high levels of precision and involves as many as 300 process steps. Back-end processes involve the assembly, test and packaging of semiconductors in a form suitable for distribution. In contrast to the highly complex front-end process, back-end processing is generally less complicated, and as a result we tend to determine the location of our back-end facilities based more on cost factors than on technical considerations.
We primarily focus our internal and joint venture wafer manufacturing operations on running proprietary specialty process technologies that enable us to differentiate our products on key performance features, and we generally outsource wafer manufacturing in process technologies that are available at third-party wafer foundries when it is economical to do so. In addition, we increasingly focus our in-house manufacturing on our competitive 8-inch facilities, which predominantly run manufacturing processes in the 140 nanometer, 180 nanometer and 250 nanometer process nodes, and have concentrated the majority of our manufacturing base in Asia. This focus increases our return on invested capital and reduces capital expenditures.
Our front-end manufacturing facilities use a broad range of production processes and proprietary design methods, including CMOS, bipolar, bipolar CMOS (“BiCMOS”) and double-diffused metal on silicon oxide
| 1 | Source: Gartner, Inc., Market Share, Semiconductor Applications, Worldwide, 2012, April 2013 |
|---|
Table of Contents
semiconductor (“DMOS”) technologies. Our wafer fabs produce semiconductors with line widths ranging from 140 nanometers to 3 microns for integrated circuits and 0.5 microns to greater than 4 microns for discretes. This broad technology portfolio enables us to meet increasing demand from customers for system solutions, which require a variety of technologies.
Our back-end manufacturing facilities test and package many different types of products using a wide variety of processes. To optimize flexibility, we use shared technology platforms for our back-end assembly operations. Most of our assembly and test activities are maintained in-house, as internal benchmarks indicate that we achieve a significant cost advantage over outsourcing options due to our scale and operational performance. In addition, control over these processes enables us to deliver better supply chain performance to our customers. Finally, a number of our High Performance Mixed Signal products enjoy significant packaging cost and innovation benefits due to the scale of our Standard Products business, which manufactures tens of billions of units per year.
The following table shows selected key information with respect to our major front-end and back-end facilities:
| Site | Ownership | Wafer sizes used | Line widths used (vm) | Technology | ||||||||||
| (Microns) | ||||||||||||||
| Front-end | ||||||||||||||
| Singapore(1) | 61.2 | % | 8” | 0.14-0.25 | CMOS | |||||||||
| Jilin, China(2) | 100 | % | 5” | >4 | Bipolar | |||||||||
| Nijmegen, the Netherlands | 100 | % | 8” | 0.14-0.80 | CMOS, BiCMOS, LDMOS | |||||||||
| Nijmegen, the Netherlands(3) | 100 | % | 6” | 0.50-3.0 | CMOS | |||||||||
| Hamburg, Germany | 100 | % | 6”/8” | 0.5-3.0 | Discretes, Bipolar | |||||||||
| Manchester, United Kingdom | 100 | % | 6” | 0.5 | Power discretes | |||||||||
| Back-end(4) | ||||||||||||||
| Kaohsiung, Taiwan | 100 | % | — | — | Leadframe-based packages and ball grid arrays | |||||||||
| Bangkok, Thailand | 100 | % | — | — | Low-pin count leadframes | |||||||||
| Guangdong, China | 100 | % | — | — | Discrete devices | |||||||||
| Seremban, Malaysia | 100 | % | — | — | Discrete devices | |||||||||
| Cabuyao, Philippines | 100 | % | — | — | Power discretes, sensors and RF modules processes |
| (1) | Joint venture with TSMC; we are entitled to 60% of the joint venture’s annual capacity. |
|---|
| (2) | On December 19, 2013, we acquired the remaining 40% non-controlling interest share from Jilin Sino-Microelectronics Co. Ltd. |
|---|
| (3) | Closure foreseen for 2014 Q1. |
|---|
| (4) | In back-end manufacturing we entered into a joint venture with ASE in Suzhou (ASEN), in which we currently hold a 40% interest. |
|---|
We use a large number of raw materials in our front- and back-end manufacturing processes, including silicon wafers, chemicals, gases, lead frames, substrates, molding compounds and various types of precious and other metals. Our most important raw materials are the raw, or substrate, silicon wafers we use to make our semiconductors. We purchase these wafers, which must meet exacting specifications, from a limited number of suppliers in the geographic region in which our fabrication facilities are located. At our wholly owned fabrication plants, we use raw wafers ranging from 5 inches to 8 inches in size. Our SSMC wafer fab facility, which produces 8 inch wafers, is jointly owned by TSMC and ourselves. We are leveraging our experience in that fab facility in optimizing our remaining wholly owned Nijmegen and Hamburg wafer fabs. Our other remaining fabs are small and are focused exclusively on manufacturing power discretes. Emerging fabrication technologies employ larger wafer sizes and, accordingly, we expect that our production requirements will in the future shift towards larger substrate wafers.
Table of Contents
We typically source our other raw materials in a similar fashion as our wafers, although our portfolio of suppliers is more diverse. Some of our suppliers provide us with materials on a just-in-time basis, which permits us to reduce our procurement costs and the negative cash flow consequences of maintaining inventories, but exposes us to potential supply chain interruptions. We purchase most of our raw materials on the basis of fixed price contracts, but generally do not commit ourselves to long-term purchase obligations, which permits us to renegotiate prices periodically.
In addition, on a limited basis, we also produce and sell wafers and packaging services to our divested businesses (currently Entropic Communications, Sigma Designs, IDT and DSPG) in order to support their separation and, on a limited basis, their ongoing operations. As these divested businesses develop or acquire their own foundry and packaging capabilities, our revenue from these sources is declining. Our agreement with DSPG expired in December 2010 (although we have an ongoing obligation to supply services relating to certain specialty processes until December 2014), the supplies to ST-Ericsson have effectively been terminated except for a small number of identified products. The former agreement with Trident Microsystems was converted into two separate agreements with Entropic and Sigma after Trident’s bankruptcy. The agreement with IDT is the result of the sale of our high-speed dataconverter activity to IDT.
Sales, Marketing and Customers
We market our products worldwide to a variety of OEMs, ODMs, contract manufacturers and distributors. We generate demand for our products by delivering High Performance Mixed Signal solutions to our customers, and supporting their system design-in activities by providing application architecture expertise and local field application engineering support. We have 36 sales offices worldwide.
Our sales and marketing teams are organized into six regions, which are EMEA (Europe, the Middle East and Africa), the Americas, Japan, South Korea, Greater China and Asia Pacific. These sales regions are responsible for managing the customer relationships, design-in and promotion of new products. We seek to further expand the presence of application engineers closely supporting our customers and to increase the amount of product development work that we can conduct jointly with our leading customers. Our web-based marketing tool is complementary to our direct customer technical support.
Our sales and marketing strategy focuses on deepening our relationship with our top OEMs and electronic manufacturing service customers and distribution partners and becoming their preferred supplier, which we believe assists us in reducing sales volatility in challenging markets. We have long-standing customer relationships with most of our customers. Our 10 largest OEM customers in alphabetical order are Apple, Bosch, Continental, Delphi, Gemalto, Giesecke/Devrient, Huawei, Kona, Panasonic and Samsung. When we target new customers, we generally focus on companies that are leaders in their markets either in terms of market share or leadership in driving innovation. We also have a strong position with our distribution partners, being the number two semiconductor supplier (other than microprocessors) through distribution worldwide. Our 3 largest distribution partners are Arrow, Avnet and WPG.
Based on total revenue during 2013, our top 40 OEM customers, of which some are supplied via distributors, accounted for 52% of our total revenue, our ten largest OEM customers accounted for approximately 29% of our total revenue and no customer represented more than 10% of our total revenue. We generated approximately 27% of our total revenue through our 3 largest distribution partners, of which WPG was the only larger than 10% distributor with 11% of total revenue.
Our sales and marketing activities are regulated by certain laws and government regulations, including antitrust laws, legislation governing our customers’ privacy and regulations prohibiting or restricting the transfer of technology to foreign nationals and the export of certain electronic components that may have a military application. For example, we are required to obtain licenses and authorizations under the U.S. Export Administration Regulations and the International Traffic in Arms Regulations, in order to export some of our products and technology. Further, some of our products that contain encrypted information are required to
Table of Contents
undergo a review by the Bureau of Industry and Security of the U.S. Department of Commerce prior to export. While we believe that we have been and continue to be in compliance with these laws and regulations, if we fail to comply with their requirements, we could face fines or other sanctions. For further information see the “As our business is global, we need to comply with laws and regulations in countries across the world and are exposed to international business risks that could adversely affect our business” section in Part I, Item 3D. Risk Factors.
Research and Development, Patents and Licenses, etc.
See the discussion set forth under Part I, Item 5C. Research and Development, Patents and Licenses, etc.
Competition
We compete with many different semiconductor companies, ranging from multinational companies with integrated research and development, manufacturing, sales and marketing organizations across a broad spectrum of product lines, to “fabless” semiconductor companies, to companies that are focused on a single application market segment or standard product. Most of these competitors compete with us with respect to some, but not all, of our businesses. Few of our competitors have operations across our business lines.
Our key competitors in alphabetical order include Analog Devices Inc., Atmel Corporation, Entropic Communications Inc., Fairchild Semiconductors International Inc., Freescale, Infineon, International Rectifier Corporation, Linear Technology Corporation, Maxim Integrated Products, Inc., MaxLinear, Renesas, ON Semiconductor Corporation, Power Integrations Inc., ROHM Co., Ltd., Silicon Laboratories Inc., STMicroelectronics and Texas Instruments Incorporated.
The basis on which we compete varies across market segments and geographic regions. Our High Performance Mixed Signal businesses compete primarily on the basis of our ability to timely develop new products and the underlying intellectual property and on meeting customer requirements in terms of cost, product features, quality, warranty and availability. In addition, our High Performance Mixed Signal system solutions businesses require in-depth knowledge of a given application market in order to develop robust system solutions and qualified customer support resources. In contrast, our Standard Products business competes primarily on the basis of manufacturing and supply chain excellence and breadth of product portfolio.
Legal Proceedings
The information set forth under the “Litigation” caption of Note 10 of our Notes to the Consolidated Financial Statements included in Part III, Item 18 of this Report is incorporated herein by reference. For additional discussion of certain risks associated with legal proceedings, see Part I, Item 3D. Risk Factors above.
Environmental Regulation
The information set forth under the “Environmental remediation” caption of Note 10 of our Notes to the Consolidated Financial Statements included in Part III, Item 18 of this Report is incorporated herein by reference. For additional discussion of certain risks associated with environmental regulation, see Part I, Item 3D. Risk Factors above.
C****. Organizational Structure
A list of our significant subsidiaries, including name, country of incorporation or residence and proportion of ownership interest and voting power is provided as “Exhibit 21.1” under Part III, Item 19. Exhibits and is incorporated herein by reference.
Table of Contents
CORPORATE STRUCTURE
The following chart reflects our corporate structure as of December 31, 2013.
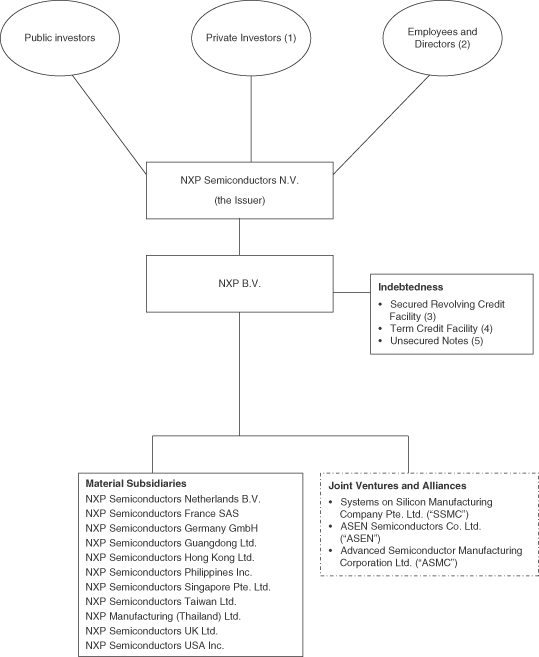
| (1) | Includes the Private Equity Consortium. |
|---|
| (2) | For a more detailed description of our management equity stock option plan (“Management Equity Stock Option Plan”) and our Long-Term Incentive Plans 2010, 2011, 2012 and 2013, see the discussion set forth under “Share Based Compensation Plans” contained in this Report in Part I, Item 6B. Compensation. |
|---|
| (3) | As of December 31, 2013, we had $150 million of borrowings outstanding under the Secured Revolving Credit Facility. |
|---|
Table of Contents
| (4) | As of December 31, 2013, we had $885 million aggregate principal amount outstanding under the Term Loans. |
|---|
| (5) | As of December 31, 2013, we had $2,250 million aggregate principal amount of Notes outstanding. |
|---|
D****. Property, Plant and Equipment
NXP uses 59 sites in over 25 countries with approximately 25,700 full-time employees, 8.3 million square feet of total owned and leased building space of which 5.7 million square feet is owned property.
The following table sets out our principal real property holdings as of December 31, 2013:
| Location | Use | Owned/leased | Building space (square feet) | |||||||
| Eindhoven, the Netherlands | Headquarters | Leased | 230,039 | |||||||
| Hamburg, Germany | Manufacturing | Owned | 798,336 | |||||||
| Nijmegen, the Netherlands | Manufacturing | Owned | 2,031,242 | |||||||
| Singapore | Manufacturing | Owned | 739,502 | |||||||
| Bangkok, Thailand | Manufacturing | Owned | 560,493 | |||||||
| Cabuyao, Philippines | Manufacturing | Owned | 444,059 | |||||||
| Kaohsiung, Taiwan | Manufacturing | Owned | 342,971 | |||||||
| Manchester, United Kingdom | Manufacturing | Owned | 273,266 | |||||||
| Jilin, China | Manufacturing | Leased | 138,850 | |||||||
| Guangdong, China | Manufacturing | Leased | 889,374 | |||||||
| Seremban, Malaysia | Manufacturing | Owned | 316,471 |
The following is a summary of the terms of our material lease agreements:
Manufacturing in Singapore (SSMC) leases the land at 70 Pasir Ris Drive 1 in Singapore from Jurong Town Corporation for use as a manufacturing facility. The lease commenced on June 1, 1999 for a term of 30 years at an annual rental rate of 1,484,584 Singapore Dollars ($1,174,141), which amount is subject to revision up to, but not exceeding, 5% of the yearly rent for the immediately preceding year, on the anniversary of the lease commencement date. The building has 739,502 square feet of floor space and is owned by us.
We lease 889,374 square feet of manufacturing space through our subsidiary, NXP Semiconductors Guangdong Ltd., at Tian Mei High Tech, Industrial Park, Huang Jiang Town, Dongguan City, Guangdong, China, from Huangjiang Investment Development Company (“Huangjiang”). The lease commenced on October 1, 2003 for a term of 13 years at an annual rental rate calculated to be the greater of: (a) a yearly rental rate of RMB96 ($16) per square meter or (b) a yearly rent equal to 13% of the actual construction cost of the leased facility. The rental amount is subject to revision on an annual basis, subject to the interest rate Huangjiang must pay for loans used in the construction of the facilities agreed upon in the lease.
Item 4A. Unresolved Staff Comments
| --- | --- |
Not applicable.
Item 5. Operating and Financial Review and Prospects
| --- | --- |
A. Operating Results
Effect of Acquisition Accounting
Our Formation
On September 29, 2006, Philips sold 80.1% of its semiconductor business to the Private Equity Consortium in a multi-step transaction. We refer to this acquisition as our “Formation”.
Table of Contents
The Formation has been accounted for using the acquisition method. Accordingly, the $10,601 million purchase price has been “pushed down” within the NXP group and allocated to the fair value of assets acquired and liabilities assumed.
The carrying value of the net assets acquired and liabilities assumed, as of the Formation date on September 29, 2006, amounted to $3,302 million. This resulted in an excess of the purchase price over the carrying value of $7,299 million. The excess of the purchase price was allocated to intangible assets, step-up on tangible assets and liabilities assumed, using the estimated fair value of these assets and liabilities.
An amount of $3,096 million, being the excess of the purchase price over the estimated fair value of the net assets acquired, was allocated to goodwill. This goodwill is not amortized, but is tested for impairment at least annually.
Other Significant Acquisitions
Since its Formation, NXP has acquired various companies and businesses. These acquisitions have been accounted for using the acquisition method, and the respective purchase prices have been “pushed down” within the NXP group and allocated to the fair value of the assets acquired and the liabilities assumed. This has also resulted in an allocation to goodwill for the excess of the purchase price over the estimated fair value of the net assets acquired. The related goodwill is not amortized but included in the annual impairment test.
Adjusting the carrying value of the assets acquired in the Formation and subsequent acquisitions to their fair value has had an adverse effect on our operating income for various reporting periods, stemming from amortization charges on intangible assets and higher depreciation charges on tangible fixed assets that are the result of acquisition accounting effects.
The cumulative net effect resulting from the application of acquisition accounting is recorded in the financial statements with the term “PPA effect”. This effect is calculated taking into account the fact that any divestments and impairments in any particular reporting period reduce the amortization and depreciation charges going forward. Impairment losses are not part of the PPA effect.
Use of Certain Non-GAAP Financial Measures
Net debt is a non-GAAP financial measure and represents total debt (short-term and long-term debt) after deduction of cash and cash equivalents. Management believes this measure is a good reflection of our net leverage.
We understand that, although net debt is used by investors and securities analysts in their evaluation of companies, this concept has limitations as an analytical tool, and it should not be used as an alternative to any other measure in accordance with U.S. GAAP.
Year Ended December 31, 2013 Compared to Year Ended December 31, 2012
Results of Operations
The following table presents the composition of operating income (loss) for the years ended December 31, 2013 and 2012.
| ($ in millions, unless otherwise stated) | 2013 | 2012 | ||||||
| Revenue | 4,815 | 4,358 | ||||||
| % nominal growth | 10.5 | 3.9 | ||||||
| Gross profit | 2,177 | 1,988 | ||||||
| Research and development | (639 | ) | (628 | ) | ||||
| Selling, general and administrative (SG&A) | (896 | ) | (977 | ) | ||||
| Other income (expense) | 9 | 29 | ||||||
| Operating income (loss) | 651 | 412 |
Table of Contents
Revenue
The following table presents revenue by segment for the years ended December 31, 2013 and 2012.
| ($ in millions, unless otherwise stated) | For the year ended December 31, | |||||||||||||||
| 2013 | 2012 | |||||||||||||||
| Revenue | % nominal growth | Revenue | % nominal growth | |||||||||||||
| High Performance Mixed Signal | 3,533 | 18.7 | 2,976 | 12.2 | ||||||||||||
| Standard Products | 1,145 | (2.0 | ) | 1,168 | (3.9 | ) | ||||||||||
| Corporate and Other | 137 | (36.0 | ) | 214 | (34.2 | ) | ||||||||||
| Total | 4,815 | 10.5 | 4,358 | 3.9 |
Revenue increased by $457 million to $4,815 million in 2013 compared to $4,358 million in 2012, a nominal increase of 10.5%. The increase was driven by strong growth in HPMS which was partly offset by a decline in revenue from our SP segment and from Corporate and Other.
Our HPMS segment saw an increase in revenue of $557 million to $3,533 million in 2013 compared to $2,976 million in 2012. The increase was primarily driven by increased volumes in all four Business Units (Automotive, Identification, Infrastructure & Industrial and Portable & Computing). The highest volume increase was associated with our banking business within our Identification portfolio and within our Portable & Computing portfolio.
Revenue for our SP segment declined by $23 million to $1,145 million in 2013, compared to $1,168 million in 2012. The decline was primarily due to competitive pricing pressure in our protection and signal conditioning devices business.
Revenue from Corporate and Other amounted to $137 million in 2013, compared to $214 million in 2012 and mainly related to our manufacturing operations. The decline in revenue was primarily due to the expiration of contractual obligations to provide manufacturing services for previously divested businesses. As these businesses develop or acquire their own foundry and packaging capabilities, our revenue from these sources will further decline.
Gross Profit
The following table presents gross profit by segment for the years ended December 31, 2013 and 2012.
| 2013 | 2012 | |||||||||||||||
| ($ in millions, unless otherwise stated) | Gross Profit | % of segment revenue | Gross Profit | % of segment revenue | ||||||||||||
| HPMS | 1,905 | 53.9 | 1,656 | 55.6 | ||||||||||||
| SP | 285 | 24.9 | 346 | 29.6 | ||||||||||||
| Corporate and Other | (13 | ) | (9.5 | ) | (14 | ) | (6.5 | ) | ||||||||
| Total | 2,177 | 45.2 | 1,988 | 45.6 |
Gross profit in 2013 was $2,177 million, or 45.2% of revenue compared to $1,988 million, or 45.6% of revenue in 2012, an increase of $189 million. The increase in gross profit was mainly driven by higher revenue in the HPMS segment, partly offset by lower revenue due to competitive pricing pressure in our SP segment and the absence of the favorable legal award recorded in the second quarter of 2012 that increased our margin percentage. We were awarded a favorable judgment involving a dispute over the collection of a receivable that we recorded an allowance for doubtful accounts that impacted costs of revenue in a prior year. The arbitration tribunal arrived
Showing the first 8K of 140K characters. Open the full section
Item 7. Major Shareholders and Related Party Transactions
| --- | --- |
A. Major Shareholders
The following table shows the amount and percentage of our common stock beneficially owned as of December 31, 2013, December 31, 2012 and December 31, 2011 by (i) each person who is or was known by us to own beneficially more than 5% of our common stock, (ii) each current member of our board of directors, and (iii) all members of the board and named executive officers as a group. A person is a “beneficial owner” of a security if that person has or shares voting or investment power over the security or if he has the right to acquire beneficial ownership within 60 days. Unless otherwise noted, these persons may be contacted at our executive offices and, unless otherwise noted, have to our knowledge sole voting and investment power over the shares listed.
As shown in the table below, the Private Equity Consortium beneficially owned 14.82% of our shares of common stock as of December 31, 2013.
| Common Stock Beneficially Owned as of December 31 | ||||||||||||||||||||||||
| 2013 | 2012 | 2011 | ||||||||||||||||||||||
| Number | %* | Number** | %* | Number | %* | |||||||||||||||||||
| Funds advised by KKR(1)(2) | 14,059,822 | 5.58 | 32,197,150 | 12.79 | 40,028,656 | 15.90 | ||||||||||||||||||
| Funds advised by Bain(3)(6) | 7,744,241 | 3.08 | 25,756,791 | 10.23 | 32,021,770 | 12.72 | ||||||||||||||||||
| Funds advised by Silver Lake(4)(6) | 3,872,444 | 1.54 | 12,879,469 | 5.12 | 16,012,220 | 6.36 | ||||||||||||||||||
| Funds advised by Apax(5)(6) | 4,355,793 | 1.73 | 14,487,057 | 5.75 | 18,010,831 | 7.15 | ||||||||||||||||||
| Funds advised by Alpinvest(6) | 1,935,786 | 0.77 | 6,438,284 | 2.56 | 8,004,306 | 3.18 | ||||||||||||||||||
| NXP Co-Investment Investor S.a.r.l.(2)(7) | 5,290,174 | 2.10 | 15,029,155 | 5.97 | 18,684,787 | 7.42 | ||||||||||||||||||
| PPTL Investment LP | — | — | 16,549,097 | 6.57 | 30,517,299 | 12.12 | ||||||||||||||||||
| Wellington Management Company, LLP(8) | 28,935,677 | 11.49 | — | — | — | — | ||||||||||||||||||
| FMR and FIL(9) | 23,180,919 | 9.21 | — | — | — | — | ||||||||||||||||||
| T.Rowe(10) | 18,606,181 | 7.39 | — | — | — | — | ||||||||||||||||||
| Richard L. Clemmer | 3,224,174 | 1.28 | 1,309,587 | 0.52 | 809,357 | 0.32 | ||||||||||||||||||
| Sir Peter Bonfield | 43,549 | 0.02 | 27,897 | 0.01 | 13,695 | 0.005 | ||||||||||||||||||
| Johannes P. Huth | 89,999 | 0.04 | 79,999 | 0.03 | 73,333 | 0.03 | ||||||||||||||||||
| Kenneth Goldman | 22,999 | 0.01 | 14,999 | 0.01 | 8,333 | 0.003 | ||||||||||||||||||
| Dr. Marion Helmes | — | — | — | — | — | — | ||||||||||||||||||
| Josef Kaeser | 19,999 | 0.01 | 9,999 | 0.004 | 3,333 | 0.001 | ||||||||||||||||||
| Ian Loring(11) | 7,764,240 | 3.08 | 25,766,790 | 10.24 | 3,333 | 0.001 | ||||||||||||||||||
| Michel Plantevin | 19,999 | 0.01 | 9,999 | 0.004 | 3,333 | 0.001 | ||||||||||||||||||
| Jean-Pierre Saad | — | — | — | — | — | — | ||||||||||||||||||
| Julie Southern | — | — | — | — | — | — | ||||||||||||||||||
| All directors and named executive officers as a group(12) | 11,184,959 | 4.45 | 27,219,270 | 10.81 | 914,717 | 0.4 |
Table of Contents
| * | Percentage computations are based on 251,751,500 shares of our common stock issued and outstanding as of December 31, 2013, December 31, 2012 and December 31, 2011. |
|---|
| ** | As of February 7, 2013. |
|---|
| (1) | As of December 31, 2013, KKR’s affiliates and certain funds advised by KKR, through various KKR-affiliated entities, hold shares of our common stock through a Luxembourg holding company. The following KKR-affiliated entities (the “KKR Entities”) have an indirect interest in 14,059,822 shares of our common stock through their ownership of such Luxembourg holding company: KKR NXP (2006) Limited(1,096,471 shares); KKR NXP (European II) Limited (7,028,661 shares); KKR NXP (Millennium) Limited (5,934,687 shares); and KKR Associates Europe II Limited Partnership (3 shares). As the designated members of KKR Management LLC (which may be deemed to indirectly control one or more general partners, stockholders or members of the entities that own or control the KKR Entities), Henry R. Kravis and George R. Roberts may be deemed to beneficially own the shares of our common stock indirectly held by the KKR Entities, but disclaim beneficial ownership of such shares. In addition, as the voting partner of certain affiliates of the KKR Entities, KKR SP Limited may be deemed to beneficially own the shares of our common stock indirectly held by the KKR Entities, but disclaims beneficial ownership of such shares. The principal business address of each of the entities and persons identified in this footnote except Mr. Roberts is c/o Kohlberg Kravis Roberts & Co. L.P., 9 West 57th Street, New York, NY 10019, U.S.A. The principal business office for Mr. Roberts is c/o Kohlberg Kravis Roberts & Co. L.P., 2800 Sand Hill Road, Suite 200, Menlo Park, CA 94025, U.S.A. We understand that the KKR Entities have sold 2,778,751 of our shares of common stock on or after February 19, 2014, in addition to the shares sold to us on February 19, 2014. |
|---|
| (2) | On February 19, 2014, we entered in a share repurchase agreement with KKR NXP Investors S.à.r.l. and NXP Co-Investment Investor S.à.r.l. to repurchase 5,000,000 shares of our common stock from the KKR Entities and from NXP Co-Investment Partners S.à.r.l. at a price per share based on the market closing price. See Note 20 “Subsequent events” of our Notes to the Consolidated Financial Statements included in Part III, Item 18 of this Report. |
|---|
| (3) | As of December 31, 2013, Bain Pumbaa LuxCo S.à.r.l. owns 7,744,241 shares of our common stock. As a shareholder of Bain Pumbaa LuxCo S.à.r.l., Bain Capital Lion Holdings, L.P. (“Lion Holdings”) has voting and dispositive power over 7,744,241 shares of our common stock held by Bain Pumbaa LuxCo S.à.r.l. and may be deemed to beneficially own all shares of our common stock held by Bain Pumbaa LuxCo S.à.r.l. Bain Capital Investors, LLC (“BCI”) is the managing general partner of Lion Holdings. As a result, BCI may be deemed to beneficially own all of the shares of our common stock held by Lion Holdings, but disclaims beneficial ownership of such shares of our common stock. BCI is controlled by an investment committee composed of 22 members, Andrew Balson, Steven Barnes, Joshua Bekenstein, Louis Bremer, John Connaughton, Todd Cook, Paul Edgerley, Christopher Gordon, Blair Hendrix, Jordan Hitch, David Humphrey, John Kilgallon, Lewis Klessel, Matthew Levin, Ian Loring, Philip Loughlin, Seth Meisel, Mark Nunnelly, Stephen Pagliuca, Ian Reynolds, Mark Verdi and Stephen Zide. Each such investment committee member, disclaims beneficial ownership of shares indirectly held by Lion Holdings. In addition, the Bain affiliated funds and individuals named above may be deemed by virtue of their rights under the shareholders’ agreement with respect to the Company to share voting power with respect to the shares of our common stock held by the other parties to the shareholders’ agreement, but disclaim beneficial ownership of such shares. The address of BCI and of Lion Holdings is John Hancock Tower, 200 Clarendon Street, Boston, MA 02116, U.S.A. |
|---|
| (4) | As of December 31, 2013, SL II NXP S.à.r.l. owns 3,872,444 shares of our common stock. SLP II Cayman NXP, Ltd. owns 99.57% of the outstanding shares of our common stock held by SL II NXP S.à.r.l. and may be deemed to beneficially own all shares of our common stock held by SL II NXP S.à.r.l. Silver Lake Partners II Cayman, L.P. is the sole shareholder of SLP II Cayman NXP, Ltd. Silver Lake Technology Associates II Cayman, L.P. is the general partner of Silver Lake Partners II Cayman, L.P. Silver Lake (Offshore) AIV GP II, Ltd. is the general partner of Silver Lake Technology Associates II Cayman, L.P. Because of the foregoing relationships, each of SLP II Cayman NXP, Ltd., Silver Lake Partners II Cayman, L.P., Silver Lake Technology Associates II Cayman, L.P. and Silver Lake (Offshore) AIV GP II, Ltd. (together, the “Silver Lake Funds”) may be deemed to beneficially own all of the shares of our common stock held by SL II NXP S.à.r.l. Messrs. James A. Davidson, Glenn H. Hutchins, David J. Roux, Alan K. Austin, Michael J. Bingle, Gregory |
|---|
Table of Contents
| Keith Mondre, Charles Giancarlo, Andrew Wagner and Kenneth Y. Hao and Mses. Karen King and Yolande A. Jun serve as directors of Silver Lake (Offshore) AIV GP II, Ltd. They disclaim beneficial ownership of the ordinary shares indirectly owned by the Silver Lake Funds. In addition, the Silver Lake affiliated funds and individuals named above may be deemed by virtue of their rights under the shareholders’ agreement with respect to the Company to share voting power with respect to the shares of our common stock held by the other parties to the shareholders’ agreement, but disclaim beneficial ownership of such shares. Silver Lake’s address is c/o 2775 Sand Hill Road, Suite 100 Menlo Park, CA 94025, U.S.A. According to filings made by SL II NXP S.à.r.l., we understand that SL II NXP S.à.r.l. has sold 350,000 of our shares of common stock on or after February 7, 2014. |
|---|
| (5) | As of December 31, 2013, Meridian Holding S.à r.l. owns 4,355,793 shares of our common stock. Apax NXP VI A L.P. is an English limited partnership and owns 66.59% of the outstanding shares of Meridian Holding S.à.r.l. Apax NXP (UK) VI A1 GP Co. Ltd, an English private limited company, is the general partner of Apax NXP VI A L.P. Apax WW Nominees Ltd, an English company, holds, directly or indirectly, 100% of the interests in Apax NXP (UK) VI A1 GP Co. Ltd as nominee for Apax Partners Europe Managers Ltd, the custodian of Apax Europe VI-A, L.P., an English limited partnership. Apax Europe VI GP L.P. Inc., a Guernsey limited partnership, is the general partner of Apax Europe VI-A, L.P. Apax Europe VI GP Co. Limited, a Guernsey company, is the general partner of Apax Europe VI GP L.P. Inc. Apax Partners Europe Managers Ltd, an English company, holds 100% of the interests in Apax WW Nominees Ltd. Apax Partners Europe Managers Ltd has also been appointed by Apax Europe VI GP L.P. Inc. (acting by Apax Europe VI GP Co. Limited, its general partner) as discretionary investment manager of the investments of Apax Europe VI-A, L.P. Apax Partners Europe Managers Ltd, Apax Europe VI GP Co. Limited and Apax Europe VI GP L.P. Inc. are responsible for the investments and general administration of Apax Europe VI-A, L.P. Because of the foregoing relationships, each of Apax NXP VI A L.P., Apax NXP (UK) VI A1 GP Co. Ltd, Apax Europe VI-A, L.P., Apax Europe VI GP L.P. Inc., Apax Europe VI GP Co. Limited and Apax Partners Europe Managers Ltd may be deemed to beneficially own all of the shares of our common stock held by Meridian Holding S.à.r.l. As directors and shareholders of Apax Partners Europe Managers Ltd., Martin Halusa, Nico Hansen and Michael Phillips may be deemed to beneficially own the shares of our common stock indirectly held by Apax Europe VI, but disclaim ownership of such shares. In addition, the Apax-affiliated funds and individuals named above may be deemed by virtue of their rights under the shareholders’ agreement with respect to the Company to share voting power with respect to the shares of our common stock held by the other parties to the shareholders’ agreement, but disclaim beneficial ownership of such shares. The address of Apax Partners LLP and Apax Partners Europe Managers Ltd. is 33 Jermyn Street, London SW1Y 6DN, England, and the address of Apax Partners L.P. is 601 Lexington Avenue, 53rd Floor, New York, NY 10022, U.S.A. We understand that Meridian Holding S.à.r.l. has sold its entire holding of our shares of common stock on or after February 17, 2014. |
|---|
| (6) | As of December 31, 2013, AlpInvest Partners CSI 2006 Lion C.V. owns 1,935,786 shares in our common stock and AlpInvest Partners Later Stage II-A Lion C.V. owns 26,444 shares of our common stock. As the managing director of AlpInvest Partners Beheer 2006 B.V. (which manages AlpInvest Partners CSI 2006 Lion C.V. and AlpInvest Partners Later Stage II-A Lion C.V.), AlpInvest Partners B.V. may be deemed to hold voting and dispositive power with respect to the shares in our common stock beneficially owned by AlpInvest Partners CSI 2006 Lion C.V. and AlpInvest Partners Later Stage II-A Lion C.V., but disclaims beneficial ownership of such shares. As managing directors of AlpInvest Partners B.V. Volkert Doeksen and Johan Paul de Klerk may be deemed to beneficially own the shares of our common stock owned by AlpInvest Partners Later Stage II-A Lion C.V. and AlpInvest Partners CSI 2006 Lion C.V., but disclaim beneficial ownership of such shares. In addition, the AlpInvest-affiliated funds and individuals named above may be deemed by virtue of their rights under the shareholders’ agreement with respect to the Company to share voting power with respect to the shares of our common stock held by the other parties to the shareholders’ agreement, but disclaim beneficial ownership of such shares. AlpInvest’s address is c/o AlpInvest Beheer, Jachthavenweg 118, 1081 KJ Amsterdam, the Netherlands. We understand that AlpInvest Partners CSI 2006 Lion C.V. has sold its entire holding of our shares of common stock on or after February 19, 2014. |
|---|
| (7) | As the general partner of NXP Co-Investment Partners L.P. (the 100% direct parent company of NXP Co-Investment Partners S.a.r.l.). As the general partner of NXP Co-Investment Partners L.P., NXP Co- |
|---|
Table of Contents
| Investment GP Ltd. beneficially owns the shares held indirectly by NXP Co-Investment Partners L.P. Funds and entities advised by KKR, Bain, Silver Lake and Apax own NXP Co-Investment GP Ltd., but none of them own a majority, and none may be deemed to beneficially own them. We understand that NXP Co-Investment Investor S.a.r.l. has sold 2,145,216 of our shares of common stock as of February 12, 2014. |
|---|
| (8) | Wellington Management Company, LLP (“Wellington Management”), in its capacity as investment adviser, may be deemed to beneficially own 28,935,677 shares of our common stock, which are held by its clients and with regard to which Wellington Management has shared voting power and shared dispositive power. Wellington Management’s address is 28 Congress Street, Boston, Massachusetts, 02210, United States. |
|---|
| (9) | FMR LLC and/or Edward C. Johnson 3d, chairman of FMR LLC (collectively, “FMR”), through, among others, Fidelity Management & Research Company “Fidelity”), Strategic Advisers, Inc. (“SA”), Pyramis Global Advisors, LLC (“PGALLC”) and Pyramis Global Advisors Trust Company (“PGATC”), and/or FIL Limited (“FIL”), through, among others, various subsidiaries, are, directly or indirectly, the beneficial owners of 23,180,919 shares of our common stock. The address of Fidelity and SA is 82 Devonshire Street, Boston, Massachusetts 02109, United Sates. The address of PGALLC and PGATC is 900 Salem Street, Smithfield, Rhode Island 02917, United States. The address of FIL is Pembroke Hall, 42 Crow Lane, Hamilton, Bermuda. |
|---|
| (10) | T.Rowe Rice Associates, inc. (“T.Rowe”), in its capacity as investment adviser, may be deemed to beneficially own 18,606,181 shares of our common stock, which are held by its clients. T.Rowe’s address is 100 E. Pratt Street, Baltimore, Maryland 21202, United States. |
|---|
| (11) | Mr. Loring is a director of our Company, as well as a member of the investment committee of Bain Capital Investors, LLC. Amounts disclosed for Mr. Loring include shares beneficially owned by the funds advised by Bain. Mr. Loring disclaims beneficial ownership of any shares owned directly or indirectly by funds advised by Bain. |
|---|
| (12) | Reflects shares that may be beneficially owned by our directors. However, each director disclaims beneficial ownership of such shares. In addition, as of December 31, 2013, stock options and other rights to shares represented a total of 23,449,381 shares of common stock were outstanding. |
|---|
B. Related Party Transactions
Private Equity Consortium
Advisory Services Agreements
KKR and Bain as members of the Private Equity Consortium provide certain advisory services to us. We have entered into separate agreements in this regard with the respective parties, under which each of the various legal entities will receive an annual advisory fee of $25,000 (with an aggregate total amount of $50,000 annually).
Shareholders’ Agreement
Prior to the consummation of the initial public offering in August 2010, the members of the Private Equity Consortium restructured their indirect shareholding in our common stock such that each of them holds directly, or indirectly through a separate Luxembourg holding company, shares of our common stock. At the same time, KASLION Holding B.V. ceased to hold shares of our common stock. In connection with this restructuring, the members of the Private Equity Consortium and the Management Foundation (together, the “Existing Shareholders”) entered into a new shareholders’ agreement among themselves, which replaced the shareholders’ agreement entered into on September 29, 2006. We are not a party to the new shareholders’ agreement.
Under the terms of the new shareholders’ agreement, the Existing Shareholders and any affiliate to which the Existing Shareholders transfer common stock were only allowed to sell shares of our common stock after having received approval from an investors committee consisting of representatives of the Private Equity Consortium. These restrictions terminated as a result of the secondary offering of December 10, 2013 when the Existing Shareholders collectively ceased to hold less than 25% of shares of our common stock.
Table of Contents
The new shareholders’ agreement also contains voting agreements among the Existing Shareholders with respect to, among other matters, the election of certain non-executive members to our board of directors. These voting arrangements terminated as a result of the secondary offering on December 10, 2013 when the existing shareholders collectively ceased to hold at least 25% of shares of our common stock. The shareholders’ agreement provides that our board of directors shall be comprised of, among others, seven non-executive members and that certain stockholders have the right to designate such non-executive members, subject to their election by our general meeting of stockholders. So long as any fund advised by KKR and Bain beneficially owns at least 2.5% of the outstanding shares of our common stock, each such fund shall have the right to designate two members to our board of directors. If any party’s shareholding falls below the relevant threshold, it will cause the board member(s) nominated by it to promptly resign from the board of directors, unless otherwise agreed.
The new shareholders agreement will terminate upon the occurrence of certain events, including: (i) with respect to the individual parties to the agreement, upon such party ceasing to hold shares of common stock and (ii) with respect to all parties, upon certain parties’ collective shareholdings falling below specified thresholds.
Registration Rights Agreement
In connection with the restructuring, the Existing Shareholders and certain other investors have entered into a registration rights agreement with us. In accordance with the registration rights agreement, we have filed a shelf registration statement on Form F-3 with the SEC on August 23, 2011. In addition, the registration rights agreement provides the Existing Shareholders with an unlimited number of demand registration rights and with piggyback registration rights, with a right to participate for certain other investors, which, in either case if exercised, would impose on us an obligation to register for public resale with the SEC shares of our common stock that are held by the Existing Shareholders or such other investors, in any. The demand registration rights can be exercised at any time after the expiration of the lockup period. The piggyback registration rights may be exercised whenever we propose to register any of our securities under the Securities Act or equivalent non-U.S. securities laws, other than the initial public offering on August 5, 2010 or a registration pursuant to demand registration rights, on Form F-4 or S-4 or any successor form or solely relating to an offering and sale to our employees or directors pursuant to any employee stock option plan or any other benefit plan arrangement. In each such event, we are required to pay the registration expenses.
C****. Interests of Experts and Counsel
Not applicable.
Item 8. Financial Information
| --- | --- |
A. Consolidated Statements and Other Financial Information
Consolidated Statements
See Part III, Item 18. Financial Statements.
Dividend Policy
Our ability to pay dividends on our common stock is limited by the covenants of our Secured Revolving Credit Facility, the Term Loans and the Indentures and may be limited by the terms of any future debt or preferred securities. As a result, we currently retain all of our earnings for use in the operation and expansion of our business, to repurchase or redeem capital stock, and in the repayment of our debt. We never declared or paid any cash dividends on our common stock and may not pay any cash dividends in the foreseeable future. Whether or not dividends will be paid in the future will depend on, among other things, our results of operations, financial condition, level of indebtedness, cash requirements, contractual restrictions and other factors that our board of directors and our stockholders may deem relevant. If, in the future, our board of directors decides not to allocate profits to our reserves (making such profits available to be distributed as dividends), any decision to pay dividends on our common stock will be at the discretion of our stockholders.
Table of Contents
B. Significant Changes
No significant changes have occurred since the date of our Consolidated Financial Statements.
Item 9. The Offer and Listing
| --- | --- |
A****. Offer and Listing Details
Not applicable.
The following table shows the high and low closing sales prices of the common stock on the stock market of NASDAQ as reported in the Official Price List since its introduction on August 6, 2010. The introduction price was fixed on August 5, 2010 at $14.00 per share.
| Most recent six months | ||||||||||||||||||||||
| January 2014 | December 2013 | November 2013 | October 2013 | September 2013 | August 2013 | |||||||||||||||||
| High | Low | High | Low | High | Low | High | Low | High | Low | High | Low | |||||||||||
| 48.35 | 42.94 | 45.95 | 41.94 | 42.50 | 40.32 | 42.14 | 36.03 | 39.11 | 37.02 | 37.93 | 34.78 |
On February 21, 2014, the closing sales price of the common stock on the stock market of NASDAQ was $56.15.
| 2013 | 2012 | 2011 | ||||||||||||||||||||||
| High | Low | High | Low | High | Low | |||||||||||||||||||
| 1st quarter | 32.80 | 26.55 | 26.97 | 16.01 | 31.95 | 21.43 | ||||||||||||||||||
| 2nd quarter | 32.01 | 25.29 | 26.32 | 18.81 | 34.18 | 22.65 | ||||||||||||||||||
| 3rd quarter | 39.11 | 31.18 | 26.67 | 20.03 | 27.51 | 14.03 | ||||||||||||||||||
| 4th quarter | 45.95 | 36.03 | 26.32 | 20.93 | 19.66 | 13.68 |
B. Plan of Distribution
Not applicable.
C. Markets
The shares of common stock of the Company are listed on the stock market of the NASDAQ Global Select Market in New York under the ticker symbol “NXPI”.
D. Selling Shareholders
Not applicable.
E. Dilution
Not applicable.
F. Expenses of the Issue
Not applicable.
Item 10. Additional Information
| --- | --- |
A. Share Capital
Not applicable.
B. Memorandum and Articles of Association
The information required by this section is incorporated by reference to Exhibit 3.2 of Amendment No. 7 to the Company’s Registration Statement on Form F-1, filed on August 5, 2010 (File No. 333-166128).
C. Material Contracts
Other than the material contracts described below, we have not entered into any material contracts other than in the ordinary course of business.
Table of Contents
NXP B.V. and NXP Funding LLC entered into Indentures in relation to (i) $500 million aggregate principal amount of U.S. Dollar-denominated 5.75% senior notes due 2021 on February 14, 2013. (ii) $500 million aggregate principal amount of U.S. Dollar-denominated 5.75% senior notes due 2023, on March 13, 2013 (iii) $750 million aggregate principal amount of U.S. Dollar-denominated 5.75% senior notes due 2018, on May 20, 2013, and (iv) $750 million aggregate principal amount of U.S. dollar-denominated 3.5% senior notes due 2016, on September 24, 2013.
D. Exchange Controls
Cash dividends payable on our ordinary shares and cash interest payments to holders of our debt securities may be remitted from the Netherlands to nonresidents without legal restrictions imposed by the laws of the Netherlands, except that (i) such payments must be reported to the Dutch Central Bank for statistical purposes only and (ii) the transfer of funds to jurisdictions subject to general economic sanctions adopted in connection with policies of the United Nations, European Commission or similar measures imposed directly by the Government of the Netherlands may be restricted.
E. Taxation
Certain Tax Considerations-Holder of Common Stock
Summary of Dutch Tax Considerations
The following summary describes the material Dutch tax consequences of the ownership and disposition of our shares of common stock as of the date hereof and is intended as general information only. This summary does not contain a detailed description of all the Dutch tax law consequences to you as a holder of shares of common stock in the Company in light of your particular circumstances and does not address the effects of any non-Dutch tax laws. For Dutch tax purposes, a holder of our shares may include an individual who or an entity that does not have the legal title of the shares, but to whom nevertheless the shares are attributed based either on such individual or entity holding a beneficial interest in the shares or based on specific statutory provisions, including statutory provisions pursuant to which shares are attributed to an individual who is, or who has directly or indirectly inherited from a person who was, the settlor, grantor or similar originator of a trust, foundation or similar entity that holds the shares.
If you are considering the purchase, ownership or disposition of our shares, you should consult your own tax advisors concerning the Dutch tax consequences to you in light of your particular situation as well as any consequences arising under the laws of any other taxing jurisdiction.
The following summary is based on the Dutch tax law as applied and interpreted by Dutch tax courts and as published and in effect on the date hereof, without prejudice to any amendments introduced at a later date and implemented with or without retroactive effect. For the purpose of this paragraph, “Dutch taxes” means taxes of whatever nature levied by or on behalf of the Netherlands or any of its subdivisions or taxing authorities. The Netherlands means the part of the Kingdom of the Netherlands located in Europe and does not include Bonaire, St. Eustatius and Saba. Any reference hereafter made to a treaty for the avoidance of double taxation concluded by the Netherlands includes the Tax Regulation for the Kingdom of the Netherlands (Belastingregeling voor het Koninkrijk), the Tax Regulation for the country of the Netherlands (Belastingregeling voor het land Nederland) and the Agreement between the Taipei Representative Office in the Netherlands and the Netherlands Trade and Investment Office in Taipei for the avoidance of double taxation.
Withholding Tax
A stockholder is generally subject to Dutch dividend withholding tax at a rate of 15 percent on dividends distributed by us, if any. Generally, we are responsible for the withholding of such dividend withholding tax at source; the dividend withholding tax is for the account of the stockholder.
Table of Contents
Dividends distributed by us include, but are not limited to:
| (i) | distributions of profits in cash or in kind, whatever they be named or in whatever form; |
|---|
| (ii) | proceeds from the liquidation of the Company, or proceeds from the repurchase of shares by the Company, in excess of the average paid-in capital recognized for Dutch dividend withholding tax purposes; |
|---|
| (iii) | the par value of shares issued to a stockholder or an increase in the par value of shares, to the extent that no contribution, recognized for Dutch dividend withholding tax purposes, has been made or will be made; and |
|---|
| (iv) | partial repayment of paid-in capital, that is not recognized for Dutch dividend withholding tax purposes, or recognized for Dutch dividend withholding tax purposes, to the extent that we have net profits (zuivere winst) and unless (a) the general meeting of stockholders has resolved in advance to make such repayment, and (b) the par value of the shares concerned has been reduced with an equal amount by way of an amendment to our articles of association. The term net profits includes anticipated profits that have yet to be realized. |
|---|
Notwithstanding the above, no withholding is required in the event of a repurchase of shares, if certain conditions are fulfilled.
Furthermore, subject to certain exceptions under Dutch domestic law, we may not be required to transfer to the Dutch tax authorities the full amount of Dutch dividend withholding tax withheld in respect of dividends distributed by us, if we have received a profit distribution from a qualifying foreign subsidiary (including a subsidiary resident on Bonaire, St. Eustatius or Saba), which distribution is exempt from Dutch corporate income tax and has been subject to a foreign withholding tax of at least 5 percent. The amount that does not have to be transferred to the Dutch tax authorities can generally not exceed the lesser of (i) 3 percent of the dividends distributed by us and (ii) 3 percent of the profit distributions that we received from qualifying foreign subsidiaries in the calendar year in which we distribute the dividends (up to the moment of such dividend distribution) and in the two previous calendar years. Further limitations and conditions apply. We will, upon request, provide stockholders with information regarding the Dutch dividend withholding tax that was retained by us.
If a stockholder is resident in a country other than the Netherlands under the provisions of a treaty for the avoidance of double taxation between the Netherlands and such country, such stockholder may, depending on the terms of such treaty, be entitled to an exemption from, reduction in or refund of Dutch dividend withholding tax on dividends distributed by us.
If a stockholder is subject to Dutch corporate income tax and is entitled to the participation exemption in relation to the benefits derived from the shares held by it and such shares are attributable to an enterprise carried out in the Netherlands, such stockholder will generally be entitled to an exemption from Dutch dividend withholding tax on dividends distributed by us.
If a stockholder (i) is resident in another member state of the European Union or an appointed state of the European Economic Area, i.e. Iceland, Norway and Liechtenstein, according to the tax laws of that state and, under the terms of a double taxation agreement concluded by that state with a third state, is not considered to be resident for tax purposes outside the European Union, Iceland, Norway or Liechtenstein; and (ii) owns an interest in us to which the Dutch participation exemption would be applicable if the stockholder were resident in the Netherlands; such stockholder will generally be eligible for an exemption from Dutch dividend withholding tax on dividends distributed by us.
Furthermore, if a stockholder:
| (a) | is an entity which is resident for Dutch tax purposes in a member state of the European Union, Iceland, Norway or Liechtenstein or which is a qualifying stockholders resident elsewhere; |
|---|
Table of Contents
| (b) | is not subject to a tax levied by reference to its profits in its country of residence; and |
|---|
| (c) | would not have been subject to Dutch corporate income tax had the stockholder been resident in the Netherlands for Dutch tax purposes; |
|---|
such stockholder will be eligible for a full refund of Dutch dividend withholding tax on dividends distributed by us, unless such stockholder is comparable to an exempt investment institution (vrijgestelde beleggingsinstelling) or fiscal investment institution (fiscale beleggingsinstelling), as defined respectively in article 6a and 28 of the Dutch corporate income tax act 1969 (Wet op de vennootschapsbelasting 1969). For purposes of (a) above, a qualifying stockholder is an entity that (i) is resident for Dutch tax purposes in a jurisdiction which has an arrangement for the exchange of tax information with the Netherlands and (ii) holds its shares as a portfolio investment, i.e. such shares are not held with a view to the establishment or maintenance of lasting and direct economic links between the stockholder and the company and the shares do not allow the stockholder to participate effectively in the management or control of the company.
A stockholder who is considered to be resident in the United States and is entitled to the benefits of the convention between the United States and the Netherlands for the avoidance of double taxation and the prevention of fiscal evasion with respect to taxes on income, dated December 18, 1992, as amended most recently by the Protocol signed March 8, 2004 (the “Treaty”), will be entitled to a reduction in the Dutch withholding tax by way of an exemption, reduction or refund, as follows:
| • | if the U.S. stockholder is an exempt pension trust, as described in article 35 of the Treaty, or an exempt organization, as described in article 36 of the Treaty, the U.S. stockholder will be exempt from Dutch dividend withholding tax; |
|---|
| • | if the U.S. stockholder is a company which holds directly at least 10 percent of the voting power in the company, the U.S. stockholder will be subject to Dutch withholding tax at a rate not exceeding 5 percent; |
|---|
| • | if the U.S. stockholder is a company which holds directly at least 80 percent of the voting power in the company and certain other conditions are met, the U.S. stockholder will be exempt from Dutch dividend withholding tax; and |
|---|
| • | in all other cases, the U.S. stockholder will be subject to Dutch dividend withholding tax at a rate of 15 percent. |
|---|
According to Dutch domestic anti-dividend stripping rules, no credit against Dutch (corporate) income tax, exemption from, reduction in or refund of, Dutch dividend withholding tax will be granted if the recipient of the dividend paid by us is not considered to be the beneficial owner (uiteindelijk gerechtigde) of such dividends as meant in these rules.
Taxes on Income and Capital Gains
The description of taxation set out in this section of the Report does not apply to any stockholder who is an individual for whom the income or capital gains derived from our shares of common stock are attributable to employment activities, the income from which is taxable in the Netherlands.
A stockholder will not be subject to Dutch taxes on income or capital gains in respect of the ownership and disposal of our shares, other than Dutch dividend withholding tax as described above, except if:
| (i) | the stockholder is, or is deemed to be, resident in the Netherlands for Dutch (corporate) income tax purposes; |
|---|
| (ii) | the stockholder is an individual and the stockholder has opted to be treated as resident in the Netherlands for purposes of Dutch income tax; |
|---|
Table of Contents
| (iii) | the stockholder derives profits from an enterprise, whether as entrepreneur (ondernemer) or pursuant to a co-entitlement to the net worth of such enterprise other than as an entrepreneur or a stockholder, which enterprise is, in whole or in part, carried on through a permanent establishment (vaste inrichting) or a permanent representative (vaste vertegenwoordiger) in the Netherlands, to which the shares are attributable; |
|---|
| (iv) | the stockholder is an individual and derives benefits from miscellaneous activities (resultaat uit overige werkzaamheden) carried out in the Netherlands in respect of the shares, including, without limitation, activities which are beyond the scope of active portfolio investment activities; |
|---|
| (v) | the stockholder is an individual and has a substantial interest (aanmerkelijk belang) or a fictitious substantial interest (fictief aanmerkelijk belang) in the company, which is not attributable to the assets of an enterprise; |
|---|
| (vi) | the stockholder is not an individual and has a substantial interest or a fictitious substantial interest in the company, which (fictitious) substantial interest is not attributable to the assets of an enterprise and (one of) the main purposes of the chosen ownership structure is the evasion of Dutch income tax or dividend withholding tax; |
|---|
| (vii) | the stockholder is not an individual and is entitled to a share in the profits of an enterprise or a co-entitlement to the net-worth of an enterprise, other than by way of the holding of securities, which enterprise is effectively managed in the Netherlands and to which enterprise the shares are attributable; or |
|---|
| (viii) | the stockholder is an individual and is entitled to a share in the profits of an enterprise, other than by way of the holding of securities, which enterprise is effectively managed in the Netherlands and to which enterprise the shares are attributable. |
|---|
Generally, a stockholder has a substantial interest if such stockholder, alone or together with its partner, directly or indirectly (a) owns, or holds certain rights on, shares representing five percent or more of the total issued and outstanding capital of the company, or of the issued and outstanding capital of any class of shares of the company; (b) holds rights, directly or indirectly, to acquire shares, whether or not already issued, representing five percent or more of the total issued and outstanding capital of the company, or of the issued and outstanding capital of any class of shares of the company; or (c) owns, or holds certain rights on, profit participating certificates that relate to five percent or more of the annual profit of the company or to five percent or more of the liquidation proceeds of the company. A stockholder will also have a substantial interest if its partner or one of certain relatives of the stockholder or of its partner has a substantial interest.
Generally, a stockholder has a fictitious substantial interest in the company if, without having an actual substantial interest in the company (i) an enterprise has been contributed to the company in exchange for shares on an elective non-recognition basis; (ii) the shares have been obtained under inheritance law or matrimonial law, on a non-recognition basis, while the disposing stockholder had a substantial interest in the company; (iii) the shares have been acquired pursuant to a share merger, legal merger or legal demerger, on an elective non-recognition basis, while the stockholder prior to this transaction had a substantial interest in an entity that was party thereto; or (iv) the shares held by the stockholder, prior to dilution, qualified as a substantial interest and, by election, no gain was recognized upon disqualification of these shares.
Gift Tax and Inheritance Tax
No Dutch gift or inheritance tax is due in respect of any gift of the shares by, or inheritance of the shares on the death of, a stockholder, except if:
| (i) | at the time of the gift or death of the stockholder, the stockholder is resident, or is deemed to be resident, in the Netherlands; |
|---|
Table of Contents
| (ii) | the stockholder passes away within 180 days after the date of the gift of the shares and is not, or not deemed to be, at the time of the gift, but is, or deemed to be, at the time of its death, resident in the Netherlands; or |
|---|
| (iii) | the gift of the shares is made under a condition precedent and the stockholder is resident, or is deemed to be resident, in the Netherlands at the time the condition is fulfilled. |
|---|
For purposes of Dutch gift or inheritance tax, an individual who is of Dutch nationality will be deemed to be resident in the Netherlands if he has been resident in the Netherlands at any time during the ten years preceding the date of the gift or its death. For purposes of Dutch gift tax, any individual, irrespective of its nationality, will be deemed to be resident in the Netherlands if he has been resident in the Netherlands at any time during the 12 months preceding the date of the gift.
Other Taxes and Duties
No other Dutch Taxes, including turnover tax and taxes of a documentary nature, such as capital tax, stamp or registration tax or duty, are payable by or on behalf of a stockholder by reason only of the purchase, ownership and disposal of the shares.
Residency
A stockholder will not become resident, or deemed resident in the Netherlands for tax purposes by reason only of holding the shares.
United States Federal Income Tax Considerations
The following summary describes the material United States federal income tax consequences of the ownership and disposition of our shares as of the date hereof. The summary set forth below is applicable only to United States Holders (as defined below) (i) who are residents of the United States for purposes of the Treaty, (ii) whose shares do not, for purposes of the Treaty, form part of the business property of a permanent establishment, or pertain to a fixed base, in the Netherlands, and (iii) who otherwise qualify for the full benefits of the Treaty. Except where noted, this summary deals only with shares held as capital assets. As used herein, the term “United States Holder” means a beneficial owner of a share that is for United States federal income tax purposes:
| • | an individual citizen or resident of the United States; |
|---|
| • | a corporation (or other entity treated as a corporation for United States federal income tax purposes) created or organized in or under the laws of the United States, any state thereof or the District of Columbia; |
|---|
| • | an estate the income of which is subject to United States federal income taxation regardless of its source; or |
|---|
| • | a trust if it (1) is subject to the primary supervision of a court within the United States and one or more United States persons have the authority to control all substantial decisions of the trust or (2) has a valid election in effect under applicable United States Treasury regulations to be treated as a United States person. |
|---|
This summary does not represent a detailed description of the United States federal income tax consequences applicable to you if you are subject to special treatment under the United States federal income tax laws, including if you are:
| • | a dealer in securities or currencies; |
|---|
| • | a financial institution; |
|---|
| • | a regulated investment company; |
|---|
Table of Contents
| • | a real estate investment trust; |
|---|
| • | an insurance company; |
|---|
| • | a tax-exempt organization; |
|---|
| • | a person holding our shares as part of a hedging, integrated or conversion transaction, a constructive sale or a straddle; |
|---|
| • | a trader in securities that has elected the mark-to-market method of accounting for your securities; |
|---|
| • | a person liable for alternative minimum tax; |
|---|
| • | a person liable for Medicare contribution tax; |
|---|
| • | a person who owns or is deemed to own 10% or more of our voting stock; |
|---|
| • | a person holding our shares in connection with a trade or business conducted outside of the United States; |
|---|
| • | a partnership or other pass-through entity for United States federal income tax purposes; or |
|---|
| • | a person whose “functional currency” is not the United States dollar. |
|---|
The summary below is based upon the provisions of the United States Internal Revenue Code of 1986, as amended (the “Code”), and regulations, rulings and judicial decisions thereunder as of the date hereof, and such authorities may be replaced, revoked or modified so as to result in United States federal income tax consequences different from those discussed below.
If a partnership holds our shares, the tax treatment of a partner will generally depend upon the status of the partner and the activities of the partnership. If you are a partnership or a partner of a partnership holding our shares, you should consult your tax advisors.
This summary does not contain a detailed description of all the United States federal income tax consequences to you in light of your particular circumstances and does not address the effects of any state, local or non-United States tax laws. If you are considering the purchase, ownership or disposition of our shares, you should consult your own tax advisors concerning the United States federal income tax consequences to you in light of your particular situation as well as any consequences arising under the laws of any other taxing jurisdiction.
Taxation of Dividends
The gross amount of distributions on the shares (including any amounts withheld in respect of Dutch withholding taxes to the extent such amounts are actually transferred to the Dutch tax authorities, as described under “Certain Tax Considerations—Holder of Common Stock—Summary of Dutch Tax Considerations—Withholding Tax” above) will be taxable as dividends to the extent paid out of our current or accumulated earnings and profits, as determined under United States federal income tax principles. Such income (including withheld taxes paid over to the Dutch tax authorities) will be includable in your gross income as ordinary income on the day actually received by you or on the day received by your nominee or agent that holds the shares on your behalf. Such dividends will not be eligible for the dividends received deduction allowed to corporations under the Code.
With respect to non-corporate United States investors, certain dividends received from a qualified foreign corporation may be subject to reduced rates of taxation. A qualified foreign corporation includes a foreign corporation that is eligible for the benefits of a comprehensive income tax treaty with the United States which the United States Treasury Department determines to be satisfactory for these purposes and which includes an exchange of information provision. The United States Treasury Department has determined that the Treaty meets these requirements. We believe we are currently eligible for the benefits of the Treaty. A foreign corporation is also treated as a qualified foreign corporation with respect to dividends paid by that corporation on shares that are readily tradable on an established securities market in the United States. United States Treasury Department
Table of Contents
guidance indicates that our shares, which are listed on the NASDAQ Global Select Market, are considered readily tradable on an established securities market in the United States. There can be no assurance that our shares will be considered readily tradable on an established securities market in later years. Non-corporate holders that do not meet a minimum holding period requirement during which they are not protected from a risk of loss or that elect to treat the dividend income as “investment income” pursuant to Section 163(d)(4) of the Code will not be eligible for the reduced rates of taxation regardless of our status as a qualified foreign corporation. For this purpose, the minimum holding period requirement will not be met if a share has been held by a holder for 60 days or less during the 121-day period beginning on the date which is 60 days before the date on which such share becomes ex-dividend with respect to such dividend, appropriately reduced by any period in which such holder is protected from risk of loss. In addition, the rate reduction will not apply to dividends if the recipient of a dividend is obligated to make related payments with respect to positions in substantially similar or related property. This disallowance applies even if the minimum holding period has been met. You should consult your own tax advisors regarding the application of this legislation to your particular circumstances.
The maximum rate of withholding tax on dividends paid to you pursuant to the Treaty is 15 percent. You may be required to properly demonstrate to the Company and the Dutch tax authorities your entitlement to the reduced rate of withholding under the Treaty. Subject to certain conditions and limitations, Dutch withholding taxes on dividends may be treated as foreign taxes eligible for credit against your United States federal income tax liability. However, amounts withheld to reflect Dutch withholding taxes will not be creditable to the extent that we are allowed to reduce the amount of the withholding tax that is actually transferred to the Dutch tax authorities, as described under “Certain Tax Considerations—Holder of Common Stock—Summary of Dutch Tax Considerations—Withholding Tax” above. For purposes of calculating the foreign tax credit, dividends paid on the shares will be treated as income from sources outside the United States and will generally constitute passive category income. Further, in certain circumstances, if you:
| • | have held shares for less than a specified minimum period during which you are not protected from risk of loss, or |
|---|
| • | are obligated to make payments related to the dividends, |
|---|
you will not be allowed a foreign tax credit for foreign taxes imposed on dividends paid on the shares. The rules governing the foreign tax credit are complex. You are urged to consult your tax advisors regarding the availability of the foreign tax credit under your particular circumstances.
To the extent that the amount of any distribution exceeds our current and accumulated earnings and profits for a taxable year, as determined under United States federal income tax principles, the distribution will first be treated as a tax-free return of capital, causing a reduction in the adjusted basis of the shares, and to the extent the amount of the distribution exceeds your tax basis, the excess will be taxed as capital gain recognized on a sale or exchange. However, we do not expect to determine earnings and profits in accordance with United States federal income tax principles. Therefore, you should expect that a distribution will generally be treated as a dividend (as discussed above).
Passive Foreign Investment Company
Based on the composition of our income and valuation of our assets, including goodwill, we do not believe we were a passive foreign investment company (a “PFIC”) for the 2013 taxable year, and we do not expect to become one in the future, although there can be no assurance in this regard. If, however, we are or become a PFIC, you could be subject to additional United States federal income taxes on gain recognized with respect to the shares and on certain distributions, plus an interest charge on certain taxes treated as having been deferred under the PFIC rules. Non-corporate United States Holders will not be eligible for reduced rates of taxation on any dividends received from us if we are a PFIC in the taxable year in which such dividends are paid or in the preceding taxable year.
Table of Contents
Taxation of Capital Gains
For United States federal income tax purposes, you will recognize taxable gain or loss on any sale or exchange of a share in an amount equal to the difference between the amount realized for the share and your tax basis in the share. Such gain or loss will generally be capital gain or loss. Capital gains of individuals derived with respect to capital assets held for more than one year are eligible for reduced rates of taxation. The deductibility of capital losses is subject to limitations. Any gain or loss recognized by you will generally be treated as United States source gain or loss.
Information Reporting and Backup Withholding
In general, information reporting will apply to dividends in respect of our shares and the proceeds from the sale, exchange or redemption of our shares that are paid to you within the United States (and in certain cases, outside the United States), unless you are an exempt recipient. Backup withholding may apply to such payments if you fail to provide a taxpayer identification number or certification of other exempt status or fail to report in full dividend and interest income.
Any amounts withheld under the backup withholding rules will be allowed as a refund or a credit against your United States federal income tax liability provided the required information is furnished to the Internal Revenue Service.
F. Dividends and Paying Agents
Not applicable.
G. Statement by Experts
Not applicable.
H. Documents on Display
It is possible to read and copy documents referred to in this Report on Form 20-F that have been filed with the SEC at the SEC’s public reference room located at 450 Fifth Street, NW, Washington, D.C. 20549.
Please call the SEC at 1-800-SEC-0330 for further information on the public reference rooms and their copy charges.
The Company’s SEC filings are also publicly available through the SEC’s website at www.sec.gov.
I. Subsidiary Information
Not applicable.
Item 11. Quantitative and Qualitative Disclosures about Market Risk
| --- | --- |
We are exposed to changes in interest rates and foreign currency exchange rates because we finance certain operations through fixed and variable rate debt instruments and denominate our transactions in a variety of foreign currencies. Changes in these rates may have an impact on future cash flow and earnings. We manage these risks through normal operating and financing activities and, when deemed appropriate, through the use of derivative financial instruments. We do not enter into financial instruments for trading or speculative purposes.
By using derivative instruments, we are subject to credit and market risk. The fair market value of the derivative instruments is determined by using valuation models whose inputs are derived using market
Table of Contents
observable inputs, including interest rate yield curves, as well as foreign exchange and commodity spot and forward rates, and reflects the asset or liability position as of the end of each reporting period. When the fair value of a derivative contract is positive, the counterparty owes us, thus creating a receivable risk for us. We are exposed to counterparty credit risk in the event of non-performance by counterparties to our derivative agreements. We minimize counterparty credit (or repayment) risk by entering into transactions with major financial institutions of investment grade credit rating. Our exposure to market risk is not hedged in a manner that completely eliminates the effects of changing market conditions on earnings or cash flow.
Interest Rate Risk
Given the leveraged nature of our Company, we have inherent exposure to changes in interest rates. Our Secured Revolving Credit Facility has a floating rate interest. We have issued several Term Loans that have a floating rate interest and have issued several series of notes with maturities ranging from 3 to 10 years with fixed rates. From time to time, we may execute a variety of interest rate derivative instruments to manage interest rate risk. Consistent with our risk management objective and strategy, we have no interest rate risk hedging transactions in place.
For additional information regarding our interest rate risks see the discussion set for under “Interest rate risk” of Note 6 to the Consolidated Financial Statements included in Part III, Item 18 of this Report.
Foreign Currency Risks
We are also exposed to market risk from changes in foreign currency exchange rates, which could affect operating results as well as our financial position and cash flows. We monitor our exposures to these market risks and generally employ operating and financing activities to offset these exposures where appropriate. If we do not have operating or financing activities to sufficiently offset these exposures, from time to time, we may employ derivative financial instruments such as swaps, collars, forwards, options or other instruments to limit the volatility to earnings and cash flows generated by these exposures. Derivative financial instruments are only used for hedging purposes and not for trading or speculative purposes. The Company measures all derivative financial instruments based on fair values derived from market prices of the instruments or from option pricing models, as appropriate and record these as assets or liabilities in the balance sheet. Changes in the fair values are recognized in the statement of operations immediately unless cash flow hedge accounting is applied.
Our primary foreign currency exposure relates to the U.S. dollar to euro exchange rate. However, our foreign currency exposures also relate, but are not limited, to the Chinese Yuan, the Japanese Yen, the Pound Sterling, the Malaysian Ringit, the Singapore Dollar, the Taiwan Dollar and the Thailand Baht.
For additional information regarding our foreign currency risks see the discussion set for under “Currency risk” of Note 6 to the Consolidated Financial Statements included in Part III, Item 18 of this Report.
| Item | 12. Description of Securities Other than Equity Securities |
|---|
Not applicable.
Table of Contents
PART II
Item 13. Defaults, Dividend Arrearages and Delinquencies
| --- | --- |
None
Item 14. Material Modifications to the Rights of Security Holders and Use of Proceeds
| --- | --- |
None
Item 15. Controls and Procedures
| --- | --- |
Disclosure Controls and Procedures
As of the end of the period covered by this Report, our management, with the participation of our chief executive officer and chief financial officer, conducted an evaluation pursuant to Rule 13a-15(e) and 15d-15(e) of the Securities and Exchange Act of 1934, as amended (the “Exchange Act”) of the effectiveness of the design and operation of our disclosure controls and procedures. Based on this evaluation, our chief executive officer and chief financial officer concluded that as of the end of the period covered by this Report such disclosure controls and procedures were effective to provide reasonable assurance that information required to be disclosed in reports we filed or submitted under the Exchange Act was recorded, processed, summarized and reported within the time periods specified in the rules and forms of the Securities and Exchange Commission, and included controls and procedures designed to ensure that information required to be disclosed in such reports was accumulated and communicated to our management, including our chief executive officer and chief financial officer, as appropriate to allow timely decisions regarding required disclosure.
Management’s Report on Internal Control over Financial Reporting
The Company’s management is responsible for establishing and maintaining adequate internal control over financial reporting as defined in Rules 13a-15(f) and 15(d)-15(f) of the Exchange Act. The Company’s internal control over financial reporting is designed to provide reasonable assurance, not absolute assurance, regarding the reliability of financial reporting and the preparation of financial statements for external purposes in accordance with U.S. generally accounting principles.
Because of its inherent limitations, internal control over financial reporting may not prevent or detect all misstatements. Moreover, projections of any evaluation of effectiveness to future periods are subject to the risk that controls may become inadequate because of changes in conditions, or that the degree of compliance with the policies or procedures may deteriorate.
Our management assessed the effectiveness of the Company’s internal control over financial reporting as of December 31, 2013 based on the criteria established in “Internal Control-Integrated Framework” issued in 1992 by the Committee of Sponsoring Organizations of the Treadway Commission (COSO). Based on that assessment our management concluded that our internal control over financial reporting was effective as at December 31, 2013.
During 2013, there have not been any changes in the Company’s internal controls over financial reporting that have materially affected, or are reasonably likely to materially affect, the Company’s internal controls over financial reporting.
It should be noted that any control system, regardless of how well it is designed and operated, can provide only reasonable, not absolute, assurance that its objectives will be met. Control systems can be circumvented by the individual acts of some persons, by collusion of two or more people, or by management override of the control. In addition, controls may become inadequate because of changes in conditions, or the degree of compliance with the policies or procedures may deteriorate. Because of these and other inherent limitations of control systems, there can be no assurance that any design will succeed in achieving its stated goals under all potential future conditions, regardless of how remote.
Table of Contents
Attestation Report of the Registered Public Accounting Firm
For the year ended December 31, 2013 an attestation report regarding internal control over financial reporting of the Company’s registered public accounting firm is required. The attestation is included in Part III, Item 18. Financial Statements.
Item 16A. Audit Committee Financial Expert
| --- | --- |
Mr. Goldman, chairman of our audit committee, qualifies as an “audit committee financial expert” as such term is defined in Item 407(d)(5) of Regulation S-K and as determined by our board of directors.
Item 16B. Code of Ethics
| --- | --- |
The NXP Code of Conduct outlines our general commitment to be a responsible social partner and the way in which we attempt to interact with our stakeholders, including stockholders, suppliers, customers, employees and the market. The Code of Conduct expresses our commitment to an economically, socially and ethically sustainable way of working. It covers our policy on a diverse array of subjects, including corporate gifts, child labor, International Labor Organization conventions, working hours, sexual harassment, free-market competition, bribery and the integrity of financial reporting.
We have also adopted a Financial Code of Ethics applicable to certain of our senior employees, which constitutes a “code of ethics” as such term is defined by the Securities and Exchange Commission. Both the NXP Code of Conduct and our Financial Code of Ethics are available on our website at www.nxp.com/investor/governance. The information contained on our website or that can be accessed through our website neither constitutes part of this Report on Form 20-F nor is incorporated by reference herein.
Item 16C. Principal Accountant Fees and Services
| --- | --- |
The Company has instituted a comprehensive auditor independence policy that regulates the relation between the Company and its external auditors and is available on our website (www.nxp.com/investor/governance). The policy includes rules for the pre-approval by the audit committee of all services to be provided by the external auditor. The policy also describes the prohibited services that may not be provided. Proposed services may be pre-approved at the beginning of the year by the audit committee (annual pre-approval) or may be pre-approved during the year by the audit committee in respect of a particular engagement (specific pre-approval). The annual pre-approval is based on a detailed, itemized list of services to be provided, designed to ensure that there is no management discretion in determining whether a service has been approved and to ensure the audit committee is informed of each service it is pre-approving. Unless pre-approval with respect to a specific service has been given at the beginning of the year, each proposed service requires specific pre-approval during the year. Any annually pre-approved services where the fee for the engagement is expected to exceed pre-approved cost levels or budgeted amounts will also require specific pre-approval. The term of any annual pre-approval is 12 months from the date of the pre-approval unless the audit committee states otherwise. During 2013, there were no services provided to the Company by the external auditors which were not pre-approved by the audit committee.
The external auditor attends, in principle, all meetings of the audit committee. The findings of the external auditor, the audit approach and the risk analysis are also discussed at these meetings. The external auditor attends the meeting of the board of directors at which the report of the external auditor with respect to the audit of the annual accounts is discussed, and at which the annual accounts are approved. In its audit report on the annual accounts to the board of directors, the external auditor refers to the financial reporting risks and issues that were identified during the audit, internal control matters, and any other matters, as appropriate, requiring communication under the auditing standards generally accepted in the Netherlands and the United States.
Our Consolidated Financial Statements included in this Report have been audited by KPMG Accountants N.V., an independent registered public accounting firm. These financial statements have been approved by the relevant boards.
Table of Contents
The aggregate fees billed for professional services rendered for the fiscal periods 2013 and 2012 were as follows:
Aggregate fees KPMG
| ($ in millions) | 2013 | 2012 | ||||||
| Audit fees | 3.5 | 3.3 | ||||||
| Audit-related fees | — | 0.9 | ||||||
| Tax fees | — | — | ||||||
| Other fees | 0.1 | 0.2 | ||||||
| 3.6 | 4.4 |
Audit fees consist of fees for the examination of both the consolidated and statutory financial statements. Audit fees also include fees that only our independent auditor can reasonably provide such as comfort letters and review of documents filed with the SEC.
Audit-related fees consist of fees in connection with audits of divestments and certain agreed upon procedures.
Tax fees consist of fees for professional services in relation to tax compliance, tax advice and tax planning.
| Item 16D. | Exemptions from the Listing Standards for Audit Committees |
|---|
Not applicable.
| Item 16E. | Purchases of Equity Securities by the Issuer and Affiliated Purchasers |
|---|
The following table provides a summary of shares repurchased by the Company in 2013:
| Period begin | Period end | Period | Total Number of Shares Purchased | Average Price Paid per Share | Total Number of Shares Purchased as Part of Publicly Announced Plans or Programs | Maximum Number of Shares that May Yet Be Purchased Under the Plans or Programs | ||||||||||||||||||
| January 1 | February 3 | January | — | — | — | 2,846,339 | ||||||||||||||||||
| February 4 | March 3 | February | 1,015,857 | 31.53 | 1,015,857 | 1,830,482 | ||||||||||||||||||
| March 4 | March 31 | March | 100,000 | 31.70 | 100,000 | 1,730,482 | ||||||||||||||||||
| April 1 | May 5 | April | 941,039 | 27.21 | 941,039 | 789,443 | ||||||||||||||||||
| May 6 | June 2 | May | 500,000 | 28.52 | 500,000 | 289,443 | ||||||||||||||||||
| June 3 | June 30 | June | 271,000 | 29.22 | 121,225 | 168,218 | ||||||||||||||||||
| July 1 | August 4 | July | — | — | — | 168,218 | ||||||||||||||||||
| August 5 | September 1 | August | 920,216 | 35.34 | 920,216 | 9,248,002 | ||||||||||||||||||
| September 2 | September 29 | September | 3,357,649 | 37.78 | 3,357,649 | 5,890,353 | ||||||||||||||||||
| September 30 | November 3 | October | 2,131,891 | 40.75 | 2,131,891 | 3,758,462 | ||||||||||||||||||
| November 4 | December 1 | November | 1,249,141 | 41.69 | 1,249,141 | 2,509,321 | ||||||||||||||||||
| December 2 | December 31 | December | 584,845 | 40.92 | 524,020 | 1,985,301 | ||||||||||||||||||
| Total 2013 | 11,071,638 | 36.60 | 10,861,038 | |||||||||||||||||||||
Table of Contents
From time to time, last in May 2013, the General Meeting of Shareholders authorized the Board of Directors to repurchase shares of our common stock. On that basis, the Board of Directors resolved to repurchase shares to cover in part employee stock options and equity rights under its long term incentive plans. The purchases identified in the table were all pursuant to this authorization.
| Item 16F. | Change in Registrant’s Certifying Accountant |
|---|
Not applicable.
| Item 16G. | Corporate Governance |
|---|
The Dutch Corporate Governance Code
Since our initial public offering in August 2010, we have been required to comply with the Dutch corporate governance code. The Dutch corporate governance code, as revised, became effective on January 1, 2009, and applies to all Dutch companies listed on a government-recognized stock exchange, whether in the Netherlands or elsewhere. The code is based on a “comply or explain” principle. Accordingly, companies are required to disclose in their Annual Reports filed in the Netherlands whether or not they are complying with the various rules of the Dutch corporate governance code that are addressed to the board of directors or, if any, the supervisory board of the company and, if they do not apply those provisions, to give the reasons for such non-application. The code contains principles and best practice provisions for managing boards, supervisory boards, stockholders and general meetings of stockholders, financial reporting, auditors, disclosure, compliance and enforcement standards.
The Dutch corporate governance code provides that i
Showing the first 8K of 249K characters. Open the full section