 filings.tools
Old Dominion Freight Line (ODFL) 10-K risk factor changes: FY2013 vs FY2012
The 2013-12-31 10-K against the 2012-12-31 one, compared heading by heading and sentence by sentence. One of these filings carries no fiscal year tag, so its year is the calendar year of the period end.
Item 1A23 rewritten9 added5 removed271 unchanged
All filing items540 rewritten210 added282 removed1,245 unchanged
Summary
counted, not written
- Item 1A headings could not be compared: only 0 carried over between the two years, which usually means one filing was read wrongly, so none is reported as new or removed.
- Sentence by sentence, 210 added, 282 removed, 540 rewritten and 1,245 unchanged across 17 items that differ.
Sentences by item
21 items, with every count and a link to each item that changed
Underlined words on a shaded ground are new in FY2013; struck-through words were in FY2012. Sentences that are wholly new or wholly gone are labelled rather than marked.
Item 1A. RISK FACTORS
23 rewritten, 9 added, 5 removed, 271 unchanged
Read the full itemFY2013 item · filed February 28, 2014FY2012 item · filed February 28, 2013
| • | we compete with [removed: many] other transportation service providers of varying sizes, some of which may have more equipment, a broader global network, a wider range of services, greater capital resources or other competitive advantages; |
Further, Congress or one or more states could approve legislation and/or the National Labor Relations Board could render decisions [added: or implement rule changes] that could significantly affect our business and our relationship with our employees, including actions that could substantially liberalize the procedures for union organization.
| • | [removed: growth and geographic expansion are dependent on the availability of real estate, and] shortages of suitable real estate may limit our [added: growth and] geographic expansion and might cause congestion in our service center network, which could result in increased operating expenses; |
| • | liabilities we assume could be greater than our original estimates or [added: may] not [added: be] disclosed to us at the time of acquisition; |
Our customers’ and suppliers’ business may be impacted by a downturn in the economy and/or a disruption of financial [removed: markets.][added: markets, which may decrease demand for our services.]
We also are subject to cost increases outside [added: of] our control that could materially reduce our profitability if we are unable to increase our rates sufficiently.
We have insurance coverage with third-party insurance carriers, but we assume a significant portion of the risk associated with these claims due to our [removed: self-insured retentions] [added: SIRs] and deductibles.
[removed: Recent healthcare] [added: Healthcare] legislation may increase our costs and reduce our future profitability.
The Patient Protection and Affordable Care Act, [added: which was] signed into law in [removed: 2010,] [added: 2010 and has several provisions not yet in effect,] is expected to increase our annual employee healthcare costs going forward.
We cannot predict the [removed: extent] [added: impact] that this legislation, or any future state or federal healthcare legislation or regulation, will have on [removed: us.][added: our operations.]
In addition, rising healthcare costs could force us to make [added: further] changes to our benefits program, which could negatively impact our ability to attract and retain employees.
We have incurred significant increases in the cost of tractors due to regulations [removed: of] [added: issued by] the U.S. Environmental Protection Agency (the “EPA”) [added: and various state agencies] that require progressive reductions in exhaust emissions from diesel engines.
Beginning in 2013, these regulations also [removed: require] [added: required] that all heavy-duty diesel engines built for highway applications over 14,000 pounds include certified onboard diagnostics systems to monitor emissions.
Diesel fuel prices and fuel availability can be impacted by factors beyond our control, such as natural or man-made disasters, [added: adverse weather conditions,] political events, price and supply decisions by oil producing countries and cartels, terrorist activities, armed conflict and world supply and demand imbalances.
We have fuel surcharge programs in place with a majority of our customers, which [removed: have helped us] [added: help] offset the [removed: majority of the] negative impact of the increased cost of diesel fuel and other petroleum-based products.
[added: As a result, we may become subject to additional] legislation or rulemaking that could adversely impact our business.
As a result, the potential costs associated with legal actions against us could [removed: have an adverse effect on] [added: adversely affect] our business, financial condition [removed: and] [added: or] results of operations.
In addition, we are subject to compliance with cargo-security and transportation regulations issued by the [removed: Transportation Security Administration] [added: TSA] within the U.S. Department of Homeland Security.
This deadline was extended and on December 22, 2011, the FMCSA issued its final rule, which [removed: requires] [added: mandated] compliance by July 1, 2013.
The final rule reduces the maximum number of hours a truck driver can work each week to 70 hours from the [removed: current] [added: former] 82-hour limit.
The rule maintains [removed: the current] [added: a] maximum 11-hour daily driving limit, but requires drivers to take a 30-minute break prior to [removed: driving] [added: working] beyond eight hours.
We are, however, subject to future rulemaking by the FMCSA and other regulatory agencies, which could be more stringent, require [added: additional] changes to our operations, increase our operating costs or otherwise adversely impact our results of operations.
[removed: Congdon] [added: Congdon, Jr.] and members of their respective families beneficially own an aggregate of approximately 27% of the outstanding shares of our common stock.
We are subject to various risks arising from our international business operations and relationships, which could adversely affect our business.
We arrange for transportation and logistics services to and from various international locations and are subject to both the risks of conducting international business and the requirements of the Foreign Corrupt Practices Act of 1977 (the "FCPA").
Failure to comply with the FCPA may result in legal claims against us.
In addition, we face other risks associated with international operations and relationships, which may include restrictive trade policies, imposition of duties, taxes or government royalties imposed by foreign governments.
The rule also includes changes to the “34-hour restart” provision.
Implementation of the new rule has required certain changes in
our operating procedures and increased our operating costs by limiting the productivity of our drivers.
As a result, we have hired additional drivers to supplement our labor requirements, which have increased our costs.
While we are unable to fully quantify all of the effects of implementing the new rule, we do not believe these additional costs had a material impact on our operating costs.
As a result, we may become subject to additional
The rule also includes a “34-hour restart” provision that allows drivers to restart the clock on their work week by taking at least 34 consecutive hours off-duty, provided these 34 off-duty hours includes two periods between 1:00 a.m.
and 5:00 a.m.
and occurs only once during a seven-day period.
We do not believe this new rule, when implemented, will have a significant impact on our operating procedures and will not significantly impact our costs.
Item 7. MANAGEMENT’S DISCUSSION AND ANALYSIS OF FINANCIAL CONDITION AND RESULTS OF OPERATIONS
114 rewritten, 80 added, 92 removed, 184 unchanged
Read the full itemFY2013 item · filed February 28, 2014FY2012 item · filed February 28, 2013
We are a leading, less-than-truckload (“LTL”), union-free motor carrier providing regional, inter-regional and national LTL service and other [removed: value-added] [added: logistics] services from a single integrated organization.
In addition to our core LTL services, we offer [removed: our customers] a broad range of value-added services including [added: international freight forwarding,] ground and air expedited transportation, container delivery, truckload brokerage, supply chain consulting, warehousing and consumer household pickup and [removed: delivery services.][added: delivery.]
| • | Revenue Per Hundredweight [removed: –] [added: -] This measurement reflects the application of our pricing policies to the services we provide, which are influenced by competitive market conditions and our growth objectives. Generally, freight is rated by a class system, which is established by the National Motor Freight Traffic Association, Inc. Light, bulky freight typically has a higher class and is priced at higher revenue per hundredweight than dense, heavy freight. Fuel surcharges, accessorial charges, revenue adjustments and revenue for undelivered freight are included in this measurement. Revenue for undelivered freight is deferred for financial statement purposes in accordance with our revenue recognition policy; however, we believe including it in our revenue per hundredweight metrics results in a better indicator of changes in our yields by matching total billed revenue with the corresponding weight of those shipments. |
Revenue per hundredweight is a commonly-used indicator of pricing trends, but this metric can be influenced by many other factors, such as changes in fuel surcharges, weight per shipment, length of haul and the [removed: mix] [added: class, or mix,] of our freight.
| • | Weight Per Shipment – Fluctuations in weight per shipment can indicate changes in the [removed: class, or mix,] [added: mix] of freight we receive from our customers, as well as changes in the number of units included in a shipment. Generally, increases in weight per shipment indicate higher demand for our customers' products and overall increased economic activity. [added: Increases in weight per shipment may also reflect growth of our container delivery services, as the weight for a container shipment is significantly higher than a traditional LTL shipment.] Changes in weight per shipment generally have an inverse effect on our revenue per hundredweight, as an increase in weight per shipment will typically cause a decrease in revenue per hundredweight. |
| • | Average Length of Haul – We consider lengths of haul less than 500 miles to be regional traffic, lengths of haul between 500 miles and 1,000 miles to be inter-regional traffic, and lengths of haul in excess of 1,000 miles to be national traffic. [added: This metric is used to analyze our tonnage and pricing trends for shipments with similar characteristics, and also allows comparison with other transportation providers serving specific markets.] By analyzing this metric, we can determine the success and growth potential of our service products in these markets. Changes in length of haul generally have a direct effect on our revenue per hundredweight, as an increase in length of haul will typically cause an increase in revenue per hundredweight. |
Our primary revenue focus is to increase [removed: our] “density,” [removed: our] [added: which is] shipment and tonnage growth within our existing [removed: infrastructure, which allows us to maximize] [added: infrastructure that is measured by] our [removed: asset utilization and labor productivity.][added: revenue per service center.]
[removed: We measure] [added: Increases in] density [added: allow us to maximize our asset utilization and labor productivity, which we measure] over many different functional areas of our operations including [removed: revenue per service center,] linehaul load factor, pickup and delivery (“P&D”) stops per hour, P&D shipments per hour, platform pounds handled per hour and platform shipments per hour.
In addition to our focus on [removed: density,] [added: density and operating efficiencies,] it is critical for us to obtain an appropriate yield on the shipments we handle.
We believe yield management and improvements in [removed: density] [added: efficiency] are key components in our ability to produce profitable growth.
| | | [removed: 2012] [added: 2013] | | | [removed: 2011] [added: 2012] | | | [removed: 2010] [added: 2011] | |
| Revenue from operations [added: (1)] | | 100.0 | % | | 100.0 | % | | 100.0 | % |
| Salaries, wages and benefits | | [removed: 50.5] [added: 50.1] | | | [removed: 50.8] [added: 50.0] | | | [removed: 54.6] [added: 50.2] | |
| Operating supplies and expenses | | [removed: 17.9] [added: 16.5] | | | [removed: 18.9] [added: 17.7] | | | [removed: 16.5] [added: 18.7] | |
| General supplies and expenses | | [removed: 2.8] [added: 3.0] | | | [removed: 2.6] [added: 2.8] | | | [removed: 2.8] [added: 2.6] | |
| Operating taxes and licenses | | [removed: 3.2] [added: 3.1] | | | [removed: 3.4] [added: 3.2] | | | [removed: 3.8] [added: 3.3] | |
| Insurance and claims | | [removed: 1.4] [added: 1.3] | | | [removed: 1.5] [added: 1.4] | | | [removed: 1.7] [added: 1.5] | |
| Communication and utilities | | 1.0 | | | [removed: 1.0] [added: 0.9] | | | 1.0 | |
| Depreciation and amortization | | [removed: 5.3] [added: 5.4] | | | [removed: 4.8] [added: 5.2] | | | [removed: 5.4] [added: 4.8] | |
| Building and office equipment rents | | [removed: 0.6] [added: 0.5] | | | [removed: 0.7] [added: 0.6] | | | [removed: 1.0] [added: 0.7] | |
| Miscellaneous expenses, net | | [removed: 0.5] [added: 0.1] | | | [removed: 0.5] [added: 0.4] | | | 0.5 | |
| Interest expense, net [removed: (1)] [added: (2)] | | [removed: 0.6] [added: 0.4] | | | [removed: 0.7] [added: 0.6] | | | [removed: 0.8] [added: 0.7] | |
| Other expense, net | | — | | | — | | | [removed: 0.1] [added: —] | |
| Provision for income taxes | | [removed: 4.9] [added: 5.3] | | | [removed: 4.3] [added: 4.9] | | | [removed: 3.3] [added: 4.3] | |
| [removed: (1)] [added: (2)] | For the purpose of this table, interest expense is presented net of interest income. |
As a result, our operating ratio improved to [removed: 86.5%] [added: 86.6%] and net income increased 21.5% to $169.5 million for 2012.
Our revenue growth during 2012 of 12.1% was driven by [removed: increases in] [added: increased] tonnage and pricing.
Revenue per hundredweight increased [removed: 4.3%] [added: 4.4%] to [removed: $15.35] [added: $15.53] in 2012.
This increase reflects our disciplined yield management process as well as an improved pricing [removed: environment.][added: environment in 2012.]
Our revenue per hundredweight, excluding fuel surcharges, increased [removed: 3.9%] [added: 4.0%] in 2012 despite the negative influence of the increase in weight per shipment and decrease in length of haul.
Fuel surcharge revenue increased to [removed: 16.7%] [added: 16.5%] of revenue in 2012 from [removed: 16.4%] [added: 16.2%] in 2011, primarily due to a slight increase in the average price per gallon for diesel fuel.
[removed: The] [added: Our] fuel [removed: surcharge is] [added: surcharges are designed to offset fluctuations in the cost of petroleum-based products and are] one of [added: the] many components included in the overall negotiated price [added: we charge] for our [removed: transportation services with our customers, although it is generally considered to be a measure of the increase in cost of all petroleum products we use.][added: services.]
Although these costs increased during 2012, our salaries and wages as a percent of revenue improved to [removed: 37.8%] [added: 37.4%] from [removed: 38.5%] [added: 38.1%] in 2011 as a result of the increased density and efficiency in our operations.
As a percentage of salaries and wages, employee benefit costs increased [removed: slightly] to 33.7% in 2012 from 31.9% in 2011.
Although we saw increases in these costs, operating supplies and expenses decreased as a percent of revenue to [removed: 17.9%] [added: 17.7%] in 2012 from [removed: 18.9%] [added: 18.7%] in 2011.
Depreciation and amortization expense increased to [removed: 5.3%] [added: 5.2%] of revenue in 2012 as compared to 4.8% in 2011.
Although our capital expenditure plan for 2013 [removed: is projected to be] [added: was] lower than 2012, we expect our continued growth and investments to increase depreciation costs in future periods.
The impact of the retroactive application [removed: will be] [added: was] recorded as a favorable discrete tax benefit during the first quarter of 2013.
Key financial and operating metrics for [removed: 2011] [added: 2013] and [removed: 2010] [added: 2012] are presented below:
| Work days | | 254 | | | | [removed: 253] [added: 254] | | | | [removed: 1] [added: —] | | | | [removed: 0.4] [added: —] | |
| Purchased transportation (1) | | 4.5 | | | 4.4 | | | 4.4 | |
| Total operating expenses | | 85.5 | | | 86.6 | | | 87.7 | |
| Operating income | | 14.5 | | | 13.4 | | | 12.3 | |
| Income before income taxes | | 14.1 | | | 12.8 | | | 11.6 | |
| Net income | | 8.8 | % | | 7.9 | % | | 7.3 | % |
| (1) | Our prior-period results have been adjusted for an immaterial correction related to how we present the costs of purchased transportation for certain truckload brokerage and international freight forwarding services. For more information on these adjustments, see Note 1 to the Financial Statements included in Item 8, "Financial Statements and Supplementary Data" below. |
2013 Compared to 2012
| | | 2013 | | | | 2012 | | | | Change | | | | % Change | |
| Revenue (in thousands) | | $ | 2,337,648 | | | $ | 2,134,579 | | | $ | 203,069 | | | 9.5 | |
| Operating ratio | | 85.5 | | % | | 86.6 | | % | | | | | | | |
| Net income (in thousands) | | $ | 206,113 | | | $ | 169,452 | | | $ | 36,661 | | | 21.6 | |
| Diluted earnings per share | | $ | 2.39 | | | $ | 1.97 | | | $ | 0.42 | | | 21.3 | |
| Total tons (in thousands) | | 7,385 | | | | 6,875 | | | | 510 | | | | 7.4 | |
| Total shipments (in thousands) | | 8,279 | | | | 7,765 | | | | 514 | | | | 6.6 | |
| Revenue per hundredweight | | $ | 15.85 | | | $ | 15.53 | | | $ | 0.32 | | | 2.1 | |
| Revenue per shipment | | $ | 282.78 | | | $ | 274.92 | | | $ | 7.86 | | | 2.9 | |
Our financial results for 2013 reflect the continued execution and success of our long-term strategies.
We increased our revenue 9.5% in 2013 primarily through increased market share, as we continued to win share by providing a value proposition consisting of superior service at a fair and equitable price.
With a focus on yield management and operating efficiencies, we were able to improve our margins, which increased earnings per diluted share 21.3%.
As a result, our operating ratio improved by over 100 basis points for the fourth straight year to 85.5%, which is the best annual operating ratio our Company has ever produced.
Our revenue increased $203.1 million, or 9.5% during 2013, which was a result of increases in both tonnage and price.
As compared to 2012, tonnage increased 7.4% primarily due to a 6.6% increase in shipments and a 0.7% increase in weight per shipment.
Our tonnage growth in 2013 was primarily due to increased market share, as our growth exceeded both the growth rate of the U.S. economy as well as the growth rate for the LTL industry.
Revenue per hundredweight increased 2.1% to $15.85 in 2013, which reflects our disciplined yield management process and a stable pricing environment.
We believe that revenue per hundredweight is a good indicator of pricing trends; however, we manage our yield by focusing on individual customer profitability due to the influence of various factors on revenue per hundredweight, such as changes in fuel surcharges, weight per shipment, length of haul and mix of freight.
The impact of these factors can result in changes to revenue per hundredweight that do not necessarily indicate actual changes in underlying rates.
Fuel surcharge revenue decreased to 16.1% of revenue in 2013 from 16.5% in 2012, primarily due to a slight decrease in the average price per gallon for diesel fuel.
Salaries, wages and benefits increased $104.2 million, or 9.8% in 2013 due to a $72.2 million increase in the costs for salaries and wages and a $32.0 million increase in benefit costs.
Of the total increase in salaries and wages, our direct labor costs for drivers, platform employees and fleet technicians increased $56.8 million, or 10.0% in 2013 as compared to 2012.
We primarily increased our headcount in 2013 due to our increased volume of shipments as well as to ensure sufficient labor capacity for future revenue growth.
We also hired additional drivers in the second half of 2013 to address inefficiencies that resulted from changes to the FMCSA’s hours-of-service regulations.
Although our salaries and wages, excluding benefits, increased during 2013, these costs decreased as a percent of revenue to 37.2% from 37.4% in 2012 as a result of increased efficiencies within our operations.
Our platform pounds handled per hour, P&D stops per hour and P&D shipments per hour improved 1.0%, 0.7% and 0.5%, respectively, over the prior-year period.
Our group health and dental costs increased $14.5 million, or 14.7% in 2013 as compared to 2012, with the majority of the increase occurring in the second half of the year.
We experienced significant increases in both the number of claims and the average severity per claim during 2013.
We believe there will be additional costs associated with the ongoing implementation of the 2010 Patient Protection and Affordable Care Act, and consequently, we believe our group health and dental costs may continue to increase in future periods.
Our employee benefit costs also increased for certain retirement benefit plans directly linked to the improvement in our net income and the share price of our common stock.
Operating supplies and expenses increased $6.7 million in 2013 as compared to 2012.
These costs as a percent of revenue improved to 16.5% of revenue in 2013 from 17.7% in 2012.
This improvement is primarily due to a 100 basis point decrease as a percent of revenue for our cost of diesel fuel, excluding fuel taxes, which is the largest component of operating supplies and expenses, and can vary based on both consumption and average price per gallon.
We also offer worldwide freight forwarding services.
| Purchased transportation | | 3.3 | | | 3.4 | | | 3.4 | |
| Total operating expenses | | 86.5 | | | 87.6 | | | 90.7 | |
| Operating income | | 13.5 | | | 12.4 | | | 9.3 | |
| Income before income taxes | | 12.9 | | | 11.7 | | | 8.4 | |
| Net income | | 8.0 | % | | 7.4 | % | | 5.1 | % |
| Revenue (in thousands) | | $ | 2,110,483 | | | $ | 1,882,541 | | | $ | 227,942 | | | 12.1 | |
| Operating ratio | | 86.5 | | % | | 87.6 | | % | | (1.1 | | )% | | (1.3 | ) |
| Revenue per hundredweight | | $ | 15.35 | | | $ | 14.72 | | | $ | 0.63 | | | 4.3 | |
| Revenue per shipment | | $ | 271.82 | | | $ | 259.50 | | | $ | 12.32 | | | 4.7 | |
In addition to our Company record for annual revenue, we also achieved Company records for our annual operating ratio and earnings per diluted share.
Revenue per hundredweight is a good indicator of pricing trends, but this metric is influenced by many other factors, such as changes in fuel surcharges, weight per shipment, length of haul and mix of freight; therefore, changes in revenue per hundredweight do not necessarily indicate actual changes in underlying rates.
2011 Compared to 2010
| | | 2011 | | | | 2010 | | | | Change | | | | % Change | |
| Revenue (in thousands) | | $ | 1,882,541 | | | $ | 1,480,998 | | | $ | 401,543 | | | 27.1 | |
| Operating ratio | | 87.6 | | % | | 90.7 | | % | | (3.1 | | )% | | (3.4 | ) |
| Net income (in thousands) | | $ | 139,470 | | | $ | 75,651 | | | $ | 63,819 | | | 84.4 | |
| Diluted earnings per share | | $ | 1.63 | | | $ | 0.90 | | | $ | 0.73 | | | 81.1 | |
| Total tons (in thousands) | | 6,397 | | | | 5,656 | | | | 741 | | | | 13.1 | |
| Total shipments (in thousands) | | 7,256 | | | | 6,327 | | | | 929 | | | | 14.7 | |
| Revenue per hundredweight | | $ | 14.72 | | | $ | 13.09 | | | $ | 1.63 | | | 12.5 | |
| Revenue per shipment | | $ | 259.50 | | | $ | 234.09 | | | $ | 25.41 | | | 10.9 | |
We experienced strong growth in both tonnage and revenue per hundredweight, and we improved our productivity, all of which led to significant margin improvement during 2011.
Tonnage growth in 2011 was primarily the result of our ability to
win market share as well as a slight improvement in the overall U.S. economy.
We believe our consistent strategy of providing “best-in-class” on-time and claims-free service at a fair and equitable price resonates with shippers and will continue to help us win market share and fuel our growth.
Our ability to win market share is supported by our belief that shippers are making decisions based more on the overall value of the service they receive rather than focusing simply on prices.
This change in philosophy occurred as many of our competitors implemented significant rate increases in 2011 and 2010.
While we implemented a modest rate increase in 2011, we did not believe we had the headwinds that many of our competitors faced in making pricing decisions in 2012.
As a result, we believe the quality of our service and the consistency of our pricing is a winning strategy that will continue to provide opportunities for us to increase tonnage and market share in 2012.
The increase in revenue during 2011, as well as productivity improvements, enabled us to leverage our fixed cost network and generate significant improvement in our operating results.
Our net income increased in 2011 by $63.8 million, or 84.4%, to $139.5 million and our operating ratio decreased by 310 basis points to 87.6%.
The 27.1% increase in revenue during 2011 was the result of increases in both tonnage and revenue per hundredweight.
Tonnage increased 13.1% due to a 14.7% increase in shipments that was partially offset by a 1.4% decrease in weight per shipment.
While a decrease in weight per shipment has historically been an indicator of weakness in the economy, we believe the decrease we experienced in 2011 was due to a decline in the number of heavier non-traditional LTL shipments, such as full-container load and truckload shipments, as a percent of our total shipments.
Revenue per hundredweight increased 12.5% to $14.72 in 2011.
This change reflects an improved LTL pricing environment that supported our rate increases, as well as an increase in fuel surcharges.
Our fuel surcharges are designed to offset fluctuations in the cost of petroleum-based products and are one of many components included in the overall price for our services.
Our revenue per hundredweight, excluding fuel surcharges, increased 7.1% in 2011 but was positively influenced by the decrease in weight per shipment and an increase in length of haul.
Fuel surcharge revenue increased to 16.4% of revenue from 12.3% in 2010 due to the increased price of diesel fuel during 2011.
An excerpt. Shown here: 40 of 114 rewritten, 40 of 80 added and 40 of 92 removed. The counts are complete. For every sentence, read Item 7. MANAGEMENT’S DISCUSSION AND ANALYSIS OF FINANCIAL CONDITION AND RESULTS OF OPERATIONS in the FY2013 filing and the FY2012 filing.
Item 7A. QUANTITATIVE AND QUALITATIVE DISCLOSURES ABOUT MARKET RISK
6 rewritten, 0 added, 0 removed, 8 unchanged
Read the full itemFY2013 item · filed February 28, 2014FY2012 item · filed February 28, 2013
At December 31, [removed: 2012,] [added: 2013,] the cash value for variable life insurance contracts was [removed: $22.3] [added: $29.4] million of the [removed: $33.1] [added: $31.6] million of aggregate cash values for all life insurance contracts included on our Balance Sheets.
A 10% change in market value in those investments would have a [removed: $2.2] [added: $2.9] million impact on our [removed: operating] [added: pre-tax] income.
We are exposed to market risk for awards granted under [removed: the Old Dominion Freight Line, Inc. Phantom Stock Plan] [added: our employee] and [removed: the Old Dominion Freight Line, Inc. Director Phantom Stock Plan.][added: director phantom stock plans.]
At December 31, [removed: 2012,] [added: 2013,] the total liability for awards granted under [removed: the Old Dominion Freight Line, Inc. Phantom Stock Plan] [added: our employee] and [removed: the Old Dominion Freight Line, Inc. Director Phantom Stock Plan] [added: director phantom stock plans] totaled [removed: $16.2] [added: $23.6] million.
A 10% change in the price of our common stock at December 31, [removed: 2012] [added: 2013] would have had a [removed: $1.6] [added: $2.4] million impact on our operating income in [removed: 2012] [added: 2013] with respect to these plans.
We are also exposed to commodity price risk related to diesel fuel prices and manage our exposure to that risk primarily through the application of fuel [removed: surcharges.][added: surcharges to our customers.]
Item 1. BUSINESS
54 rewritten, 15 added, 18 removed, 110 unchanged
Read the full itemFY2013 item · filed February 28, 2014FY2012 item · filed February 28, 2013
We are a leading, less-than-truckload (“LTL”), union-free motor carrier providing regional, inter-regional and national LTL service and other [removed: value-added] [added: logistics] services from a single integrated organization.
We are the [removed: sixth] [added: fifth] largest LTL motor carrier in the United States, as measured by [removed: 2011] [added: 2012] revenue, according to Transport Topics.
In addition to our core LTL services, we offer [removed: our customers] a broad range of value-added services including [added: international freight forwarding,] ground and air expedited transportation, container delivery, truckload brokerage, supply chain consulting, warehousing and consumer household pickup and [removed: delivery services.][added: delivery.]
Our infrastructure allows us to provide next-day and second-day service within each of our six [removed: regions,] [added: regions covering the continental United States,] as well as inter-regional and national service between these regions.
To support our ongoing expansion, we added [removed: 26] [added: 15] new service centers [removed: in] [added: during] the past five years for a total of [removed: 218] [added: 221] at December 31, [removed: 2012.][added: 2013.]
We believe our growth can be attributed to our focus on meeting our customers’ complete supply chain needs from a single point of contact while providing a [removed: high] [added: superior] level of customer service at a fair and equitable price.
Please refer to the Balance Sheets and Statements of Operations included in Item 8, “Financial Statements and Supplementary Data” [removed: of] [added: in] this report for information regarding our total assets, revenue from operations and net income.
According to the American Trucking Associations, total U.S. freight transportation revenue in [removed: 2011] [added: 2012] was [removed: $746.2] [added: $795.7] billion, of which the trucking industry accounted for [removed: 80.9%.][added: 80.7%.]
The LTL sector had revenue in [removed: 2011] [added: 2012] of [removed: $46.9] [added: $51.5] billion, which represented [removed: 6.3%] [added: 6.5%] of total U.S. freight transportation revenue.
The high fixed costs and capital spending requirements for LTL motor carriers [removed: makes] [added: make] it difficult for new start-up or small operators to effectively compete with established [removed: companies.][added: carriers.]
In addition, successful LTL motor carriers generally employ, and regularly update, a high level of technology-based systems and processes that provide information to customers and [added: help] reduce [added: our] operating costs.
Based on [removed: 2011] [added: 2012] revenue as reported in Transport Topics, the [removed: top] [added: largest] 25 LTL motor carriers accounted for approximately [removed: 64%] [added: 60.6%] of the total LTL market.
We believe consolidation in our industry will continue due to customer demand for [removed: single] transportation providers offering both national and regional LTL [removed: service and complex supply chain] [added: as well as other complementary value-added] services.
We believe we are able to compete effectively in our markets by providing [removed: high-quality] [added: superior-quality] and timely service at [added: a] fair and equitable [removed: prices.][added: price.]
We utilize flexible scheduling and train our [removed: union-free] employees to perform multiple tasks, which we believe allows us to achieve greater productivity and higher levels of customer service than our competitors.
At December 31, [removed: 2012,] [added: 2013,] we [removed: conducted operations] [added: operated] through [removed: 218] [added: 221] service center locations, of which we owned [removed: 150] [added: 158] and leased [removed: 68.][added: 63.]
We operate [added: a total of] ten major breakbulk facilities [added: located] in Rialto, California; Atlanta, Georgia; Chicago, Illinois; Indianapolis, Indiana; Greensboro, North Carolina; Harrisburg, Pennsylvania; Memphis and Morristown, Tennessee; Dallas, Texas; and Salt Lake City, Utah, while using [added: various] other service centers for limited breakbulk activity in order to serve our next-day markets.
Our service centers are strategically located in six regions of the country [removed: to] [added: so that we can] provide the highest quality service and minimize freight rehandling costs.
While we have established primary responsibility for customer service at the local service center level, our customers may access information and initiate transactions through our centralized customer service department located at our corporate office or through several other gateways, such as our website, [added: mobile applications,] electronic data interchange (“EDI”), email and fax notification systems and automated voice response systems.
These centralized systems and our customer service department provide our customers with a single point of contact to access information across all areas of our operations and for each of our service [removed: products.][added: offerings.]
Our [removed: senior] management [added: team] monitors freight movements, transit times, load factors and many other productivity measurements to ensure that we maintain our [removed: highest] [added: high] levels of service and efficiency.
In addition, we lower our cost structure by [removed: maintaining flexible workforce rules and by] primarily using twin 28-foot trailers in our linehaul operations.
Twin trailers and long-combination vehicles permit more freight to be [removed: hauled] [added: transported] behind a tractor than could otherwise be [removed: hauled] [added: transported] by one large trailer.
At December 31, [removed: 2012,] [added: 2013,] we owned [removed: 6,099] [added: 6,296] tractors.
At December 31, [removed: 2012,] [added: 2013,] we owned [removed: 24,181] [added: 25,052] trailers.
The table below reflects, as of December 31, [removed: 2012,] [added: 2013,] the average age of our tractors and trailers:
The table below sets forth our capital expenditures for tractors and trailers for the years ended December 31, [removed: 2012, 2011] [added: 2013, 2012] and [removed: 2010.][added: 2011.]
For more information concerning our capital expenditures, see Item 7, “Management’s Discussion and Analysis of Financial Condition and Results of Operations – Liquidity and Capital Resources” [removed: of] [added: in] this report.
| (In thousands) | | [removed: 2012] [added: 2013] | | | | [removed: 2011] [added: 2012] | | | | [removed: 2010] [added: 2011] | | |
| Tractors | | $ | [removed: 113,257] [added: 59,317] | | | $ | [removed: 69,837] [added: 113,257] | | | $ | [removed: 35,777] [added: 69,837] | |
| Trailers | | [removed: 83,405] [added: 70,042] | | | | [removed: 62,326] [added: 83,405] | | | | [removed: 5,020] [added: 62,326] | | |
| Total | | $ | [removed: 196,662] [added: 129,359] | | | $ | [removed: 132,163] [added: 196,662] | | | $ | [removed: 40,797] [added: 132,163] | |
[removed: In addition, 22 other service center locations] [added: These maintenance centers] are equipped to perform routine and preventive maintenance and repairs on our equipment.
In [removed: 2012,] [added: 2013,] our largest customer accounted for approximately 2.6% of our revenue and our largest 5, 10 and 20 customers accounted for approximately [removed: 8.9%, 14.0%] [added: 9.4%, 14.3%] and [removed: 21.1%] [added: 21.2%] of our revenue, respectively.
Many of our customers engage our services through the terms and provisions of our [removed: tariffs.][added: tariffs and through negotiated service contracts.]
At December 31, [removed: 2012, we maintained an] [added: 2013, the amounts for our] SIR [removed: of] [added: and/or deductibles were as follows:] $2.75 million per occurrence for bodily injury and property damage (“BIPD”) claims, [removed: a deductible of] $100,000 per claim for cargo loss and damage, [removed: a deductible of] $1.0 million per occurrence for workers’ compensation claims and [removed: an SIR of] $400,000 per occurrence (with a [removed: $200,000] [added: $400,000] aggregate over our retention level) for group health claims.
We periodically review our risks and insurance coverage applicable to those risks and we believe that [removed: our current] [added: we maintain sufficient] insurance [removed: coverage is sufficient.][added: coverage.]
Although we currently maintain fuel storage and pumping facilities at [removed: 50,] [added: 58,] or [removed: 23%,] [added: 26%,] of our service center locations, we may be susceptible to fuel shortages at certain locations that could cause us to incur additional expense to help ensure adequate supply on a timely basis to prevent a disruption to our service schedules.
Diesel fuel costs, including fuel taxes, totaled [removed: 14.4%, 15.0%] [added: 13.2%, 14.3%] and [removed: 13.1%] [added: 14.9%] of revenue in [removed: 2012, 2011] [added: 2013, 2012] and [removed: 2010,] [added: 2011,] respectively.
As of December 31, [removed: 2012,] [added: 2013,] we employed [removed: 13,016] [added: 14,073] individuals on a full-time basis, none of which were represented under a collective bargaining agreement.
We have increased our revenue and customer base over the past five years primarily through organic growth.
| Tractors | | 6,296 | | | 4.8 | |
| Linehaul trailers | | 18,077 | | | 5.7 | |
| P&D trailers | | 6,975 | | | 12.9 | |
At December 31, 2013, we operated 38 maintenance centers at certain service center locations throughout our network.
| Drivers | | 7,480 | |
| Platform | | 2,260 | |
| Sales | | 518 | |
| Total | | 14,073 | |
Since 1988, we have provided the opportunity for qualified employees to become drivers through the “Old Dominion Driver Training Program.” There are currently 1,975 active drivers who have successfully completed this training, which was approximately 26% of our driver workforce as of December 31, 2013.
consolidations and acquisitions and periodic financial reporting.
The rule also includes changes to the “34-hour restart” provision.
Implementation of the new rule has required certain changes in our operating procedures and has increased our operating costs by limiting the productivity of our drivers.
As a result, we have hired additional drivers to supplement our labor requirements, which have increased our costs.
While we are unable to fully quantify all of the effects of implementing the new rule, we do not believe these additional costs had a material impact on our operating costs.
We also offer worldwide freight forwarding services.
We have increased our revenue and customer base through both organic growth and strategic acquisitions and provide our domestic LTL services throughout the entire continental United States.
Our service is supported by ongoing investment in our employees, service center network and technology.
Smaller regional carriers with lesser financial resources are generally unable to meet this demand.
| Tractors | | 6,099 | | | 4.2 | |
| Linehaul trailers | | 17,280 | | | 6.1 | |
| P&D trailers | | 6,901 | | | 13.2 | |
At December 31, 2012, we had major maintenance operations at our service centers in Rialto, California; Denver, Colorado; Atlanta, Georgia; Indianapolis, Indiana; Kansas City and Parsons, Kansas; Greensboro, North Carolina; Columbus, Ohio; Harrisburg, Pennsylvania; Morristown and Memphis, Tennessee; Dallas, Texas; and Salt Lake City, Utah.
| Drivers | | 6,940 | |
| Platform | | 2,050 | |
| Sales | | 513 | |
| Total | | 13,016 | |
To help fulfill driver needs, we offer qualified employees the opportunity to become drivers through the “Old Dominion Driver Training Program.” Since its inception in 1988 through December 31, 2012, 3,297 individuals have graduated from this program.
In addition, we are subject to compliance with cargo-security
The rule also includes a “34-hour restart” provision that allows drivers to restart the clock on their work week by taking at least 34 consecutive hours off-duty, provided these 34 off-duty hours includes two periods between 1:00 a.m.
and 5:00 a.m.
and occurs only once during a seven-day period.
We do not believe this new rule, when implemented, will have a significant impact on our operating procedures and will not significantly impact our costs.
An excerpt. Shown here: 40 of 54 rewritten, all 15 added and all 18 removed. The counts are complete. For every sentence, read Item 1. BUSINESS in the FY2013 filing and the FY2012 filing.
Item 3. LEGAL PROCEEDINGS
1 rewritten, 0 added, 1 removed, 1 unchanged
Read the full itemFY2013 item · filed February 28, 2014FY2012 item · filed February 28, 2013
We are involved in various legal proceedings and claims that have arisen in the ordinary course of our business that have not been fully [removed: adjudicated.][added: adjudicated, some of which are covered in part by insurance.]
Many of these are covered in whole or in part by insurance.
Cover and table of contents
30 rewritten, 4 added, 4 removed, 88 unchanged
Read the full itemFY2013 item · filed February 28, 2014FY2012 item · filed February 28, 2013
10-K 1 [removed: a10-k.htm] [added: a201310-k.htm] FORM 10-K
For the fiscal year ended December 31, [removed: 2012][added: 2013]
[removed: ][added: ]
Yes [removed: x] [added: ý] No ¨
The aggregate market value of voting stock held by non-affiliates of the registrant as of June [removed: 29, 2012] [added: 28, 2013] was [removed: $1,819,732,509,] [added: $2,626,693,513,] based on the closing sales price as reported on the NASDAQ Global Select Market.
As of February 27, [removed: 2013,] [added: 2014,] the registrant had 86,164,917 outstanding shares of Common Stock ($0.10 par value).
Certain portions of the Company’s Proxy Statement for the [removed: 2013] [added: 2014] Annual Meeting of Shareholders are incorporated by reference into Part III of this report.
| [Forward-Looking [removed: Information](#sAAF64B4C833FC6FDE3133027D1F3401C)] [added: Information](#s0DB745C167187BB4A15037691EED15F1)] | | [removed: [4](#sAAF64B4C833FC6FDE3133027D1F3401C)] [added: [4](#s0DB745C167187BB4A15037691EED15F1)] |
| Item 1 | [removed: [Business](#sA8E4EC0D4B93E5FA0C0B3027D250CC8B)] [added: [Business](#s1CDA46E7A11CC3A09C8C37691D85C173)] | [removed: [4](#sA8E4EC0D4B93E5FA0C0B3027D250CC8B)] [added: [4](#s1CDA46E7A11CC3A09C8C37691D85C173)] |
| Item 1A | [Risk [removed: Factors](#sC0465885C392144B057C3027D270B28B)] [added: Factors](#s1C0CBC189646DECB280B37691F798905)] | [removed: [9](#sC0465885C392144B057C3027D270B28B)] [added: [9](#s1C0CBC189646DECB280B37691F798905)] |
| Item 1B | [Unresolved Staff [removed: Comments](#sD3DC24C5789DE68C946F3027D29FDEE7)] [added: Comments](#s5926501B1443F12FFD7437691F994E21)] | [removed: [17](#sD3DC24C5789DE68C946F3027D29FDEE7)] [added: [17](#s5926501B1443F12FFD7437691F994E21)] |
| Item 2 | [removed: [Properties](#sA49200736E741D1E143E3027D2BE355C)] [added: [Properties](#s6DE25C3B04C96F5D556C37691FC75D58)] | [removed: [17](#sA49200736E741D1E143E3027D2BE355C)] [added: [17](#s6DE25C3B04C96F5D556C37691FC75D58)] |
| Item 3 | [Legal [removed: Proceedings](#sB18D0DD395C3EF2BC3AE3027D2EDC9FA)] [added: Proceedings](#sE3A5EABB951EA2BF47BD37691FE70A75)] | [removed: [17](#sB18D0DD395C3EF2BC3AE3027D2EDC9FA)] [added: [18](#sE3A5EABB951EA2BF47BD37691FE70A75)] |
| Item 4 | [Mine Safety [removed: Disclosures](#s7B8FCB81687A597BE29D3027D30C9F1F)] [added: Disclosures](#s0F298003787222A73ABF3769201613C8)] | [removed: [17](#s7B8FCB81687A597BE29D3027D30C9F1F)] [added: [18](#s0F298003787222A73ABF3769201613C8)] |
| Item 5 | [Market for Registrant’s Common Equity, Related Stockholder Matters and Issuer Purchases of Equity [removed: Securities](#s4541E6ED68CF2064F6F53027D36A5F92)] [added: Securities](#s24091A14D05A950F709237691D852FBA)] | [removed: [18](#s4541E6ED68CF2064F6F53027D36A5F92)] [added: [18](#s24091A14D05A950F709237691D852FBA)] |
| Item 6 | [Selected Financial [removed: Data](#sB2D6B3DDE3A4793F2EB83027D399A243)] [added: Data](#s37F19100C02BF0C7835337691DE3F42C)] | [removed: [20](#sB2D6B3DDE3A4793F2EB83027D399A243)] [added: [20](#s37F19100C02BF0C7835337691DE3F42C)] |
| Item 7 | [Management’s Discussion and Analysis of Financial Condition and Results of [removed: Operations](#s3F1D8848F737D32BCFD83027D3B80AB9)] [added: Operations](#s10485ED6E02BC11D051E37691D76E3CD)] | [removed: [21](#s3F1D8848F737D32BCFD83027D3B80AB9)] [added: [21](#s10485ED6E02BC11D051E37691D76E3CD)] |
| Item 7A | [Quantitative and Qualitative Disclosures about Market [removed: Risk](#sFC551AFA4E0E3FD99FF13027D3E7CB04)] [added: Risk](#sA4C31474FE65A27721153769210017D9)] | [removed: [32](#sFC551AFA4E0E3FD99FF13027D3E7CB04)] [added: [31](#sA4C31474FE65A27721153769210017D9)] |
| Item 8 | [Financial Statements and Supplementary [removed: Data](#sA9081346E5A4DC6C3ACD3027D40650A4)] [added: Data](#sAD7268AD1027C56F0A9037692110A8A0)] | [removed: [33](#sA9081346E5A4DC6C3ACD3027D40650A4)] [added: [33](#sAD7268AD1027C56F0A9037692110A8A0)] |
| Item 9 | [Changes in and Disagreements With Accountants on Accounting and Financial [removed: Disclosure](#s57CE3F8E3A945FA706DE3027D5FA05A1)] [added: Disclosure](#sB9FB98B4A33B74093A6C376924C9BFA4)] | [removed: [49](#s57CE3F8E3A945FA706DE3027D5FA05A1)] [added: [50](#sB9FB98B4A33B74093A6C376924C9BFA4)] |
| Item 9A | [Controls and [removed: Procedures](#s87CCD0E2F85AA4C757123027D63878C4)] [added: Procedures](#sDF7C45D7AE10458D5FD4376924F703B5)] | [removed: [49](#s87CCD0E2F85AA4C757123027D63878C4)] [added: [50](#sDF7C45D7AE10458D5FD4376924F703B5)] |
| Item 9B | [Other [removed: Information](#sDB0027DA2AE9F63232C33027D6585131)] [added: Information](#s02DB6EE06305FADC8C7D37692517B480)] | [removed: [51](#sDB0027DA2AE9F63232C33027D6585131)] [added: [52](#s02DB6EE06305FADC8C7D37692517B480)] |
| [Part [removed: III](#sC38282406EF7A25F4C133027D6862465)] [added: III](#sAFCB11CE30A241B5F498376925551D0B)] | | [removed: [51](#sC38282406EF7A25F4C133027D6862465)] [added: [52](#sAFCB11CE30A241B5F498376925551D0B)] |
| Item 10 | [Directors, Executive Officers and Corporate [removed: Governance](#sEE22322A94B908384C003027D6A6E9B1)] [added: Governance](#s8656B55F2DC721ED606E376925740CB2)] | [removed: [51](#sEE22322A94B908384C003027D6A6E9B1)] [added: [52](#s8656B55F2DC721ED606E376925740CB2)] |
| Item 11 | [Executive [removed: Compensation](#s3B4C185799D4AAF880023027D6D5DE19)] [added: Compensation](#sD454C10F8E18E40349D9376925A3EF3C)] | [removed: [51](#s3B4C185799D4AAF880023027D6D5DE19)] [added: [52](#sD454C10F8E18E40349D9376925A3EF3C)] |
| Item 12 | [Security Ownership of Certain Beneficial Owners and Management and Related Stockholder [removed: Matters](#sDF74BA640F9F9291C37F3027D6F4DF6D)] [added: Matters](#s271E8AC8325A5BC6E2DC376925C3D6A3)] | [removed: [51](#sDF74BA640F9F9291C37F3027D6F4DF6D)] [added: [52](#s271E8AC8325A5BC6E2DC376925C3D6A3)] |
| Item 13 | [Certain Relationships and Related Transactions, and Director [removed: Independence](#s71B15D153CB0A2BFF7363027D732AB2C)] [added: Independence](#s749979A941867F2D3ADF376925F1A4EA)] | [removed: [51](#s71B15D153CB0A2BFF7363027D732AB2C)] [added: [52](#s749979A941867F2D3ADF376925F1A4EA)] |
| Item 14 | [Principal Accounting Fees and [removed: Services](#s3ABFEF589B5F072A13B63027D7520780)] [added: Services](#s25DB7EA074BEE69F768A37692611738D)] | [removed: [51](#s3ABFEF589B5F072A13B63027D7520780)] [added: [52](#s25DB7EA074BEE69F768A37692611738D)] |
| Item 15 | [Exhibits, Financial Statement [removed: Schedules](#s020646E85E58DCA2892E3027D7A05481)] [added: Schedules](#s05EFF06FAD07ECBC06A137691A2AC494)] | [removed: [52](#s020646E85E58DCA2892E3027D7A05481)] [added: [53](#s05EFF06FAD07ECBC06A137691A2AC494)] |
| [Exhibit [removed: Index](#s09975619F62C979FB0FF3027D7EE1B6A)] [added: Index](#s3D78E3F311882DD44C35376926BDF4B7)] | | [removed: [54](#s09975619F62C979FB0FF3027D7EE1B6A)] [added: [55](#s3D78E3F311882DD44C35376926BDF4B7)] |
| [Part I](#sB56B33A3789CC1C43D5637691F1C447E) | | [4](#sB56B33A3789CC1C43D5637691F1C447E) |
| [Part II](#sF3EB478602D715234F22376920353369) | | [18](#sF3EB478602D715234F22376920353369) |
| [Part IV](#s07C3E6DA15334FCEEF5E3769264FDBB6) | | [53](#s07C3E6DA15334FCEEF5E3769264FDBB6) |
| [Signatures](#s53C418D8783201A314DE3769269D686B) | | [54](#s53C418D8783201A314DE3769269D686B) |
| [Part I](#sE6369CC3BD221D4646ED3027D21252C6) | | [4](#sE6369CC3BD221D4646ED3027D21252C6) |
| [Part II](#sF2B9986166663BE1D4533027D34A5AFF) | | [18](#sF2B9986166663BE1D4533027D34A5AFF) |
| [Part IV](#s257D1F322B38D30733C93027D78048EE) | | [52](#s257D1F322B38D30733C93027D78048EE) |
| [Signatures](#s05F3EF77E818FD6F7E983027D7CFD26E) | | [53](#s05F3EF77E818FD6F7E983027D7CFD26E) |
Item 2. PROPERTIES
8 rewritten, 1 added, 1 removed, 17 unchanged
Read the full itemFY2013 item · filed February 28, 2014FY2012 item · filed February 28, 2013
We own our [removed: general] [added: principal executive] office located in Thomasville, North Carolina, consisting of a two-story office building of approximately 160,000 square feet on 30.1 acres of land.
At December 31, [removed: 2012,] [added: 2013,] we operated [removed: 218] [added: 221] service centers, of which [removed: 150] [added: 158] were owned and [removed: 68] [added: 63] were leased.
Our service centers that are owned include most of our larger facilities and account for [removed: 81.9%] [added: 83.5%] of the total door capacity in our network.
Each of our major breakbulk facilities is listed below with the number of doors as of December 31, [removed: 2012.][added: 2013.]
| Harrisburg, Pennsylvania | | [removed: 305] [added: 300] |
Our [removed: 218] [added: 221] facilities are strategically dispersed over the states in which we operate.
At December 31, [removed: 2012,] [added: 2013,] the terms of our leased properties ranged from month-to-month to a lease that expires in 2023.
[removed: Seven] [added: Eleven] of these properties are leased [added: to third parties] with lease terms that range from month-to-month to a lease that expires in 2017.
We also own 18 non-operating service center properties.
We also own 17 non-operating properties, all of which are held for lease or are planned for future use.
Item 5. MARKET FOR REGISTRANT’S COMMON EQUITY, RELATED STOCKHOLDER MATTERS AND ISSUER PURCHASES OF EQUITY SECURITIES
6 rewritten, 5 added, 5 removed, 25 unchanged
Read the full itemFY2013 item · filed February 28, 2014FY2012 item · filed February 28, 2013
At February [removed: 15, 2013,] [added: 19, 2014,] there were [removed: approximately 22,409] [added: 32,642] holders of our common stock, including [removed: 177] [added: 159] shareholders of record.
We did not pay any dividends on our common stock during fiscal year [removed: 2012] [added: 2013] or [removed: 2011,] [added: 2012,] and we have no current plans to declare or pay any dividends on our common stock during fiscal year [removed: 2013.][added: 2014.]
The following graph compares the total shareholder cumulative returns, assuming the reinvestment of all dividends, of $100 invested on December 31, [removed: 2007,] [added: 2008,] in (i) our common stock, (ii) the NASDAQ Trucking & Transportation Stocks and (iii) The NASDAQ Stock Market (US) for the five-year period ended December 31, [removed: 2012:][added: 2013:]
[removed: 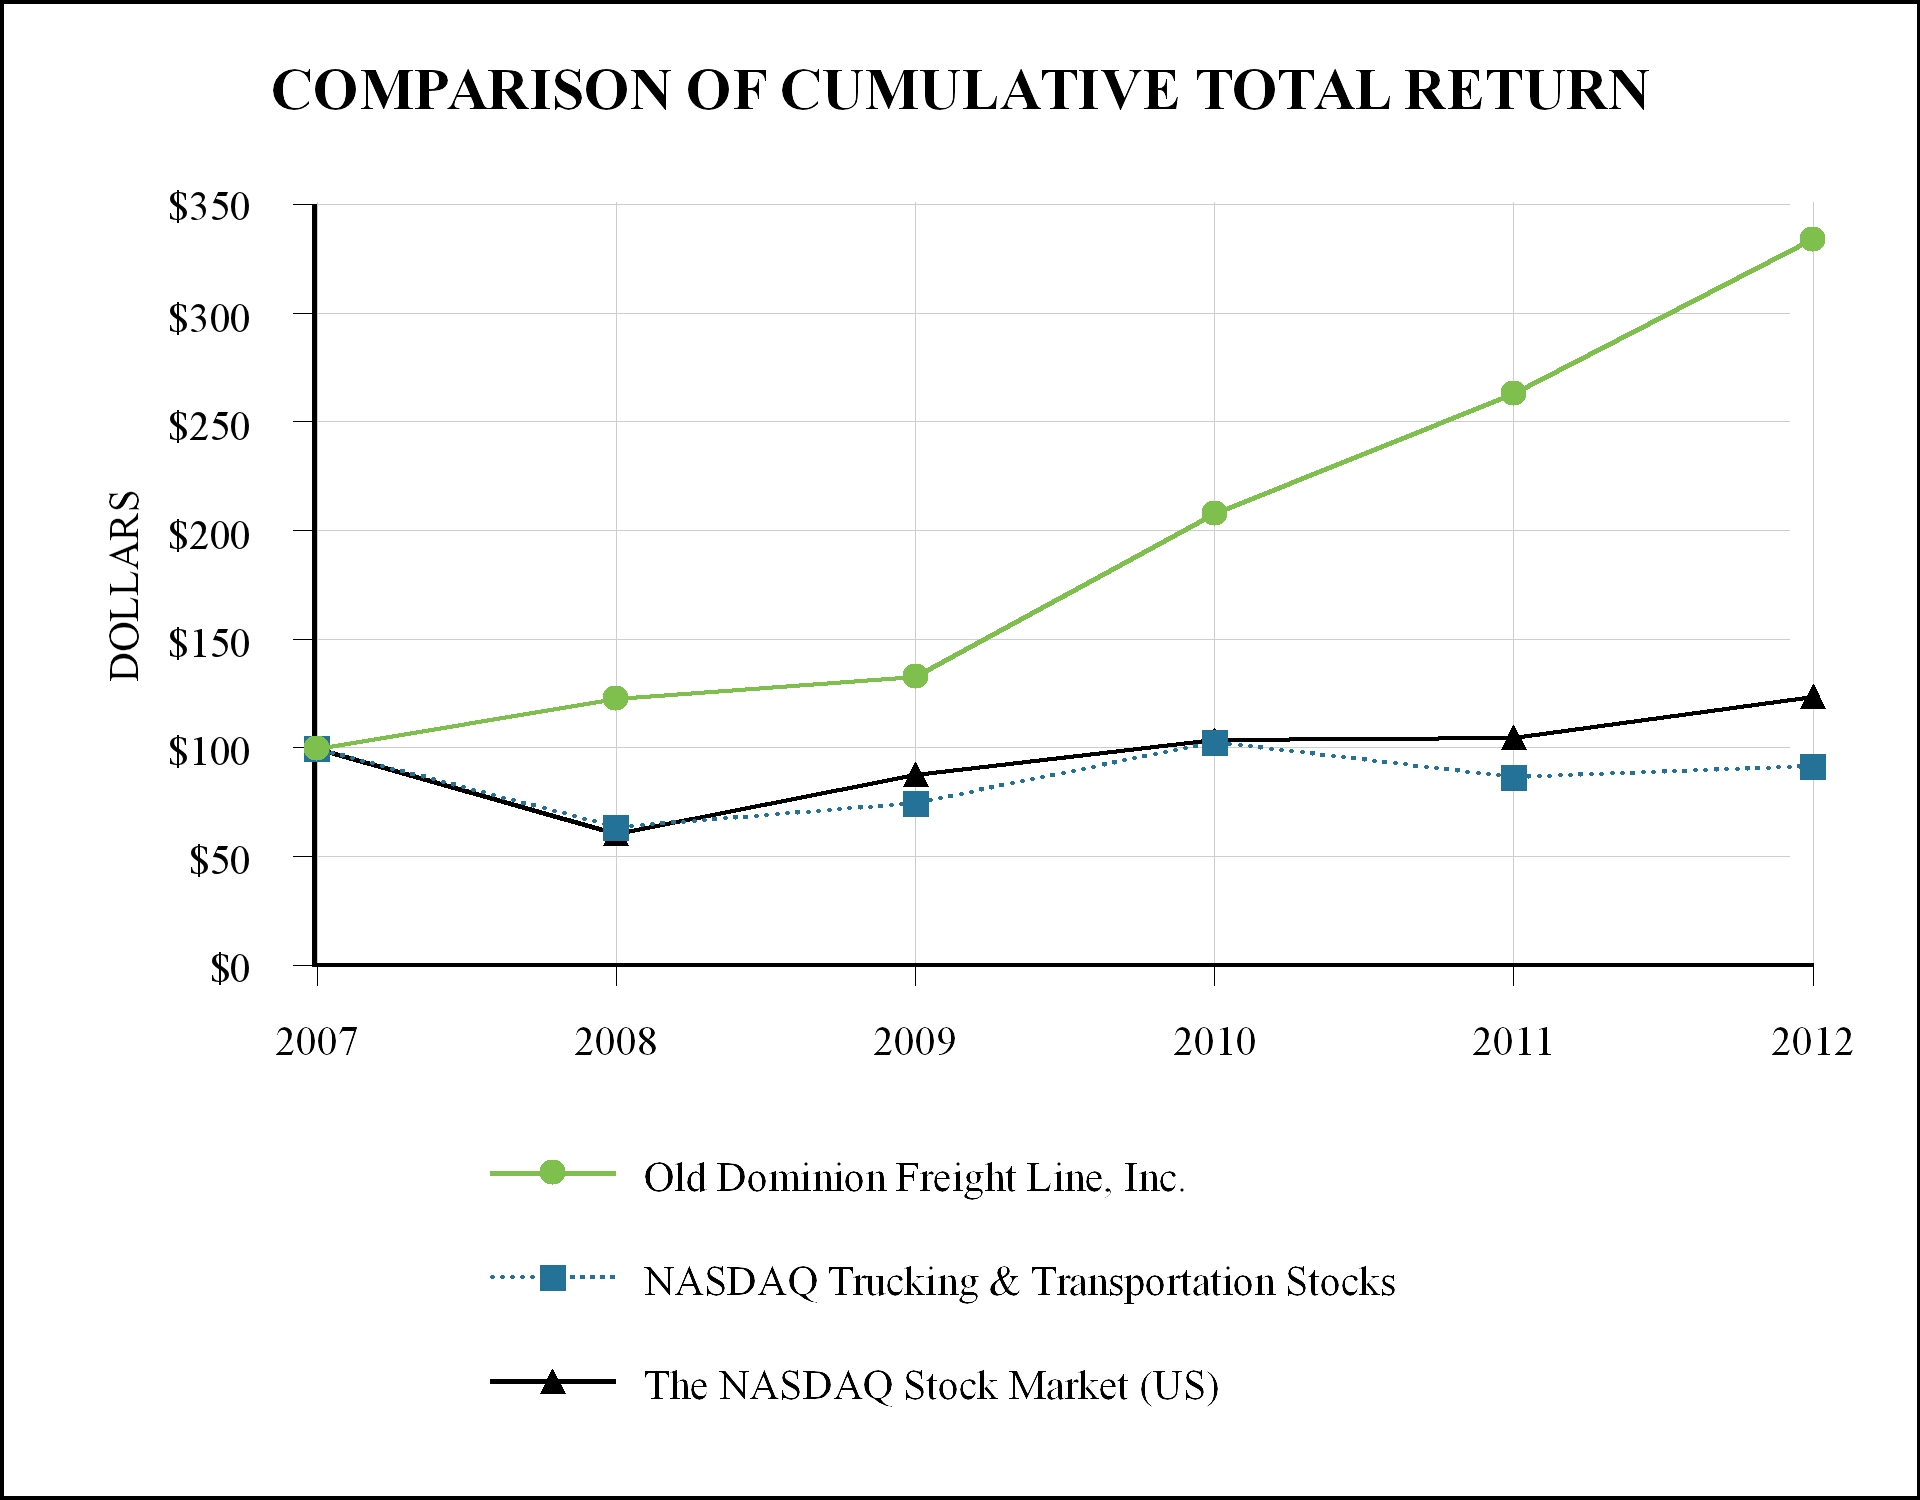][added: 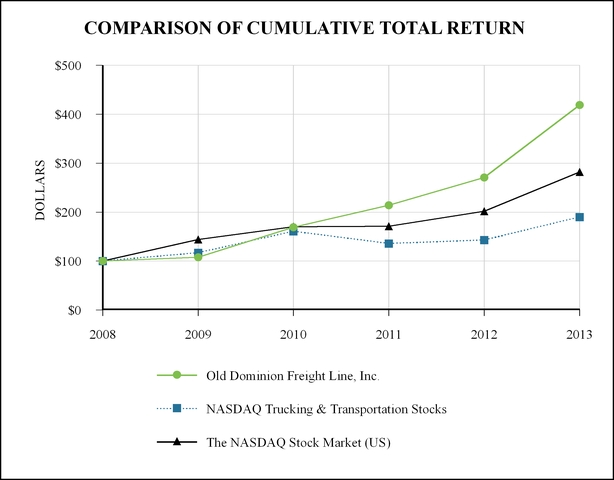]
| NASDAQ Trucking & Transportation Stocks......... | | $ | 100 | | | $ | [removed: 64] [added: 117] | | | $ | [removed: 75] [added: 161] | | | $ | [removed: 103] [added: 136] | | | $ | [removed: 87] [added: 143] | | | $ | [removed: 92] [added: 190] | |
| The NASDAQ Stock Market (US).......................... | | $ | 100 | | | $ | [removed: 61] [added: 144] | | | $ | [removed: 88] [added: 170] | | | $ | [removed: 104] [added: 171] | | | $ | [removed: 105] [added: 202] | | | $ | [removed: 124] [added: 282] | |
| | | 2013 | | | | | | | | | | | | | | |
| High | | $ | 38.76 | | | $ | 44.00 | | | $ | 47.66 | | | $ | 53.34 | |
| Low | | $ | 34.58 | | | $ | 35.17 | | | $ | 41.93 | | | $ | 45.15 | |
| | | 12/31/08 | | | | 12/31/09 | | | | 12/31/10 | | | | 12/31/11 | | | | 12/31/12 | | | | 12/31/13 | | |
| Old Dominion Freight Line, Inc.............................. | | $ | 100 | | | $ | 108 | | | $ | 169 | | | $ | 214 | | | $ | 271 | | | $ | 419 | |
| | | 2011 | | | | | | | | | | | | | | |
| High | | $ | 23.54 | | | $ | 25.65 | | | $ | 26.75 | | | $ | 27.73 | |
| Low | | $ | 18.91 | | | $ | 22.41 | | | $ | 18.50 | | | $ | 18.27 | |
| | | 12/31/07 | | | | 12/31/08 | | | | 12/31/09 | | | | 12/31/10 | | | | 12/31/11 | | | | 12/31/12 | | |
| Old Dominion Freight Line, Inc.............................. | | $ | 100 | | | $ | 123 | | | $ | 133 | | | $ | 208 | | | $ | 263 | | | $ | 334 | |
Item 6. SELECTED FINANCIAL DATA
19 rewritten, 9 added, 6 removed, 15 unchanged
Read the full itemFY2013 item · filed February 28, 2014FY2012 item · filed February 28, 2013
| and operating statistics) | | [removed: 2012] [added: 2013] | | | | [removed: 2011] [added: 2012] | | | | [removed: 2010] [added: 2011] | | | | [removed: 2009] [added: 2010] | | | | [removed: 2008] [added: 2009] | | |
| Depreciation and amortization expense [removed: (1)] [added: (2)] | | [removed: 110,743] [added: 127,072] | | | | [removed: 90,820] [added: 110,743] | | | | [removed: 80,362] [added: 90,820] | | | | [removed: 94,784] [added: 80,362] | | | | [removed: 87,083] [added: 94,784] | | |
| Operating income | | [removed: 285,254] [added: 338,438] | | | | [removed: 234,072] [added: 285,254] | | | | [removed: 137,739] [added: 234,072] | | | | [removed: 70,391] [added: 137,739] | | | | [removed: 129,070] [added: 70,391] | | |
| Interest expense, net [removed: (2)] [added: (3)] | | [removed: 11,428] [added: 9,473] | | | | [removed: 13,887] [added: 11,428] | | | | [removed: 12,465] [added: 13,887] | | | | [removed: 12,998] [added: 12,465] | | | | [removed: 13,012] [added: 12,998] | | |
| Provision for income taxes | | [removed: 103,646] [added: 122,573] | | | | [removed: 80,614] [added: 103,646] | | | | [removed: 48,775] [added: 80,614] | | | | [removed: 22,294] [added: 48,775] | | | | [removed: 43,989] [added: 22,294] | | |
| Net income | | [removed: 169,452] [added: 206,113] | | | | [removed: 139,470] [added: 169,452] | | | | [removed: 75,651] [added: 139,470] | | | | [removed: 34,871] [added: 75,651] | | | | [removed: 68,677] [added: 34,871] | | |
| Diluted earnings per share [removed: (3)] [added: (4)] | | [removed: 1.97] [added: 2.39] | | | | [removed: 1.63] [added: 1.97] | | | | [removed: 0.90] [added: 1.63] | | | | [removed: 0.42] [added: 0.90] | | | | [removed: 0.82] [added: 0.42] | | |
| Cash, cash equivalents [removed: and short-term investments] | | [removed: 12,857] [added: 30,174] | | | | [removed: 75,850] [added: 12,857] | | | | [removed: 5,450] [added: 75,850] | | | | [removed: 4,171] [added: 5,450] | | | | [removed: 28,965] [added: 4,171] | | |
| Current assets | | [removed: 275,028] [added: 332,979] | | | | [removed: 331,852] [added: 275,028] | | | | [removed: 222,582] [added: 331,852] | | | | [removed: 174,175] [added: 222,582] | | | | [removed: 209,230] [added: 174,175] | | |
| Total assets | | [removed: 1,712,514] [added: 1,932,089] | | | | [removed: 1,513,074] [added: 1,712,514] | | | | [removed: 1,239,881] [added: 1,513,074] | | | | [removed: 1,159,278] [added: 1,239,881] | | | | [removed: 1,074,905] [added: 1,159,278] | | |
| Current liabilities | | [removed: 225,139] [added: 232,122] | | | | [removed: 204,810] [added: 225,139] | | | | [removed: 170,046] [added: 204,810] | | | | [removed: 148,125] [added: 170,046] | | | | [removed: 142,190] [added: 148,125] | | |
| Long-term debt (including current maturities) | | [removed: 240,407] [added: 191,429] | | | | [removed: 269,185] [added: 240,407] | | | | [removed: 271,217] [added: 269,185] | | | | [removed: 305,532] [added: 271,217] | | | | [removed: 251,989] [added: 305,532] | | |
| Shareholders’ equity | | [removed: 1,025,969] [added: 1,232,082] | | | | [removed: 856,519] [added: 1,025,969] | | | | [removed: 668,649] [added: 856,519] | | | | [removed: 593,000] [added: 668,649] | | | | [removed: 558,129] [added: 593,000] | | |
| Intercity miles (in thousands) | | [removed: 420,214] [added: 446,532] | | | | [removed: 389,588] [added: 420,214] | | | | [removed: 338,504] [added: 389,588] | | | | [removed: 299,330] [added: 338,504] | | | | [removed: 334,219] [added: 299,330] | | |
| Total tons (in thousands) | | [removed: 6,875] [added: 7,385] | | | | [removed: 6,397] [added: 6,875] | | | | [removed: 5,656] [added: 6,397] | | | | [removed: 4,902] [added: 5,656] | | | | [removed: 5,545] [added: 4,902] | | |
| Total shipments (in thousands) | | [removed: 7,765] [added: 8,279] | | | | [removed: 7,256] [added: 7,765] | | | | [removed: 6,327] [added: 7,256] | | | | [removed: 5,750] [added: 6,327] | | | | [removed: 6,691] [added: 5,750] | | |
| Average length of haul (miles) | | [removed: 941] [added: 936] | | | | [removed: 952] [added: 941] | | | | [removed: 948] [added: 952] | | | | [removed: 928] [added: 948] | | | | [removed: 901] [added: 928] | | |
| [removed: (2)] [added: (3)] | For the purpose of this table, interest expense is presented net of interest income. |
| [removed: (3)] [added: (4)] | Per share data has been restated retroactively for the three-for-two stock splits effected in September 2012 and August 2010. |
| Revenue from operations (1) | | $ | 2,337,648 | | | $ | 2,134,579 | | | $ | 1,903,800 | | | $ | 1,501,848 | | | $ | 1,260,088 | |
| Total operating expenses (1) | | 1,999,210 | | | | 1,849,325 | | | | 1,669,728 | | | | 1,364,109 | | | | 1,189,697 | | |
| Operating ratio (1) | | 85.5 | | % | | 86.6 | | % | | 87.7 | | % | | 90.8 | | % | | 94.4 | | % |
| Revenue per hundredweight (1) | | $ | 15.85 | | | $ | 15.53 | | | $ | 14.88 | | | $ | 13.28 | | | $ | 12.85 | |
| Revenue per intercity mile (1) | | $ | 5.24 | | | $ | 5.08 | | | $ | 4.89 | | | $ | 4.44 | | | $ | 4.21 | |
| (1) | Our prior-period results have been adjusted for an immaterial correction related to how we present the costs of purchased transportation for certain truckload brokerage and international freight forwarding services. For more information on these adjustments, see Note 1 to the Financial Statements included in Item 8, "Financial Statements and Supplementary Data" below. |
| (2) | Our 2010 results reflect a reduction in depreciation and amortization expense of $12.7 million, which was due to a change in estimate resulting from an evaluation of estimated useful lives and salvage values for our equipment. We determined that useful lives should be extended and salvage values should be reduced for certain equipment effective January 1, 2010. |
| | |
| --- | --- |
| Revenue from operations | | $ | 2,110,483 | | | $ | 1,882,541 | | | $ | 1,480,998 | | | $ | 1,245,005 | | | $ | 1,537,724 | |
| Total operating expenses | | 1,825,229 | | | | 1,648,469 | | | | 1,343,259 | | | | 1,174,614 | | | | 1,408,654 | | |
| Operating ratio | | 86.5 | | % | | 87.6 | | % | | 90.7 | | % | | 94.3 | | % | | 91.6 | | % |
| Revenue per hundredweight | | $ | 15.35 | | | $ | 14.72 | | | $ | 13.09 | | | $ | 12.70 | | | $ | 13.88 | |
| Revenue per intercity mile | | $ | 5.02 | | | $ | 4.83 | | | $ | 4.38 | | | $ | 4.16 | | | $ | 4.60 | |
| (1) | Our 2010 results reflect reductions in our depreciation and amortization expenses of approximately $12.7 million, due to changes in the estimated useful lives and salvage values of certain equipment, which are described further under “Critical Accounting Policies” below. |
Item 8. FINANCIAL STATEMENTS AND SUPPLEMENTARY DATA
212 rewritten, 84 added, 75 removed, 334 unchanged
Read the full itemFY2013 item · filed February 28, 2014FY2012 item · filed February 28, 2013
| (In thousands, except share and per share data) | | [added: 2013 | | | |] 2012 | | | | 2011 | | |
| Cash and cash equivalents | | $ | [removed: 12,857] [added: 30,174] | | | $ | [removed: 75,850] [added: 12,857] | |
| Customer receivables, less allowances of [removed: $8,561] [added: $8,067] and [removed: $9,173,] [added: $8,561,] respectively | | [removed: 219,039] [added: 248,069] | | | | [removed: 213,481] [added: 219,039] | | |
| Other receivables | | [removed: 1,324] [added: 10,225] | | | | [removed: 4,441] [added: 1,324] | | |
| Prepaid expenses and other current assets | | [removed: 21,754] [added: 21,262] | | | | [removed: 18,614] [added: 21,754] | | |
| Deferred income taxes | | [removed: 20,054] [added: 23,249] | | | | [removed: 19,466] [added: 20,054] | | |
| Total current assets | | [removed: 275,028] [added: 332,979] | | | | [removed: 331,852] [added: 275,028] | | |
| Revenue equipment | | [removed: 922,030] [added: 1,009,936] | | | | [removed: 789,984] [added: 922,030] | | |
| Land and structures | | [removed: 874,768] [added: 990,256] | | | | [removed: 738,359] [added: 874,768] | | |
| Other fixed assets | | [removed: 225,298] [added: 266,563] | | | | [removed: 214,816] [added: 225,298] | | |
| Leasehold improvements | | [removed: 6,128] [added: 6,378] | | | | [removed: 5,773] [added: 6,128] | | |
| Total property and equipment | | [removed: 2,028,224] [added: 2,273,133] | | | | [removed: 1,748,932] [added: 2,028,224] | | |
| Less: Accumulated depreciation | | [removed: (648,919] [added: (730,074] | | ) | | [removed: (621,982] [added: (648,919] | | ) |
| Net property and equipment | | [removed: 1,379,305] [added: 1,543,059] | | | | [removed: 1,126,950] [added: 1,379,305] | | |
| Other assets | | [removed: 38,718] [added: 36,588] | | | | [removed: 34,809] [added: 38,718] | | |
| Total assets | | $ | [removed: 1,712,514] [added: 1,932,089] | | | $ | [removed: 1,513,074] [added: 1,712,514] | |
| Accounts payable | | $ | [removed: 44,891] [added: 36,788] | | | $ | [removed: 42,096] [added: 44,891] | |
| Compensation and benefits | | [removed: 80,047] [added: 97,187] | | | | [removed: 66,740] [added: 80,047] | | |
| Claims and insurance accruals | | [removed: 33,990] [added: 38,784] | | | | [removed: 35,934] [added: 33,990] | | |
| Other accrued liabilities | | [removed: 20,906] [added: 21,480] | | | | [removed: 20,654] [added: 20,906] | | |
| Income taxes payable | | [removed: 6,327] [added: 2,168] | | | | [removed: 32] [added: 6,327] | | |
| Current maturities of long-term debt | | [removed: 38,978] [added: 35,715] | | | | [removed: 39,354] [added: 38,978] | | |
| Total current liabilities | | [removed: 225,139] [added: 232,122] | | | | [removed: 204,810] [added: 225,139] | | |
| Long-term debt | | [removed: 201,429] [added: 155,714] | | | | [removed: 229,831] [added: 201,429] | | |
| Other non-current liabilities | | [removed: 106,791] [added: 123,054] | | | | [removed: 86,998] [added: 106,791] | | |
| Deferred income taxes | | [removed: 153,186] [added: 189,117] | | | | [removed: 134,916] [added: 153,186] | | |
| Total long-term liabilities | | [removed: 461,406] [added: 467,885] | | | | [removed: 451,745] [added: 461,406] | | |
| Total liabilities | | [removed: 686,545] [added: 700,007] | | | | [removed: 656,555] [added: 686,545] | | |
| Common stock - $0.10 par value, 140,000,000 shares authorized, 86,164,917 [removed: and 86,164,986] shares outstanding at December 31, [removed: 2012] [added: 2013] and [removed: 2011, respectively] [added: 2012] | | 8,616 | | | | 8,616 | | |
| Capital in excess of par value | | 134,401 | | | | [removed: 134,403] [added: 134,401] | | |
| Retained earnings | | [removed: 882,952] [added: 1,089,065] | | | | [removed: 713,500] [added: 882,952] | | |
| Total shareholders’ equity | | [removed: 1,025,969] [added: 1,232,082] | | | | [removed: 856,519] [added: 1,025,969] | | |
| Total liabilities and shareholders’ equity | | $ | [removed: 1,712,514] [added: 1,932,089] | | | $ | [removed: 1,513,074] [added: 1,712,514] | |
| (In thousands, except share and per share data) | | [removed: 2012 | | | | 2011] [added: 2013] | | | | [removed: 2010] [added: 2012] | | |
| Salaries, wages and benefits | | [removed: 1,066,551] [added: 1,170,773] | | | | [removed: 956,079] [added: 1,066,551] | | | | [removed: 808,819] [added: 956,079] | | |
| Operating supplies and expenses | | [removed: 378,534] [added: 385,201] | | | | [removed: 355,186] [added: 378,534] | | | | [removed: 244,291] [added: 355,186] | | |
| General supplies and expenses | | [removed: 58,908] [added: 69,765] | | | | [removed: 49,900] [added: 58,908] | | | | [removed: 41,580] [added: 49,900] | | |
| Operating taxes and licenses | | [removed: 67,526] [added: 71,599] | | | | [removed: 63,284] [added: 67,526] | | | | [removed: 55,420] [added: 63,284] | | |
| Insurance and claims | | [removed: 29,681] [added: 30,910] | | | | [removed: 27,693] [added: 29,681] | | | | [removed: 25,329] [added: 27,693] | | |
| Communications and utilities | | [removed: 19,980] [added: 23,142] | | | | [removed: 18,104] [added: 19,980] | | | | [removed: 15,218] [added: 18,104] | | |
| Revenue from operations | | $ | 2,337,648 | | | $ | 2,134,579 | | | $ | 1,903,800 | |
| Purchased transportation | | 106,435 | | | | 94,522 | | | | 84,516 | | |
| Total operating expenses | | 1,999,210 | | | | 1,849,325 | | | | 1,669,728 | | |
| Balance as of December 31, 2013 | | 86,165 | | | $ | 8,616 | | | $ | 134,401 | | | $ | 1,089,065 | | | $ | 1,232,082 | |
Prior Period Adjustments
During the second quarter of 2013, we determined that the costs of purchased transportation for certain truckload brokerage and international freight forwarding services, which were previously netted against revenue, met the criteria to be presented separately in operating expenses in accordance with Accounting Standards Codification ("ASC") Topic 605, Revenue Recognition.
As a result, the accompanying Statements of Operations include correcting adjustments to increase both revenue and purchased transportation expense in the amounts of $24.1 million and $21.3 million for the years ended December 31, 2012 and 2011, respectively.
There was no effect on retained earnings, operating income, net income, earnings per share or cash flows for any period presented.
| 2018 | $ | 8 | |
Investing and financing activities that are not reported in the Statements of Cash Flows due to their non-cash nature are summarized below:
In addition, during the fourth quarter of 2013, we completed a nonmonetary exchange of property.
We acquired a service center with a fair value of $6.6 million, which resulted in a gain of $3.4 million.
The resulting gain was recorded in "Miscellaneous expenses, net" on our Statements of Operations.
Recent Accounting Pronouncements
The FASB has issued various new accounting standards and updates during 2013 that are effective for future periods.
We have evaluated these new standards and believe the adoption will not materially impact our financial condition or results of operations.
| 2018 | 50,000 | | |
| | $ | 191,429 | |
| | | | | | |
| --- | --- | --- | --- | --- | --- |
| | | | | | |
| 2014 | | $ | 15,931 | | |
| 2015 | | 10,833 | | | |
| 2016 | | 7,508 | | | |
| 2017 | | 5,684 | | | |
| 2018 | | 4,623 | | | |
| Thereafter | | 14,210 | | | |
We did not have any assets under capital leases at December 31, 2013.
At December 31, 2012, we leased certain information systems under capital leases with a gross carrying value of $9.9 million and accumulated amortization of $2.3 million.
| | | Year Ended December 31, | | | | | | | | | | |
| (In thousands) | | 2013 | | | | 2012 | | |
| (In thousands) | | 2013 | | | | 2012 | | |
Congdon, who was the brother of Earl E.
At that time, the Board of Directors and John R.
Congdon mutually agreed to terminate his amended and restated employment agreement.
He continued to be employed by the Company in a management position and as a member of our Board of Directors until his death in October 2013.
Congdon served as Chairman of the Board of Leasing until October 2013 and was succeeded in that position by John R.
Congdon, Jr. Earl E.
Congdon currently serve as members of Leasing’s Board of Directors.
Congdon that were terminated upon Mr. Congdon's death in October 2013.
| Revenue from operations | | $ | 2,110,483 | | | $ | 1,882,541 | | | $ | 1,480,998 | |
| Purchased transportation | | 70,426 | | | | 63,257 | | | | 50,489 | | |
| Total operating expenses | | 1,825,229 | | | | 1,648,469 | | | | 1,343,259 | | |
| Balance as of December 31, 2009 | | 83,891 | | | $ | 8,389 | | | $ | 86,232 | | | $ | 498,379 | | | $ | 593,000 | |
| Other | | — | | | — | | | | (2 | | ) | | — | | | | (2 | | ) |
We also offer worldwide freight forwarding services.
During the first quarter of 2010, we completed an evaluation of the estimated useful lives and salvage values for our equipment and determined that the actual period of service of certain revenue equipment exceeded that of our previously estimated useful lives.
As a result, we extended the estimated useful lives of most of our tractors to 9 years from 7 years and extended the estimated useful lives of our trailers to 15 years from 12.
In addition, we reduced the estimated salvage values associated with this equipment to more accurately reflect the value we believe such equipment will have at the end of its respective useful lives.
We made similar changes to the estimated useful lives and salvage values for certain of our other equipment but the results of these changes had less of an impact on our future depreciation expense.
As a result of the impact on depreciation from these changes that were effective January 1, 2010, income from continuing operations and net income in 2010 increased by approximately $12.7 million and $7.7 million, respectively.
This initial assessment provides a basis for determining whether it is necessary to perform the two-step goodwill impairment test required by Accounting Standards Codification (“ASC”) Topic 350.
| 2013 | $ | 712 | |
We fully self-insured long-term disability claims to a maximum of $3,000 per month for our salaried and non-salaried employees until April 2, 2010 and July 1, 2011, respectively.
We subsequently began to offer elective long-term disability coverage to our employees and, therefore, we have no liability for new long-term disability claims after those dates.
On August 2, 2010, we announced a three-for-two common stock split for shareholders of record as of the close of business on the record date, August 9, 2010.
On August 23, 2010, those shareholders received one additional share of common
stock for every two shares owned.
In lieu of fractional shares, shareholders received a cash payment based on the average of the high and low sales prices of the common stock on the record date.
the Applicable Margin Percentage for LIBOR Loans; or (c) the LIBOR Market Index Rate (“LIBOR Index Rate”) plus the Applicable Margin Percentage for LIBOR Market Index Loans.
Capitalized lease obligations are collateralized by property and equipment with a net book value of $7.6 million at December 31, 2012.
| 2013 | $ | 38,978 | |
| | $ | 240,407 | |
We lease certain information systems under capital leases.
Certain operating leases provide for renewal options.
Assets under capital leases are included in property and equipment as follows:
| Information systems | | $ | 9,910 | | | $ | 12,232 | |
| Less: Accumulated amortization | | (2,270 | | ) | | (3,065 | | ) |
| | | $ | 7,640 | | | $ | 9,167 | |
| 2013 | | $ | 3,308 | | | $ | 15,823 | | | $ | 19,131 | |
| 2014 | | — | | | | 11,977 | | | | 11,977 | | |
| 2015 | | — | | | | 7,566 | | | | 7,566 | | |
| 2016 | | — | | | | 5,707 | | | | 5,707 | | |
| 2017 | | — | | | | 4,801 | | | | 4,801 | | |
| Thereafter | | — | | | | 19,136 | | | | 19,136 | | |
| Less: Amount representing interest | | (44 | | ) | | | | | | | | |
| Present value of capitalized lease obligations | | $ | 3,264 | | | | | | | | | |
Congdon, John R.
In connection with his resignation as a Senior Vice President, the Board of Directors and Mr. Congdon agreed to terminate the amended and restated employment agreement between the Company and John R.
Congdon.
An excerpt. Shown here: 40 of 212 rewritten, 40 of 84 added and 40 of 75 removed. The counts are complete. For every sentence, read Item 8. FINANCIAL STATEMENTS AND SUPPLEMENTARY DATA in the FY2013 filing and the FY2012 filing.
Item 9A. CONTROLS AND PROCEDURES
7 rewritten, 2 added, 1 removed, 36 unchanged
Read the full itemFY2013 item · filed February 28, 2014FY2012 item · filed February 28, 2013
Management has conducted an evaluation, with the participation of our CEO and CFO, of the effectiveness of our internal control over financial reporting as of December 31, [removed: 2012] [added: 2013] based on the framework in Internal Control – Integrated Framework issued by the Committee of Sponsoring Organizations of the Treadway [removed: Commission.][added: Commission (1992 framework).]
Management concluded that our internal control over financial reporting was effective as of December 31, [removed: 2012,] [added: 2013,] based on our evaluation under the framework in Internal Control – Integrated Framework.
The effectiveness of our internal control over financial reporting as of December 31, [removed: 2012] [added: 2013] has been audited by Ernst & Young LLP, an independent registered public accounting firm, as stated in their report which is included herein.
We have audited Old Dominion Freight Line, [removed: Inc.'s] [added: Inc.’s] internal control over financial reporting as of December 31, [removed: 2012,] [added: 2013,] based on criteria established in Internal Control-Integrated Framework issued by the Committee of Sponsoring Organizations of the Treadway Commission [added: (1992 framework)] (the COSO criteria).
A [removed: company's] [added: company’s] internal control over financial reporting includes those policies and procedures that (1) pertain to the maintenance of records that, in reasonable detail, accurately and fairly reflect the transactions and dispositions of the assets of the company; (2) provide reasonable assurance that transactions are recorded as necessary to permit preparation of financial statements in accordance with generally accepted accounting principles, and that receipts and expenditures of the company are being made only in accordance with authorizations of management and directors of the company; and (3) provide reasonable assurance regarding prevention or timely detection of unauthorized acquisition, [removed: use] [added: use,] or disposition of the [removed: company's] [added: company’s] assets that could have a material effect on the financial statements.
In our opinion, Old Dominion Freight Line, Inc. maintained, in all material respects, effective internal control over financial reporting as of December 31, [removed: 2012,] [added: 2013,] based on the COSO criteria.
We also have audited, in accordance with the standards of the Public Company Accounting Oversight Board (United States), the balance sheets of Old Dominion Freight Line, Inc. as of December 31, [removed: 2012] [added: 2013] and [removed: 2011,] [added: 2012,] and the related statements of operations, changes in [removed: shareholders'] [added: shareholders’] equity, and cash flows for each of the three years in the period ended December 31, [removed: 2012] [added: 2013] and our report dated February 28, [removed: 2013] [added: 2014] expressed an unqualified opinion thereon.
Our audits also included the financial statement schedule listed in the Index at Item 15 (a)(2).
February 28, 2014
February 28, 2013
Item 10. DIRECTORS, EXECUTIVE OFFICERS AND CORPORATE GOVERNANCE
1 rewritten, 0 added, 0 removed, 3 unchanged
Read the full itemFY2013 item · filed February 28, 2014FY2012 item · filed February 28, 2013
The information required by Item 10 of Form 10-K will appear in the Company’s proxy statement for its [removed: 2013] [added: 2014] Annual Meeting of Shareholders under the captions “Proposal 1 – Election of Directors,” “Executive Officers,” “Section 16(a) Beneficial Ownership Reporting Compliance,” “Corporate Governance – Attendance and Committees of the Board – Audit Committee,” and “Corporate Governance – Director Nominations,” and the information therein is incorporated herein by reference.
Item 11. EXECUTIVE COMPENSATION
1 rewritten, 0 added, 0 removed, 0 unchanged
Read the full itemFY2013 item · filed February 28, 2014FY2012 item · filed February 28, 2013
The information required by Item 11 of Form 10-K will appear in the Company’s proxy statement for its [removed: 2013] [added: 2014] Annual Meeting of Shareholders under the captions “Corporate Governance – Compensation Committee Interlocks and Insider Participation,” “Compensation Discussion and Analysis,” “Compensation Committee Report,” “Executive Compensation,” and “Director Compensation,” and the information therein is incorporated herein by reference.
Item 12. SECURITY OWNERSHIP OF CERTAIN BENEFICIAL OWNERS AND MANAGEMENT AND RELATED STOCKHOLDER MATTERS
1 rewritten, 0 added, 0 removed, 0 unchanged
Read the full itemFY2013 item · filed February 28, 2014FY2012 item · filed February 28, 2013
The information required by Item 12 of Form 10-K will appear in the Company’s proxy statement for its [removed: 2013] [added: 2014] Annual Meeting of Shareholders under the caption “Security Ownership of Management and Certain Beneficial Owners,” and the information therein is incorporated herein by reference.
Item 13. CERTAIN RELATIONSHIPS AND RELATED TRANSACTIONS, AND DIRECTOR INDEPENDENCE
1 rewritten, 0 added, 0 removed, 0 unchanged
Read the full itemFY2013 item · filed February 28, 2014FY2012 item · filed February 28, 2013
The information required by Item 13 of Form 10-K will appear in the Company’s proxy statement for the [removed: 2013] [added: 2014] Annual Meeting of Shareholders under the captions “Corporate Governance – Independent Directors” and “Related Person Transactions,” and the information therein is incorporated herein by reference.
Item 14. PRINCIPAL ACCOUNTING FEES AND SERVICES
1 rewritten, 0 added, 0 removed, 1 unchanged
Read the full itemFY2013 item · filed February 28, 2014FY2012 item · filed February 28, 2013
The information required by Item 14 of Form 10-K will appear in the Company’s proxy statement for its [removed: 2013] [added: 2014] Annual Meeting of Shareholders under the captions “Corporate Governance – Audit Committee Pre-Approval Policies and Procedures” and “Independent Registered Public Accounting Firm Fees and Services,” and the information therein is incorporated herein by reference.
Item 15. EXHIBITS, FINANCIAL STATEMENT SCHEDULES
55 rewritten, 1 added, 74 removed, 146 unchanged
Read the full itemFY2013 item · filed February 28, 2014FY2012 item · filed February 28, 2013
Balance Sheets – December 31, [removed: 2012] [added: 2013] and December 31, [removed: 2011][added: 2012]
Statements of Operations – Years ended December 31, [removed: 2012,] [added: 2013,] December 31, [removed: 2011] [added: 2012] and December 31, [removed: 2010][added: 2011]
Statements of Changes in Shareholders’ Equity – Years ended December 31, [removed: 2012,] [added: 2013,] December 31, [removed: 2011] [added: 2012] and December 31, [removed: 2010][added: 2011]
Statements of Cash Flows – Years ended December 31, [removed: 2012,] [added: 2013,] December 31, [removed: 2011] [added: 2012] and December 31, [removed: 2010][added: 2011]
| Dated: | February 28, [removed: 2013] [added: 2014] | | | | By: | | /s/ DAVID S. CONGDON |
| /s/ EARL E. CONGDON | | Executive Chairman of the Board of Directors | | February 28, [removed: 2013] [added: 2014] |
| /s/ DAVID S. CONGDON | | Director, President and Chief Executive Officer | | February 28, [removed: 2013] [added: 2014] |
| /s/ J. PAUL BREITBACH | | Director | | February 28, [removed: 2013] [added: 2014] |
| /s/ JOHN R. [removed: CONGDON] [added: CONGDON, JR.] | | Director | | February 28, [removed: 2013] [added: 2014] |
| /s/ ROBERT G. CULP, III | | Director | | February 28, [removed: 2013] [added: 2014] |
| /s/ JOHN D. KASARDA | | Director | | February 28, [removed: 2013] [added: 2014] |
| /s/ LEO H. SUGGS | | Director | | February 28, [removed: 2013] [added: 2014] |
| /s/ D. MICHAEL WRAY | | Director | | February 28, [removed: 2013] [added: 2014] |
| /s/ J. WES FRYE | | Senior Vice President – Finance | | February 28, [removed: 2013] [added: 2014] |
| /s/ JOHN P. BOOKER III | | Vice President – Controller | | February 28, [removed: 2013] [added: 2014] |
FOR YEAR ENDED DECEMBER 31, [removed: 2012][added: 2013]
| [removed: 3.1.1(a)] [added: 3.1.1] | | Amended and Restated Articles of Incorporation of Old Dominion Freight Line, Inc. (as amended July 30, 2004) [added: (Incorporated by reference to the exhibit of the same number contained in the Company’s Quarterly Report on Form 10-Q for the quarter ended June 30, 2004, filed on August 6, 2004 )] |
| [removed: 4.6.10(b)] [added: 4.6.10] | | Note Purchase Agreement among Old Dominion Freight Line, Inc. and the Purchasers set forth in Schedule A thereto, dated as of February 25, 2005 [added: (Incorporated by reference to the exhibit of the same number contained in the Company’s Annual Report on Form 10-K for the year ended December 31, 2004, filed on March 16, 2005)] |
| [removed: 4.9(e)] [added: 4.9] | | Note Purchase Agreement among Old Dominion Freight Line, Inc. and the Purchasers set forth in Schedule A thereto, dated as of April 25, [removed: 2006.] [added: 2006 (Incorporated by reference to the exhibit of the same number contained in the Company’s Current Report on Form 8-K filed on May 1, 2006)] |
| [removed: 4.10(f)] [added: 4.10] | | Amended and Restated Credit Agreement among Wachovia Bank, National Association, as Administrative Agent; the Lenders named therein; and Old Dominion Freight Line, Inc., dated as of August 10, 2006 [added: (Incorporated by reference to the exhibit of the same number contained in the Company’s Current Report on Form 8-K filed on August 16, 2006)] |
| [removed: 4.10.1(m)] [added: 4.10.1] | | Amendment No. 1 to Amended and Restated Credit Agreement among Old Dominion Freight Line, Inc., the Lenders named therein and Wells Fargo Bank, National Association, as Agent, dated as of December 31, 2010 [added: (Incorporated by reference to the exhibit of the same number contained in the Company’s Current Report on Form 8-K filed on January 6, 2011)] |
| [removed: 4.11(m)] [added: 4.11] | | Note Purchase Agreement by and among Old Dominion Freight Line, Inc. and the Purchasers set forth in Schedule A thereto, dated as of January 3, 2011 [added: (Incorporated by reference to the exhibit of the same number contained in the Company’s Current Report on Form 8-K filed on January 6, 2011)] |
| [removed: 4.12(p)] [added: 4.12] | | Second Amended and Restated Credit Agreement among Wells Fargo Bank, National Association, as Administrative Agent; the Lenders named therein; and Old Dominion Freight Line, Inc., dated as of August 10, 2011 [added: (Incorporated by reference to the exhibit of the same number contained in the Company’s Current Report on Form 8-K filed on August 16, 2011)] |
| [removed: 10.17.6(g)*] [added: 10.17.6*] | | Amended and Restated Employment Agreement Between Old Dominion Freight Line, Inc. and Earl E. Congdon, effective as of June 1, 2008 [added: (Incorporated by reference to the exhibit of the same number contained in the Company’s Current Report on Form 8-K, filed on June 3, 2008)] |
| [removed: 10.17.7(g)*] [added: 10.17.7*] | | Amended and Restated Employment Agreement Between Old Dominion Freight Line, Inc. and John R. Congdon, effective as of June 1, 2008 [added: (Incorporated by reference to the exhibit of the same number contained in the Company’s Current Report on Form 8-K, filed on June 3, 2008)] |
| [removed: 10.17.8(g)*] [added: 10.17.8*] | | Amended and Restated Employment Agreement between Old Dominion Freight Line, Inc. and David S. Congdon, effective as of June 1, 2008 [added: (Incorporated by reference to the exhibit of the same number contained in the Company’s Current Report on Form 8-K, filed on June 3, 2008)] |
| [removed: 10.17.10(l)*] [added: 10.17.10*] | | First Amendment to Amended and Restated Employment Agreement, effective as of May 31, 2010, by and between Old Dominion Freight Line, Inc. and Earl E. Congdon [added: (Incorporated by reference to the exhibit of the same number contained in the Company’s Current Report on Form 8-K filed on May 28, 2010)] |
| [removed: 10.17.11(l)*] [added: 10.17.11*] | | First Amendment to Amended and Restated Employment Agreement, effective as of May 31, 2010, by and between Old Dominion Freight Line, Inc. and John R. Congdon [added: (Incorporated by reference to the exhibit of the same number contained in the Company’s Current Report on Form 8-K filed on May 28, 2010)] |
| [removed: 10.17.12(r)*] [added: 10.17.12*] | | Second Amendment to Amended and Restated Employment Agreement, effective as of May 31, 2012, by and between Old Dominion Freight Line, Inc. and Earl E. Congdon [added: (Incorporated by reference to the exhibit of the same number contained in the Company’s Current Report on Form 8-K filed on February 6, 2012)] |
| [removed: 10.17.13(r)*] [added: 10.17.13*] | | Second Amendment to Amended and Restated Employment Agreement, effective as of May 31, 2012, by and between Old Dominion Freight Line, Inc. and John R. Congdon [added: (Incorporated by reference to the exhibit of the same number contained in the Company’s Current Report on Form 8-K filed on February 6, 2012)] |
| [removed: 10.17.14(u)*] [added: 10.17.14*] | | Termination of Agreement, effective as of August 3, 2012, by and between Old Dominion Freight Line, Inc. and John R. Congdon [added: (Incorporated by reference to the exhibit of the same number contained in the Company’s Current Report on Form 8-K filed on August 3, 2012)] |
| [removed: 10.17.15(w)*] [added: 10.17.15*] | | Old Dominion Freight Line, Inc. 2012 Phantom Stock Plan [added: (Incorporated by reference to the exhibit of the same number contained in the Company’s Current Report on Form 8-K filed on November 5, 2012)] |
| [removed: 10.17.16(w)*] [added: 10.17.16*] | | Form of Old Dominion Freight Line, Inc. 2012 Phantom Stock Plan Phantom Stock Award Agreement [added: (Incorporated by reference to the exhibit of the same number contained in the Company’s Current Report on Form 8-K filed on November 5, 2012)] |
| [removed: 10.17.17(w)*] [added: 10.17.17*] | | Second Amended and Restated Employment Agreement by and between Old Dominion Freight Line, Inc. and Earl E. Congdon, effective as of November 1, 2012 [added: (Incorporated by reference to the exhibit of the same number contained in the Company’s Current Report on Form 8-K filed on November 5, 2012)] |
| 10.17.18* | | First Amendment to Amended and Restated Employment Agreement, effective as of November 1, 2012, by and between Old Dominion Freight Line, Inc. and David S. Congdon [added: (Incorporated by reference to the exhibit of the same number contained in the Company’s Annual Report on Form 10-K for the year ended December 31, 2012, filed on February 28, 2013)] |
| [removed: 10.18.4(h)*] [added: 10.18.4*] | | Form of Old Dominion Freight Line, Inc. Director Phantom Stock Plan Award Agreement [added: (Incorporated by reference to the exhibit of the same number contained in the Company’s Quarterly Report on Form 10-Q for the quarter ended June 30, 2008, filed on August 8, 2008)] |
| [removed: 10.18.7(o)*] [added: 10.18.7*] | | Old Dominion Freight Line, Inc. Director Phantom Stock Plan, as amended through April 1, 2011 [added: (Incorporated by reference to the exhibit of the same number contained in the Company’s Quarterly Report on Form 10-Q for the quarter ended March 31, 2011, filed on May 9, 2011)] |
| [removed: 10.19.1(c)*] [added: 10.19.1*] | | Old Dominion Freight Line, Inc. Phantom Stock Plan, effective as of May 16, 2005 [added: (Incorporated by reference to the exhibit of the same number contained in the Company’s Current Report on Form 8-K filed on May 20, 2005)] |
| [removed: 10.19.3(d)*] [added: 10.19.3*] | | Form of Old Dominion Freight Line, Inc. Phantom Stock Award Agreement [added: (Incorporated by reference to the exhibit of the same number contained in the Company’s Current Report on Form 8-K filed on February 21, 2006)] |
| [removed: 10.19.4(i)*] [added: 10.19.4*] | | Old Dominion Freight Line, Inc. Phantom Stock Plan, effective as of January 1, 2009 [added: (Incorporated by reference to the exhibit of the same number contained in the Company’s Annual Report on Form 10-K for the year ended December 31, 2008, filed on March 2, 2009)] |
| 2013 | | $ | 7,282 | | | $ | 1,074 | | | $ | 2,046 | | | $ | 6,310 | |
| | |
| --- | --- |
| | |
| | |
| --- | --- |
| | |
| 2010 | | $ | 10,199 | | | $ | 545 | | | $ | 3,944 | | | $ | 6,800 | |
| | |
| --- | --- |
| | |
| --- | --- |
| | |
| --- | --- |
| | |
| | |
| --- | --- |
| | |
| --- | --- |
| | | | | |
| John R. Congdon | | | | |
| /s/ JOHN R. CONGDON, JR. | | Director | | February 28, 2013 |
| 3.1.2(v) | | Articles of Amendment of Old Dominion Freight Line, Inc. |
| 3.2 | | Amended and Restated Bylaws of Old Dominion Freight Line, Inc. |
| 4.1 | | Specimen certificate of Common Stock |
| 10.18.3(h)* | | Old Dominion Freight Line, Inc. Director Phantom Stock Plan |
| 10.18.5(i)* | | Non-Executive Director Compensation Structure, effective January 1, 2008 |
| 10.18.6(o)* | | Non-Executive Director Compensation Structure, effective January 1, 2011 |
| 10.20.2(d)* | | Form of Annual Salary and Bonus Deduction Agreement |
| 10.21(g)* | | Old Dominion Freight Line, Inc. Performance Incentive Plan |
| | |
| --- | --- |
| | |
| --- | --- |
| | |
| --- | --- |
| | |
| --- | --- |
| | |
| --- | --- |
| | |
An excerpt. Shown here: 40 of 55 rewritten, all 1 added and 40 of 74 removed. The counts are complete. For every sentence, read Item 15. EXHIBITS, FINANCIAL STATEMENT SCHEDULES in the FY2013 filing and the FY2012 filing.