 filings.tools
Old Dominion Freight Line (ODFL) 10-K risk factor changes: FY2015 vs FY2014
The 2015-12-31 10-K against the 2014-12-31 one, compared heading by heading and sentence by sentence. One of these filings carries no fiscal year tag, so its year is the calendar year of the period end.
Item 1A47 rewritten13 added30 removed241 unchanged
All filing items522 rewritten200 added201 removed1,225 unchanged
Summary
counted, not written
- Item 1A headings could not be compared: only 0 carried over between the two years, which usually means one filing was read wrongly, so none is reported as new or removed.
- Sentence by sentence, 200 added, 201 removed, 522 rewritten and 1,225 unchanged across 17 items that differ.
Sentences by item
21 items, with every count and a link to each item that changed
Underlined words on a shaded ground are new in FY2015; struck-through words were in FY2014. Sentences that are wholly new or wholly gone are labelled rather than marked.
Item 1A. RISK FACTORS
47 rewritten, 13 added, 30 removed, 241 unchanged
| • | some [removed: customers] [added: shippers] may choose to [removed: operate] [added: acquire] their own [removed: private] trucking fleet or may choose to increase the volume of freight they transport if they have an existing [removed: private] trucking fleet; |
| • | [removed: the] [added: a] trend towards consolidation in the ground transportation industry may create other large carriers with greater financial resources and other competitive advantages relating to their size; |
| • | [removed: some] shippers [removed: have indicated that they intend to] [added: may] limit their use of unionized trucking companies because of the threat of strikes and other work stoppages; [added: and] |
| • | a strike or work stoppage could negatively impact our profitability and could damage customer and employee relationships; [removed: and] |
Our growth strategy includes increasing the volume of freight moving through our existing service center network, selectively expanding our [removed: geographic footprint] [added: capacity] and broadening the scope of our service offerings.
In connection with our growth strategy, at various times, we have [removed: made selective acquisitions, purchased additional equipment,] expanded and upgraded service [removed: centers] [added: centers, purchased additional equipment] and increased our sales and marketing efforts, and we expect to continue to do so.
| • | shortages of suitable real estate may limit our growth and [removed: geographic expansion and might] [added: could] cause congestion in our service center network, which could result in increased operating expenses; |
[removed: Growth] [added: Although we have not completed an acquisition since 2008, growth] through acquisitions has been a key component of our LTL growth strategy throughout our history.
Exploration of potential acquisitions requires significant attention from our [removed: senior] management team.
[added: We cannot ensure that we will] have sufficient cash [removed: with which] to consummate an acquisition or otherwise be able to obtain financing for any acquisition.
Adverse economic conditions can negatively affect our customers’ business levels, the amount of transportation services they need, their ability to pay for our services and overall freight levels, [removed: all] [added: any] of which might impair our asset utilization.
Further, when adverse economic times arise customers may [removed: bid out freight or] select competitors that offer lower rates in an attempt to lower their [removed: costs] [added: costs,] and we might be forced to lower our rates or lose freight.
Such cost increases include, but are not limited to, increases in fuel prices, [removed: driver wages,] interest rates, taxes, tolls, license and registration fees, insurance, revenue equipment and healthcare for our employees.
Difficulties attracting and retaining qualified drivers could result in increases in driver compensation and could adversely affect our [removed: profitability and] [added: profitability,] our ability to maintain or grow our [removed: fleet.][added: fleet and our ability to maintain our customer relationships.]
Due in part to the time commitment, [removed: the] physical [removed: strains of the work] [added: requirements, our stringent Company hiring standards] and [removed: the] current industry conditions, the available pool of [added: qualified] employee drivers has been declining.
The compensation we offer our drivers is subject to market conditions that may require increases in driver [removed: compensation, which becomes more likely as economic conditions improve.][added: compensation.]
If we are unable to attract and retain a sufficient number of [added: qualified] drivers, we could be required to adjust our compensation packages, [added: amend our hiring standards,] or operate with fewer trucks and face difficulty meeting customer demands, any of which could adversely affect our growth and profitability.
Our operating results would be adversely affected if any of the following were to occur: (i) the number or [added: the] severity of claims increases; (ii) we are required to accrue or pay additional amounts because the claims prove to be more severe than our original assessment; or (iii) claims exceed our excess coverage amounts.
If claims exceed our SIR or deductible [removed: levels] [added: levels, insurance companies exit the transportation insurance marketplace,] or insurance market conditions change, insurers could raise premiums for excess coverage to cover their expenses and anticipated future losses.
In addition, insurance companies [added: generally] require us to [removed: obtain letters of credit to] collateralize our SIR or deductible levels.
If these [added: collateralization] requirements increase, our borrowing capacity could be adversely affected.
We cannot predict the impact that any state or federal healthcare legislation or [removed: regulation, including the Patient Protection and Affordable Care Act,] [added: regulation] will have on our operations, but we expect costs associated with providing benefits under employee medical plans [added: and healthcare-related costs associated with workers' compensation] to continue to increase.
Limited supply and increased [removed: prices for] [added: costs of] new equipment may adversely affect our earnings and cash flow.
We [removed: are] [added: may] also [added: be] subject to shortages in raw materials that are required for the production of critical operating equipment and supplies, such as shortages in rubber or steel.
We [removed: have incurred significant increases in the cost of tractors due] [added: are subject] to regulations issued by the U.S. Environmental Protection Agency (the “EPA”) and various state agencies that [removed: require] [added: have required] progressive reductions in exhaust emissions from diesel engines.
We maintain fuel storage and pumping facilities at many of our service center locations; however, we may be susceptible to fuel shortages at certain locations that could cause us to incur additional expense to ensure adequate supply on a timely basis [added: and] to prevent a disruption to our service schedules.
We [removed: are, and in the future may be,] [added: are also] subject to [removed: legal and] [added: potential] governmental proceedings and claims.
[removed: In addition, the] [added: The] trucking industry is [added: also] subject to regulatory and legislative changes from a variety of other governmental authorities, which address matters such as: [removed: (i)] increasingly stringent environmental, occupational safety and health [removed: regulations; (ii)] [added: regulations,] limits on vehicle weight and [removed: size; (iii) ergonomics; (iv)] [added: size, ergonomics,] port [removed: security;] [added: security,] and [removed: (v)] hours of service.
In addition, we are subject to compliance with cargo-security and transportation regulations issued by the TSA [added: and CBP] within the U.S. Department of Homeland Security.
The [removed: CSA includes compliance and] [added: FMCSA’s Compliance, Safety, Accountability initiative ("CSA") is an] enforcement [removed: initiatives] [added: and compliance program] designed to monitor and improve commercial motor vehicle safety by measuring the safety record of both the motor carrier and the driver.
If we receive [removed: an] unacceptable CSA [removed: score,] [added: scores, and this data is made available to the public,] our relationships with our customers could be damaged, which could result in a loss of business.
The requirements of CSA could [added: also] shrink the industry’s pool of drivers as those with unfavorable scores could leave the industry.
Our results of operations may be affected by seasonal [removed: factors and] [added: factors,] harsh weather [removed: conditions.][added: conditions and disasters.]
Our operations are subject to seasonal trends common in [removed: the trucking] [added: our] industry.
Our operating margins in the first [removed: quarter] [added: and fourth quarters] are [removed: normally] [added: typically] lower [added: than those during the second and third quarters] due to reduced [removed: demand] [added: shipments] during the winter months.
Harsh weather [added: and disaster, whether natural or man-made,] can also adversely affect our performance by reducing demand and reducing our ability to transport freight, which could result in decreased revenue and increased operating expenses.
If we are unable to retain our key employees, [added: or if we do not effectively execute] our [added: succession plan, our] financial condition, results of operations and liquidity could be adversely affected.
If we are unable to continue to develop and retain a core group of management personnel and execute succession planning strategies, [added: or we encounter any unforeseen difficulties associated with the recent transition of members of] our [added: management team, our] business could be negatively impacted in the future.
New accounting standards or [removed: requirements, such as a conversion from U.S. generally accepted accounting principles to International Financial Reporting Standards,] [added: requirements] could change the way we record revenues, expenses, assets and/or liabilities or could be costly to implement.
Our information systems, including our [removed: accounting systems and] [added: accounting,] communications and data processing systems, are integral to the efficient operation of our business.
Furthermore, continued merger and acquisition activity in transportation and logistics could result in stronger or new competitors, which could have a material adverse effect on our business, financial condition and results of operations.
We may not be able to compete successfully in an increasingly consolidated LTL industry and cannot predict with certainty how industry consolidation will affect our competitors or us.
Public disclosure of certain CSA scores was restricted through the enactment of the Fixing America’s Surface Transportation Act of 2015 (the “FAST Act”) on December 4, 2015; however, the FAST Act does not restrict public disclosure of all data collected by the FMCSA.
Despite the recent decline in diesel fuel prices, future increases in such prices and decreases in diesel fuel availability could have a material adverse effect on our operating results.
The nature of our business exposes us to the potential for various claims and litigation related to labor and employment, personal injury, property damage, cargo claims, safety and contract compliance, environmental liability and other matters.
Accordingly, we are, and in the future may be, subject to legal proceedings and claims that have arisen in the ordinary course of our business, and may include class-action allegations.
We utilize third-party service providers who have access to our systems and certain sensitive data, which exposes us to additional security risks.
In the current environment of instantaneous communication and social media outlets, the quick and broad dissemination of information through media sources could cause damaging information about us, whether accurate or not, to be broadly publicized.
This unfavorable publicity could also require the need to allocate significant resources to the rebuilding of our reputation.
Anti-terrorism measures may disrupt our business.
Federal, state and municipal authorities have implemented and are continuing to implement various anti-terrorism measures, including checkpoints and travel restrictions on large trucks.
If additional security measures disrupt or impede the timing of our deliveries, we may fail to meet the requirements of our customers or incur increased expenses to do so.
There can be no assurance that new anti-terrorism measures will not be implemented and that such measures will not have a material adverse effect on our operations.
| | |
| --- | --- |
| • | geographic expansion requires start-up costs that could expose us to temporary losses; |
We cannot assure that we will
Regulatory requirements, including the Compliance, Safety, Accountability initiative (the "CSA") of the FMCSA, have also reduced the number of eligible drivers and may continue to do so in the future.
Beginning in October 2002, new diesel engines were required to meet these new emission limits.
Some of the regulations required reductions in the sulfur content of diesel fuel beginning in June 2006 and the introduction of emissions after-treatment devices on newly-manufactured engines and vehicles beginning with model-year 2007.
The final phase of these regulations required reduced nitrogen and non-methane hydrocarbon emissions beginning with model-year 2010.
Beginning in 2013, these regulations also required that all heavy-duty diesel engines built for highway applications over 14,000 pounds include certified onboard diagnostics systems to monitor emissions.
In October 2009, the U.S. Court of Appeals for the District of Columbia Circuit ordered the FMCSA to review and re-issue rules governing hours of service for commercial truck drivers by July 26, 2011.
This deadline was extended and on December 22, 2011, the FMCSA issued its final rule, which mandated compliance by July 1, 2013.
The 2011 rule reduced the maximum number of hours a truck driver could work each week to 70 hours from the former 82-hour limit.
The 2011 rule maintained the maximum 11-hour daily driving limit, but required drivers to take a 30-minute break prior to working beyond
eight hours.
The 2011 rule also modified the “34-hour restart” provision to include two periods of rest between 1 a.m.
and 5 a.m., and limited a restart to once every 168 hours.
On December 16, 2014, however, the 2015 Omnibus Appropriations Bill temporarily suspended enforcement of certain aspects of the restart provisions until September 30, 2015.
Specifically, the new law temporarily eliminated the requirements for two rest periods between 1 a.m.
and 5 a.m.
and the 168-hour minimum restart provision.
During this suspension period, the law directs the Secretary of the DOT to conduct a study of the operational, safety, health and fatigue aspects of the restart provisions in effect before and after July 1, 2013.
Implementation of the 2011 rule on July 1, 2013 required us to make certain changes in our operating procedures.
These changes increased our operating costs by limiting the productivity of our drivers.
While the suspension of certain aspects of the restart provisions should allow us to regain some of this lost productivity, the suspension is temporary and we do not plan to make significant changes to our operations.
As a result, we could continue to incur higher operating costs than we had before the 2011 rule went into effect.
We are subject to future rulemaking by the FMCSA and other regulatory agencies, which could be more stringent, require additional changes to our operations, increase our operating costs or otherwise adversely impact our results of operations.
Certain measurements and scores collected by the CSA from transportation companies are available to the general public on the FMCSA’s website.
Customers, competitors, employees and other individuals continue to increase the use of social media outlets, and we maintain and manage our own corporate presence through various social media outlets.
We support new ways of sharing data and communicating through these social media outlets.
However, information distributed via social networking could result in unfavorable publicity about us being disseminated quickly and broadly.
An excerpt. Shown here: 40 of 47 rewritten, all 13 added and all 30 removed. The counts are complete. For every sentence, read Item 1A. RISK FACTORS in the FY2015 filing and the FY2014 filing.
Item 7. MANAGEMENT’S DISCUSSION AND ANALYSIS OF FINANCIAL CONDITION AND RESULTS OF OPERATIONS
121 rewritten, 62 added, 66 removed, 184 unchanged
We are a leading, less-than-truckload (“LTL”), union-free motor carrier providing regional, inter-regional and national LTL services, which include ground and air expedited transportation and consumer household pickup and [removed: delivery] [added: delivery,] through a single integrated organization.
In addition to our core LTL services, we offer a broad range of value-added services including [removed: international freight forwarding,] container drayage, truckload brokerage, supply chain consulting and warehousing.
| • | LTL Weight Per Shipment – Fluctuations in weight per shipment can indicate changes in the mix of freight we receive from our customers, as well as changes in the number of units included in a shipment. Generally, increases in weight per shipment indicate higher demand for our customers' products and overall increased economic activity. Changes in weight per shipment [added: can also be influenced by shifts between LTL and other modes of transportation, such as truckload and intermodal, in response to capacity, service and pricing issues. Fluctuations in weight per shipment] generally have an inverse effect on our revenue per hundredweight, as [removed: an increase] [added: a decrease] in weight per shipment will typically cause [removed: a decrease] [added: an increase] in revenue per hundredweight. |
Our primary cost elements are direct wages and benefits associated with the movement of freight, [removed: fuel and other] operating supplies and expenses, [added: which include diesel fuel,] and depreciation of our equipment fleet and service center facilities.
We gauge our overall success in managing costs by monitoring our operating ratio, a measure of profitability calculated by dividing total operating expenses by revenue, which also allows for industry-wide comparisons with our [removed: competition.][added: competitors.]
| | | [removed: 2014] [added: 2015] | | | [removed: 2013] [added: 2014] | | | [removed: 2012] [added: 2013] | |
| Salaries, wages and benefits | | [removed: 49.6] [added: 52.8] | | | [removed: 50.1] [added: 49.6] | | | [removed: 50.0] [added: 50.1] | |
| Operating supplies and expenses | | [removed: 15.5] [added: 11.9] | | | [removed: 16.5] [added: 15.5] | | | [removed: 17.7] [added: 16.5] | |
| General supplies and expenses | | 3.0 | | | 3.0 | | | [removed: 2.8] [added: 3.0] | |
| Operating taxes and licenses | | [removed: 3.0] [added: 3.1] | | | [removed: 3.1] [added: 3.0] | | | [removed: 3.2] [added: 3.1] | |
| Insurance and claims | | 1.3 | | | 1.3 | | | [removed: 1.4] [added: 1.3] | |
| Communication and utilities | | 0.9 | | | [removed: 1.0] [added: 0.9] | | | [removed: 0.9] [added: 1.0] | |
| Depreciation and amortization | | [removed: 5.3] [added: 5.6] | | | [removed: 5.4] [added: 5.3] | | | [removed: 5.2] [added: 5.4] | |
| Purchased transportation | | [removed: 4.6] [added: 3.9] | | | [removed: 4.5] [added: 4.6] | | | [removed: 4.4] [added: 4.5] | |
| Building and office equipment rents | | [removed: 0.4] [added: 0.3] | | | [removed: 0.5] [added: 0.4] | | | [removed: 0.6] [added: 0.5] | |
| Miscellaneous expenses, net | | [removed: 0.6] [added: 0.4] | | | [removed: 0.1] [added: 0.6] | | | [removed: 0.4] [added: 0.1] | |
| Total operating expenses | | [removed: 84.2] [added: 83.2] | | | [removed: 85.5] [added: 84.2] | | | [removed: 86.6] [added: 85.5] | |
| Operating income | | [removed: 15.8] [added: 16.8] | | | [removed: 14.5] [added: 15.8] | | | [removed: 13.4] [added: 14.5] | |
| Interest expense, net (1) | | 0.2 | | | [removed: 0.4] [added: 0.2] | | | [removed: 0.6] [added: 0.4] | |
| Other expense, net | | 0.1 | | | [removed: —] [added: 0.1] | | | — | |
| Income before income taxes | | [removed: 15.5] [added: 16.5] | | | [removed: 14.1] [added: 15.5] | | | [removed: 12.8] [added: 14.1] | |
| Provision for income taxes | | [removed: 5.9] [added: 6.2] | | | [removed: 5.3] [added: 5.9] | | | [removed: 4.9] [added: 5.3] | |
| Net income | | [removed: 9.6] [added: 10.3] | % | | [removed: 8.8] [added: 9.6] | % | | [removed: 7.9] [added: 8.8] | % |
| LTL revenue per intercity mile | | [added: $ |] 5.38 | | | [added: $] | 5.28 | | | [added: $] | 0.10 | | | [removed: |] 1.9 | |
Our 2014 financial results [removed: reflect] [added: reflected] strong increases in revenue, net income and earnings per diluted share.
Our revenue increased 19.3% to $2.79 billion and our operating ratio improved by 130 basis points to 84.2%, which [removed: represents] [added: represented] the fifth consecutive year that our operating ratio has improved by more than 100 basis points.
Our revenue growth [added: in 2014] was driven by a 16.9% increase in LTL tons combined with a 2.1% increase in revenue per hundredweight.
Our tonnage growth [removed: is] [added: was] primarily the result of market share gains from new and existing customers that desire the value of superior service at a fair [removed: and equitable] price.
As a result, our capital expenditures were $367.7 million in 2014 and [removed: we expect our capital expenditures to be] [added: were] even higher in 2015.
We believe these investments provided the additional capacity [added: needed] to meet [removed: existing] demand, and [removed: positions] [added: positioned] us well for anticipated future growth.
We believe the increase in revenue per hundredweight [removed: reflects] [added: reflected] our disciplined yield management process [removed: and,] [added: and] a favorable pricing environment that [removed: has] resulted from general capacity constraints in the LTL industry.
Most of our tariffs and contracts provide for a fuel surcharge that is generally indexed to the [removed: U. S.] [added: U.S.] Department of Energy's ("DOE") published diesel fuel prices that reset each week.
We regularly monitor the components of our pricing, including base freight rates and fuel [removed: surcharges.][added: surcharges, and our costs at the customer level.]
We [removed: also] address [removed: any] individual [removed: account] [added: customer] profitability issues [removed: with our customers as part of our effort] to minimize the negative impact on our profitability that would likely result from a rapid and significant change in any of our operating expenses.
Salaries, wages and benefits increased $210.5 million, or 18.0% in 2014 due to a $170.4 million increase in [removed: the costs for] salaries and wages and a $40.1 million increase in benefit costs.
The increases in salaries and wages, excluding benefits, [removed: are] [added: were] primarily due to the 13.5% increase in the average number of full-time employees over 2013 and the annual wage increases in 2013 and 2014.
The increase in employees primarily [removed: relates] [added: related] to our productive labor workforce, which was necessary to keep pace with our increased volumes during the year.
Our aggregate productive labor costs increased to 25.8% of revenue in 2014 as compared to 25.5% in [removed: 2013] [added: 2013,] while our other salaries and wages improved to 11.5% of revenue in 2014 as compared to 11.7% in 2013.
[removed: Our employee benefit costs also increased] [added: These increases were partially offset by a reduction in expense] for certain retirement benefit plans directly linked to the [removed: improvement in our net income and the] share price of our common stock.
Our total miles [added: driven] in 2014 increased 16.4% as compared to 2013, which [removed: compares] [added: compared] favorably to our diesel fuel consumption, which increased only 13.0% during the same period.
We continually upgrade our technological capabilities to improve our customer service and lower our operating costs.
Our technology provides our customers with visibility of their shipments throughout our network, increases the productivity of our workforce and provides key metrics that we use to monitor and enhance our processes.
2015 Compared to 2014
| | | 2015 | | | | 2014 | | | | Change | | | | % Change | |
| Revenue (in thousands) | | $ | 2,972,442 | | | $ | 2,787,897 | | | $ | 184,545 | | | 6.6 | |
| Operating ratio | | 83.2 | | % | | 84.2 | | % | | | | | | | |
| Net income (in thousands) | | $ | 304,690 | | | $ | 267,514 | | | $ | 37,176 | | | 13.9 | |
| Diluted earnings per share | | $ | 3.57 | | | $ | 3.10 | | | $ | 0.47 | | | 15.2 | |
| LTL tons (in thousands) | | 7,938 | | | | 7,391 | | | | 547 | | | | 7.4 | |
| LTL shipments (in thousands) | | 10,129 | | | | 9,073 | | | | 1,056 | | | | 11.6 | |
| LTL revenue per hundredweight | | $ | 18.23 | | | $ | 18.33 | | | $ | (0.10 | ) | | (0.5 | ) |
| LTL revenue per shipment | | $ | 285.67 | | | $ | 298.65 | | | $ | (12.98 | ) | | (4.3 | ) |
| LTL revenue per intercity mile | | 5.11 | | | | 5.38 | | | | (0.27 | | ) | | (5.0 | ) |
| LTL intercity miles (in thousands) | | 566,210 | | | | 503,923 | | | | 62,287 | | | | 12.4 | |
In 2015, we produced revenue growth of 6.6%, increased net income by 13.9% and increased diluted earnings per diluted share by 15.2%.
These results were achieved during a period of general softening in the domestic economic environment.
We believe our revenue growth was primarily driven by an increase in tonnage attributable to winning additional market share, as our new and existing customers increasingly respond to the value of our premium service.
Our tonnage growth resulted from an increase in shipments, which was partially offset by the decline in weight per shipment.
We believe our long-term strategy of providing industry-leading service continues to drive our market share growth, while also allowing us to remain committed to our disciplined yield management process.
Our tonnage growth during 2015 led to increased density within our freight movement operations and service center network.
The additional freight density and our focus on operational efficiency led to productivity improvements in both of our platform and P&D operations.
These improvements, when combined with our disciplined yield management process, generated a 100 basis-point improvement in our operating ratio in 2015, which represents the sixth consecutive year that our operating ratio has improved at least 100 basis points.
As a result, our net income and earnings per diluted share in 2015 were $304.7 million and $3.57, respectively.
Our revenue in 2015 increased $184.5 million, or 6.6% as compared to 2014.
We attribute the decline in weight per shipment in 2015 to softening economic conditions and changes in the mix of our freight.
LTL revenue per hundredweight decreased 0.5% to $18.23 in 2015, primarily due to declines in our fuel surcharges.
LTL revenue per hundredweight, excluding fuel surcharges, increased 5.7% in 2015 as compared to 2014, which includes the positive effect on this metric from a decrease in weight per shipment.
The increase in full-time employees was necessary to provide capacity for the increase in shipments during the year.
We also implemented certain operational initiatives that decreased our reliance on purchased transportation providers and increased our utilization of Company employees and equipment.
The additional freight density contributed to a slight improvement in our P&D and platform shipments per hour, which improved 1.1% and 1.8%, respectively from 2014.
Our aggregate productive labor costs increased to 27.9% of revenue in 2015 as compared to 25.8% in 2014, while our other salaries and wages increased to 11.9% of revenue in 2015 as compared to 11.5% in 2014.
In the fourth quarter of 2015 our group health costs increased and we anticipate this trend to continue into 2016.
Employee benefit costs in 2015 were 32.6% of salaries and wages as compared to 32.8% in 2014.
Our diesel fuel costs decreased primarily due to a 33.7% decrease in our average cost per gallon during 2015 as compared to the prior year.
This decrease was partially offset by an increase in fuel consumption of 9.1%, primarily due to an 11.6% increase in linehaul and P&D miles driven.
Our fuel consumption benefited from an overall improvement in miles per gallon, which continues to improve as we add newer, more fuel-efficient equipment to our operations.
The additional fuel consumption resulted in an increase in fuel taxes, which increased our operating taxes and licenses.
Depreciation and amortization expenses increased $18.9 million primarily due to the assets acquired through our 2015 and 2014 capital expenditures.
Purchased transportation expense decreased $13.0 million, or 10.1% in 2015 as compared to 2014.
We also utilized purchased transportation to perform limited P&D services in our LTL operations.
Our capital expenditure plan for 2015 is projected to be higher than 2014, which we expect will result in increased depreciation costs in future periods.
2013 Compared to 2012
| | | 2013 | | | | 2012 | | | | Change | | | | % Change | |
| Revenue (in thousands) | | $ | 2,337,648 | | | $ | 2,134,579 | | | $ | 203,069 | | | 9.5 | |
| Operating ratio | | 85.5 | | % | | 86.6 | | % | | | | | | | |
| Net income (in thousands) | | $ | 206,113 | | | $ | 169,452 | | | $ | 36,661 | | | 21.6 | |
| Diluted earnings per share | | $ | 2.39 | | | $ | 1.97 | | | $ | 0.42 | | | 21.3 | |
| LTL tons (in thousands) | | 6,325 | | | | 5,991 | | | | 334 | | | | 5.6 | |
| LTL shipments (in thousands) | | 7,942 | | | | 7,449 | | | | 493 | | | | 6.6 | |
| LTL revenue per hundredweight | | $ | 17.95 | | | $ | 17.30 | | | $ | 0.65 | | | 3.8 | |
| LTL revenue per shipment | | $ | 285.85 | | | $ | 278.36 | | | $ | 7.49 | | | 2.7 | |
| LTL revenue per intercity mile | | $ | 5.28 | | | $ | 5.12 | | | $ | 0.16 | | | 3.1 | |
| LTL intercity miles (in thousands) | | 429,709 | | | | 404,863 | | | | 24,846 | | | | 6.1 | |
Our financial results for 2013 reflected the continued execution and success of our long-term strategies.
We increased our revenue 9.5% in 2013 primarily through increased market share, as we continued to win share by providing a value proposition consisting of superior service at a fair and equitable price.
With a focus on yield management and operating efficiencies, we were able to improve our margins, which increased earnings per diluted share 21.3%.
As a result, our operating ratio improved 110 basis points to 85.5% in 2013.
Our revenue increased $203.1 million, or 9.5% during 2013, which was primarily a result of increases in both LTL tonnage and price.
Our tonnage growth in 2013 was primarily due to increased market share, as our growth exceeded both the growth rate of the U.S. economy as well as the growth rate for the LTL industry.
We believe that revenue per hundredweight is a good indicator of pricing trends; however, we manage our yield by focusing on individual customer profitability due to the influence of various factors on revenue per hundredweight, such as changes in fuel surcharges, weight per shipment, length of haul and mix of freight.
The impact of these factors can result in changes to revenue per hundredweight that do not necessarily indicate actual changes in underlying rates.
Most of our tariffs and contracts provide for a fuel surcharge, which is recorded as additional revenue, as diesel fuel prices increase above stated levels.
Of the total increase in salaries and wages, our direct labor costs for drivers, platform employees and fleet technicians increased $56.8 million, or 10.0% in 2013 as compared to 2012.
We primarily increased our headcount in 2013 due to our increased volume of shipments as well as to ensure sufficient labor capacity for future revenue growth.
We also hired additional drivers in the second half of 2013 to address inefficiencies that resulted from
changes to the FMCSA’s hours-of-service regulations.
Although our salaries and wages, excluding benefits, increased during 2013, these costs decreased as a percent of revenue to 37.2% from 37.4% in 2012 as a result of increased efficiencies within our operations.
Our platform pounds handled per hour, P&D stops per hour and P&D shipments per hour improved 1.0%, 0.7% and 0.5%, respectively, over the prior-year period.
Our group health and dental costs increased $14.5 million, or 14.7% in 2013 as compared to 2012, with the majority of the increase occurring in the second half of the year.
We experienced significant increases in both the number of claims and the average severity per claim during 2013.
We believe there will be additional costs associated with the ongoing implementation of the 2010 Patient Protection and Affordable Care Act, and consequently, we believe our group health and dental costs may continue to increase in future periods.
Employee benefit costs as a percent of salaries and wages increased to 34.6% for 2013 from 33.7% for 2012.
These costs as a percent of revenue improved to 16.5% of revenue in 2013 from 17.7% in 2012.
Much of this improvement was due to our diesel fuel consumption increasing only 3.5% as compared to the 6.3% increase in our intercity miles in 2013.
Our consumption trends have improved due to a focus on improving our average miles per gallon, which has benefited from certain operational initiatives and the increased use of new fuel-efficient equipment.
The average price per gallon of diesel fuel also decreased 2.3% as compared to 2012.
General supplies and expenses increased $10.9 million in 2013 primarily due to an overall increase in our marketing activities, which include costs to support our brand and services.
This increase was primarily due to additional depreciation recorded on the tractors and trailers purchased as part of our 2012 and 2013 capital expenditure plans.
Our capital expenditure plan for 2014 was higher than 2013, and we expect depreciation costs to increase in future periods as a result.
While our investments can increase costs in the short term, we believe these investments are necessary to support our long-term growth initiatives.
An excerpt. Shown here: 40 of 121 rewritten, 40 of 62 added and 40 of 66 removed. The counts are complete. For every sentence, read Item 7. MANAGEMENT’S DISCUSSION AND ANALYSIS OF FINANCIAL CONDITION AND RESULTS OF OPERATIONS in the FY2015 filing and the FY2014 filing.
Item 7A. QUANTITATIVE AND QUALITATIVE DISCLOSURES ABOUT MARKET RISK
7 rewritten, 0 added, 0 removed, 8 unchanged
We are exposed to interest rate risk directly related to loans, if any, under our [added: 2015] Credit Agreement, which have variable interest rates.
At December 31, [removed: 2014,] [added: 2015,] the cash value for variable life insurance contracts was [removed: $33.7] [added: $35.6] million of the [removed: $36.0] [added: $37.8] million of aggregate cash values for all life insurance contracts included on our Balance Sheets.
A 10% change in market value in those investments would have a [removed: $3.4] [added: $3.6] million impact on our pre-tax income.
At December 31, [removed: 2014,] [added: 2015,] the total liability for [added: unsettled] awards granted under our employee and director [removed: phantom stock]
[added: phantom stock] plans totaled [removed: $34.7] [added: $25.3] million.
A 10% change in the price of our common stock at December 31, [removed: 2014] [added: 2015] would have had a [removed: $3.5] [added: $2.5] million impact on our operating income in [removed: 2014] [added: 2015] with respect to these plans.
For further discussion related to these risks, see Notes 2 and 7 [added: of the Notes] to the Financial Statements included in Item 8, “Financial Statements and Supplementary Data” and Item 7, “Management’s Discussion and Analysis of Financial Condition and Results of Operations.”
Item 1. BUSINESS
62 rewritten, 20 added, 15 removed, 107 unchanged
We are a leading, less-than-truckload (“LTL”), union-free motor carrier providing regional, inter-regional and national LTL services, which include ground and air expedited transportation and consumer household pickup and [removed: delivery] [added: delivery,] through a single integrated organization.
We were the [removed: fifth] [added: fourth] largest LTL motor carrier in the United States, as measured by [removed: 2013] [added: 2014] revenue, according to Transport Topics.
In addition to our core LTL services, we offer a broad range of [added: other] value-added services [removed: including international freight forwarding,] [added: that include] container drayage, truckload brokerage, supply chain consulting and warehousing.
More than 95% of our revenue [removed: is] [added: has historically been] derived from transporting LTL shipments for our customers, whose demand for our services is generally tied to industrial production and the overall health of the U.S. domestic economy.
We have increased our revenue and customer base over the past five years [removed: primarily] through organic [added: market share] growth.
Our infrastructure allows us to provide next-day and second-day service [removed: within] [added: through] each of our six regions covering the continental United [removed: States, as well as inter-regional and national service between these regions.][added: States.]
[removed: To support our ongoing expansion, we] [added: We have] added [removed: 12 new] [added: 71] service centers [added: since December 31, 2005 (12 of which were added] during the past five [removed: years] [added: years)] for a total of [removed: 222] [added: 225] at December 31, [removed: 2014.][added: 2015.]
We believe [removed: our] [added: the] growth [added: in the demand for our services] can be attributed to our focus on meeting our customers’ [removed: complete] supply chain needs from a single point of contact while providing a superior level of customer service at a fair [removed: and equitable] price.
Our integrated structure allows us to offer our customers consistent high-quality service from origin to destination, and we believe our operating structure and proprietary information systems [removed: also] enable us to efficiently manage our operating costs.
According to the American Trucking Associations, total U.S. [removed: freight] transportation revenue in [removed: 2013] [added: 2014] was [removed: $840.0] [added: $872.1] billion, of which the trucking industry accounted for [removed: 81.2%.][added: 80.3%.]
The LTL sector had revenue in [removed: 2013] [added: 2014] of [removed: $54.4] [added: $56.7] billion, which represented 6.5% of total U.S. [removed: freight] transportation revenue.
Based on [removed: 2013] [added: 2014] revenue as reported in Transport Topics, the largest 10 and 25 LTL motor carriers accounted for approximately [removed: 47.3%] [added: 49%] and [removed: 57.8%,] [added: 60%,] respectively, of the total LTL market.
[removed: We compete with several large and diversified transportation service providers, each] [added: Some] of [removed: which] [added: our competitors] may have a broader global network and a wider range of services than we do.
[removed: Competition] [added: We believe competition in our industry] is based primarily on service, [removed: price] [added: price, available capacity] and business relationships.
We believe we are able to [removed: compete effectively in our markets] [added: gain market share] by [added: expanding our capacity and] providing high-quality [removed: and timely] service at a fair [removed: and equitable] price.
At December 31, [removed: 2014,] [added: 2015,] we operated [removed: through 222] [added: 225] service center locations, of which we owned [removed: 176] [added: 180] and leased [removed: 46.][added: 45.]
[removed: We operate a total of] [added: Our network includes] ten major breakbulk facilities located in Rialto, California; Atlanta, Georgia; [removed: Chicago, Illinois;] [added: Columbus, Ohio;] Indianapolis, Indiana; Greensboro, North Carolina; Harrisburg, Pennsylvania; Memphis and Morristown, Tennessee; Dallas, Texas; and Salt Lake City, Utah, while using various other service centers for additional limited breakbulk activity in order to serve our next-day markets.
Each night, our service centers load outbound freight for transport to [added: our] other service centers for [removed: delivery.][added: delivery the next business day.]
All inbound freight received by the service center in the evening or during the night is generally scheduled for local delivery the next [removed: business day, unless a]
[added: business day, unless a] customer requests a different delivery schedule.
Our management reviews the productivity and service performance of each service center on a daily basis to [removed: help] ensure quality service and efficient operations.
[removed: While] [added: Although] we have established primary responsibility for customer service at the local service center level, our customers may access information and initiate transactions through our centralized customer service department located at our corporate office or through [removed: several] other [removed: gateways, such as our website, mobile applications,] electronic [removed: data interchange (“EDI”), email and fax notification systems and automated voice response systems.][added: gateways.]
We utilize scheduled routes, and additional linehaul dispatches as [removed: necessary,] [added: necessary] to meet our published transit times.
In addition, we [removed: lower our cost structure by primarily using] [added: gain efficiency through the use of] twin 28-foot trailers in our linehaul operations.
At December 31, [removed: 2014,] [added: 2015,] we owned [removed: 6,907] [added: 7,688] tractors.
The table below reflects, as of December 31, [removed: 2014,] [added: 2015,] the average age of our tractors and trailers:
The table below sets forth our capital expenditures for tractors and trailers for the years ended December 31, [removed: 2014, 2013] [added: 2015, 2014] and [removed: 2012.][added: 2013.]
| (In thousands) | | [removed: 2014] [added: 2015] | | | | [removed: 2013] [added: 2014] | | | | [removed: 2012] [added: 2013] | | |
| Tractors | | $ | [removed: 91,750] [added: 128,911] | | | $ | [removed: 59,317] [added: 91,750] | | | $ | [removed: 113,257] [added: 59,317] | |
| Trailers | | [removed: 80,853] [added: 114,209] | | | | [removed: 70,042] [added: 80,853] | | | | [removed: 83,405] [added: 70,042] | | |
| Total | | $ | [removed: 172,603] [added: 243,120] | | | $ | [removed: 129,359] [added: 172,603] | | | $ | [removed: 196,662] [added: 129,359] | |
At December 31, [removed: 2014,] [added: 2015,] we operated 38 maintenance centers at [removed: certain] [added: strategic] service center locations throughout our network.
Trailers are [added: also] scheduled for [added: preventative] maintenance every 90 days.
In [removed: 2014,] [added: 2015,] our largest customer accounted for approximately [removed: 2.6%] [added: 3.0%] of our revenue and our largest 5, 10 and 20 customers accounted for approximately [removed: 9.7%, 14.8%] [added: 9.2%, 14.0%] and [removed: 21.5%] [added: 20.4%] of our revenue, respectively.
For each of the previous three years, more than 95% of our revenue was derived from [removed: transporting LTL shipments for our customers] [added: services performed in the United States] and less than 5% of our revenue was generated from international [removed: services.][added: services performed.]
[removed: Our operating] [added: Operating] margins in the first [removed: quarter] [added: and fourth quarters] are [removed: normally] [added: typically] lower [added: than those during the second and third quarters] due to reduced [removed: demand] [added: shipments] during the winter months.
We [removed: continually seek to upgrade and enhance our technological capabilities, and we] [added: also] provide access to our systems through multiple gateways that offer our customers and employees maximum flexibility and immediate access to information.
Our data systems are integrated in every level within our organization, which we believe is [added: also] critical to our [removed: success and performance.][added: success.]
Our systems are protected through physical and software safeguards, as well as redundant systems, network security measures and backup [removed: systems considered appropriate by management.][added: systems.]
At December 31, [removed: 2014,] [added: 2015,] the amounts of our SIR and/or deductibles were as follows: $2.75 million per occurrence for bodily injury and property damage (“BIPD”) claims, $100,000 per claim for cargo loss and damage, $1.0 million per occurrence for workers’ compensation claims and [removed: $400,000] [added: $500,000] per occurrence (with a $400,000 aggregate over our retention level) for group health claims.
Our investments over the last five years have allowed us to focus on expansion within our service center network, which has led to increased density throughout our operations.
The transportation and logistics industry is intensely competitive and highly fragmented.
We believe the combination of these factors provide us with a distinct advantage over most of our competitors.
| Tractors | | 7,688 | | | 4.8 | |
| Linehaul trailers | | 21,540 | | | 5.6 | |
| P&D trailers | | 8,664 | | | 10.3 | |
Our tonnage levels and revenue mix are subject to seasonal trends common in our industry, although other factors, such as macroeconomic changes, could cause variation in these trends.
Harsh winter weather or natural disasters, such as hurricanes, tornadoes and floods, can also adversely impact our performance by reducing demand and increasing operating expenses.
We believe seasonal trends will continue to impact our business.
Our technology is critical to the success and delivery of the premium service provided by our operations.
We continually seek to upgrade and enhance our technological capabilities.
| Drivers | | 9,480 | |
| Platform | | 3,224 | |
| Total | | 17,931 | |
provision.
The DOT completed the field study within the mandated September 30, 2015 deadline and submitted its findings to the Office of the Inspector General for review.
Results and conclusions from this study have not been submitted to Congress or released publicly; therefore, certain aspects of the restart provisions remain temporarily suspended.
On December 16, 2015, the FMCSA issued final rules to mandate the use of electronic logging devices (“ELDs”) to automatically record driving time for hours of service reporting.
Generally, carriers must comply with these new requirements by December 18, 2017.
We currently utilize ELDs in all of our Company-owned vehicles and do not believe this new requirement will have a significant impact on our operations.
We believe this provides us with a distinct advantage over most of our regional, multi-regional and national competition.
At December 31, 2014, we owned 27,259 trailers.
We primarily purchase new trailers for our operations; however, we occasionally purchase pre-owned equipment that meets our specifications.
The purchase of pre-owned equipment can provide an excellent value but also can increase our fleet’s average age.
| Tractors | | 6,907 | | | 4.9 | |
| Linehaul trailers | | 19,556 | | | 5.8 | |
| P&D trailers | | 7,703 | | | 11.8 | |
Our operations are subject to seasonal trends common in the trucking industry.
Harsh weather can also adversely affect our performance by reducing demand and reducing our ability to transport freight, which could result in decreased revenue and increased operating expenses.
| Drivers | | 8,733 | |
| Platform | | 2,859 | |
| Total | | 16,443 | |
We are subject to regulation by many federal governmental agencies, including the Federal Motor Carrier Safety Administration (the “FMCSA”), the Pipeline and Hazardous Materials Safety Administration and the Surface Transportation Board, which are agencies within the DOT.
eight hours.
As a result, we could continue to incur higher operating costs than we had before the 2011 rule went into effect.
An excerpt. Shown here: 40 of 62 rewritten, all 20 added and all 15 removed. The counts are complete. For every sentence, read Item 1. BUSINESS in the FY2015 filing and the FY2014 filing.
Item 3. LEGAL PROCEEDINGS
1 rewritten, 0 added, 0 removed, 2 unchanged
[removed: Our management does] [added: We do] not believe that [added: the resolution of any of] these [removed: actions, when finally concluded and determined,] [added: legal proceedings or claims] will have a material adverse effect upon our financial position, [removed: liquidity or] results of [removed: operations.][added: operations or cash flows.]
Cover and table of contents
30 rewritten, 4 added, 4 removed, 88 unchanged
10-K 1 [removed: a201410-k.htm] [added: a201510-k.htm] FORM 10-K
For the fiscal year ended December 31, [removed: 2014][added: 2015]
[removed: ][added: ]
The aggregate market value of voting stock held by non-affiliates of the registrant as of June 30, [removed: 2014] [added: 2015] was [removed: $4,085,227,825,] [added: $4,365,601,240,] based on the closing sales price as reported on the NASDAQ Global Select Market.
As of February [removed: 25, 2015,] [added: 26, 2016,] the registrant had [removed: 85,925,587] [added: 83,818,609] outstanding shares of Common Stock ($0.10 par value).
Certain portions of the Company’s Proxy Statement for the [removed: 2015] [added: 2016] Annual Meeting of Shareholders are incorporated by reference into Part III of this report.
| [Forward-Looking [removed: Information](#sF00AF1E82F737A350644AD1E227E6DBE)] [added: Information](#s15B978607855512BA8E9125D4F0EA7F3)] | | [removed: [1](#sF00AF1E82F737A350644AD1E227E6DBE)] [added: [1](#s15B978607855512BA8E9125D4F0EA7F3)] |
| Item 1 | [removed: [Business](#s167835DDB4A0A4577A8BAD1E203B83FB)] [added: [Business](#s48A42E0B061158BF8C1FDD81E3F281A8)] | [removed: [1](#s167835DDB4A0A4577A8BAD1E203B83FB)] [added: [1](#s48A42E0B061158BF8C1FDD81E3F281A8)] |
| Item 1A | [Risk [removed: Factors](#s29CF4AC1FE7D2ECB08F6AD1E22F448A2)] [added: Factors](#s89F31469AFA9545D95895CA5188C82C0)] | [removed: [6](#s29CF4AC1FE7D2ECB08F6AD1E22F448A2)] [added: [6](#s89F31469AFA9545D95895CA5188C82C0)] |
| Item 1B | [Unresolved Staff [removed: Comments](#sCEC58CC4DA4F56F26DA3AD1E2326FEAD)] [added: Comments](#s13451BE9447051FFB48623EB4472C014)] | [removed: [15](#sCEC58CC4DA4F56F26DA3AD1E2326FEAD)] [added: [15](#s13451BE9447051FFB48623EB4472C014)] |
| Item 2 | [removed: [Properties](#s06247B42C266DE9D4273AD1E2346AA4D)] [added: [Properties](#sF317C14A01135B778D6B4E4B63CEE6E3)] | [removed: [16](#s06247B42C266DE9D4273AD1E2346AA4D)] [added: [15](#sF317C14A01135B778D6B4E4B63CEE6E3)] |
| Item 3 | [Legal [removed: Proceedings](#sC704C346B54CA9EAABDBAD1E2378FA90)] [added: Proceedings](#s8703C023F2E15139A9186BE62DBC65B2)] | [removed: [16](#sC704C346B54CA9EAABDBAD1E2378FA90)] [added: [15](#s8703C023F2E15139A9186BE62DBC65B2)] |
| Item 4 | [Mine Safety [removed: Disclosures](#s2BB7A6906B27102A3026AD1E239B3E9E)] [added: Disclosures](#sBCF8219C77F2520B9778118BC55D1BDC)] | [removed: [16](#s2BB7A6906B27102A3026AD1E239B3E9E)] [added: [15](#sBCF8219C77F2520B9778118BC55D1BDC)] |
| Item 5 | [Market for Registrant’s Common Equity, Related Stockholder Matters and Issuer Purchases of Equity [removed: Securities](#s83BFEEAD4A619A662301AD1E209CB0A2)] [added: Securities](#s5C617A1FDD7B5A06AC5DA8230AC6494A)] | [removed: [17](#s83BFEEAD4A619A662301AD1E209CB0A2)] [added: [16](#s5C617A1FDD7B5A06AC5DA8230AC6494A)] |
| Item 6 | [Selected Financial [removed: Data](#sA606F05C0F45B7FA477DAD1E200C40F9)] [added: Data](#s3D4CAB8A8BD25F97B2283D30B4040420)] | [removed: [19](#sA606F05C0F45B7FA477DAD1E200C40F9)] [added: [18](#s3D4CAB8A8BD25F97B2283D30B4040420)] |
| Item 7 | [Management’s Discussion and Analysis of Financial Condition and Results of [removed: Operations](#s14BD83BD2E2E89281BDBAD1E200AB5B7)] [added: Operations](#s34F7A5DDCC795A08BD3C64730EF2C0F6)] | [removed: [20](#s14BD83BD2E2E89281BDBAD1E200AB5B7)] [added: [19](#s34F7A5DDCC795A08BD3C64730EF2C0F6)] |
| Item 7A | [Quantitative and Qualitative Disclosures about Market [removed: Risk](#s86416FD4B5C2BAAA2D19AD1E24BCE069)] [added: Risk](#s26834A274DA45650A38B72774AAE1D30)] | [removed: [30](#s86416FD4B5C2BAAA2D19AD1E24BCE069)] [added: [29](#s26834A274DA45650A38B72774AAE1D30)] |
| Item 8 | [Financial Statements and Supplementary [removed: Data](#sE245BEE280FF9027F900AD1E24BCA367)] [added: Data](#s8195C8628B00516FAAFA09C977712BB3)] | [removed: [31](#sE245BEE280FF9027F900AD1E24BCA367)] [added: [31](#s8195C8628B00516FAAFA09C977712BB3)] |
| Item 9 | [Changes in and Disagreements With Accountants on Accounting and Financial [removed: Disclosure](#sD3216F36DBF291A755F3AD1E28595206)] [added: Disclosure](#s5999BDF9A42259CD87177D0B08CAA476)] | [removed: [46](#sD3216F36DBF291A755F3AD1E28595206)] [added: [47](#s5999BDF9A42259CD87177D0B08CAA476)] |
| Item 9A | [Controls and [removed: Procedures](#s682132019B6F945B3A0FAD1E287D498D)] [added: Procedures](#s3ECCA61F864F58F084EAC350D2521FCF)] | [removed: [46](#s682132019B6F945B3A0FAD1E287D498D)] [added: [47](#s3ECCA61F864F58F084EAC350D2521FCF)] |
| Item 9B | [Other [removed: Information](#s42EEA85E9B7016493A8BAD1E28AEF5CC)] [added: Information](#s77F664D99BC65F679D08FBD06021C028)] | [removed: [48](#s42EEA85E9B7016493A8BAD1E28AEF5CC)] [added: [49](#s77F664D99BC65F679D08FBD06021C028)] |
| [Part [removed: III](#s1E81F270E6C6A47B2097AD1E28D09EAA)] [added: III](#sB5FD36FFFC525DEDA24086A2014D20FB)] | | [removed: [48](#s1E81F270E6C6A47B2097AD1E28D09EAA)] [added: [49](#sB5FD36FFFC525DEDA24086A2014D20FB)] |
| Item 10 | [Directors, Executive Officers and Corporate [removed: Governance](#s05A19F7FB7DF1CF2AD85AD1E2901BA35)] [added: Governance](#s4E1386809DFF5E0891D562F42C935CAB)] | [removed: [48](#s05A19F7FB7DF1CF2AD85AD1E2901BA35)] [added: [49](#s4E1386809DFF5E0891D562F42C935CAB)] |
| Item 11 | [Executive [removed: Compensation](#s244086B9B285E23FF8C5AD1E29230F6D)] [added: Compensation](#s0A41D0E0644B526C9C49B793577C5FAE)] | [removed: [48](#s244086B9B285E23FF8C5AD1E29230F6D)] [added: [49](#s0A41D0E0644B526C9C49B793577C5FAE)] |
| Item 12 | [Security Ownership of Certain Beneficial Owners and Management and Related Stockholder [removed: Matters](#s39B742B2CF17B3786A3EAD1E2954FB29)] [added: Matters](#s1DA161800CF8544BB0444D687B71703D)] | [removed: [48](#s39B742B2CF17B3786A3EAD1E2954FB29)] [added: [49](#s1DA161800CF8544BB0444D687B71703D)] |
| Item 13 | [Certain Relationships and Related Transactions, and Director [removed: Independence](#s9EADDB0CCE42ED23D128AD1E2977612F)] [added: Independence](#s94B590E73D1F56BFA7CDCD0E120155BF)] | [removed: [48](#s9EADDB0CCE42ED23D128AD1E2977612F)] [added: [49](#s94B590E73D1F56BFA7CDCD0E120155BF)] |
| Item 14 | [Principal Accounting Fees and [removed: Services](#s72A325C4EF7C45368959AD1E29A842DD)] [added: Services](#s950C2F7009D0570CBF9D8EFDC620CF35)] | [removed: [48](#s72A325C4EF7C45368959AD1E29A842DD)] [added: [49](#s950C2F7009D0570CBF9D8EFDC620CF35)] |
| Item 15 | [Exhibits, Financial Statement [removed: Schedules](#sF8B524B4508CBB4EC4D3AD1E1F11EF1C)] [added: Schedules](#sAE2E88695B91523791034BA1DC8F06DC)] | [removed: [49](#sF8B524B4508CBB4EC4D3AD1E1F11EF1C)] [added: [50](#sAE2E88695B91523791034BA1DC8F06DC)] |
| [Exhibit [removed: Index](#s4F41E5E0BDA8C6AB704FAD1E2A4D5DAE)] [added: Index](#s60E08A45BDE5560DAD3C504AA4D4CBA9)] | | [removed: [51](#s4F41E5E0BDA8C6AB704FAD1E2A4D5DAE)] [added: [52](#s60E08A45BDE5560DAD3C504AA4D4CBA9)] |
These forward-looking statements include, but are not limited to, statements relating to our goals, strategies, expectations, competitive environment, [removed: regulation,] [added: regulations,] availability of resources, future events and future financial performance.
| [Part I](#sBF3107CBB7C256B39C27C5FB0E08E71D) | | [1](#sBF3107CBB7C256B39C27C5FB0E08E71D) |
| [Part II](#sFB0B8765ABD55ECBA557356513EDC521) | | [16](#sFB0B8765ABD55ECBA557356513EDC521) |
| [Part IV](#s7AC4FF7CDE4B5EB2B21F023DB36E4CD9) | | [50](#s7AC4FF7CDE4B5EB2B21F023DB36E4CD9) |
| [Signatures](#sBE8E720D9CE55C7EAA4710484770BF56) | | [51](#sBE8E720D9CE55C7EAA4710484770BF56) |
| [Part I](#s68B3C2521A8A9769C7CFAD1E22A17D05) | | [1](#s68B3C2521A8A9769C7CFAD1E22A17D05) |
| [Part II](#s15951A77C84E4252BD2FAD1E23CB3C29) | | [17](#s15951A77C84E4252BD2FAD1E23CB3C29) |
| [Part IV](#s6BEC963CD2089B9166F9AD1E29C9AF57) | | [49](#s6BEC963CD2089B9166F9AD1E29C9AF57) |
| [Signatures](#sA3D48A196AEF68D90ABCAD1E2A1D09E2) | | [50](#sA3D48A196AEF68D90ABCAD1E2A1D09E2) |
Item 2. PROPERTIES
9 rewritten, 1 added, 2 removed, 15 unchanged
We own our principal executive office located in Thomasville, North Carolina, consisting of a two-story office building of approximately [removed: 165,000] [added: 168,000] square feet on 31.8 acres of land.
At December 31, [removed: 2014,] [added: 2015,] we operated [removed: 222] [added: 225] service centers, of which [removed: 176] [added: 180] were owned and [removed: 46] [added: 45] were leased.
Our [added: owned] service centers [removed: that are owned] include most of our larger facilities and account for approximately 90% of the total door capacity in our network.
[removed: Each] [added: We own each] of our major breakbulk facilities [removed: is] listed below [removed: with] [added: and have provided] the number of doors as of December 31, [removed: 2014.][added: 2015.]
| Salt Lake City, Utah | | [removed: 150] [added: 181] |
Our [removed: 222] [added: 225] facilities are strategically dispersed over the states in which we operate.
At December 31, [removed: 2014,] [added: 2015,] the terms of our leased properties ranged from month-to-month to a lease that expires in 2039.
We also own [removed: 12] [added: eight] non-operating service center properties.
[removed: Eight] [added: Three] of these properties are leased to third parties with lease terms that range from month-to-month to a lease that expires in [removed: 2019.][added: 2036.]
| Columbus, Ohio | | 211 |
With the exception of our Chicago, Illinois facility, we own our major breakbulk facilities.
| Chicago, Illinois | | 134 |
Item 5. MARKET FOR REGISTRANT’S COMMON EQUITY, RELATED STOCKHOLDER MATTERS AND ISSUER PURCHASES OF EQUITY SECURITIES
7 rewritten, 11 added, 17 removed, 31 unchanged
At February 23, [removed: 2015,] [added: 2016,] there were [removed: 50,983] [added: 37,871] holders of our common stock, including [removed: 116] [added: 121] shareholders of record.
We did not pay any dividends on our common stock during fiscal year [removed: 2014] [added: 2015] or [removed: 2013,] [added: 2014,] and we have no current plans to declare or pay any dividends on our common stock during fiscal year [removed: 2015.][added: 2016.]
The following table provides information regarding our repurchases of our common stock during the fourth quarter of [removed: 2014.][added: 2015.]
On November 10, 2014, we announced that our Board of Directors [added: had] approved a stock repurchase program authorizing us to repurchase up to an aggregate of $200.0 million of our outstanding common stock.
The following graph compares the total shareholder cumulative returns, assuming the reinvestment of all dividends, of $100 invested on December 31, [removed: 2009,] [added: 2010,] in (i) our common stock, (ii) the [removed: NASDAQ Industrial Transportation Index, (iii) the] S&P 500 Total Return Index, [removed: (iv)] [added: and (iii)] the NASDAQ [removed: Trucking &] [added: Industrial] Transportation [removed: Stocks and (v) The NASDAQ Stock Market (US)] [added: Index,] for the five-year period ended December 31, [removed: 2014.][added: 2015.]
[removed: 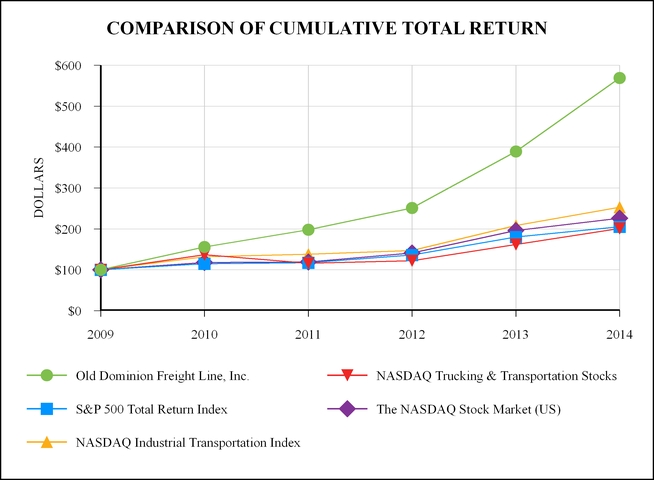][added: ]
| NASDAQ Industrial Transportation Index | | $ | 100 | | | $ | [removed: 132] [added: 104] | | | $ | [removed: 138] [added: 111] | | | $ | [removed: 147] [added: 158] | | | $ | [removed: 208] [added: 191] | | | $ | [removed: 253] [added: 147] | |
Our senior unsecured credit agreement includes a provision limiting our ability to make restricted payments, including dividends and payments for share repurchases, unless, among other conditions, no defaults or events of default under the credit agreement are ongoing (or would be caused by such restricted payment).
| | | 2015 | | | | | | | | | | | | | | |
| High | | $ | 80.96 | | | $ | 76.98 | | | $ | 74.86 | | | $ | 65.78 | |
| Low | | $ | 69.50 | | | $ | 67.25 | | | $ | 60.40 | | | $ | 56.80 | |
| October 1-31, 2015 | | 302,758 | | | $ | 62.67 | | | 302,758 | | | $ | 96,378,316 | |
| November 1-30, 2015 | | 252,677 | | | $ | 63.43 | | | 252,677 | | | $ | 80,350,794 | |
| December 1-31, 2015 | | — | | | $ | — | | | — | | | $ | 80,350,794 | |
| Total | | 555,435 | | | $ | 63.01 | | | 555,435 | | | | | |
| | | 12/31/10 | | | | 12/31/11 | | | | 12/31/12 | | | | 12/31/13 | | | | 12/31/14 | | | | 12/31/15 | | |
| Old Dominion Freight Line, Inc. | | $ | 100 | | | $ | 127 | | | $ | 161 | | | $ | 249 | | | $ | 364 | | | $ | 277 | |
| S&P 500 Total Return Index | | $ | 100 | | | $ | 102 | | | $ | 118 | | | $ | 157 | | | $ | 178 | | | $ | 181 | |
For information concerning restrictions on our ability to make dividend payments, see Liquidity and Capital Resources in Item 7, “Management’s Discussion and Analysis of Financial Condition and Results of Operations” and Note 2 in Item 8, “Financial Statements and Supplementary Data” of this report.
| | | 2013 | | | | | | | | | | | | | | |
| High | | $ | 38.76 | | | $ | 44.00 | | | $ | 47.66 | | | $ | 53.34 | |
| Low | | $ | 34.58 | | | $ | 35.17 | | | $ | 41.93 | | | $ | 45.15 | |
| October 1-31, 2014 | | — | | | $ | — | | | — | | | $ | — | |
| November 1-30, 2014 | | — | | | $ | — | | | — | | | $ | — | |
| December 1-31, 2014 | | 70,620 | | | $ | 78.34 | | | 70,620 | | | $ | 194,467,625 | |
| Total | | 70,620 | | | $ | 78.34 | | | 70,620 | | | | | |
As a result of a change in the total return data made available to us through our vendor provider, our performance graphs going forward will use a comparable index provided by NASDAQ OMX Global Indexes.
We have included the NASDAQ Trucking & Transportation Stocks and The NASDAQ Stock Market (US) for comparative purposes, however, these indices will be replaced with the NASDAQ Industrial Transportation Index and the S&P 500 Total Return Index going forward.
| | | 12/31/09 | | | | 12/31/10 | | | | 12/31/11 | | | | 12/31/12 | | | | 12/31/13 | | | | 12/31/14 | | |
| Old Dominion Freight Line, Inc. | | $ | 100 | | | $ | 156 | | | $ | 198 | | | $ | 251 | | | $ | 389 | | | $ | 569 | |
| New Indices: | | | | | | | | | | | | | | | | | | | | | | | | |
| S&P 500 Total Return Index | | $ | 100 | | | $ | 115 | | | $ | 117 | | | $ | 136 | | | $ | 180 | | | $ | 205 | |
| Former Indices: | | | | | | | | | | | | | | | | | | | | | | | | |
| NASDAQ Trucking & Transportation Stocks | | $ | 100 | | | $ | 137 | | | $ | 116 | | | $ | 122 | | | $ | 162 | | | $ | 201 | |
| The NASDAQ Stock Market (US) | | $ | 100 | | | $ | 118 | | | $ | 119 | | | $ | 141 | | | $ | 196 | | | $ | 226 | |
Item 6. SELECTED FINANCIAL DATA
13 rewritten, 5 added, 2 removed, 14 unchanged
| | | [removed: 2014] [added: 2015] | | | | [removed: 2013] [added: 2014] | | | | [removed: 2012] [added: 2013] | | | | [removed: 2011] [added: 2012] | | | | [removed: 2010] [added: 2011] | | |
| Revenue from operations | | $ | [removed: 2,787,897] [added: 2,972,442] | | | $ | [removed: 2,337,648] [added: 2,787,897] | | | $ | [removed: 2,134,579] [added: 2,337,648] | | | $ | [removed: 1,903,800] [added: 2,134,579] | | | $ | [removed: 1,501,848] [added: 1,903,800] | |
| Depreciation and amortization expense | | [removed: 146,466] [added: 165,343] | | | | [removed: 127,072] [added: 146,466] | | | | [removed: 110,743] [added: 127,072] | | | | [removed: 90,820] [added: 110,743] | | | | [removed: 80,362] [added: 90,820] | | |
| Total operating expenses | | [removed: 2,346,590] [added: 2,474,202] | | | | [removed: 1,999,210] [added: 2,346,590] | | | | [removed: 1,849,325] [added: 1,999,210] | | | | [removed: 1,669,728] [added: 1,849,325] | | | | [removed: 1,364,109] [added: 1,669,728] | | |
| Operating income | | [removed: 441,307] [added: 498,240] | | | | [removed: 338,438] [added: 441,307] | | | | [removed: 285,254] [added: 338,438] | | | | [removed: 234,072] [added: 285,254] | | | | [removed: 137,739] [added: 234,072] | | |
| Interest expense, net (1) | | [removed: 6,502] [added: 5,001] | | | | [removed: 9,473] [added: 6,502] | | | | [removed: 11,428] [added: 9,473] | | | | [removed: 13,887] [added: 11,428] | | | | [removed: 12,465] [added: 13,887] | | |
| Provision for income taxes | | [removed: 165,000] [added: 185,327] | | | | [removed: 122,573] [added: 165,000] | | | | [removed: 103,646] [added: 122,573] | | | | [removed: 80,614] [added: 103,646] | | | | [removed: 48,775] [added: 80,614] | | |
| Net income | | [removed: 267,514] [added: 304,690] | | | | [removed: 206,113] [added: 267,514] | | | | [removed: 169,452] [added: 206,113] | | | | [removed: 139,470] [added: 169,452] | | | | [removed: 75,651] [added: 139,470] | | |
| Diluted earnings per share | | $ | [removed: 3.10] [added: 3.57] | | | $ | [removed: 2.39] [added: 3.10] | | | $ | [removed: 1.97] [added: 2.39] | | | $ | [removed: 1.63] [added: 1.97] | | | $ | [removed: 0.90] [added: 1.63] | |
| Cash and cash equivalents | | $ | [removed: 34,787] [added: 11,472] | | | $ | [removed: 30,174] [added: 34,787] | | | $ | [removed: 12,857] [added: 30,174] | | | $ | [removed: 75,850] [added: 12,857] | | | $ | [removed: 5,450] [added: 75,850] | |
| Current liabilities | | [removed: 255,638] [added: 285,402] | | | | [removed: 232,122] [added: 255,638] | | | | [removed: 225,139] [added: 232,122] | | | | [removed: 204,810] [added: 225,139] | | | | [removed: 170,046] [added: 204,810] | | |
| Long-term debt (including current maturities) | | [removed: 155,714] [added: 133,805] | | | | [removed: 191,429] [added: 155,714] | | | | [removed: 240,407] [added: 191,429] | | | | [removed: 269,185] [added: 240,407] | | | | [removed: 271,217] [added: 269,185] | | |
| Shareholders’ equity | | [removed: 1,494,064] [added: 1,684,637] | | | | [removed: 1,232,082] [added: 1,494,064] | | | | [removed: 1,025,969] [added: 1,232,082] | | | | [removed: 856,519] [added: 1,025,969] | | | | [removed: 668,649] [added: 856,519] | | |
| Current assets (2) | | 381,730 | | | | 403,772 | | | | 309,730 | | | | 254,974 | | | | 312,386 | | |
| Total assets (2) | | 2,466,504 | | | | 2,206,866 | | | | 1,908,840 | | | | 1,692,460 | | | | 1,493,608 | | |
| | |
| --- | --- |
| (2) | Prior-year balance sheets have been adjusted to reflect the adoption of Accounting Standards Update ("ASU") 2015-17 in order to conform to the current period presentation. For additional information regarding ASU 2015-17, please refer to "Recent Accounting Pronouncements" included in Note 1 of Item 8, "Financial Statements and Supplementary Data" in this report. |
| Current assets | | 433,143 | | | | 332,979 | | | | 275,028 | | | | 331,852 | | | | 222,582 | | |
| Total assets | | 2,236,237 | | | | 1,932,089 | | | | 1,712,514 | | | | 1,513,074 | | | | 1,239,881 | | |
Item 8. FINANCIAL STATEMENTS AND SUPPLEMENTARY DATA
187 rewritten, 78 added, 60 removed, 321 unchanged
| (In thousands, except share and per share data) | | [added: 2015 | | | |] 2014 | | | | 2013 | | |
| Cash and cash equivalents | | $ | [removed: 34,787] [added: 11,472] | | | $ | [removed: 30,174] [added: 34,787] | |
| Customer receivables, less allowances of [removed: $9,069] [added: $8,976] and [removed: $8,067,] [added: $9,069,] respectively | | [removed: 303,170] [added: 310,501] | | | | [removed: 248,069] [added: 303,170] | | |
| Other receivables | | [removed: 44,730] [added: 34,547] | | | | [removed: 10,225] [added: 44,730] | | |
| Prepaid expenses and other current assets | | [removed: 21,085] [added: 25,210] | | | | [removed: 21,262] [added: 21,085] | | |
| Revenue equipment | | [removed: 1,158,108] [added: 1,358,317] | | | | [removed: 1,009,936] [added: 1,158,108] | | |
| Land and structures | | [removed: 1,088,372] [added: 1,221,250] | | | | [removed: 990,256] [added: 1,088,372] | | |
| Other fixed assets | | [removed: 321,310] [added: 365,673] | | | | [removed: 266,563] [added: 321,310] | | |
| Leasehold improvements | | [removed: 6,982] [added: 7,585] | | | | [removed: 6,378] [added: 6,982] | | |
| Total property and equipment | | [removed: 2,574,772] [added: 2,952,825] | | | | [removed: 2,273,133] [added: 2,574,772] | | |
| Less: Accumulated depreciation | | [removed: (831,527] [added: (929,377] | | ) | | [removed: (730,074] [added: (831,527] | | ) |
| Net property and equipment | | [removed: 1,743,245] [added: 2,023,448] | | | | [removed: 1,543,059] [added: 1,743,245] | | |
| Other assets | | [removed: 40,386] [added: 41,863] | | | | [removed: 36,588] [added: 40,386] | | |
| Accounts payable | | $ | [removed: 45,314] [added: 66,774] | | | $ | [removed: 36,788] [added: 45,314] | |
| Compensation and benefits | | [removed: 106,200] [added: 124,589] | | | | [removed: 97,187] [added: 106,200] | | |
| Claims and insurance accruals | | [removed: 42,271] [added: 44,917] | | | | [removed: 38,784] [added: 42,271] | | |
| Other accrued liabilities | | [removed: 26,139] [added: 22,634] | | | | [removed: 21,480] [added: 26,139] | | |
| Current maturities of long-term debt | | [removed: 35,714] [added: 26,488] | | | | [removed: 35,715] [added: 35,714] | | |
| Total current liabilities | | [removed: 255,638] [added: 285,402] | | | | [removed: 232,122] [added: 255,638] | | |
| Long-term debt | | [removed: 120,000] [added: 107,317] | | | | [removed: 155,714] [added: 120,000] | | |
| Other non-current liabilities | | [removed: 145,752] [added: 154,094] | | | | [removed: 123,054] [added: 145,752] | | |
| Common stock - $0.10 par value, 140,000,000 shares authorized, [removed: 86,094,297] [added: 84,411,878] and [removed: 86,164,917] [added: 86,094,297] shares outstanding at December 31, [removed: 2014] [added: 2015] and [removed: 2013,] [added: 2014,] respectively | | [removed: 8,609] [added: 8,441] | | | | [removed: 8,616] [added: 8,609] | | |
| Retained earnings | | [removed: 1,351,054] [added: 1,541,795] | | | | [removed: 1,089,065] [added: 1,351,054] | | |
| Total shareholders’ equity | | [removed: 1,494,064] [added: 1,684,637] | | | | [removed: 1,232,082] [added: 1,494,064] | | |
| (In thousands, except share and per share data) | | [removed: 2014 | | | | 2013] [added: 2015] | | | | [removed: 2012] [added: 2014] | | |
| Revenue from operations | | $ | [removed: 2,787,897] [added: 2,972,442] | | | $ | [removed: 2,337,648] [added: 2,787,897] | | | $ | [removed: 2,134,579] [added: 2,337,648] | |
| Salaries, wages and benefits | | [removed: 1,381,277] [added: 1,569,791] | | | | [removed: 1,170,773] [added: 1,381,277] | | | | [removed: 1,066,551] [added: 1,170,773] | | |
| Operating supplies and expenses | | [removed: 432,675] [added: 353,889] | | | | [removed: 385,201] [added: 432,675] | | | | [removed: 378,534] [added: 385,201] | | |
| General supplies and expenses | | [removed: 83,165] [added: 89,308] | | | | [removed: 69,765] [added: 83,165] | | | | [removed: 58,908] [added: 69,765] | | |
| Operating taxes and licenses | | [removed: 83,417] [added: 93,292] | | | | [removed: 71,599] [added: 83,417] | | | | [removed: 67,526] [added: 71,599] | | |
| Insurance and claims | | [removed: 36,145] [added: 37,368] | | | | [removed: 30,910] [added: 36,145] | | | | [removed: 29,681] [added: 30,910] | | |
| Communications and utilities | | [removed: 25,507] [added: 26,913] | | | | [removed: 23,142] [added: 25,507] | | | | [removed: 19,980] [added: 23,142] | | |
| Depreciation and amortization | | [removed: 146,466] [added: 165,343] | | | | [removed: 127,072] [added: 146,466] | | | | [removed: 110,743] [added: 127,072] | | |
| Purchased transportation | | [removed: 129,312] [added: 116,300] | | | | [removed: 106,435] [added: 129,312] | | | | [removed: 94,522] [added: 106,435] | | |
| Building and office equipment rents | | [removed: 10,679] [added: 9,620] | | | | [removed: 11,920] [added: 10,679] | | | | [removed: 13,514] [added: 11,920] | | |
| Miscellaneous expenses, net | | [removed: 17,947] [added: 12,378] | | | | [removed: 2,393] [added: 17,947] | | | | [removed: 9,366] [added: 2,393] | | |
| Total operating expenses | | [removed: 2,346,590] [added: 2,474,202] | | | | [removed: 1,999,210] [added: 2,346,590] | | | | [removed: 1,849,325] [added: 1,999,210] | | |
| Operating income | | [removed: 441,307] [added: 498,240] | | | | [removed: 338,438] [added: 441,307] | | | | [removed: 285,254] [added: 338,438] | | |
| Interest expense | | [removed: 6,610] [added: 5,210] | | | | [removed: 9,620] [added: 6,610] | | | | [removed: 11,541] [added: 9,620] | | |
| Interest income | | [removed: (108] [added: (209] | | ) | | [removed: (147] [added: (108] | | ) | | [removed: (113] [added: (147] | | ) |
| Total current assets | | 381,730 | | | | 403,772 | | |
| Total assets | | $ | 2,466,504 | | | $ | 2,206,866 | |
| Deferred income taxes | | 235,054 | | | | 191,412 | | |
| Total long-term liabilities | | 496,465 | | | | 457,164 | | |
| Total liabilities | | 781,867 | | | | 712,802 | | |
| Total liabilities and shareholders’ equity | | $ | 2,466,504 | | | $ | 2,206,866 | |
| Net income | | — | | | — | | | | — | | | | 304,690 | | | | 304,690 | | |
| Share repurchases | | (1,682 | ) | | (168 | | ) | | — | | | | (113,949 | | ) | | (114,117 | | ) |
| Balance as of December 31, 2015 | | 84,412 | | | $ | 8,441 | | | $ | 134,401 | | | $ | 1,541,795 | | | $ | 1,684,637 | |
| Net income | | $ | 304,690 | | | $ | 267,514 | | | $ | 206,113 | |
| Depreciation and amortization | | 165,343 | | | | 146,466 | | | | 127,072 | | |
More than 97% of our revenue is derived from these services.
Certain amounts in prior years have been reclassified to conform prior years’ financial statements to the current presentation.
In August 2015, the FASB issued ASU 2015-14, "Revenue from Contracts with Customers", which deferred the effective date for ASU 2014-09 by one year to fiscal years beginning after December 15, 2017, while providing the option to early adopt for fiscal years beginning after December 15, 2016.
Transition methods under ASU 2014-09 must be through either (i) retrospective application to each prior reporting periods presented, or (ii) retrospective application with a cumulative effect adjustment at the date of initial application.
In April 2015, the FASB issued ASU 2015-05, "Customer's Accounting for Fees Paid in a Cloud Computing Arrangement" (Topic 350).
This ASU provides additional guidance to customers about whether a cloud computing arrangement includes a software license.
Under ASU 2015-05, if a cloud computing arrangement contains a software license, customers should account for the license element of the arrangement in a manner consistent with the acquisition of other software licenses.
If the arrangement does not contain a software license, customers should account for the arrangement as a service contract.
The Company will adopt the provisions of ASU 2015-05 in the first quarter of fiscal 2016, and is currently evaluating the impact on our financial position, results of operations or cash flows.
In April 2015, the FASB issued ASU 2015-03, "Interest - Imputation of Interest: Simplifying the Presentation of Debt Issuance Costs" (Topic 835-30).
This ASU requires debt issuance costs related to a recognized debt liability be presented in the balance sheet as a direct deduction from the related debt's carrying value, which is consistent with the presentation of debt discounts.
This ASU is effective for financial statements issued for fiscal years beginning after December 15, 2015.
In November 2015, the FASB issued ASU 2015-17, "Balance Sheet Classification of Deferred Taxes" (Topic 740).
This ASU requires that deferred tax assets and liabilities be classified as noncurrent on the balance sheet rather than being separated into current and noncurrent.
We early adopted this ASU on a retrospective basis during the fourth quarter of 2015.
Accordingly, deferred income tax assets in the amount of $29.4 million that were formerly classified as current assets at December 31, 2014, have been reclassified to non-current deferred income tax liabilities in our balance sheet.
In February 2016, the FASB issued ASU 2016-02, “Leases” (Topic 842).
This ASU requires a lessee to recognize a right-of-use asset and a lease liability under most operating leases in its balance sheet.
| (In thousands) | | 2015 | | | | 2014 | | |
| Capitalized lease obligations | | 1,488 | | | | — | | |
We had two outstanding unsecured senior note agreements with an aggregate amount outstanding of $120.0 million at December 31, 2015.
On December 15, 2015, we entered into an amended and restated credit agreement with Wells Fargo Bank, National Association ("Wells Fargo") serving as administrative agent for the lenders (the "2015 Credit Agreement").
The 2015 Credit Agreement provides for a five-year, $250.0 million senior unsecured revolving line of credit.
At our option, borrowings under the 2015 Credit Agreement bear interest at either: (i) LIBOR plus an applicable margin (based on our ratio of debt-to-total capitalization) that ranges from 1.0% to 1.50%; or (ii) a Base Rate plus an applicable margin (based on our ratio of debt-to-total capitalization) that ranges from 0.0% to 0.5%.
For the periods covered under the 2015 Credit Agreement, the applicable margin and letter of credit fees were 1.0% and commitment fees were 0.125%.
For periods in 2015 and 2014 under the 2011 Credit Agreement, the applicable margin and letter of credit fees were 1.0%, and commitment fees were 0.175%.
The 2015 Credit Agreement includes a provision limiting our ability to make restricted payments, including dividends and payments for share repurchases, unless, among other conditions, no defaults or events of default under the 2015 Credit Agreement are ongoing (or would be caused by such restricted payment).
Our share repurchases are described above in “Stock Repurchase Program.”
We were in compliance with all covenants in our outstanding debt instruments for the period ended December 31, 2015.
| | | | | | | | | |
| --- | --- | --- | --- | --- | --- | --- | --- | --- |
| | | December 31, | | | | | | |
| Deferred income taxes | | 29,371 | | | | 23,249 | | |
| Total current assets | | 433,143 | | | | 332,979 | | |
| Total assets | | $ | 2,236,237 | | | $ | 1,932,089 | |
| Income taxes payable | | — | | | | 2,168 | | |
| Deferred income taxes | | 220,783 | | | | 189,117 | | |
| Total long-term liabilities | | 486,535 | | | | 467,885 | | |
| Total liabilities | | 742,173 | | | | 700,007 | | |
| Total liabilities and shareholders’ equity | | $ | 2,236,237 | | | $ | 1,932,089 | |
| Balance as of December 31, 2011 | | 86,165 | | | $ | 8,616 | | | $ | 134,403 | | | $ | 713,500 | | | $ | 856,519 | |
| Net income | | — | | | — | | | | — | | | | 169,452 | | | | 169,452 | | |
| Other | | — | | | — | | | | (2 | | ) | | — | | | | (2 | | ) |
| Proceeds from issuance of long-term debt | | — | | | | — | | | | 412 | | |
| Other financing activities, net | | — | | | | — | | | | (2 | | ) |
In June 2014, the FASB issued ASU 2014-12, Compensation—Stock Compensation: Accounting for Share-Based Payments When the Terms of an Award Provide That a Performance Target Could Be Achieved after the Requisite Service Period.
This ASU requires that a performance target, which affects vesting and could be achieved after the requisite service period, be treated as a performance condition under the existing guidance in ASC Topic 718.
In August 2014, the FASB issued ASU 2014-15, Presentation of Financial Statements—Going Concern: Disclosure of Uncertainties About and Entity’s Ability to Continue as a Going Concern.
The core principle within this ASU provides guidance around management's responsibility to evaluate whether there is substantial doubt about an entity's ability to continue as a going concern and to provide related footnote disclosures.
This ASU is effective for annual and interim periods beginning after December 15, 2016.
At our option, revolving loans under the facility bear interest at either: (a) the Applicable Margin Percentage for
Base Rate Loans plus the higher of Wells Fargo’s prime rate, the federal funds rate plus 0.5% per annum, or the one month LIBOR Rate plus 1.0% per annum; (b) the LIBOR Rate plus the Applicable Margin Percentage for LIBOR Loans; or (c) the LIBOR Market Index Rate (“LIBOR Index Rate”) plus the Applicable Margin Percentage for LIBOR Market Index Loans.
The Applicable Margin Percentage is determined by a pricing grid in the Credit Agreement and ranges from 1.0% to 1.875% based upon the ratio of debt to total capitalization.
The Applicable Margin Percentage remained at 1.0% during 2014 and ranged from 1.0% to 1.125% during 2013.
The commitment fees were 0.175% during 2014 and ranged from 0.175% to 0.2% during 2013.
Letter of credit fees were 1.0% during 2014 and ranged from 1.0% to 1.125% during 2013.
In addition, the Company will pay to Wells Fargo as issuer of letters of credit (i) a facing fee with respect to each letter of credit in an amount equal to 0.125% of the daily average aggregate Stated Amount thereof, payable quarterly in arrears and calculated on an actual/360-day basis and (ii) such fees and charges customarily charged in connection with the issuance and administration of such letters of credit.
Our Credit Agreement limits the amount of restricted payments, including dividends and/or share repurchases, to (i) $40.0 million during the same fiscal quarter or (ii) $200.0 million in the aggregate after November 7, 2014.
During the fourth quarter of 2014 we repurchased $5.5 million of our common stock, which represents the full amount repurchased under the program in 2014.
| | | | |
| 2015 | $ | 35,714 | |
| 2016 | 25,000 | | |
| | $ | 155,714 | |
| | | | | | |
| --- | --- | --- | --- | --- | --- |
| 2015 | | $ | 13,956 | | |
| 2016 | | 10,438 | | | |
| 2017 | | 7,522 | | | |
| 2018 | | 5,411 | | | |
An excerpt. Shown here: 40 of 187 rewritten, 40 of 78 added and 40 of 60 removed. The counts are complete. For every sentence, read Item 8. FINANCIAL STATEMENTS AND SUPPLEMENTARY DATA in the FY2015 filing and the FY2014 filing.
Item 9A. CONTROLS AND PROCEDURES
7 rewritten, 1 added, 1 removed, 37 unchanged
As of the end of the period covered by this report, our management has conducted an evaluation, with the participation of our Chief Executive Officer (“CEO”) and Chief Financial Officer (“CFO”), of the effectiveness of our disclosure controls and procedures in accordance with Rule 13a-15 under the [removed: Securities] Exchange [removed: Act of 1934, as amended (the “Exchange Act”).][added: Act.]
Management has conducted an evaluation, with the participation of our CEO and CFO, of the effectiveness of our internal control over financial reporting as of December 31, [removed: 2014] [added: 2015] based on the framework in Internal Control – Integrated Framework issued by the Committee of Sponsoring Organizations of the Treadway Commission [removed: (2013 framework).][added: (the "2013 Framework").]
Management concluded that our internal control over financial reporting was effective as of December 31, [removed: 2014,] [added: 2015,] based on our evaluation under the [removed: framework in Internal Control – Integrated] [added: 2013] Framework.
The effectiveness of our internal control over financial reporting as of December 31, [removed: 2014] [added: 2015] has been audited by Ernst & Young LLP, an independent registered public accounting firm, as stated in their report which is included herein.
We have audited Old Dominion Freight Line, Inc.’s internal control over financial reporting as of December 31, [removed: 2014,] [added: 2015,] based on criteria established in Internal Control-Integrated Framework issued by the Committee of Sponsoring Organizations of the Treadway Commission (2013 framework) (the COSO criteria).
In our opinion, Old Dominion Freight Line, Inc. maintained, in all material respects, effective internal control over financial reporting as of December 31, [removed: 2014,] [added: 2015,] based on the COSO criteria.
We also have audited, in accordance with the standards of the Public Company Accounting Oversight Board (United States), the balance sheets of Old Dominion Freight Line, Inc. as of December 31, [removed: 2014] [added: 2015] and [removed: 2013,] [added: 2014,] and the related statements of operations, changes in shareholders’ equity, and cash flows for each of the three years in the period ended December 31, [removed: 2014] [added: 2015] and our report dated February [removed: 26, 2015] [added: 29, 2016] expressed an unqualified opinion thereon.
February 29, 2016
February 26, 2015
Item 10. DIRECTORS, EXECUTIVE OFFICERS AND CORPORATE GOVERNANCE
2 rewritten, 0 added, 0 removed, 2 unchanged
The information required by Item 10 of Form 10-K will appear in the Company’s proxy statement for its [removed: 2015] [added: 2016] Annual Meeting of Shareholders under the captions “Proposal 1 – Election of Directors,” “Executive Officers,” “Section 16(a) Beneficial Ownership Reporting Compliance,” “Corporate Governance – Attendance and Committees of the Board – Audit Committee,” and “Corporate Governance – Director Nominations,” and the information therein is incorporated herein by reference.
Our Code of Business Conduct is publicly available and is posted on our website at [removed: www.odfl.com/company/corpGovernance.shtml.][added: http://www.odfl.com/Content/corpGovernance.faces.]
Item 11. EXECUTIVE COMPENSATION
1 rewritten, 0 added, 0 removed, 0 unchanged
The information required by Item 11 of Form 10-K will appear in the Company’s proxy statement for its [removed: 2015] [added: 2016] Annual Meeting of Shareholders under the captions “Corporate Governance – Compensation Committee Interlocks and Insider Participation,” “Compensation Discussion and Analysis,” “Compensation Committee Report,” “Executive Compensation,” and “Director Compensation,” and the information therein is incorporated herein by reference.
Item 12. SECURITY OWNERSHIP OF CERTAIN BENEFICIAL OWNERS AND MANAGEMENT AND RELATED STOCKHOLDER MATTERS
1 rewritten, 0 added, 0 removed, 0 unchanged
The information required by Item 12 of Form 10-K will appear in the Company’s proxy statement for its [removed: 2015] [added: 2016] Annual Meeting of Shareholders under the caption “Security Ownership of Management and Certain Beneficial Owners,” and the information therein is incorporated herein by reference.
Item 13. CERTAIN RELATIONSHIPS AND RELATED TRANSACTIONS, AND DIRECTOR INDEPENDENCE
1 rewritten, 0 added, 0 removed, 0 unchanged
The information required by Item 13 of Form 10-K will appear in the Company’s proxy statement for the [removed: 2015] [added: 2016] Annual Meeting of Shareholders under the captions “Corporate Governance – Independent Directors” and “Related Person Transactions,” and the information therein is incorporated herein by reference.
Item 14. PRINCIPAL ACCOUNTING FEES AND SERVICES
1 rewritten, 0 added, 0 removed, 1 unchanged
The information required by Item 14 of Form 10-K will appear in the Company’s proxy statement for its [removed: 2015] [added: 2016] Annual Meeting of Shareholders under the captions “Corporate Governance – Audit Committee Pre-Approval Policies and Procedures” and “Independent Registered Public Accounting Firm Fees and Services,” and the information therein is incorporated herein by reference.
Item 15. EXHIBITS, FINANCIAL STATEMENT SCHEDULES
25 rewritten, 5 added, 4 removed, 168 unchanged
Balance Sheets – December 31, [removed: 2014] [added: 2015] and December 31, [removed: 2013][added: 2014]
Statements of Operations – Years ended December 31, [removed: 2014,] [added: 2015,] December 31, [removed: 2013] [added: 2014] and December 31, [removed: 2012][added: 2013]
Statements of Changes in Shareholders’ Equity – Years ended December 31, [removed: 2014,] [added: 2015,] December 31, [removed: 2013] [added: 2014] and December 31, [removed: 2012][added: 2013]
Statements of Cash Flows – Years ended December 31, [removed: 2014,] [added: 2015,] December 31, [removed: 2013] [added: 2014] and December 31, [removed: 2012][added: 2013]
| Dated: | February [removed: 26, 2015] [added: 29, 2016] | | | | By: | | /s/ DAVID S. CONGDON |
| [removed: | | | | |] [added: David S. Congdon] | | [removed: President] and Chief Executive Officer | [added: | |]
| /s/ EARL E. CONGDON | | Executive Chairman of the Board of Directors | | February [removed: 26, 2015] [added: 29, 2016] |
| [removed: David S. Congdon] | | (Principal Executive Officer) | | |
| /s/ J. PAUL BREITBACH | | Director | | February [removed: 26, 2015] [added: 29, 2016] |
| /s/ JOHN R. CONGDON, JR. | | Director | | February [removed: 26, 2015] [added: 29, 2016] |
| /s/ ROBERT G. CULP, III | | Director | | February [removed: 26, 2015] [added: 29, 2016] |
| /s/ JOHN D. KASARDA | | Director | | February [removed: 26, 2015] [added: 29, 2016] |
| /s/ LEO H. SUGGS | | Director | | February [removed: 26, 2015] [added: 29, 2016] |
| /s/ D. MICHAEL WRAY | | Director | | February [removed: 26, 2015] [added: 29, 2016] |
| /s/ [removed: J. WES FRYE] [added: ADAM N. SATTERFIELD] | | Senior Vice President – [removed: Finance] [added: Finance,] | | February [removed: 26, 2015] [added: 29, 2016] |
| [removed: J. Wes Frye] [added: Adam N. Satterfield] | | [removed: and] Chief Financial Officer [added: and Assistant Secretary] | | |
| /s/ JOHN P. BOOKER III | | Vice President – Controller | | February [removed: 26, 2015] [added: 29, 2016] |
FOR YEAR ENDED DECEMBER 31, [removed: 2014][added: 2015]
| [removed: 4.6.10] [added: 10.19.10*] | | [removed: Note Purchase Agreement among] [added: 2015 Declaration of Amendment to the] Old Dominion Freight Line, Inc. [removed: and the Purchasers set forth in Schedule A thereto, dated as of February 25, 2005] [added: Phantom Stock Plan] (Incorporated by reference to the exhibit of the same number contained in the Company’s [removed: Annual] [added: Quarterly] Report on Form [removed: 10-K] [added: 10-Q] for the [removed: year] [added: quarter] ended [removed: December] [added: March] 31, [removed: 2004,] [added: 2015,] filed on [removed: March 16, 2005)] [added: May 7, 2015)] |
| [removed: 10.17.6*] [added: 10.17.19*] | | [added: First Amendment to Second] Amended and Restated Employment Agreement [removed: Between] [added: by and between] Old Dominion Freight Line, Inc. and Earl E. Congdon, effective as of [removed: June] [added: November] 1, [removed: 2008] [added: 2015] (Incorporated by reference to the exhibit of the same number contained in the Company’s Current Report on Form [removed: 8-K,] [added: 8-K] filed on [removed: June 3, 2008)] [added: July 27, 2015)] |
| [removed: 10.17.10*] [added: 10.17.20*] | | First Amendment to [removed: Amended and Restated Employment Agreement, effective as of May 31, 2010, by and between] [added: the] Old Dominion Freight Line, Inc. [removed: and Earl E. Congdon] [added: 2012 Phantom Stock Plan] (Incorporated by reference to the exhibit of the same number contained in the Company’s [removed: Current] [added: Quarterly] Report on Form [removed: 8-K] [added: 10-Q for the quarter ended March 31, 2015,] filed on May [removed: 28, 2010)] [added: 7, 2015)] |
| [removed: 10.17.12*] [added: 4.13] | | [removed: Second Amendment to] Amended and Restated [removed: Employment Agreement, effective] [added: Credit Agreement among Wells Fargo Bank, National Association,] as [removed: of May 31, 2012, by] [added: Administrative Agent; the Lenders named therein;] and [removed: between] Old Dominion Freight Line, [removed: Inc. and Earl E. Congdon] [added: Inc., dated December 15, 2015] (Incorporated by reference to the exhibit of the same number contained in the Company’s Current Report on Form 8-K filed on [removed: February 6, 2012)] [added: December 21, 2015)] |
| [removed: 10.18.3*] [added: 10.19.9*] | | [added: 2014 Declaration of Second Amendment to] Old Dominion Freight Line, Inc. Director Phantom Stock [removed: Plan] [added: Plan, effective as of August 7, 2014] (Incorporated by reference to the exhibit of the same number contained in the Company’s Quarterly Report on Form 10-Q for the quarter ended [removed: June] [added: September] 30, [removed: 2008,] [added: 2014,] filed on [removed: August 8, 2008)] [added: November 5, 2014)] |
| [removed: 10.18.6*] [added: 10.20.4*] | | [removed: Non-Executive Director] [added: Third Amendment to the 2006 Nonqualified Deferred] Compensation [removed: Structure, effective January 1, 2011 (Incorporated] [added: Plan of Old Dominion Freight Line, Inc.(Incorporated] by reference to the exhibit of the same number contained in the Company’s Quarterly Report on Form 10-Q for the quarter ended March 31, [removed: 2011,] [added: 2015,] filed on May [removed: 9, 2011)] [added: 7, 2015)] |
| 101 | | The following financial information from our Annual Report on Form 10-K for the year ended December 31, [removed: 2014,] [added: 2015,] filed on February [removed: 26, 2015,] [added: 29, 2016,] formatted in XBRL (eXtensible Business Reporting Language) includes: (i) the Balance Sheets at December 31, [removed: 2014] [added: 2015] and December 31, [removed: 2013,] [added: 2014,] (ii) the Statements of Operations for the years ended December 31, [removed: 2014,] [added: 2015,] December 31, [removed: 2013] [added: 2014] and December 31, [removed: 2012,] [added: 2013,] (iii) the Statements of Changes in Shareholders’ Equity for the years ended December 31, [removed: 2014,] [added: 2015,] December 31, [removed: 2013] [added: 2014] and December 31, [removed: 2012,] [added: 2013,] (iv) the Statements of Cash Flows for the years ended December 31, [removed: 2014,] [added: 2015,] December 31, [removed: 2013] [added: 2014] and December 31, [removed: 2012,] [added: 2013,] and (v) the Notes to the Financial Statements |
| 2015 | | $ | 5,564 | | | $ | 1,511 | | | $ | 2,622 | | | $ | 4,453 | |
| | | | | | | | Vice Chairman of the Board of Directors and Chief Executive Officer |
| /s/ DAVID S. CONGDON | | Vice Chairman of the Board of Directors | | February 29, 2016 |
| 10.18.10* | | Old Dominion Freight Line, Inc. Non-Executive Director Compensation Structure, effective January 1, 2016 |
| 10.19.11* | | 2016 Declaration of Amendment to Old Dominion Freight Line, Inc. Director Phantom Stock Plan, effective as of February 25, 2016 |
| 2012 | | $ | 7,277 | | | $ | 2,123 | | | $ | 2,118 | | | $ | 7,282 | |
| /s/ DAVID S. CONGDON | | Director, President and Chief Executive Officer | | February 26, 2015 |
| | | |
| 10.19.9* | | 2014 Declaration of Second Amendment to Old Dominion Freight Line, Inc. Phantom Stock Plan, effective as of August 7, 2014 (Incorporated by reference to the exhibit of the same number contained in the Company’s Quarterly Report on Form 10-Q for the quarter ended September 30, 2014, filed on November 5, 2014) |