 filings.tools
Old Dominion Freight Line (ODFL) 10-K risk factor changes: FY2018 vs FY2017
The 2018-12-31 10-K against the 2017-12-31 one, compared heading by heading and sentence by sentence. One of these filings carries no fiscal year tag, so its year is the calendar year of the period end.
Item 1A68 rewritten71 added6 removed166 unchanged
All filing items595 rewritten266 added246 removed995 unchanged
Summary
counted, not written
- Item 1A headings could not be compared: only 0 carried over between the two years, which usually means one filing was read wrongly, so none is reported as new or removed.
- Sentence by sentence, 266 added, 246 removed, 595 rewritten and 995 unchanged across 18 items that differ.
Sentences by item
22 items, with every count and a link to each item that changed
Underlined words on a shaded ground are new in FY2018; struck-through words were in FY2017. Sentences that are wholly new or wholly gone are labelled rather than marked.
Item 1A. RISK FACTORS
68 rewritten, 71 added, 6 removed, 166 unchanged
| [added: |] • | we compete with other transportation service providers of varying sizes, some of which may have more equipment, a broader global network, a wider range of services, [added: more fully developed information technology systems,] greater capital resources or other competitive advantages; |
| [added: |] • | some of our competitors may reduce their prices to gain business, especially during times of reduced growth rates in the economy, which may limit our ability to maintain or increase prices or maintain revenue; |
| [added: |] • | we may be unable to continue to collect fuel surcharges or our fuel surcharge program may become ineffective in mitigating the impact of the fluctuating costs of fuel and other petroleum-based products; |
| [added: |] • | many customers reduce the number of carriers they use by selecting “core carriers” as approved transportation service providers and we may not be selected; |
| [added: |] • | many customers periodically accept bids from multiple carriers for their shipping needs, and this process may depress prices or result in the loss of some business to competitors; |
| [added: |] • | some shippers may choose to acquire their own trucking fleet or may choose to increase the volume of freight they transport if they have an existing trucking fleet; |
| [added: |] • | some customers may choose to consolidate certain LTL shipments through a different mode of transportation, such as truckload, intermodal or rail; |
| [added: |] • | our customers may manage their inventory levels more closely to a “just-in-time” basis, which may increase our costs and adversely affect our ability to meet our customers’ needs; |
| [added: |] • | consolidation in the ground transportation industry may create other large carriers with greater financial resources and other competitive advantages relating to their size; |
| [added: |] • | advances in technology require increased investments to remain competitive, and our customers may not be willing to accept higher prices to cover the cost of these investments; |
| [added: |] • | competition from non-asset-based logistics and freight brokerage companies may adversely affect our customer relationships and ability to maintain sufficient pricing; and |
| [added: |] • | our competitors may adopt emerging or additional technologies that improve their operating effectiveness, which could negatively affect our ability to remain competitive. |
Furthermore, continued merger and acquisition activity in transportation and logistics could result in stronger or new competitors, which could have a material adverse effect on our business, financial [added: condition and results of operations.]
| [added: |] • | restrictive work rules could hamper our efforts to improve and sustain operating efficiency; |
| [added: |] • | restrictive work rules could impair our service reputation and limit our ability to provide next-day services; |
| [added: |] • | a strike or work stoppage could negatively impact our profitability and could damage customer and employee relationships; |
| [added: |] • | shippers may limit their use of unionized trucking companies because of the threat of strikes and other work stoppages; and |
| [added: |] • | an election and bargaining process could divert management’s time and attention from our overall objectives and impose significant expenses. |
| [added: |] • | shortages of suitable real estate may limit our growth and could cause congestion in our service center network, which could result in increased operating expenses; |
| [added: |] • | growth may strain our management, capital resources, information systems and customer service; |
| [added: |] • | hiring new employees may increase training costs and may result in temporary inefficiencies until those employees become proficient in their jobs; [removed: and] |
| [added: |] • | expanding our service offerings may require us to enter into new markets and encounter new competitive challenges. |
| [added: |] • | we may not achieve anticipated levels of revenue, efficiency, cash flows and profitability; |
| [added: |] • | we may experience difficulties managing businesses that are outside our historical core competency and markets; |
| [added: |] • | we may underestimate the resources required to support acquisitions, which could disrupt our ongoing business and distract our management; |
| [added: |] • | we may incur unanticipated costs to our infrastructure to support new business lines or separate legal entities; |
| [added: |] • | we may be required to temporarily match existing customer pricing in the acquiree’s markets, which may be lower than the rates that we would typically charge for our services; |
| [added: |] • | liabilities we assume could be greater than our original estimates or may not be disclosed to us at the time of acquisition; |
| [added: |] • | we may incur additional indebtedness or we may issue additional equity to finance future acquisitions, which could be dilutive to our shareholders; |
| [added: |] • | potential loss of key employees and customers of the acquired company; and |
| [added: |] • | an inability to recognize projected cost savings and economies of scale. |
Our customers’ and suppliers’ businesses may be impacted by various economic factors such as recessions, downturns in the economy, global uncertainty and instability, changes in U.S. social, political, and regulatory conditions and/or a disruption of financial markets, which may decrease demand for our [removed: services.][added: services or increase our costs.]
Additionally, uncertainty and instability in the global economy and any other action that the U.S. government may take to withdraw from or materially modify [added: international trade arrangements, including related to] the [added: United States-Mexico-Canada Agreement, which was agreed upon on September 30, 2018 and is designed to replace the] North American Free Trade [removed: Agreement and certain other international trade arrangements,] [added: Agreement,] may lead to fewer goods being transported and could have a material adverse effect on our business, financial conditions and results of operations.
Customers [added: adversely impacted by changes in U.S. trade policies or otherwise] encountering adverse economic conditions may be unable to obtain additional [removed: financing,] [added: financing] or financing under acceptable [removed: terms, due to disruptions in the capital and credit markets.][added: terms.]
Economic conditions resulting in bankruptcies of one or more of our large customers could have a significant impact on our financial position, results of operations or liquidity in a particular year or [removed: quarter.]
Due in part to the time commitment, physical requirements, our stringent hiring [added: standards and current industry conditions, the available pool of qualified employee drivers has been declining.]
We are regulated by the DOT and by various state [added: and federal] agencies.
We are also subject to the costs and potential adverse impact of compliance associated with [removed: addressing interoperability between electronic AOBRDs and ELDs in accordance with] FMCSA’s ELD regulations and guidance, [removed: which includes] [added: including the transition of] our [removed: existing waiver] [added: fleet] and [removed: pending exemption request.][added: safety management systems from our legacy electronic AOBRDs to a new ELD hardware and software platform.]
Regulatory [removed: requirements,] [added: requirements] and changes in regulatory requirements or guidance, [added: together with the growing compliance risks presented by increased differences between applicable federal and state regulations,] may affect our business or the economics of the industry by requiring changes in operating practices that could influence the demand for and increase the costs of providing transportation services.
Diesel fuel prices and fuel availability can be impacted by factors beyond our control, such as natural or man-made disasters, adverse weather conditions, political events, disruption or failure of technology or information systems, price and supply decisions by oil producing countries and cartels, terrorist activities, armed [removed: conflict and] [added: conflict,] world supply and demand [removed: imbalances.][added: imbalances, tariffs, sanctions, and quotas or other changes to trade agreements.]
| --- | --- | --- |
| --- | --- | --- |
| --- | --- | --- |
| --- | --- | --- |
| --- | --- | --- |
| --- | --- | --- |
| --- | --- | --- |
| | • | some customers may perceive our environmental, social and governance (“ESG”) profile to be less robust than that of our competitors, which could influence the selection of their carrier; |
| --- | --- | --- |
| --- | --- | --- |
| --- | --- | --- |
| --- | --- | --- |
| --- | --- | --- |
| --- | --- | --- |
| --- | --- | --- |
| --- | --- | --- |
| --- | --- | --- |
| --- | --- | --- |
| --- | --- | --- |
| --- | --- | --- |
| --- | --- | --- |
| --- | --- | --- |
| | • | we may find it more difficult to maintain our corporate culture, which we believe has been a key contributor to our success; and |
| --- | --- | --- |
| --- | --- | --- |
| --- | --- | --- |
| --- | --- | --- |
| --- | --- | --- |
| --- | --- | --- |
| --- | --- | --- |
| --- | --- | --- |
| --- | --- | --- |
| --- | --- | --- |
| --- | --- | --- |
The U.S. government has made significant changes in U.S. trade policy and has taken certain other actions that may impact U.S. trade, including imposing tariffs on certain goods imported into the United States.
To date, several governments, including the European Union, China, and India, have imposed tariffs on certain goods imported from the United States.
Any further changes in U.S. or international trade policy could trigger additional retaliatory actions by affected countries, resulting in “trade wars” and increased costs for goods transported globally, which may reduce customer demand for these products if the parties having to pay those tariffs increase their prices, or in trading partners limiting their trade with countries that impose anti-trade measures.
If these consequences are realized, the volume of global economic activity may be significantly reduced.
Such a reduction could have a material adverse effect on our business, results of operations and financial condition.
quarter.
| | |
| --- | --- |
condition and results of operations.
standards and current industry conditions, the available pool of qualified employee drivers has been declining.
increased cost of diesel fuel and other petroleum-based products.
This unfavorable publicity could also require the need to allocate significant resources to the rebuilding of our reputation.
An excerpt. Shown here: 40 of 68 rewritten, 40 of 71 added and all 6 removed. The counts are complete. For every sentence, read Item 1A. RISK FACTORS in the FY2018 filing and the FY2017 filing.
Item 7. MANAGEMENT’S DISCUSSION AND ANALYSIS OF FINANCIAL CONDITION AND RESULTS OF OPERATIONS
122 rewritten, 60 added, 68 removed, 147 unchanged
We are a leading, less-than-truckload (“LTL”), union-free motor carrier providing regional, inter-regional and national LTL [removed: services, which include ground and air expedited transportation and consumer household pickup and delivery,] [added: services] through a single integrated organization.
In addition to our core LTL services, we offer a range of value-added services including container drayage, truckload [removed: brokerage,] [added: brokerage and] supply chain [removed: consulting and warehousing.][added: consulting.]
| [added: |] • | LTL Revenue Per Hundredweight - This measurement reflects the application of our pricing policies to the services we provide, which are influenced by competitive market conditions and our growth objectives. Generally, freight is rated by a class system, which is established by the National Motor Freight Traffic Association, Inc. Light, bulky freight typically has a higher class and is priced at higher revenue per hundredweight than dense, heavy freight. Fuel surcharges, accessorial charges, revenue adjustments and revenue for undelivered freight are included in this measurement. Revenue for undelivered freight is deferred for financial statement purposes in accordance with our revenue recognition policy; however, we believe including it in our revenue per hundredweight metrics results in a better indicator of changes in this metric by matching total billed revenue with the corresponding weight of those shipments. |
| [added: |] • | LTL Weight Per Shipment - Fluctuations in weight per shipment can indicate changes in the mix of freight we receive from our customers, as well as changes in the number of units included in a shipment. Generally, increases in weight per shipment indicate higher demand for our [removed: customers'] [added: customers’] products and overall increased economic activity. Changes in weight per shipment can also be influenced by shifts between LTL and other modes of transportation, such as truckload and intermodal, in response to capacity, service and pricing issues. Fluctuations in weight per shipment generally have an inverse effect on our revenue per hundredweight, as a decrease in weight per shipment will typically cause an increase in revenue per hundredweight. |
| [added: |] • | Average Length of Haul - We consider lengths of haul less than 500 miles to be regional traffic, lengths of haul between 500 miles and 1,000 miles to be inter-regional traffic, and lengths of haul in excess of 1,000 miles to be national traffic. This metric is used to analyze our tonnage and pricing trends for shipments with similar characteristics, and also allows for comparison with other transportation providers serving specific markets. By analyzing this metric, we can determine the success and growth potential of our service products in these markets. Changes in length of haul generally have a direct effect on our revenue per hundredweight, as an increase in length of haul will typically cause an increase in revenue per hundredweight. |
Increases in density allow us to maximize our asset utilization and labor productivity, which we measure over many different functional areas of our operations including linehaul load factor, [removed: pickup and delivery (“P&D”)] [added: P&D] stops per hour, P&D shipments per hour, platform pounds handled per hour and platform shipments per hour.
[added: We gauge our overall] success in managing costs by monitoring our operating ratio, a measure of profitability calculated by dividing total operating expenses by revenue, which also allows for industry-wide comparisons with our competition.
| | | [removed: 2017] [added: 2018] | | | [removed: 2016] | [added: 2017] | | [removed: 2015] | | [added: 2016 | | |]
| Revenue from operations | | [added: |] 100.0 | % | | [added: |] 100.0 | % | | [added: |] 100.0 | % |
| Operating expenses: | | | | | | | | | | [added: | | |]
| Salaries, wages and benefits | | [removed: 53.7] | [added: 51.3] | | [removed: 55.2] | | [added: 53.7] | [removed: 52.8] | | [added: | 55.2 | |]
| Operating supplies and expenses | | [removed: 11.4] | [added: 12.1] | | [removed: 10.8] | | [added: 11.4] | [removed: 11.9] | | [added: | 10.8 | |]
| General supplies and expenses | | [removed: 3.2] | [added: 2.9] | | [removed: 2.9] | | [added: 3.2] | [removed: 3.0] | | [added: | 2.9 | |]
| Operating taxes and licenses | | [removed: 3.0] | [added: 2.8] | | [removed: 3.1] | | [added: 3.0] | [added: | | |] 3.1 | |
| Insurance and claims | | [removed: 1.2] | [added: 1.1] | | [removed: 1.3] | | [added: 1.2] | [added: | | |] 1.3 | |
| Communication and utilities | | [added: |] 0.8 | | | [removed: 0.9] | [added: 0.8] | | [added: | |] 0.9 | |
| Depreciation and amortization | | [removed: 6.2] | [added: 5.7] | | [removed: 6.3] | | [added: 6.2] | [removed: 5.6] | | [added: | 6.3 | |]
| Purchased transportation | | [removed: 2.5] | [added: 2.4] | | [added: | |] 2.5 | | | [removed: 3.9] | [added: 2.5] | [added: |]
| Building and office equipment rents | | [added: |] 0.2 | | | [removed: 0.3] | [added: 0.2] | | [added: | |] 0.3 | |
| Miscellaneous expenses, net | | [removed: 0.7] | [added: 0.5] | | [removed: 0.5] | | [added: 0.7] | [removed: 0.4] | | [added: | 0.5 | |]
| Total operating expenses | | [removed: 82.9] | [added: 79.8] | | [removed: 83.8] | | [added: 82.9] | [removed: 83.2] | | [added: | 83.8 | |]
| Operating income | | [removed: 17.1] | [added: 20.2] | | [removed: 16.2] | | [added: 17.1] | [removed: 16.8] | | [added: | 16.2 | |]
| Interest [added: (income)] expense, net [removed: (1)] | | [removed: 0.1] | [added: (0.1] | [added: )] | [added: | |] 0.1 | | | [removed: 0.2] | [added: 0.1] | [added: |]
| Other [removed: (income) expense,] [added: expense (income),] net | | [removed: (0.1] | [removed: )] [added: 0.1] | | [removed: 0.1] | | [added: (0.1] | [added: ) | | |] 0.1 | |
| Income before income taxes | | [removed: 17.1] | [added: 20.2] | | [removed: 16.0] | | [added: 17.1] | [removed: 16.5] | | [added: | 16.0 | |]
| Provision for income taxes | | [removed: 3.3] | [added: 5.2] | | [removed: 6.1] | | [added: 3.3] | [removed: 6.2] | | [added: | 6.1 | |]
| Net income | | [removed: 13.8] | [added: 15.0 |] % | | [removed: 9.9] | [added: 13.8 |] % | | [removed: 10.3] | [added: 9.9 |] % |
[removed: The increased] [added: These factors, combined with the increase in] freight density in our service center network and [removed: improvement in yield, combined with] our continued focus on [removed: managing our variable costs,] [added: improving operating efficiency,] led to [removed: the 110] [added: a 310] basis-point improvement in our operating ratio [removed: as] compared to [removed: 2016.][added: 2017.]
As a result, our net income and [added: diluted] earnings per [removed: diluted] share increased [removed: 56.8%] [added: 30.6%] and [removed: 58.1%,] [added: 31.1%,] respectively, in [removed: 2017] [added: 2018] as compared to [removed: 2016.][added: 2017.]
| | | 2017 | | | | 2016 | | | | Change | | | | % Change | | [added: |]
| Work days | | [added: |] 253 | | | | 254 | | | | (1 | [removed: |] ) | | [added: |] (0.4 | ) |
| Revenue (in thousands) | | $ | 3,358,112 | | | $ | 2,991,517 | | | $ | 366,595 | | | [added: |] 12.3 | |
| Operating ratio | | [removed: 82.9] | [added: 82.9] | % | | [removed: 83.8] | [added: 83.8] | % | | | | | | | | [added: |]
| Net income (in thousands) | | $ | 463,774 | | | $ | 295,765 | | | $ | 168,009 | | | [added: |] 56.8 | |
| Diluted earnings per share | | $ | 5.63 | | | $ | 3.56 | | | $ | 2.07 | | | [added: |] 58.1 | |
| LTL tons (in thousands) | | [added: |] 8,519 | | | | 7,931 | | | | 588 | | | | 7.4 | |
| LTL shipments (in thousands) | | [added: |] 10,736 | | | | 10,148 | | | | 588 | | | | 5.8 | |
| LTL weight per shipment (lbs.) | | [added: |] 1,587 | | | | 1,563 | | | | 24 | | | | 1.5 | |
| LTL revenue per hundredweight | | $ | 19.39 | | | $ | 18.51 | | | $ | 0.88 | | | [added: |] 4.8 | |
| LTL revenue per shipment | | $ | 307.66 | | | $ | 289.36 | | | $ | 18.30 | | | [added: |] 6.3 | |
Our service offerings, which include expedited transportation, are provided through an expansive network of service centers located throughout the continental United States.
Through strategic alliances, we also provide LTL services throughout North America.
| --- | --- | --- |
| --- | --- | --- |
| --- | --- | --- |
Our financial results for 2018 reflected Company records in revenue and profitability, as we exceeded $4.0 billion of annual revenue with an operating ratio below 80.0%.
We believe the increase in revenue during the year was driven by the continued strength of the domestic economy and consistent execution of our long-term strategy of providing industry-leading service to our customers at a fair price.
2018 Compared to 2017
| | | 2018 | | | | 2017 | | | | Change | | | | % Change | | |
| --- | --- | --- | --- | --- | --- | --- | --- | --- | --- | --- | --- | --- | --- | --- | --- | --- |
| Revenue (in thousands) | | $ | 4,043,695 | | | $ | 3,358,112 | | | $ | 685,583 | | | | 20.4 | |
| Operating ratio | | | 79.8 | % | | | 82.9 | % | | | | | | | | |
| Net income (in thousands) | | $ | 605,668 | | | $ | 463,774 | | | $ | 141,894 | | | | 30.6 | |
| Diluted earnings per share | | $ | 7.38 | | | $ | 5.63 | | | $ | 1.75 | | | | 31.1 | |
| LTL tons (in thousands) | | | 9,379 | | | | 8,519 | | | | 860 | | | | 10.1 | |
| LTL shipments (in thousands) | | | 11,748 | | | | 10,736 | | | | 1,012 | | | | 9.4 | |
| LTL revenue per hundredweight | | $ | 21.25 | | | $ | 19.39 | | | $ | 1.86 | | | | 9.6 | |
| LTL revenue per shipment | | $ | 339.35 | | | $ | 307.66 | | | $ | 31.69 | | | | 10.3 | |
| LTL revenue per intercity mile | | $ | 5.91 | | | $ | 5.46 | | | $ | 0.45 | | | | 8.2 | |
| LTL intercity miles (in thousands) | | | 674,506 | | | | 605,204 | | | | 69,302 | | | | 11.5 | |
Revenue increased $685.6 million, or 20.4% as compared to 2017, due to a $679.1 million increase in LTL revenue and a $6.5 million increase in non-LTL revenue.
LTL revenue was higher in 2018 due to increases in both LTL tons and yield.
The 10.1% increase in LTL tons during 2018 resulted from a 9.4% increase in LTL shipments and a 0.6% increase in LTL weight per shipment as compared to 2017.
We believe these increases were driven by a stronger U.S. domestic economy and market share gains resulting from increased demand for the consistent levels of superior service that we provide to our customers.
LTL revenue per hundredweight increased 9.6% to $21.25 in 2018 as compared to 2017.
We believe the continued increase in our revenue per hundredweight reflects our consistent yield management process and a favorable pricing environment that resulted from general capacity constraints in the transportation industry.
Our LTL revenue and yield were also positively impacted by an increase in fuel surcharges in 2018 as compared to 2017.
As a percent of revenue, fuel surcharges increased to 13.3% in 2018 from 11.1% in 2017.
This increase was due primarily to an increase in the average price per gallon for diesel fuel during 2018 as compared to 2017.
January 2019 Update
Revenue per day increased 8.3% in January 2019 compared to the same month last year.
LTL tons per day decreased 1.5%, due primarily to a 4.4% decrease in weight per shipment that was slightly offset by a 3.0% increase in LTL shipments.
LTL revenue per hundredweight increased approximately 9.8% as compared to the same month last year.
The increase in the costs attributable to salaries and wages was due primarily to an increase in the number of full-time employees and increases in our employees’ wages.
Our average number of full-time employees increased 14.2% during 2018 as compared to 2017 to support our shipment growth.
Salaries and wages also increased as a result of higher performance-based compensation and annual wage increases provided to our employees at the beginning of both September 2018 and September 2017.
In addition, our costs were also impacted by productivity declines in our platform and P&D operations related to training of our new employees.
Although our costs increased, our aggregate productive labor costs as a percent of revenue improved to 27.0% in 2018 compared to 28.3% in 2017.
Our indirect salaries and wages as a percent of revenue also improved to 11.5% in 2018, compared to 12.0% in 2017.
Employee benefit costs increased $71.6 million or 15.9%, due primarily to the increase in our average number of full-time employees, enhancements to our employees’ paid time off benefits implemented in 2018, and higher 401(k) benefits directly linked to the increase in our net income.
| | |
| --- | --- |
We gauge our overall
| | | | | | | | | | |
| --- | --- | --- | --- | --- | --- | --- | --- | --- | --- |
| (1) | For the purpose of this table, interest expense is presented net of interest income. |
Our financial results for 2017 reflect Company record increases in revenue, net income and earnings per diluted share.
We believe our results were driven by the strengthening economy and a favorable pricing environment during a period of tightening industry capacity.
Our consistent investments in our service center network and equipment have provided us with the capacity needed to serve our customers’ increasing freight demands and win market share.
In addition to the increase in operating income, our net income also increased due in part to net tax benefits recognized in connection with the enactment of the Tax Act in December 2017.
| | | | | | | | | | | | | | | | |
| --- | --- | --- | --- | --- | --- | --- | --- | --- | --- | --- | --- | --- | --- | --- | --- |
We expect our effective tax rate to decrease for 2018 to approximately 26% - 27% as a result of the Tax Act.
Our estimated tax rate could be impacted by future tax adjustments that may be necessary to comply with clarifying interpretations and guidance related to the Tax Act.
2016 Compared to 2015
| | | 2016 | | | | 2015 | | | | Change | | | | % Change | |
| Revenue (in thousands) | | $ | 2,991,517 | | | $ | 2,972,442 | | | $ | 19,075 | | | 0.6 | |
| Operating ratio | | 83.8 | | % | | 83.2 | | % | | | | | | | |
| Net income (in thousands) | | $ | 295,765 | | | $ | 304,690 | | | $ | (8,925 | ) | | (2.9 | ) |
| Diluted earnings per share | | $ | 3.56 | | | $ | 3.57 | | | $ | (0.01 | ) | | (0.3 | ) |
| LTL tons (in thousands) | | 7,931 | | | | 7,938 | | | | (7 | | ) | | (0.1 | ) |
| LTL shipments (in thousands) | | 10,148 | | | | 10,129 | | | | 19 | | | | 0.2 | |
| LTL revenue per hundredweight | | $ | 18.51 | | | $ | 18.23 | | | $ | 0.28 | | | 1.5 | |
| LTL revenue per shipment | | $ | 289.36 | | | $ | 285.67 | | | $ | 3.69 | | | 1.3 | |
| LTL revenue per intercity mile | | $ | 5.09 | | | $ | 5.11 | | | $ | (0.02 | ) | | (0.4 | ) |
| LTL intercity miles (in thousands) | | 576,953 | | | | 566,210 | | | | 10,743 | | | | 1.9 | |
Our revenue in 2016 increased $19.1 million, or 0.6% as compared to 2015 due to a $45.9 million increase in LTL revenue, partially offset by a $26.8 million reduction in non-LTL revenue.
LTL revenue was higher in 2016 as a result of an increase in LTL revenue per hundredweight that was negatively impacted by a slight decline in LTL tonnage.
The reduction in
non-LTL revenue was primarily due to strategic changes in our container drayage and international freight forwarding service offerings that we initiated in the second half of 2015.
LTL revenue per hundredweight increased 1.5% to $18.51 in 2016 primarily due to our disciplined yield management process and a generally stable pricing environment.
The increase in LTL revenue per hundredweight was negatively impacted by a decline in our fuel surcharges that reflected lower average diesel fuel prices.
Fuel surcharge revenue decreased to 9.5% of revenue in 2016 from 10.4% in 2015, primarily due to a decrease in the average price per gallon for diesel fuel for those comparative periods.
The increase in salaries and wages, excluding benefits, was due primarily to the impact of the annual wage increases provided to employees in September 2015 and 2016 and an increase in our direct labor costs to support our strategic reduction in purchased transportation.
We implemented certain operational initiatives in the second half of 2015 to decrease our reliance on purchased transportation providers, but these changes increased our utilization of Company employees and equipment.
These increases were partially offset by lower performance-based compensation linked to operating results as well as improvements in productivity.
Platform pounds and platform shipments per hour improved 4.0% and 3.8%, respectively, in 2016 as compared to 2015.
Both P&D stops and P&D shipments per hour remained consistent between the periods compared, while our linehaul laden load average declined 1.7% as compared to 2015.
Our aggregate productive labor costs increased to 28.9% of revenue in 2016 as compared to 27.9% in 2015, while our other indirect salaries and wages increased to 12.2% of revenue in 2016 as compared to 11.9% in 2015.
Employee benefit costs increased $35.2 million, or 9.1% in 2016 compared to 2015, primarily due to higher costs for our group health and dental plans and an increase in certain retirement benefit plan costs that are directly linked to the market price of our common stock.
An excerpt. Shown here: 40 of 122 rewritten, 40 of 60 added and 40 of 68 removed. The counts are complete. For every sentence, read Item 7. MANAGEMENT’S DISCUSSION AND ANALYSIS OF FINANCIAL CONDITION AND RESULTS OF OPERATIONS in the FY2018 filing and the FY2017 filing.
Item 7A. QUANTITATIVE AND QUALITATIVE DISCLOSURES ABOUT MARKET RISK
5 rewritten, 3 added, 1 removed, 8 unchanged
We are exposed to market risk for [removed: equity] investments relating to Company-owned life insurance contracts on certain [added: current and former] employees.
[removed: At December 31, 2017, the] [added: The] cash [added: surrender] value for variable life insurance contracts was [added: $45.7 million of the $47.7 million, and] $50.9 million of the $53.1 [removed: million] [added: million,] of aggregate cash [added: surrender] values for all life insurance contracts included on our Balance [removed: Sheets.][added: Sheets at December 31, 2018 and 2017, respectively.]
A 10% change in market value [removed: in those investments] would have [removed: had] [added: caused] a [added: $4.6 million and a] $5.1 million impact on our pre-tax income in [removed: 2017.][added: 2018 and 2017, respectively.]
[removed: At December 31, 2017, the] [added: The] total liability for unsettled awards granted under these phantom stock plans totaled [added: $57.2 million and] $56.6 [removed: million.][added: million at December 31, 2018 and 2017, respectively.]
A 10% change in [removed: the price] [added: market value] of our common stock [removed: at December 31, 2017] would have [removed: had] [added: caused] a $5.7 million impact on our operating income [removed: in 2017] with respect to these [removed: plans.][added: plans in both 2018 and 2017, respectively.]
The underlying investments in our variable life insurance contracts expose us to market fluctuations.
To provide a meaningful assessment of the market risk for investments relating to Company-owned life insurance contracts, we performed a sensitivity analysis using a 10% change in market value in those investments on December 31, 2018.
To provide a meaningful assessment of market risk for our employee and director phantom stock plans, we performed a sensitivity analysis using a 10% change in the price of our common stock at December 31, 2018.
Variable life insurance contracts expose us to fluctuations in equity markets; however, we utilize a third-party to manage these assets and minimize that exposure.
Item 1. BUSINESS
44 rewritten, 21 added, 38 removed, 124 unchanged
We are a leading, less-than-truckload (“LTL”), union-free motor carrier providing regional, inter-regional and national LTL [removed: services, which include ground and air expedited transportation and consumer household pickup and delivery ("P&D"),] [added: services] through a single integrated organization.
In addition to our core LTL services, we offer a range of value-added services including container drayage, truckload [removed: brokerage,] [added: brokerage and] supply chain [removed: consulting and warehousing.][added: consulting.]
We [removed: have grown to be] [added: are] the fourth largest LTL motor carrier in the United States, as measured by [removed: 2016 revenue, from the sixth largest LTL motor carrier in the United States, as measured by 2011] [added: 2017] revenue, according to Transport Topics.
We have increased our revenue and customer base over [removed: this five-year period] [added: the past five years] primarily through organic market share growth.
We opened [removed: 10] [added: 14] and [removed: 22] [added: 29] new service centers over the past five and ten years, respectively, for a total of [removed: 228] [added: 235] service centers at December 31, [removed: 2017.][added: 2018.]
LTL motor carriers generally require a more expansive network of local [removed: P&D] [added: pickup and delivery (“P&D”)] service centers, as well as larger breakbulk, or hub, facilities.
According to the American Trucking Associations, the trucking industry accounted for [removed: 79.8%] [added: 79.3%] of the [removed: $847.6] [added: $883.4] billion total U.S. transportation revenue in [removed: 2016.][added: 2017.]
The LTL sector had revenue in [removed: 2016] [added: 2017] of [removed: $54.7] [added: $55.6] billion, which represented [removed: 6.5%] [added: 6.3%] of total U.S. transportation revenue.
Based on [removed: 2016] [added: 2017] revenue as reported in Transport Topics, the largest 10 and 25 LTL motor carriers accounted for approximately [removed: 51%] [added: 55%] and [removed: 62%,] [added: 67%,] respectively, of the total LTL market.
At December 31, [removed: 2017,] [added: 2018,] we operated [removed: 228] [added: 235] service center locations, of which we owned [removed: 194] [added: 203] and leased [removed: 34.][added: 32.]
All inbound freight received by the service center in the evening or during the night is generally scheduled for local delivery the next business day, unless a [added: customer requests a different delivery schedule.]
At December 31, [removed: 2017,] [added: 2018,] we owned [removed: 8,316] [added: 9,254] tractors.
The table below reflects, as of December 31, [removed: 2017,] [added: 2018,] the average age of our tractors and trailers:
| Type of Equipment | | Number of Units | | | [added: |] Average Age (In years) | | [added: |]
The table below sets forth our capital expenditures for tractors and trailers for the years ended December 31, [removed: 2017, 2016] [added: 2018, 2017] and [removed: 2015.][added: 2016.]
| (In thousands) | | [removed: 2017] [added: 2018] | | | | [removed: 2016] [added: 2017] | | | | [removed: 2015] [added: 2016] | | |
| Tractors | | $ | [removed: 123,152] [added: 185,209] | | | $ | [removed: 114,166] [added: 123,152] | | | $ | [removed: 128,911] [added: 114,166] | |
| Trailers | | [removed: 37,424] | [added: 98,835] | | | [removed: 94,040] | [added: 37,424] | | | [removed: 114,209] | [added: 94,040] | |
| Total | | $ | [removed: 160,576] [added: 284,044] | | | $ | [removed: 208,206] [added: 160,576] | | | $ | [removed: 243,120] [added: 208,206] | |
At December 31, [removed: 2017,] [added: 2018,] we operated 39 maintenance centers at strategic service center locations throughout our network.
In [removed: 2017,] [added: 2018,] our largest customer accounted for approximately [removed: 3.7%] [added: 4.0%] of our revenue and our largest 5, 10 and 20 customers accounted for [removed: 11.2%, 17.0%] [added: 13.7%, 19.3%] and [removed: 23.6%] [added: 26.0%] of our revenue, respectively.
For each of [removed: the previous] [added: our last] three [added: fiscal] years, more than 95% of our revenue was derived from services performed in the United States and less than 5% of our revenue was generated from services performed internationally.
Harsh winter weather or natural disasters, such as hurricanes, [removed: tornadoes and] [added: tornadoes,] floods, [added: fires and other storms] can also adversely impact our performance by reducing demand and increasing operating expenses.
We also provide access to our systems through multiple gateways that offer our customers and employees maximum flexibility and [removed: immediate] access to information.
We employ vehicle safety systems, on-board and hand-held computer systems, freight handling systems and logistics technology to reduce costs and transit [removed: times.][added: times, as well as to meet regulatory requirements.]
| [added: |] • | $2.75 million per occurrence for bodily injury and property damage (“BIPD”) claims, plus a one-time, $2.5 [added: million aggregate corridor deductible applicable per policy period to any claim that exceeds $5.0 million and occurs after March 30, 2016;] |
[removed: -] [added: | | • |] $1.0 million per occurrence for workers’ compensation claims; and [added: |]
[removed: -] [added: | | • |] $1.0 million per covered person paid during [removed: 2017] [added: 2018] for group health claims. [added: |]
We believe that our policy of maintaining [removed: an] [added: a] SIR or deductible for a portion of our risks, supported by our [removed: safety] [added: safety, claims management] and loss prevention programs, is an effective means of managing insurance costs.
As of December 31, [removed: 2017,] [added: 2018,] we employed [removed: 19,183] [added: 21,279] individuals on a full-time basis, none of which were represented under a collective bargaining agreement.
| Full-Time Employees | | Number of Employees | | [added: |]
| Fleet technicians | | [removed: 557] | [added: 590] | [added: |]
| Sales, administrative and other | | [removed: 4,996] | [added: 5,425] | [added: |]
As of December 31, [removed: 2017,] [added: 2018,] we employed [removed: 5,311] [added: 5,743] linehaul drivers and [removed: 4,876] [added: 5,464] P&D drivers on a full-time basis.
Since 1988, we have provided the opportunity for qualified employees to become drivers through the “Old Dominion Driver Training Program.” There are currently [removed: 2,892] [added: 3,273] active drivers who have successfully completed this training, which was approximately [removed: 28.4%] [added: 29.2%] of our driver workforce as of December 31, [removed: 2017.][added: 2018.]
In addition, we have experienced an annual turnover rate for our driver graduates of approximately [removed: 5.9%,] [added: 5.7%,] which is below our Company-wide turnover rate for all drivers of approximately 8.0%.
Our safety bonuses paid to drivers totaled [removed: $3.9] [added: $4.1] million, [removed: $3.7] [added: $3.9] million and [removed: $3.4] [added: $3.7] million in [removed: 2017, 2016] [added: 2018, 2017] and [removed: 2015,] [added: 2016,] respectively.
We are regulated by the DOT and by various state [added: and federal] agencies.
[removed: The 2011 Rules maintained the maximum 11-hour daily driving limit, but required] [added: FMCSA rules also require] that drivers take a 30-minute break prior to working beyond eight hours.
We currently utilize ELD rule-compliant automatic [removed: onboard] [added: on-board] recording devices [removed: ("AOBRDs")] [added: (“AOBRDs”)] in all of our Company-owned vehicles, and the AOBRD data is integrated with our existing comprehensive fleet management and safety systems.
Our service offerings, which include expedited transportation, are provided through an expansive network of service centers located throughout the continental United States.
Through strategic alliances, we also provide LTL services throughout North America.
| --- | --- | --- | --- | --- | --- | --- | --- | --- |
| Tractors | | | 9,254 | | | | 3.5 | |
| Linehaul trailers | | | 24,685 | | | | 6.8 | |
| P&D trailers | | | 11,044 | | | | 7.4 | |
At December 31, 2018, we maintained a SIR or deductible of $1.0 million or more with respect to the below casualty and group health coverages:
| --- | --- | --- |
| --- | --- | --- |
| --- | --- | --- |
| --- | --- | --- | --- | --- |
| Drivers | | | 11,207 | |
| Platform | | | 4,057 | |
| Total | | | 21,279 | |
The Federal Motor Carrier Safety Administration (the “FMCSA”) rules provide that a truck driver may work no more than a maximum number of 60 hours within seven consecutive days and 70 hours within eight consecutive days.
FMCSA rules further impose a maximum work period of 14 hours (no more than 11 hours of which may be driving time) after first coming on-duty following 10 consecutive hours of off-duty time.
This waiver proved unnecessary and was withdrawn as the FMCSA was made aware of multiple motor carriers facing the same issues from technology providers when changing from an AOBRD to an ELD operating system.
The FMCSA issued responsive guidance that allowed AOBRD operating systems to be installed and utilized on ELD compliant hardware until December 16, 2019.
We are working with service providers to transition our fleet from our current AOBRD operating system to a new ELD hardware and software platform.
We expect the transition to be completed prior to December 2019.
by changing jobs or locations.
Please refer to the Balance Sheets and Statements of Operations included in Item 8, “Financial Statements and Supplementary Data” in this report for information regarding our total assets, revenue from operations and net income.
customer requests a different delivery schedule.
| | | | | | | |
| --- | --- | --- | --- | --- | --- | --- |
| Tractors | | 8,316 | | | 4.0 | |
| Linehaul trailers | | 23,100 | | | 6.5 | |
| P&D trailers | | 9,790 | | | 8.1 | |
| | | | | | | | | | | | | |
At December 31, 2017, the amounts of our SIR and/or deductibles were as follows:
| | |
| --- | --- |
million aggregate corridor deductible applicable per annual policy period to any claim that exceeds $5.0 million and occurs after March 30, 2016;
- $100,000 per occurrence for cargo loss and damage;
| | | | |
| --- | --- | --- | --- |
| Drivers | | 10,187 | |
| Platform | | 3,443 | |
| Total | | 19,183 | |
In December 2011, the Federal Motor Carrier Safety Administration (the "FMCSA") issued revised rules governing hours of service for commercial truck drivers (the "2011 Rules"), and mandated compliance by July 1, 2013.
The 2011 Rules reduced the maximum number of hours a truck driver could work each week to 70 hours from the former 82-hour limit.
The 2011 Rules also added restrictions to the “34-hour restart” provision to include two rest periods between 1 a.m.
and 5 a.m., and limited the use of the restart to once every 168 hours.
Compliance with the 2011 Rules on July 1, 2013 required us to make certain changes in our operating procedures.
These changes increased our operating costs by limiting the productivity of our drivers.
In December 2014, the FMCSA temporarily suspended, through the 2015 Omnibus Appropriations Bill, enforcement of the provisions requiring two rest periods between 1 a.m.
and 5 a.m.
and the 168-hour minimum restart restriction.
In connection with the temporary suspension, Congress requested that the FMCSA conduct a study to determine whether two rest periods between 1 a.m.
and 5 a.m., and the limited use of one restart every 168 hours, significantly improved safety benefits.
In December 2016, Congress enacted legislation providing that if the FMCSA study demonstrated significant safety benefits attributable to these two rest periods and the 168-hour minimum restart restriction, then these two restrictions to the “34-hour restart” provision would be reinstated.
If the FMCSA’s study did not support the safety benefits, the suspension would remain in effect.
In March 2017, the final FMCSA study was submitted to Congress and did not demonstrate significant safety benefits attributable to the two rest periods and the 168-hour minimum restart restriction.
As a result, the suspension remains in effect.
This waiver permits us to install ELD devices running on AOBRD software in newly purchased vehicles until March 18, 2018.
The FMCSA is currently considering a related request to extend this ability, in the form of an exemption from the ELD rule, until December 18, 2018.
This extension would allow our AOBRD/ELD third-party provider additional time to complete development of software that would integrate ELD data, as well as AOBRD data, with our existing comprehensive fleet management and safety systems.
Regardless of whether the exemption is granted, however, we are well-positioned to continue to optimize both the safety and efficiency of our fleet and remain compliant with the FMCSA's ELD regulations and guidance.
The SEC can be reached at 1-800-SEC-0330 for further information on the operation of the Public Reference Room.
An excerpt. Shown here: 40 of 44 rewritten, all 21 added and all 38 removed. The counts are complete. For every sentence, read Item 1. BUSINESS in the FY2018 filing and the FY2017 filing.
Item 3. LEGAL PROCEEDINGS
1 rewritten, 0 added, 3 removed, 2 unchanged
We do not believe that the resolution of any of these [removed: matters, including the matter described below,] [added: matters] will have a material adverse effect upon our financial position, results of operations or cash flows.
On March 29, 2017, the United States Environmental Protection Agency issued a Finding and Notice of Violation (“NOV”) to us, alleging violations of the Truck and Bus Regulation and the Drayage Truck Regulation as promulgated by the California Air Resources Board.
The NOV alleges, among other things, that we failed to (i) timely install diesel particulate filters on certain diesel-fueled vehicles that we owned and operated in California; and (ii) verify the installation of diesel particulate filters on certain diesel-fueled vehicles that we caused to be operated in California.
We expect that this matter will result in monetary sanctions to us that exceed $100,000; however, we do not believe it is reasonably possible that this matter would result in a loss that would have a material effect on our financial position, results of operations or cash flows.
Cover and table of contents
42 rewritten, 22 added, 5 removed, 45 unchanged
| [removed: ý] [added: ☒] | ANNUAL REPORT PURSUANT TO SECTION 13 OR 15(d) OF THE SECURITIES EXCHANGE ACT OF 1934 |
For the fiscal year ended December 31, [removed: 2017][added: 2018]
| [removed: ¨] [added: ☐] | TRANSITION REPORT PURSUANT TO SECTION 13 OR 15(d) OF THE SECURITIES EXCHANGE ACT OF 1934 |
[removed: ][added: ]
Yes [removed: ý] [added: ☒] No [removed: ¨][added: ☐]
Yes [removed: ¨] [added: ☐] No [removed: ý][added: ☒]
Indicate by check mark whether the registrant has submitted electronically [removed: and posted on its corporate Website, if any,] every Interactive Data File required to be submitted [removed: and posted] pursuant to Rule 405 of Regulation S-T (§232.405 of this chapter) during the preceding 12 months (or for such shorter period that the registrant was required to submit [removed: and post] such files).
Indicate by check mark whether the registrant is a large accelerated filer, an accelerated filer, a non-accelerated filer, [added: a] smaller reporting company, or an emerging growth company.
| Large accelerated filer | [removed: ý] [added: ☒] | | | Accelerated filer | [removed: ¨] [added: ☐] |
| Non-accelerated filer | [removed: ¨] [added: ☐] | | | Smaller reporting company | [removed: ¨] [added: ☐] |
| [removed: (Do not check if a smaller reporting company)] | | | | Emerging growth company | [removed: ¨] [added: ☐] |
The aggregate market value of voting stock held by non-affiliates of the registrant as of June 30, [removed: 2017] [added: 2018] was [removed: $6,264,630,995,] [added: $9,679,656,484,] based on the closing sales price as reported on the Nasdaq Global Select Market.
As of February [removed: 23, 2018,] [added: 26, 2019,] the registrant had [removed: 82,374,451] [added: 81,146,989] outstanding shares of Common Stock ($0.10 par value).
Certain portions of the Company’s Proxy Statement for the [removed: 2018] [added: 2019] Annual Meeting of Shareholders are incorporated by reference into Part III of this report.
| [Forward-Looking [removed: Information](#s1B3F2826B7ED500BBC41C3CA35F52184)] [added: Information](#FORWARDLOOKING_INFORMATION)] | | [removed: [1](#s1B3F2826B7ED500BBC41C3CA35F52184)] | [added: 1 |]
| [Part [removed: I](#s967DC09FD65A55198AF26752CBC4303C)] [added: I](#PART_I)] | | [removed: [1](#s967DC09FD65A55198AF26752CBC4303C)] | [added: 1 |]
| Item 1 | [removed: [Business](#sA7254D7EE97D53EEA0A97E327BAE3B43)] [added: [Business](#ITEM_1_BUSINESS)] | [removed: [1](#sA7254D7EE97D53EEA0A97E327BAE3B43)] | [added: 1 |]
| Item 1A | [Risk [removed: Factors](#s0329FB122BCC5767ADF9C5FDFD853CA6)] [added: Factors](#ITEM_1A_RISK_FACTORS)] | [removed: [7](#s0329FB122BCC5767ADF9C5FDFD853CA6)] | [added: 6 |]
| Item 1B | [Unresolved Staff [removed: Comments](#s2D6565FBAE10515BA23D5111537B06E4)] [added: Comments](#ITEM_1B_UNRESOLVED_STAFF_COMMENTS)] | [removed: [15](#s2D6565FBAE10515BA23D5111537B06E4)] | [added: 14 |]
| Item 2 | [removed: [Properties](#sDC3EEBFDB0CF5DC9B40768C48EACCEEA)] [added: [Properties](#ITEM_2_PROPERTIES)] | [removed: [16](#sDC3EEBFDB0CF5DC9B40768C48EACCEEA)] | [added: 15 |]
| Item 3 | [Legal [removed: Proceedings](#sCF687939FF8557CC877101B5ED1A1C14)] [added: Proceedings](#ITEM_3_LEGAL_PROCEEDINGS)] | [removed: [16](#sCF687939FF8557CC877101B5ED1A1C14)] | [added: 15 |]
| Item 4 | [Mine Safety [removed: Disclosures](#sE9AAC3C3617F55058E79061C64EA0E8C)] [added: Disclosures](#ITEM_4_MINE_SAFETY_DISCLOSURES)] | [removed: [16](#sE9AAC3C3617F55058E79061C64EA0E8C)] | [added: 15 |]
| [Part [removed: II](#sE9FF38D46EA25016AA6A1E2BC0602BEB)] [added: II](#PART_II)] | | [removed: [17](#sE9FF38D46EA25016AA6A1E2BC0602BEB)] | [added: 16 |]
| Item 5 | [Market for Registrant’s Common Equity, Related Stockholder Matters and Issuer Purchases of Equity [removed: Securities](#sE98E8E1A4A435CEDB9280316A8C9D4AA)] [added: Securities](#ITEM_5_MARKET_FOR_REGISTRANTS_COMMON_EQU)] | [removed: [17](#sE98E8E1A4A435CEDB9280316A8C9D4AA)] | [added: 16 |]
| Item 6 | [Selected Financial [removed: Data](#s06D5DEE3BF0D540AA94B9D39ABBD894F)] [added: Data](#ITEM_6_SELECTED_FINANCIAL_DATA)] | [removed: [19](#s06D5DEE3BF0D540AA94B9D39ABBD894F)] | [added: 18 |]
| Item 7 | [Management’s Discussion and Analysis of Financial Condition and Results of [removed: Operations](#sCFD73EAC398B5B2B8E87D5F6F0F82DBE)] [added: Operations](#ITEM_7_MANAGEMENTS_DISCUSSION_ANALYSIS_F)] | [removed: [20](#sCFD73EAC398B5B2B8E87D5F6F0F82DBE)] | [added: 19 |]
| Item 7A | [Quantitative and Qualitative Disclosures about Market [removed: Risk](#sE446D2A64DCD578AA69A8E9B2E43BF0D)] [added: Risk](#ITEM_7A_QUANTITATIVE_QUALITATIVE_DISCLOS)] | [removed: [29](#sE446D2A64DCD578AA69A8E9B2E43BF0D)] | [added: 27 |]
| Item 8 | [Financial Statements and Supplementary [removed: Data](#s02282687968C556E8DA08924E2C4CC1C)] [added: Data](#ITEM_8_FINANCIAL_STATEMENTS_SUPPLEMENTAR)] | [removed: [31](#s02282687968C556E8DA08924E2C4CC1C)] | [added: 29 |]
| Item 9 | [Changes in and Disagreements With Accountants on Accounting and Financial [removed: Disclosure](#s6AC9EEA5E1865D71BFF8DE32E81837A9)] [added: Disclosure](#ITEM_9_CHANGES_IN_DISAGREEMENTS_WITH_ACC)] | [removed: [49](#s6AC9EEA5E1865D71BFF8DE32E81837A9)] | [added: 45 |]
| Item 9A | [Controls and [removed: Procedures](#sC8ABF7C5F60E5F678C740EFE059FEFCF)] [added: Procedures](#ITEM_9A_CONTROLS_PROCEDURES)] | [removed: [49](#sC8ABF7C5F60E5F678C740EFE059FEFCF)] | [added: 45 |]
| Item 9B | [Other [removed: Information](#s10A57B87293A56DE97D86942EC201D11)] [added: Information](#ITEM_9B_OR_INFORMATION)] | [removed: [51](#s10A57B87293A56DE97D86942EC201D11)] | [added: 47 |]
| [Part [removed: III](#sF08515D19CED50AEA62666E7C2AD4DB5)] [added: III](#PART_III)] | | [removed: [51](#sF08515D19CED50AEA62666E7C2AD4DB5)] | [added: 47 |]
| Item 10 | [Directors, Executive Officers and Corporate [removed: Governance](#s33EAED3E622C5209A0B6418F93113A0B)] [added: Governance](#ITEM_10_DIRECTORS_EXECUTIVE_FICERS_CORPO)] | [removed: [51](#s33EAED3E622C5209A0B6418F93113A0B)] | [added: 47 |]
| Item 11 | [Executive [removed: Compensation](#s7B394EB77EB55BF6A52E904AEA0A500C)] [added: Compensation](#ITEM_11_EXECUTIVE_COMPENSATION)] | [removed: [51](#s7B394EB77EB55BF6A52E904AEA0A500C)] | [added: 47 |]
| Item 12 | [Security Ownership of Certain Beneficial Owners and Management and Related Stockholder [removed: Matters](#s592DDDFA7F7150F3B10EAF85A801FCFA)] [added: Matters](#ITEM_12_SECURITY_OWNERSHIP_CERTAIN_BENEF)] | [removed: [51](#s592DDDFA7F7150F3B10EAF85A801FCFA)] | [added: 47 |]
| Item 13 | [Certain Relationships and Related Transactions, and Director [removed: Independence](#s7E990AB889505593BB2B91A5DAF4C2E7)] [added: Independence](#ITEM_13_CERTAIN_RELATIONSHIPS_RELATED_TR)] | [removed: [51](#s7E990AB889505593BB2B91A5DAF4C2E7)] | [added: 47 |]
| Item 14 | [Principal Accounting Fees and [removed: Services](#s99BF52D9B00D53868EB465063F426217)] [added: Services](#ITEM_14_PRINCIPAL_ACCOUNTING_FEES_SERVIC)] | [removed: [51](#s99BF52D9B00D53868EB465063F426217)] | [added: 47 |]
| [Part [removed: IV](#s0DCF75AA707555B5B1E5AD2EC0CF5857)] [added: IV](#PART_IV)] | | [removed: [52](#s0DCF75AA707555B5B1E5AD2EC0CF5857)] | [added: 48 |]
| Item 15 | [Exhibits, Financial Statement [removed: Schedules](#s0F47F4E2092555419FFB5CD5D52B71B7)] [added: Schedules](#ITEM_15_EXHIBITS_FINANCIAL_STATEMENT_SCH)] | [removed: [52](#s0F47F4E2092555419FFB5CD5D52B71B7)] | [added: 48 |]
| Item 16 | [Form 10-K [removed: Summary](#s9F5DB7890C255D8EBA6A07AB793B18B8)] [added: Summary](#ITEM_16_FORM_10K_SUMMARY)] | [removed: [53](#s9F5DB7890C255D8EBA6A07AB793B18B8)] | [added: 48 |]
10-K 1 odfl-10k_20181231.htm 10-K
Yes ☒ No ☐
Yes ☒ No ☐
Yes ☐ No ☒
| | | | |
| --- | --- | --- | --- |
| | | | |
| | | | |
| | | | |
| | | | |
| | | | |
| | | | |
| | | | |
| | | | |
| | | | |
| | | | |
| | | | |
| | | | |
| | | | |
| | | | |
| | | | |
| | | | |
10-K 1 a201710-k.htm FORM 10-K
| | |
| | | |
| --- | --- | --- |
| | | | | | |
An excerpt. Shown here: 40 of 42 rewritten, all 22 added and all 5 removed. The counts are complete. For every sentence, read Cover and table of contents in the FY2018 filing and the FY2017 filing.
Item 2. PROPERTIES
15 rewritten, 1 added, 2 removed, 5 unchanged
At December 31, [removed: 2017,] [added: 2018,] we operated [removed: 228] [added: 235] service centers, of which [removed: 194] [added: 203] were owned and [removed: 34] [added: 32] were leased.
We own each of our major breakbulk facilities listed below and have provided the number of doors as of December 31, [removed: 2017.][added: 2018.]
| Service Center | | Doors | [added: | |]
| Morristown, Tennessee | | [added: |] 347 | [added: |]
| Indianapolis, Indiana | | [added: |] 318 | [added: |]
| Dallas, Texas | | [added: |] 304 | [added: |]
| Harrisburg, Pennsylvania | | [added: |] 300 | [added: |]
| Memphis, Tennessee | | [added: |] 267 | [added: |]
| Rialto, California | | [added: |] 265 | [added: |]
| Atlanta, Georgia | | [added: |] 227 | [added: |]
| Greensboro, North Carolina | | [added: |] 212 | [added: |]
| Columbus, Ohio | | [removed: 211] | [added: 301 | |]
| Salt Lake City, Utah | | [added: |] 188 | [added: |]
Our [removed: 228] [added: 235] facilities are strategically dispersed over the states in which we operate.
At December 31, [removed: 2017,] [added: 2018,] the terms of our leased properties ranged from month-to-month to a lease that expires in 2039.
| --- | --- | --- | --- | --- |
| | | |
| --- | --- | --- |
Item 5. MARKET FOR REGISTRANT’S COMMON EQUITY, RELATED STOCKHOLDER MATTERS AND ISSUER PURCHASES OF EQUITY SECURITIES
6 rewritten, 13 added, 24 removed, 5 unchanged
Common Stock [removed: and Dividend] Information
At February [removed: 22, 2018,] [added: 21, 2019,] there were [removed: 59,949] [added: 72,192] holders of our common stock, including [removed: 83] [added: 108] shareholders of record.
On May [removed: 23, 2016,] [added: 17, 2018,] we announced that our Board of Directors had approved a two-year stock repurchase program authorizing us to repurchase up to an aggregate of $250.0 million of our outstanding common stock (the [removed: “2016 Repurchase] [added: “Repurchase] Program”).
Under the [removed: 2016] Repurchase Program, [added: which became effective upon the expiration of our prior stock repurchase program in June 2018,] we may repurchase shares from time to time in open market purchases or through privately negotiated transactions.
The following graph compares the total shareholder cumulative returns, assuming the reinvestment of all dividends, of $100 invested on December 31, [removed: 2012,] [added: 2013,] in (i) our common stock, (ii) the S&P 500 Total Return Index, and (iii) the Nasdaq Industrial Transportation Index, for the five-year period ended December 31, [removed: 2017.][added: 2018.]
[removed: 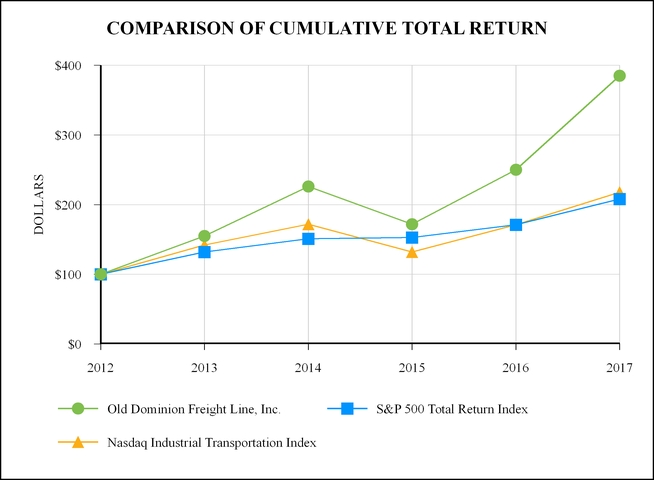][added: 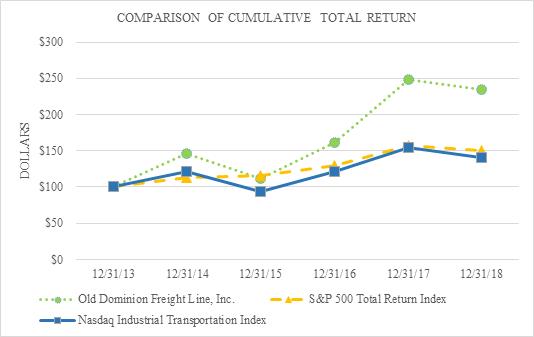]
The following table provides information regarding our repurchases of our common stock during the fourth quarter of 2018:
| ISSUER PURCHASES OF EQUITY SECURITIES | | | | | | | | | | | | | | | | | |
| --- | --- | --- | --- | --- | --- | --- | --- | --- | --- | --- | --- | --- | --- | --- | --- | --- | --- |
| | | | | | | | | | | | | | | | | | |
| | | Total Number of Shares Purchased | | | | Average Price Paid per Share | | | | Total Number of Shares Purchased as Part of Publicly Announced Programs | | | | Approximate Dollar Value of Shares that May Yet Be Purchased Under the Programs | | | |
| October 1-31, 2018 | | | 81,548 | | | $ | 138.41 | | | | 81,548 | | | $ | 207,118,163 | | |
| November 1-30, 2018 | | | 437,647 | | | $ | 131.82 | | | | 437,647 | | | $ | 149,428,758 | | |
| December 1-31, 2018 | | | 135,028 | | | $ | 131.08 | | | | 135,028 | | | $ | 131,729,611 | | |
| Total | | | 654,223 | | | $ | 132.49 | | | | 654,223 | | | | | | |
| | | 12/31/13 | | | | 12/31/14 | | | | 12/31/15 | | | | 12/31/16 | | | | 12/31/17 | | | | 12/31/18 | | |
| Old Dominion Freight Line, Inc. | | $ | 100 | | | $ | 146 | | | $ | 111 | | | $ | 162 | | | $ | 249 | | | $ | 235 | |
| S&P 500 Total Return Index | | $ | 100 | | | $ | 114 | | | $ | 115 | | | $ | 129 | | | $ | 157 | | | $ | 150 | |
| Nasdaq Industrial Transportation Index | | $ | 100 | | | $ | 121 | | | $ | 94 | | | $ | 121 | | | $ | 154 | | | $ | 140 | |
We did not pay any dividends on our common stock during fiscal year 2016.
We paid a quarterly dividend of $0.10 per share on our common stock during each quarter of 2017.
On February 8, 2018, we announced that our Board of Directors had declared a cash dividend of $0.13 per share of common stock, payable on March 20, 2018 to shareholders of record at the close of business on March 6, 2018.
We currently intend to pay a quarterly cash dividend on our common stock for the foreseeable future.
Our senior unsecured credit agreement includes a provision limiting our ability to make restricted payments, including dividends and payments for share repurchases, unless, among other conditions, no defaults or events of default under the credit agreement are ongoing (or would be caused by such restricted payment).
The following table sets forth, for the periods indicated, the high and low sales prices of our common stock, as reported by Nasdaq, and the cash dividend paid per share of our common stock:
| | | | | | | | | | | | | | | | | |
| --- | --- | --- | --- | --- | --- | --- | --- | --- | --- | --- | --- | --- | --- | --- | --- | --- |
| | | 2017 | | | | | | | | | | | | | | |
| | | First Quarter | | | | Second Quarter | | | | Third Quarter | | | | Fourth Quarter | | |
| High | | $ | 94.97 | | | $ | 96.46 | | | $ | 110.45 | | | $ | 134.07 | |
| Low | | $ | 82.93 | | | $ | 80.56 | | | $ | 93.29 | | | $ | 106.20 | |
| Dividend | | $ | 0.10 | | | $ | 0.10 | | | $ | 0.10 | | | $ | 0.10 | |
| | | 2016 | | | | | | | | | | | | | | |
| High | | $ | 70.52 | | | $ | 72.45 | | | $ | 71.75 | | | $ | 91.69 | |
| Low | | $ | 48.92 | | | $ | 56.74 | | | $ | 59.55 | | | $ | 68.21 | |
| Dividend | | $ | — | | | $ | — | | | $ | — | | | $ | — | |
We did not repurchase any shares of our common stock during the fourth quarter of 2017.
As of December 31, 2017, $192.0 million of our outstanding common stock remained available for repurchase under the 2016 Repurchase Program.
| | | | | | | | | | | | | | | | | | | | | | | | | |
| | | 12/31/12 | | | | 12/31/13 | | | | 12/31/14 | | | | 12/31/15 | | | | 12/31/16 | | | | 12/31/17 | | |
| Old Dominion Freight Line, Inc. | | $ | 100 | | | $ | 155 | | | $ | 226 | | | $ | 172 | | | $ | 250 | | | $ | 385 | |
| S&P 500 Total Return Index | | $ | 100 | | | $ | 132 | | | $ | 151 | | | $ | 153 | | | $ | 171 | | | $ | 208 | |
| Nasdaq Industrial Transportation Index | | $ | 100 | | | $ | 142 | | | $ | 172 | | | $ | 132 | | | $ | 171 | | | $ | 218 | |
Item 6. SELECTED FINANCIAL DATA
18 rewritten, 0 added, 4 removed, 8 unchanged
| (In thousands, except per share amounts) | | [removed: 2017] [added: 2018] | | | | [removed: 2016] [added: 2017] | | | | [removed: 2015] [added: 2016] | | | | [removed: 2014] [added: 2015] | | | | [removed: 2013] [added: 2014] | | |
| Revenue from operations | | $ | [removed: 3,358,112] [added: 4,043,695] | | | $ | [removed: 2,991,517] [added: 3,358,112] | | | $ | [removed: 2,972,442] [added: 2,991,517] | | | $ | [removed: 2,787,897] [added: 2,972,442] | | | $ | [removed: 2,337,648] [added: 2,787,897] | |
| Depreciation and amortization expense | | [removed: 205,763] | [added: 230,357] | | | [removed: 189,867] | [added: 205,763] | | | [removed: 165,343] | [added: 189,867] | | | [removed: 146,466] | [added: 165,343] | | | [removed: 127,072] | [added: 146,466] | |
| Total operating expenses | | [removed: 2,782,226] | [added: 3,226,644] | | | [removed: 2,507,682] | [added: 2,782,226] | | | [removed: 2,474,202] | [added: 2,507,682] | | | [removed: 2,346,590] | [added: 2,474,202] | | | [removed: 1,999,210] | [added: 2,346,590] | |
| Operating income | | [removed: 575,886] | [added: 817,051] | | | [removed: 483,835] | [added: 575,886] | | | [removed: 498,240] | [added: 483,835] | | | [removed: 441,307] | [added: 498,240] | | | [removed: 338,438] | [added: 441,307] | |
| Interest [added: (income)] expense, net [removed: (1)] | | [removed: 1,414] | [added: (2,924] | [added: )] | | [removed: 4,274] | [added: 1,414] | | | [removed: 5,001] | [added: 4,274] | | | [removed: 6,502] | [added: 5,001] | | | [removed: 9,473] | [added: 6,502] | |
| Provision for income taxes | | [removed: 112,058] | [added: 209,845] | | | [removed: 181,822] | [added: 112,058] | | | [removed: 185,327] | [added: 181,822] | | | [removed: 165,000] | [added: 185,327] | | | [removed: 122,573] | [added: 165,000] | |
| Net income [removed: (2)] [added: (1)] | | [removed: 463,774] | [added: 605,668] | | | [removed: 295,765] | [added: 463,774] | | | [removed: 304,690] | [added: 295,765] | | | [removed: 267,514] | [added: 304,690] | | | [removed: 206,113] | [added: 267,514] | |
| Basic earnings per share | | $ | [removed: 5.63] [added: 7.39] | | | $ | [removed: 3.56] [added: 5.63] | | | $ | [removed: 3.57] [added: 3.56] | | | $ | [removed: 3.10] [added: 3.57] | | | $ | [removed: 2.39] [added: 3.10] | |
| Diluted earnings per share | | $ | [removed: 5.63] [added: 7.38] | | | $ | [removed: 3.56] [added: 5.63] | | | $ | [removed: 3.57] [added: 3.56] | | | $ | [removed: 3.10] [added: 3.57] | | | $ | [removed: 2.39] [added: 3.10] | |
| Cash dividends per share | | $ | [removed: 0.40] [added: 0.52] | | | $ | [removed: —] [added: 0.40] | | | $ | — | | | $ | — | | | $ | — | |
| Cash and cash equivalents | | $ | [removed: 127,462] [added: 190,282] | | | $ | [removed: 10,171] [added: 127,462] | | | $ | [removed: 11,472] [added: 10,171] | | | $ | [removed: 34,787] [added: 11,472] | | | $ | [removed: 30,174] [added: 34,787] | |
| Current assets | | [removed: 584,653] | [added: 706,229] | | | [removed: 382,622] | [added: 584,653] | | | [removed: 381,730] | [added: 382,622] | | | [removed: 403,772] | [added: 381,730] | | | [removed: 309,730] | [added: 403,772] | |
| Total assets | | [removed: 3,068,424] | [added: 3,545,283] | | | [removed: 2,696,247] | [added: 3,068,424] | | | [removed: 2,466,504] | [added: 2,696,247] | | | [removed: 2,206,866] | [added: 2,466,504] | | | [removed: 1,908,840] | [added: 2,206,866] | |
| Current liabilities | | [removed: 351,049] | [added: 356,732] | | | [removed: 288,636] | [added: 351,049] | | | [removed: 285,402] | [added: 288,636] | | | [removed: 255,638] | [added: 285,402] | | | [removed: 232,122] | [added: 255,638] | |
| Long-term debt (including current maturities) | | [removed: 95,000] | [added: 45,000] | | | [removed: 104,975] | [added: 95,000] | | | [removed: 133,805] | [added: 104,975] | | | [removed: 155,714] | [added: 133,805] | | | [removed: 191,429] | [added: 155,714] | |
| Shareholders’ equity | | [removed: 2,276,854] | [added: 2,680,483] | | | [removed: 1,851,158] | [added: 2,276,854] | | | [removed: 1,684,637] | [added: 1,851,158] | | | [removed: 1,494,064] | [added: 1,684,637] | | | [removed: 1,232,082] | [added: 1,494,064] | |
| [removed: (2)] [added: (1)] | Our 2017 net income includes a provisional tax benefit of $104.9 million due to the remeasurement of our deferred taxes to reflect the impact of the Tax Act. |
| | | | | | | | | | | | | | | | | | | | | |
| | |
| --- | --- |
| (1) | For the purpose of this table, interest expense is presented net of interest income. |
Item 8. FINANCIAL STATEMENTS AND SUPPLEMENTARY DATA
225 rewritten, 62 added, 79 removed, 302 unchanged
| (In thousands, except share and per share data) | | [added: 2018 | | | |] 2017 | | | | 2016 | | |
| Cash and cash equivalents [added: at beginning of year] | | [removed: $] | 127,462 | | | [removed: $] | 10,171 | | [added: | | 11,472 | |]
| Customer receivables, less allowances of [removed: $9,465] [added: $9,913] and [removed: $8,346,] [added: $9,465,] respectively | | [removed: 394,169] | [added: 427,569] | | | [removed: 320,087] | [added: 394,169] | |
| Other receivables | | [removed: 21,612] | [added: 40,691] | | | [removed: 14,402] | [added: 21,612] | |
| Prepaid expenses and other current assets | | [removed: 41,410] | [added: 47,687] | | | [removed: 37,962] | [added: 41,410] | |
| Total current assets | | [removed: 584,653] | [added: 706,229] | | | [removed: 382,622] | [added: 584,653] | |
| Revenue equipment | | [removed: 1,591,036] | [added: 1,811,233] | | | [removed: 1,496,697] | [added: 1,591,036] | |
| Land and structures | | [removed: 1,548,079] | [added: 1,796,868] | | | [removed: 1,377,106] | [added: 1,548,079] | |
| Other fixed assets | | [removed: 432,146] | [added: 454,432] | | | [removed: 402,482] | [added: 432,146] | |
| Leasehold improvements | | [removed: 8,668] | [added: 10,619] | | | [removed: 8,699] | [added: 8,668] | |
| Total property and equipment | | [removed: 3,579,929] | [added: 4,073,152] | | | [removed: 3,284,984] | [added: 3,579,929] | |
| Less: Accumulated depreciation | | [removed: (1,175,470] | [added: (1,318,209] | ) | | [removed: (1,043,582] | [added: (1,175,470] | ) |
| Net property and equipment | | [removed: 2,404,459] | [added: 2,754,943] | | | [removed: 2,241,402] | [added: 2,404,459] | |
| Goodwill | | [added: |] 19,463 | | | | 19,463 | | [removed: |]
| Other assets | | [removed: 59,849] | [added: 64,648] | | | [removed: 52,760] | [added: 59,849] | |
| Total assets | | $ | [removed: 3,068,424] [added: 3,545,283] | | | $ | [removed: 2,696,247] [added: 3,068,424] | |
| Accounts payable | | $ | [removed: 73,729] [added: 78,518] | | | $ | [removed: 89,216] [added: 73,729] | |
| Compensation and benefits | | [removed: 152,566] | [added: 198,456] | | | [removed: 129,170] | [added: 152,566] | |
| Claims and insurance accruals | | [removed: 49,949] | [added: 53,263] | | | [removed: 47,417] | [added: 49,949] | |
| Other accrued liabilities | | [removed: 24,805] | [added: 26,495] | | | [removed: 22,833] | [added: 24,805] | |
| Current maturities of long-term debt | | [removed: 50,000] | [added: —] | | | [removed: —] | [added: 50,000] | |
| Total current liabilities | | [removed: 351,049] | [added: 356,732] | | | [removed: 288,636] | [added: 351,049] | |
| Long-term debt | | [removed: 45,000] | [added: 45,000] | | | [removed: 104,975] | [added: 45,000] | |
| Other non-current liabilities | | [removed: 205,561] | [added: 215,399] | | | [removed: 178,879] | [added: 205,561] | |
| Deferred income taxes | | [removed: 189,960] | [added: 247,669] | | | [removed: 272,599] | [added: 189,960] | |
| Total long-term liabilities | | [removed: 440,521] | [added: 508,068] | | | [removed: 556,453] | [added: 440,521] | |
| Total liabilities | | [removed: 791,570] | [added: 864,800] | | | [removed: 845,089] | [added: 791,570] | |
| Common stock - $0.10 par value, 140,000,000 shares authorized, [removed: 82,375,945] [added: 81,231,131] and [removed: 82,416,657] [added: 82,375,945] shares outstanding at December 31, [removed: 2017] [added: 2018] and [removed: 2016,] [added: 2017,] respectively | | [removed: 8,238] | [added: 8,123] | | | [removed: 8,242] | [added: 8,238] | |
| Capital in excess of par value | | [removed: 138,359] | [added: 142,176] | | | [removed: 135,466] | [added: 138,359] | |
| Retained earnings | | [removed: 2,130,257] | [added: 2,530,184] | | | [removed: 1,707,450] | [added: 2,130,257] | |
| Total shareholders’ equity | | [removed: 2,276,854] | [added: 2,680,483] | | | [removed: 1,851,158] | [added: 2,276,854] | |
| Total liabilities and shareholders’ equity | | $ | [removed: 3,068,424] [added: 3,545,283] | | | $ | [removed: 2,696,247] [added: 3,068,424] | |
| (In thousands, except share and per share data) | | [removed: 2017 | | | | 2016] [added: 2018] | | | | [removed: 2015] [added: 2017] | | |
| Revenue from operations | | $ | [removed: 3,358,112] [added: 4,043,695] | | | $ | [removed: 2,991,517] [added: 3,358,112] | | | $ | [removed: 2,972,442] [added: 2,991,517] | |
| Salaries, wages and benefits | | [removed: 1,802,440] | [added: 2,075,602] | | | [removed: 1,652,055] | [added: 1,802,440] | | | [removed: 1,569,791] | [added: 1,652,055] | |
| Operating supplies and expenses | | [removed: 381,798] | [added: 491,030] | | | [removed: 322,997] | [added: 381,798] | | | [removed: 353,889] | [added: 322,997] | |
| General supplies and expenses | | [removed: 107,733] | [added: 119,180] | | | [removed: 86,626] | [added: 107,733] | | | [removed: 89,308] | [added: 86,626] | |
| Operating taxes and licenses | | [removed: 99,778] | [added: 112,210] | | | [removed: 92,426] | [added: 99,778] | | | [removed: 93,292] | [added: 92,426] | |
| Insurance and claims | | [removed: 41,718] | [added: 44,118] | | | [removed: 37,861] | [added: 41,718] | | | [removed: 37,368] | [added: 37,861] | |
| Communications and utilities | | [removed: 27,754] | [added: 31,070] | | | [removed: 27,904] | [added: 27,754] | | | [removed: 26,913] | [added: 27,904] | |
| Cash and cash equivalents | | $ | 190,282 | | | $ | 127,462 | |
| Net Income | | | — | | | | — | | | | — | | | | 605,668 | | | | 605,668 | |
| Share repurchases | | | (1,176 | ) | | | (118 | ) | | | — | | | | (163,147 | ) | | | (163,265 | ) |
| Share-based compensation and restricted share issuances, net of taxes | | | 31 | | | | 3 | | | | 3,817 | | | | — | | | | 3,820 | |
| Balance as of December 31, 2018 | | | 81,231 | | | $ | 8,123 | | | $ | 142,176 | | | $ | 2,530,184 | | | $ | 2,680,483 | |
| Net income | | $ | 605,668 | | | $ | 463,774 | | | $ | 295,765 | |
| Depreciation and amortization | | | 230,357 | | | | 205,763 | | | | 189,867 | |
Our service offerings, which include expedited transportation, are provided through an expansive network of service centers located throughout the United States.
Through strategic alliances, we also provide LTL services throughout North America.
Generally, our performance obligations begin when we receive a BOL from a customer and are satisfied when we complete the delivery of a shipment and related services.
We recognize revenue for our performance obligations under our customer contracts over time, as our customers receive the benefits of our services in accordance with Accounting Standards Update (“ASU”) 2014-09.
Payment terms vary by customer and are short-term in nature.
The related cost for cargo loss and damage and BIPD is
The guidance provides a five-step analysis to determine when and how revenue is recognized and further enhances disclosure requirements.
Our revenue is generated from providing transportation and related services to customers in accordance with the bill of lading (“BOL”) contract, our general tariff provisions and contractual agreements.
Generally, our performance obligations begin when we receive a BOL from a customer and are satisfied when we complete the delivery of a shipment and related services.
We recognize revenue for our performance obligations under our customer contracts over time, as our customers receive the benefits of our services in accordance with ASU 2014-09.
With respect to services not completed at the end of a reporting period, we use a percentage of completion method to allocate the appropriate revenue to each separate reporting period.
Under this method, we develop a factor for each uncompleted shipment by dividing the actual number of days in transit at the end of a reporting period by that shipment’s standard delivery time schedule.
This factor is applied to the total revenue for that shipment and revenue is allocated between reporting periods accordingly.
Payment terms vary by customer and are short-term in nature.
In July 2018, the FASB issued ASU 2018-11, “Leases (Topic 842): Targeted Improvements,” which provides companies with an additional optional transition method to apply the new standard to leases in effect at the adoption date through a cumulative effect adjustment.
We will adopt the new lease standard as of January 1, 2019 using this optional transition method.
We plan to elect the package of practical expedients referenced in ASU 2016-02, which permits companies to retain original lease identification and classification without reassessing initial direct costs for existing leases.
We also plan to elect the practical expedient that exempts leases with an initial lease term of less than twelve months, as well as the practical expedient that allows companies to select, by class of underlying asset, not to separate lease and non-lease components.
Our adoption of this standard is expected to result in the recognition of a right-of-use asset and a lease liability on our Balance Sheet of between $65 million and $70 million, with an immaterial impact, if any, on our Statement of Operations; however, our estimate is subject to change as we finalize our implementation.
We are also implementing enhanced internal controls to comply with the reporting and disclosure requirements of the standard.
| (In thousands) | | 2018 | | | | 2017 | | |
A second scheduled principal payment of $45.0 million is due on January 3, 2021.
The Credit Agreement originally provided
As of December 31, 2018, our only long-term debt was $45 million, which will mature in 2021.
| 2021 | | | 11,398 | |
| 2022 | | | 9,251 | |
| 2023 | | | 6,775 | |
| | | $ | 108,709 | |
In 2018, we completed our accounting for the effects of the Tax Act and no material changes in our initial estimate were required.
| (In thousands) | | 2018 | | | | 2017 | | | | 2016 | | |
| Total provision for income taxes | | $ | 209,845 | | | $ | 112,058 | | | $ | 181,822 | |
| (In thousands) | | 2018 | | | | 2017 | | |
Congdon (which expired in accordance with its terms on November 1, 2018) and our employment agreement with David S.
OLD DOMINION FREIGHT LINE, INC.
| | | | | | | | | |
| | | | | | | | | | | | | |
| | | | | | | | | | | | | | | | | | | | | |
| Balance as of December 31, 2014 | | 86,094 | | | | $ | 8,609 | | | $ | 134,401 | | | $ | 1,351,054 | | | $ | 1,494,064 | |
| Net income | | — | | | | — | | | | — | | | | 304,690 | | | | 304,690 | | |
| Share repurchases | | (1,682 | | ) | | (168 | | ) | | — | | | | (113,949 | | ) | | (114,117 | | ) |
| Cash and cash equivalents at beginning of year | | 10,171 | | | | 11,472 | | | | 34,787 | | |
Generally, this occurs when we complete the delivery of a shipment.
NOTES TO THE FINANCIAL STATEMENTS (CONTINUED)
| | | |
The carrying value of our revolving credit facility approximates fair value due to the variable interest rates of the facility that correlate with current market rates.
Supplemental Disclosure of Noncash Investing and Financing Activities
Investing and financing activities that are not reported in the Statements of Cash Flows due to their non-cash nature are summarized below:
| Acquisition of property and equipment by capital lease | | $ | — | | | $ | — | | | $ | 3,552 | |
In August 2016, the FASB issued ASU 2016-15, "Classification of Certain Cash Receipts and Cash Payments" (Topic 230) to address how certain cash receipts and cash payments are presented and classified in the statement of cash flows.
This ASU is intended to reduce diversity in practice in the classification of certain transactions on the statement of cash flows.
The ASU is effective for public companies for fiscal years beginning after December 15, 2017, and early adoption is permitted.
We early adopted the provisions of ASU 2016-15 as of January 1, 2017.
The adoption resulted in proceeds from Company-owned life insurance policies being classified as cash flows from investing activities, rather than cash flows from operating activities on our Statements of Cash Flows.
In January 2017, the FASB issued ASU 2017-04, "Intangibles - Goodwill and Other" (Topic 350).
This ASU is intended to simplify the subsequent measurement of goodwill and reduces the complexity of evaluating goodwill for impairment.
Under this ASU, an entity no longer will determine goodwill impairment by calculating the implied fair value of goodwill by assigning the fair value of a reporting unit to all of its assets and liabilities as if that reporting unit had been acquired in a business combination.
This ASU is effective for annual or interim goodwill impairment tests in fiscal years beginning after December 15, 2019.
Early adoption is permitted for interim or annual goodwill impairment tests performed on testing dates after January 1, 2017.
We early adopted the provisions of ASU 2017-04 in 2017.
The adoption did not have an impact on our financial position, results of operations or cash flows.
In August 2015, the FASB issued ASU 2015-14, "Revenue from Contracts with Customers", which deferred the effective date for ASU 2014-09 by one year to fiscal years beginning after December 15, 2017 and also provided for the option to early adopt for fiscal years beginning after December 15, 2016.
We completed our evaluation of the impact of ASU 2014-09 on our financial reporting and disclosures, including but not limited to our accounting policies, internal controls and processes.
application effective January 1, 2018.
Based on our assessment, upon adoption, ASU 2014-09 will not have a material impact on our financial position, results of operations or cash flows.
Early adoption is permitted.
We are continuing to evaluate the impact of this new standard on our financial reporting and disclosures.
We utilize the Sweep Program to manage our daily cash needs, as it automatically initiates borrowings to cover overnight cash requirements primarily for working capital needs.
Loans under the Sweep Program bear interest at LIBOR plus applicable margin rate.
Wells Fargo, as administrative agent, also receives an annual fee for providing administrative services.
Letter of credit fees remained at 1.0% during each of the years ended December 31, 2017 and 2016.
Our senior note agreement and Credit Agreement contain customary
As of December 31, 2017, aggregate maturities of long-term debt are as follows:
| | | | |
An excerpt. Shown here: 40 of 225 rewritten, 40 of 62 added and 40 of 79 removed. The counts are complete. For every sentence, read Item 8. FINANCIAL STATEMENTS AND SUPPLEMENTARY DATA in the FY2018 filing and the FY2017 filing.
Item 9A. CONTROLS AND PROCEDURES
7 rewritten, 1 added, 4 removed, 30 unchanged
Management has conducted an evaluation, with the participation of our CEO and CFO, of the effectiveness of our internal control over financial reporting as of December 31, [removed: 2017] [added: 2018] based on the framework in Internal Control – Integrated Framework issued by the Committee of Sponsoring Organizations of the Treadway Commission (the [removed: "2013 Framework").][added: “2013 Framework”).]
Management concluded that our internal control over financial reporting was effective as of December 31, [removed: 2017,] [added: 2018,] based on our evaluation under the 2013 Framework.
The effectiveness of our internal control over financial reporting as of December 31, [removed: 2017] [added: 2018] has been audited by Ernst & Young LLP, an independent registered public accounting firm, as stated in its report dated February 27, [removed: 2018,] [added: 2019,] which is included herein.
We have audited Old Dominion Freight Line, Inc.’s internal control over financial reporting as of December 31, [removed: 2017,] [added: 2018,] based on criteria established in Internal Control-Integrated Framework issued by the Committee of Sponsoring Organizations of the Treadway Commission (2013 framework) (the COSO criteria).
In our opinion, Old Dominion Freight Line, Inc. (the Company) maintained, in all material respects, effective internal control over financial reporting as of December 31, [removed: 2017,] [added: 2018,] based on the COSO criteria.
We also have audited, in accordance with the standards of the Public Company Accounting Oversight Board (United States) (PCAOB), the balance sheets of the Company as of December 31, [removed: 2017] [added: 2018] and [removed: 2016,] [added: 2017,] the related statements of operations, changes in shareholders’ equity and cash flows for each of the three years in the period ended December 31, [removed: 2017,] [added: 2018,] and the related notes and financial statement schedule listed in the Index at Item [removed: 15(a)(2),] [added: 15(a)(2)] and our report dated February 27, [removed: 2018] [added: 2019] expressed an unqualified opinion thereon.
[removed: | | | |] /s/ Ernst & Young LLP [removed: | |]
February 27, 2019
| | |
| | | | | |
| --- | --- | --- | --- | --- |
February 27, 2018
Item 10. DIRECTORS, EXECUTIVE OFFICERS AND CORPORATE GOVERNANCE
2 rewritten, 0 added, 0 removed, 2 unchanged
The information required by Item 10 of Form 10-K will appear in the Company’s proxy statement for its [removed: 2018] [added: 2019] Annual Meeting of Shareholders under the captions “Proposal 1 – Election of Directors,” “Executive Officers,” “Section 16(a) Beneficial Ownership Reporting Compliance,” “Corporate Governance – Attendance and Committees of the Board – Audit Committee,” and “Corporate Governance – Director Nominations,” and the information therein is incorporated herein by reference.
Our Code of Business Conduct is publicly available and is posted on our website at [removed: http://www.odfl.com/Content/corpGovernance.faces.][added: https://ir.odfl.com/governance-docs.]
Item 11. EXECUTIVE COMPENSATION
1 rewritten, 0 added, 0 removed, 0 unchanged
The information required by Item 11 of Form 10-K will appear in the Company’s proxy statement for its [removed: 2018] [added: 2019] Annual Meeting of Shareholders under the captions “Corporate Governance – Compensation Committee Interlocks and Insider Participation,” “Compensation Discussion and Analysis,” “Compensation Committee Report,” “Executive Compensation,” and “Director Compensation,” and the information therein is incorporated herein by reference.
Item 12. SECURITY OWNERSHIP OF CERTAIN BENEFICIAL OWNERS AND MANAGEMENT AND RELATED STOCKHOLDER MATTERS
1 rewritten, 0 added, 0 removed, 0 unchanged
The information required by Item 12 of Form 10-K will appear in the Company’s proxy statement for its [removed: 2018] [added: 2019] Annual Meeting of Shareholders under the captions “Equity Compensation Plan Information” and “Security Ownership of Management and Certain Beneficial Owners,” and the information therein is incorporated herein by reference.
Item 13. CERTAIN RELATIONSHIPS AND RELATED TRANSACTIONS, AND DIRECTOR INDEPENDENCE
1 rewritten, 0 added, 0 removed, 0 unchanged
The information required by Item 13 of Form 10-K will appear in the Company’s proxy statement for the [removed: 2018] [added: 2019] Annual Meeting of Shareholders under the captions “Corporate Governance – Independent Directors” and “Related Person Transactions,” and the information therein is incorporated herein by reference.
Item 14. PRINCIPAL ACCOUNTING FEES AND SERVICES
1 rewritten, 0 added, 0 removed, 1 unchanged
The information required by Item 14 of Form 10-K will appear in the Company’s proxy statement for its [removed: 2018] [added: 2019] Annual Meeting of Shareholders under the captions “Corporate Governance – Audit Committee Pre-Approval Policies and Procedures” and “Independent Registered Public Accounting Firm Fees and Services,” and the information therein is incorporated herein by reference.
Item 15. EXHIBITS, FINANCIAL STATEMENT SCHEDULES
11 rewritten, 1 added, 4 removed, 17 unchanged
[removed: |] (a)(1) [removed: |] Financial Statements. [removed: |]
Balance Sheets – December 31, [removed: 2017] [added: 2018] and December 31, [removed: 2016][added: 2017]
Statements of Operations – Years ended December 31, [removed: 2017,] [added: 2018,] December 31, [removed: 2016] [added: 2017] and December 31, [removed: 2015][added: 2016]
Statements of Changes in Shareholders’ Equity – Years ended December 31, [removed: 2017,] [added: 2018,] December 31, [removed: 2016] [added: 2017] and December 31, [removed: 2015][added: 2016]
Statements of Cash Flows – Years ended December 31, [removed: 2017,] [added: 2018,] December 31, [removed: 2016] [added: 2017] and December 31, [removed: 2015][added: 2016]
[removed: |] (a)(2) [removed: |] Financial Statement Schedules. [removed: |]
| (In thousands) | | Allowance for Uncollectible [removed: Accounts(1)] [added: Accounts (1)] | | | | | | | | | | | | | | |
| Year Ended December 31, | | Balance at Beginning of Period | | | | Charged to Expense | | | | [removed: Deductions(2)] [added: Deductions (2)] | | | | Balance at End of Period | | |
[removed: |] (a)(3) [removed: |] Exhibits Filed. [removed: |]
[removed: |] (b) [removed: |] Exhibits. [removed: |]
[removed: |] (c) [removed: |] Separate Financial Statements and Schedules. [removed: |]
| 2018 | | $ | 3,488 | | | $ | 3,846 | | | $ | 3,702 | | | $ | 3,632 | |
| | |
| --- | --- |
| | | | | | | | | | | | | | | | | |
| 2015 | | $ | 5,564 | | | $ | 1,511 | | | $ | 2,622 | | | $ | 4,453 | |
Item 16. FORM 10-K SUMMARY
25 rewritten, 11 added, 8 removed, 127 unchanged
FOR YEAR ENDED DECEMBER 31, [removed: 2017][added: 2018]
| 4.1 | | [Specimen certificate of Common Stock (Incorporated by reference to the exhibit of the same number contained in the [removed: Company’s Annual] [added: Company's Quarterly] Report on Form [removed: 10-K] [added: 10-Q] for the [removed: year] [added: quarter] ended [removed: December 31, 2012,] [added: June 30, 2018,] filed on [removed: February 28, 2013)](http://www.sec.gov/Archives/edgar/data/878927/000087892713000012/odflexhibit41specimencerti.htm)] [added: August 7, 2018)](http://www.sec.gov/Archives/edgar/data/0000878927/000087892718000042/odflexhibit41.htm)] |
| [removed: 4.9] [added: 4.11] | | [Note Purchase Agreement among Old Dominion Freight Line, Inc. and the Purchasers set forth in Schedule A thereto, dated as of [removed: April 25, 2006] [added: January 3, 2011] (Incorporated by reference to the exhibit of the same number contained in the Company’s Current Report on Form 8-K filed on [removed: May 1, 2006)](http://www.sec.gov/Archives/edgar/data/878927/000119312506094582/dex49.htm)] [added: January 6, 2011)](http://www.sec.gov/Archives/edgar/data/878927/000129993311000081/exhibit2.htm)] |
| 10.18.11* | | [Old Dominion Freight Line, Inc. Non-Employee Director Compensation Structure, effective as of the 2018 Annual Meeting of [removed: Shareholders](https://www.sec.gov/Archives/edgar/data/878927/000087892718000005/ex-101811.htm)] [added: Shareholders (Incorporated by reference to the exhibit of the same number contained in the Company’s Annual Report on Form 10-K for the year ended December 31, 2017, filed on February 27, 2018)](http://www.sec.gov/Archives/edgar/data/878927/000087892718000005/ex-101811.htm)] |
| 23.1 | | [Consent of Ernst & Young [removed: LLP](https://www.sec.gov/Archives/edgar/data/878927/000087892718000005/odflexhibit231-consentq420.htm)] [added: LLP](https://www.sec.gov/Archives/edgar/data/878927/000156459019004755/odfl-ex231_16.htm)] |
| 31.1 | | [Certification Pursuant to Rule 13a-14(a) or 15d-14(a) of the Exchange Act, as Adopted Pursuant to Section 302 of the Sarbanes-Oxley Act of [removed: 2002](https://www.sec.gov/Archives/edgar/data/878927/000087892718000005/odflexhibit311-q42017.htm)] [added: 2002](https://www.sec.gov/Archives/edgar/data/878927/000156459019004755/odfl-ex311_13.htm)] |
| 31.2 | | [Certification Pursuant to Rule 13a-14(a) or 15d-14(a) of the Exchange Act, as Adopted Pursuant to Section 302 of the Sarbanes-Oxley Act of [removed: 2002](https://www.sec.gov/Archives/edgar/data/878927/000087892718000005/odflexhibit312-q42017.htm)] [added: 2002](https://www.sec.gov/Archives/edgar/data/878927/000156459019004755/odfl-ex312_12.htm)] |
| 32.1 | | [Certification Pursuant to 18 U.S.C Section 1350, as Adopted Pursuant to Section 906 of the Sarbanes-Oxley Act of [removed: 2002](https://www.sec.gov/Archives/edgar/data/878927/000087892718000005/odflexhibit321-q42017.htm)] [added: 2002](https://www.sec.gov/Archives/edgar/data/878927/000156459019004755/odfl-ex321_15.htm)] |
| 32.2 | | [Certification Pursuant to 18 U.S.C Section 1350, as Adopted Pursuant to Section 906 of the Sarbanes-Oxley Act of [removed: 2002](https://www.sec.gov/Archives/edgar/data/878927/000087892718000005/odflexhibit322-q42017.htm)] [added: 2002](https://www.sec.gov/Archives/edgar/data/878927/000156459019004755/odfl-ex322_14.htm)] |
| 101 | | The following financial information from our Annual Report on Form 10-K for the year ended December 31, [removed: 2017,] [added: 2018,] filed on February 27, [removed: 2018,] [added: 2019,] formatted in XBRL (eXtensible Business Reporting Language) includes: (i) the Balance Sheets at December 31, [removed: 2017] [added: 2018] and [removed: 2016,] [added: 2017,] (ii) the Statements of Operations for the years ended December 31, [removed: 2017, 2016] [added: 2018, 2017] and [removed: 2015,] [added: 2016,] (iii) the Statements of Changes in Shareholders’ Equity for the years ended December 31, [removed: 2017, 2016] [added: 2018, 2017] and [removed: 2015,] [added: 2016,] (iv) the Statements of Cash Flows for the years ended December 31, [removed: 2017, 2016] [added: 2018, 2017] and [removed: 2015,] [added: 2016,] and (v) the Notes to the Financial Statements |
[removed: |] Our SEC file number reference for documents filed with the SEC pursuant to the Securities Exchange Act of 1934, as amended, is 0-19582. [removed: | |]
| | | [removed: |] OLD DOMINION FREIGHT LINE, INC. | | | [removed: | |]
| [removed: Dated: | February 27, 2018 | |] [added: David S. Congdon] | | [removed: By:] | | [removed: /s/ DAVID S. CONGDON] |
| /s/ EARL E. CONGDON | | [added: Senior] Executive Chairman of the Board of Directors | | February 27, [removed: 2018] [added: 2019] |
| /s/ DAVID S. CONGDON | | [removed: Vice] [added: Executive] Chairman of the Board of Directors | | February 27, [removed: 2018] [added: 2019] |
| [removed: David S. Congdon] | | [added: | | President] and Chief Executive Officer [removed: | |] [added: (Principal Executive Officer)] |
| [added: Greg C. Gantt] | | (Principal Executive Officer) | | |
| /s/ JOHN R. CONGDON, JR. | | Director | | February 27, [removed: 2018] [added: 2019] |
| /s/ BRADLEY R. GABOSCH | | Director | | February 27, [removed: 2018] [added: 2019] |
| /s/ PATRICK D. HANLEY | | Director | | February 27, [removed: 2018] [added: 2019] |
| /s/ JOHN D. KASARDA | | Director | | February 27, [removed: 2018] [added: 2019] |
| /s/ LEO H. SUGGS | | Director | | February 27, [removed: 2018] [added: 2019] |
| /s/ D. MICHAEL WRAY | | Director | | February 27, [removed: 2018] [added: 2019] |
| /s/ ADAM N. SATTERFIELD | | Senior Vice President – Finance, | | February 27, [removed: 2018] [added: 2019] |
| /s/ KIMBERLY S. MAREADY | | Vice President [removed: -] [added: –] Accounting and Finance | | February 27, [removed: 2018] [added: 2019] |
| 10.17.23* | | [Third Amendment to Amended and Restated Employment Agreement, effective May 16, 2018, by and between Old Dominion Freight Line, Inc. and David S. Congdon (Incorporated by reference to the exhibit of the same number contained in the Company’s Current Report on Form 8-K/A filed on May 17, 2018)](http://www.sec.gov/Archives/edgar/data/878927/000087892718000023/exhibit101723htm.htm) |
| 10.19.12* | | [Old Dominion Freight Line, Inc. Change of Control Severance Plan for Key Executives (As Amended and Restated Effective October 31, 2018) (Incorporated by reference to the exhibit of the same number contained in the Company’s Current Report on Form 8-K filed on November 1, 2018)](http://www.sec.gov/Archives/edgar/data/878927/000087892718000052/ex10191211118.htm) |
| 10.21.1* | | [Old Dominion Freight Line, Inc. Performance Incentive Plan (As Amended and Restated Through January 30, 2019)](https://www.sec.gov/Archives/edgar/data/878927/000156459019004755/odfl-ex10211_188.htm) |
| 10.23.3* | | [Form of Old Dominion Freight Line, Inc. 2016 Stock Incentive Plan Restricted Stock Unit Agreement (Performance-Based) (Employees)](https://www.sec.gov/Archives/edgar/data/878927/000156459019004755/odfl-ex10233_187.htm) |
| Dated: | February 27, 2019 | | By: | /s/ GREG C. GANTT |
| | | | | Greg C. Gantt |
| --- | --- | --- | --- | --- |
| /s/ SHERRY A. AAHOLM | | Director | | February 27, 2019 |
| Sherry A. Aaholm | | | | |
| /s/ GREG C. GANTT | | President, Chief Executive Officer and Director | | February 27, 2019 |
| | | | | |
| | | |
| | |
| | | | | | | | |
| --- | --- | --- | --- | --- | --- | --- | --- |
| | | | | | | | David S. Congdon |
| | | | | | | | Vice Chairman of the Board of Directors and Chief Executive Officer |
| /s/ ROBERT G. CULP, III | | Director | | February 27, 2018 |
| Robert G. Culp, III | | | | |