 filings.tools
Old Dominion Freight Line (ODFL) 10-K risk factor changes: FY2021 vs FY2020
The 2021-12-31 10-K against the 2020-12-31 one, compared heading by heading and sentence by sentence.
Item 1A42 rewritten13 added7 removed286 unchanged
All filing items459 rewritten168 added177 removed1,167 unchanged
Summary
counted, not written
- Item 1A headings could not be compared: only 0 carried over between the two years, which usually means one filing was read wrongly, so none is reported as new or removed.
- Sentence by sentence, 168 added, 177 removed, 459 rewritten and 1,167 unchanged across 18 items that differ.
- New this year: Item 9C. DISCLOSURE REGARDING FOREIGN JURISDICTIONS THAT PREVENT INSPECTIONS.
Sentences by item
23 items, with every count and a link to each item that changed
Underlined words on a shaded ground are new in FY2021; struck-through words were in FY2020. Sentences that are wholly new or wholly gone are labelled rather than marked.
Item 1A. RISK FACTORS
42 rewritten, 13 added, 7 removed, 286 unchanged
| | • | we may find it more difficult to maintain our corporate culture, which we believe has been a key contributor to our success; [removed: and] |
| | • | expanding our service offerings may require us to enter into new markets and encounter new competitive [removed: challenges.] [added: challenges; and] |
The novel coronavirus (COVID-19) [removed: pandemic] [added: pandemic, the governmental/social responses thereto] and the related changes in the economic and political conditions in markets in which we operate have had adverse impacts on our business, results of operations and financial condition, and on those of our customers and suppliers, and these adverse impacts may continue.
These impacts and potential impacts include, among other things, significant reductions or volatility in demand for our services, inability of our customers to [added: timely] pay for our services, and failure of our suppliers or third-party service providers to meet their obligations to us.
Furthermore, COVID-19 has impacted and may further impact the global economy, including negatively impacting the proper functioning of financial and capital markets and interest rates, which [added: at times] has impacted the cost of capital and [removed: has] limited access to capital.
As the COVID-19 pandemic continues to adversely affect our business, results of operations and financial condition, it has heightened, and will likely continue to heighten, other risks to which we are subject, including those related to economic downturns, customer/supplier/vendor operations, [added: labor issues, inflationary pressures, supply chain disruptions,] changes in political and regulatory conditions, liquidity, and industry pricing environment stability, as described in further detail in other risk factors.
We do not believe the loss of any one customer would materially impact our business and revenue growth due to the diversity of our customer [removed: base and no individual customer accounting for more than 5% of our revenue.][added: base.]
[removed: Limited] [added: | | • | limited] supply and increased costs of new equipment may adversely affect our [removed: earnings] [added: profitability] and cash [removed: flow.][added: flows. |]
We may face difficulty in purchasing new equipment due to decreased supply [removed: and] [added: or] increased costs.
Investment in new equipment is a significant part of our annual capital expenditures and we require an available supply of [removed: tractors] [added: tractors, trailers,] and [removed: trailers from] [added: other freight handling] equipment [added: from] manufacturers to operate and grow our business.
[removed: We may also be subject to shortages in raw materials that] are required for the production of critical operating equipment and supplies, such as shortages in rubber or steel.
[removed: The] [added: In addition, the availability and] price of our equipment may also be adversely affected in the future by regulations on newly manufactured [removed: tractors] [added: equipment] and [removed: diesel] engines.
We are subject to regulations issued by the U.S. Environmental Protection Agency (the “EPA”) and various state agencies, particularly the California Air Resources Board (“CARB”), that have required progressive reductions in exhaust [removed: emissions from diesel engines.][added: emissions.]
[added: We are also unable to] predict how any future changes in U.S. government policy will affect EPA and CARB regulation and enforcement.
[removed: We] [added: We] have significant ongoing cash requirements that could limit our growth and affect our profitability if we are unable to obtain sufficient [removed: capital.][added: capital.]
As further described in Part II, Item 7 of this Annual Report on Form 10-K, we generally finance our capital expenditures and planned growth with existing cash, cash [removed: flow] [added: flows] from operations, issuance of debt (including pursuant to our note purchase and private shelf agreement) and through available borrowings under our existing senior unsecured credit agreement.
If our cash requirements are high or our cash [removed: flow] [added: flows] from operations is low during particular periods, we may need to seek additional financing, which could be costly or difficult to obtain.
[removed: We] [added: We] may be unable to successfully consummate and integrate [removed: acquisitions as part of our growth strategy.][added: acquisitions.]
[removed: We] [added: We] are subject to various risks arising from our international business operations and relationships, which could adversely affect our [removed: business.][added: business.]
| | • | advances in technology require increased investments to remain competitive, [added: technological transitions may cause operational challenges] and our customers may not be willing to accept higher prices to cover the cost of these investments; |
[removed: Difficulties attracting] [added: Increases in employee compensation] and [removed: retaining] [added: benefit packages used to attract and retain] qualified [added: employees, including] drivers and maintenance [removed: technicians could result in increases in driver and technician compensation] [added: technicians,] and [added: addressing general labor market challenges] could adversely affect our profitability, our ability to maintain or grow our fleet and our ability to maintain our customer relationships.
Recently, there has been intense competition for qualified [removed: drivers] [added: employees, specifically drivers,] in the transportation industry resulting from a shortage of [removed: drivers.][added: drivers and general labor market challenges.]
As [removed: a result,] [added: the available pool of qualified drivers has been declining,] we have faced, and may continue to face, difficulty maintaining or increasing our number of drivers.
The compensation [added: and benefit packages] we offer our [removed: drivers and] [added: drivers,] technicians [added: and other specialized employees] is subject to market conditions that [added: have required and] may [added: in the future] require [added: further] increases in [removed: driver or technician compensation.][added: wages and benefits.]
If we are unable to attract and retain a sufficient number of qualified drivers and technicians, [added: or address general labor market challenges,] we could be required to adjust our compensation [added: and benefits] packages, amend our hiring standards, or operate with fewer trucks and face difficulty meeting customer demands, any of which could adversely affect our growth and profitability.
[removed: If] [added: If] we are unable to retain our key employees, or if we do not continue to effectively execute our succession plan, our financial condition, results of operations and liquidity could be adversely [removed: affected.][added: affected.]
If we are unable to invest in and enhance or modernize our technology systems in a timely manner or at a reasonable cost, or if we are unable to train our employees to operate the new, enhanced or modernized systems, our results of operations and financial condition could be adversely [added: affected.]
[removed: If] [added: Nevertheless, if] we receive unacceptable CSA scores, and this data is made available to the public, our relationships with our customers could be damaged, which could result in a loss of business.
[removed: We] [added: We] may be adversely affected by legal, regulatory, or market responses to climate change [removed: concerns.][added: concerns.]
Due to increased consideration, there could be an increase in regulation from federal, state and local governments related to our carbon footprint, including with respect to vehicle engine [added: and facility] emissions.
Costs [added: and operational risks] associated with future climate change concerns or environmental laws and regulations, sustainability requirements and related investor expectations could have a material adverse effect on our financial condition, results of operations, liquidity and cash flows.
Healthcare legislation [added: and other mandated benefits-related coverage] may increase our costs for employee healthcare and benefits and reduce our future profitability.
To attract and retain employees, we maintain a competitive [removed: health insurance] [added: and comprehensive benefits] plan for our employees and their dependents.
We cannot predict the impact that any state or federal healthcare [added: or mandated benefit] legislation or regulation will have on our operations, but we expect costs associated with providing benefits under employee medical [removed: plans] [added: plans, paid sick] and [added: family leave programs and] healthcare-related costs associated with workers’ compensation to continue to increase.
Rising [added: employee benefits and] healthcare costs in the U.S. could result in significant long-term costs to us, which could have a material adverse effect on our operating results.
In addition, rising [removed: healthcare] [added: employee benefits and health-related] costs could force us to make further changes to our benefits program, which could negatively impact our ability to attract and retain employees.
[removed: We] [added: We] are subject to the risks of litigation and governmental proceedings, inquiries, notices or investigations which could adversely affect our [removed: business.][added: business.]
[removed: Our principal shareholders control] [added: The Congdon family controls] a large portion of our outstanding common stock.
[removed: Congdon,] David S.
As long as the Congdon family controls a large portion of our voting stock, they may be able to significantly [removed: influence the election of the entire Board of Directors and] [added: impact] the outcome of all matters involving a shareholder vote.
| | • | competition for qualified employees in the transportation industry could adversely affect our profitability; |
Reductions in the available supply or increases in the cost of new equipment may adversely impact our profitability and cash flows.
We may also be subject to shortages in raw materials that
Currently, tractor and trailer manufacturers are experiencing significant shortages of various component parts and supplies, forcing many manufacturers to reduce or suspend their production, which has led to a lower supply of tractors, trailers, and other equipment, higher prices, and lengthened trade cycles.
These regulations, the limited equipment availability, and other supply chain factors have resulted and could continue to result in higher prices for new equipment, which could have a material adverse effect on our business, financial condition, and results of operations, particularly our maintenance expense, mileage productivity, and driver retention.
Our growth may be limited by the availability and cost of third-party transportation used to supplement our workforce and equipment needs.
Our growth strategy depends upon our ability to maintain adequate capacity throughout our service center network to support the transportation service needs of our customers.
In order to maintain adequate capacity to support our customers’ demand for our services we may, from time to time, utilize third-party transportation services to supplement our workforce and equipment needs.
If we are unable to find suitable third-party transportation service providers that meet our high service-delivery standards at a reasonable cost, when needed, our revenue growth and financial results may be adversely impacted.
The extent and duration of the impact of these challenges are subject to numerous factors, including the continuing impact of the COVID-19 pandemic, our stringent hiring standards, behavioral changes, prevailing wage rates and other benefits, health and other insurance costs, inflation, adoption of new or revised employment and labor laws and regulations or government programs, and changing workforce demographics.
The FMCSA is currently reviewing CSA methodology to address deficiencies identified by the National Academy of Sciences, including the possibility of weak or negative correlation between current safety improvement categories and vehicle crash risk.
| --- | --- | --- |
| --- | --- | --- |
We are also unable to
These regulations have resulted in higher prices for tractors and diesel engines and increased operating and maintenance costs, and there can be no assurance that continued increases in pricing or costs will not have an adverse effect on our business and results of operations.
Growth through acquisitions historically has been one of several key components of our LTL growth strategy.
Due in part to the time commitment, physical requirements, our stringent hiring standards, changing workforce demographics and current industry conditions and regulations, the available pool of qualified employee drivers has been declining.
affected.
Earl E.
our Board of Directors.
An excerpt. Shown here: 40 of 42 rewritten, all 13 added and all 7 removed. The counts are complete. For every sentence, read Item 1A. RISK FACTORS in the FY2021 filing and the FY2020 filing.
Item 7. MANAGEMENT’S DISCUSSION AND ANALYSIS OF FINANCIAL CONDITION AND RESULTS OF OPERATIONS
100 rewritten, 56 added, 64 removed, 108 unchanged
This Management’s Discussion and Analysis of Financial Condition and Results of Operations generally discusses our [removed: 2020] [added: 2021] and [removed: 2019] [added: 2020] results and year-to-year comparisons between [removed: 2020] [added: 2021] and [removed: 2019.][added: 2020.]
Discussions of our [removed: 2018] [added: 2019] results and year-to-year comparisons between [removed: 2019] [added: 2020] and [removed: 2018] [added: 2019] that are not included in this Annual Report on Form 10-K can be found in “Management’s Discussion and Analysis of Financial Condition and Results of Operations” in Part II, Item 7 of our Annual Report on Form 10-K for the fiscal year ended December 31, [removed: 2019,] [added: 2020,] which was filed with the Securities and Exchange Commission on February [removed: 26, 2020.][added: 24, 2021.]
Increases in density allow us to maximize our asset utilization and labor productivity, which we measure over many different functional areas of our operations including linehaul load factor, [removed: P&D] [added: pickup and delivery (“P&D”)] stops per hour, P&D shipments per hour, platform pounds handled per hour and platform shipments per hour.
The fuel surcharge is generally designed to offset fluctuations in the cost of our [added: petroleum-based products and is indexed to diesel fuel prices published by the U.S.]
| Salaries, wages and benefits | | | [removed: 51.2] [added: 47.0] | | | | [removed: 51.7] [added: 51.2] | |
| Operating supplies and expenses | | | [removed: 9.3] [added: 10.8] | | | | [removed: 11.5] [added: 9.3] | |
| General supplies and expenses | | | [removed: 2.7] [added: 2.6] | | | | [removed: 3.0] [added: 2.7] | |
| Operating taxes and licenses | | | [removed: 2.9] [added: 2.5] | | | | [removed: 2.8] [added: 2.9] | |
| Insurance and claims | | | [removed: 1.1] [added: 1.0] | | | | [removed: 1.3] [added: 1.1] | |
| Communication and utilities | | | [removed: 0.8] [added: 0.7] | | | | [removed: 0.7] [added: 0.8] | |
| Depreciation and amortization | | | [removed: 6.5] [added: 4.9] | | | | [removed: 6.2] [added: 6.5] | |
| Purchased transportation | | | [removed: 2.4] [added: 3.5] | | | | [removed: 2.2] [added: 2.4] | |
| Miscellaneous expenses, net | | | 0.5 | | | | [removed: 0.7] [added: 0.5] | |
| Total operating expenses | | | [removed: 77.4] [added: 73.5] | | | | [removed: 80.1] [added: 77.4] | |
| Operating income | | | [removed: 22.6] [added: 26.5] | | | | [removed: 19.9] [added: 22.6] | |
| Interest [removed: expense (income),] [added: expense,] net | | | [removed: 0.1] [added: 0.0] | | | | [removed: (0.2] [added: 0.1] | [removed: )] |
| Other expense, net | | | 0.1 | | | | [removed: 0.0] [added: 0.1] | |
| Income before income taxes | | | [removed: 22.4] [added: 26.4] | | | | [removed: 20.1] [added: 22.4] | |
| Provision for income taxes | | | [removed: 5.6] [added: 6.7] | | | | [removed: 5.1] [added: 5.6] | |
| Net income | | | [removed: 16.8] [added: 19.7] | % | | | [removed: 15.0] [added: 16.8] | % |
Key financial and operating metrics for [removed: 2020] [added: 2021] and [removed: 2019] [added: 2020] are presented below:
| | | [removed: 2020] [added: 2021] | | | | [removed: 2019] [added: 2020] | | | | Change | | | | % Change | | |
| Operating ratio | | | [removed: 77.4] [added: 73.5] | % | | | [removed: 80.1] [added: 77.4] | % | | | | | | | | |
| Diluted earnings per share | | $ | [removed: 5.68] [added: 8.89] | | | $ | [removed: 5.10] [added: 5.68] | | | $ | [removed: 0.58] [added: 3.21] | | | | [removed: 11.4] [added: 56.5] | |
| LTL tons *(in thousands)* | | | [removed: 8,770] [added: 10,119] | | | | [removed: 8,964] [added: 8,770] | | | | [removed: (194] [added: 1,349] | [removed: )] | | | [removed: (2.2] [added: 15.4] | [removed: )] |
| LTL shipments *(in thousands)* | | | [removed: 10,869] [added: 12,880] | | | | [removed: 11,491] [added: 10,869] | | | | [removed: (622] [added: 2,011] | [removed: )] | | | [removed: (5.4] [added: 18.5] | [removed: )] |
| LTL weight per shipment *(lbs.)* | | | [removed: 1,614] [added: 1,571] | | | | [removed: 1,560] [added: 1,614] | | | | [removed: 54] [added: (43] | [added: )] | | | [removed: 3.5] [added: (2.7] | [added: )] |
| LTL revenue per hundredweight | | $ | [removed: 22.62] [added: 25.59] | | | $ | [removed: 22.64] [added: 22.62] | | | $ | [removed: (0.02] [added: 2.97] | [removed: )] | | | [removed: (0.1] [added: 13.1] | [removed: )] |
| LTL revenue per shipment | | $ | [removed: 364.94] [added: 402.01] | | | $ | [removed: 353.18] [added: 364.94] | | | $ | [removed: 11.76] [added: 37.07] | | | | [removed: 3.3] [added: 10.2] | |
| LTL revenue per intercity mile | | $ | [removed: 6.42] [added: 7.32] | | | $ | [removed: 6.30] [added: 6.42] | | | $ | [removed: 0.12] [added: 0.90] | | | | [removed: 1.9] [added: 14.0] | |
| LTL intercity miles *(in thousands)* | | | [removed: 617,805] [added: 707,611] | | | | [removed: 644,287] [added: 617,805] | | | | [removed: (26,482] [added: 89,806] | [removed: )] | | | [removed: (4.1] [added: 14.5] | [removed: )] |
| Average length of haul *(miles)* | | | [removed: 925] [added: 935] | | | | [removed: 917] [added: 925] | | | | [removed: 8] [added: 10] | | | | [removed: 0.9] [added: 1.1] | |
As a result, [removed: our] net income and [removed: diluted] earnings per [added: diluted] share increased [removed: 9.3%] [added: by 53.8%] and [removed: 11.4%,] [added: 56.5%,] respectively, in [removed: 2020] [added: 2021] as compared to [removed: 2019.][added: 2020.]
[removed: The decrease in] LTL tons [removed: in 2020 was] [added: per day increased 7.7%, due] primarily [removed: attributable] to a [removed: decline] [added: 10.2% increase] in [added: LTL] shipments [added: per day] that was [removed: partially] offset by [removed: an increase] [added: a 2.2% decrease] in [removed: our] LTL weight per shipment.
January [removed: 2021] [added: 2022] Update
Revenue per day increased [removed: 14.6%] [added: 25.7%] in January [removed: 2021] [added: 2022] compared to the same month last year.
LTL revenue per hundredweight increased [removed: 2.2%] [added: 16.8%] as compared to the same month last year.
LTL revenue per hundredweight, excluding fuel surcharges, increased [removed: 4.1%] [added: 11.0%] as compared to the same month last year.
Salaries, [removed: wages] [added: wages,] and benefits [removed: decreased $68.6] [added: increased $414.1] million, or [removed: 3.2%,] [added: 20.2%,] in [removed: 2020] [added: 2021] as compared to [removed: 2019,] [added: 2020,] due to a [removed: $21.2] [added: $272.0] million [removed: decrease] [added: increase] in the costs attributable to salaries and wages and a [removed: $47.4] [added: $142.1] million [removed: decrease] [added: increase] in [removed: benefits] [added: employee benefit] costs.
The [removed: decrease] [added: increase] in salaries and wages was due [added: primarily] to [removed: a decrease] [added: increases] in the average number of active full-time employees and [removed: improvements] [added: increases] in [removed: productivity.][added: our employees’ wage rates.]
Department of Energy, which reset each week.
| | | 2021 | | | | 2020 | | |
| Work days | | | 252 | | | | 254 | | | | (2 | ) | | | (0.8 | ) |
| Revenue *(in thousands)* | | $ | 5,256,328 | | | $ | 4,015,129 | | | $ | 1,241,199 | | | | 30.9 | |
| Net income *(in thousands)* | | $ | 1,034,375 | | | $ | 672,682 | | | $ | 361,693 | | | | 53.8 | |
Our financial results for 2021 reflect the highest annual revenue and profitability in our Company’s history.
We believe the increase in our annual revenue to $5.3 billion in 2021 was driven by the consistent execution of our long-term strategy of providing superior service to customers at a fair price, while continuing to invest in capacity and technology to support the increased customer demand for our services.
Our revenue growth reflects higher shipment volumes and further improvements in our yield, both of which were supported by the strength of the domestic economy.
The increased freight density in our service center network and improvement in our yield, combined with improved operating efficiencies, led to the 390 basis-point improvement in our operating ratio to 73.5%
for 2021 as compared to 2020.
Revenue increased $1.24 billion, or 30.9%, in 2021 compared to 2020, due to increases in both our LTL tonnage and LTL revenue per hundredweight.
The increase in tonnage resulted from higher LTL shipment volumes that were partially offset by a decrease in LTL weight per shipment.
Our LTL weight per shipment declined due primarily to our continuing efforts to reduce the number of heavy-weighted and larger, harder-to-handle types of shipments in our network.
We believe the increase in LTL shipments was driven by higher customer demand for our superior service, coupled with our available network capacity and the strength of the U.S. domestic economy.
Our LTL revenue per hundredweight increased 13.1% in 2021 compared to 2020.
We believe the increase in LTL revenue per hundredweight was driven by the success of our long-term pricing strategy as well as changes in mix of our freight.
The increase also reflects the positive impact of a decline in weight per shipment and an increase in average length of haul on this metric.
Excluding fuel surcharges, LTL revenue per hundredweight increased 8.8% in 2021 compared to 2020.
Our average number of active full-time employees increased 3,034, or 15.9%, during 2021 as compared to 2020.
Our employees’ salaries and wages also increased as a result of the annual wage increases provided to our employees in September 2021, as well as higher performance-based compensation.
This improvement includes the impact of increases in our linehaul laden load average and P&D shipments per hour as we increased density across our network, as well as declines in our platform shipments per hour as we trained our new employees.
The increase in the costs attributable to employee benefits of $142.1 million, or 27.4%, includes the impact of the increase in the number of full-time employees eligible for our benefits.
Our employee benefit costs also increased due to additional holiday pay benefits provided in 2021 and increases in certain retirement benefit plan costs directly linked to our net income.
In addition, our group health and dental costs increased due to increases in costs per claim, as well as higher claim volumes per covered employee.
The increase in our diesel fuel costs was primarily due to a 60.3% increase in our average cost per gallon of diesel fuel during 2021.
Depreciation and amortization costs were relatively consistent in 2021 as compared to 2020.
While our capital expenditures were significantly higher in 2021 compared to 2020, our 2021 depreciation and amortization costs were impacted by our planned reduction in capital expenditures for revenue equipment in 2020 as we balanced our fleet with volumes, as well as delays in receipt of certain revenue equipment included in our 2021 capital expenditure plan.
We believe depreciation costs will increase in future periods as we execute our 2022 capital expenditure plan.
While our investments in real estate, equipment, and technology can increase our costs in the short-term, we believe these investments are necessary to support our continued long-term growth and strategic initiatives.
Purchased transportation expense increased $87.8 million, or 89.7%, in 2021 as compared to 2020, due primarily to an increase in our use of third-party transportation providers to supplement our workforce and equipment as demand for our services increased.
The increase in our cash flows used in financing activities during 2021 as compared to 2020 was due primarily to increases in share repurchases and cash dividends paid to shareholders.
These increases were partially offset by reductions in proceeds from debt issuances and scheduled principal payments during 2021 as compared to 2020.
Our Credit Agreement and the Note Agreement are described in more detail below under “*Financing Arrangements*”.
| (In thousands) | | 2021 | | | | 2020 | | |
looking to expand.
We historically spend 10% - 15% of our revenue on capital expenditures each year.
Our 2020 capital expenditures were lower than normal, particularly with respect to revenue equipment and real estate, due to economic uncertainty as a result of the COVID-19 pandemic.
On July 28, 2021, we announced that our Board of Directors had approved a new stock repurchase program authorizing us to repurchase up to an aggregate of $2.0 billion of our outstanding common stock (the “2021 Repurchase Program”).
The 2021 Repurchase Program, which does not have an expiration date, began after the completion of the 2020 Repurchase Program.
At December 31, 2021, our stock repurchase programs had $2.02 billion remaining available, including $62.5 million that was deferred until final settlement occurred on our accelerated share repurchase agreement in January 2022.
petroleum-based products and is indexed to diesel fuel prices published by the DOE, which reset each week.
| | | 2020 | | | | 2019 | | |
| Work days | | | 254 | | | | 253 | | | | 1.0 | | | | 0.4 | |
| Revenue *(in thousands)* | | $ | 4,015,129 | | | $ | 4,109,111 | | | $ | (93,982 | ) | | | (2.3 | ) |
| Net income *(in thousands)* | | $ | 672,682 | | | $ | 615,518 | | | $ | 57,164 | | | | 9.3 | |
Despite the difficult operating conditions created by the COVID-19 pandemic, our financial results for 2020 include Company records for profitability and diluted earnings per share.
While our annual revenue decreased slightly as a result of a decrease in our volumes, our LTL revenue per hundredweight increased as we maintained our price discipline throughout the year.
The increase in
our yields along with the increase in productivity allowed us to improve our variable operating costs as a percent of revenue.
We also improved our overhead costs as a percent of revenue due to our control over discretionary spending during the year.
These factors contributed to the 270 basis point improvement in our operating ratio resulting in a new Company record of 77.4% for the year.
Revenue decreased $94.0 million, or 2.3%, in 2020 compared to 2019.
This decline reflects a decrease in LTL tons and a slight decline in our LTL revenue per hundredweight when compared with 2019.
The decrease in LTL shipments was driven by the impact of a slowdown in the domestic economy associated with the COVID-19 pandemic, primarily during the second quarter of 2020.
LTL revenue per hundredweight decreased 0.1% in 2020 compared to 2019.
Our LTL revenue and yield were negatively impacted by a decrease in fuel surcharges that resulted from a significant decline in the average price of diesel fuel for the comparable periods.
The slight decrease in LTL revenue per hundredweight also includes the adverse impact of the increase in our LTL weight per shipment on this metric.
Excluding fuel surcharges, LTL revenue per hundredweight increased 2.5% in 2020 compared to 2019 as a result of the ongoing commitment to our yield management strategy, which is supported by our best-in-class service to customers.
As a percent of revenue, fuel surcharges decreased to 10.5% in 2020 as compared to 12.7% in 2019.
LTL tons per day increased 11.9%, due primarily to a 7.0% increase in LTL shipments per day and a 4.6% increase in LTL weight per shipment.
These decreases were partially offset by the impact of annual wage increases provided to our employees at the beginning of both September of 2019 and 2020 and two special bonuses provided to eligible employees during 2020 in recognition of their outstanding service to our customers during the COVID-19 pandemic.
Our average number of active full-time employees decreased 1,530, or 7.4%, as compared to 2019 as we aligned our headcount with shipment volume trends.
While our productive labor costs as a percentage of revenue were negatively impacted by the deleveraging effect of lower fuel surcharges, we increased the efficiency of our operations with improvements in our linehaul laden load average, P&D shipments and stops per hour and platform pounds and shipments per hour as compared to 2019.
Employee benefit costs decreased $47.4 million in 2020 as compared to 2019, due primarily to a reduction in expense related to our phantom stock plans, which were amended in the fourth quarter of 2019 to allow the awards to be settled in stock and limit our ongoing benefits expense in future periods.
Our employee benefit costs were also lower due to a reduction in group health and dental and workers’ compensation resulting from a decrease in employee headcount and fewer claims per employee during 2020.
Our average cost per gallon of diesel fuel decreased 31.8% in 2020 as compared to 2019.
market price fluctuations.
General supplies and expenses decreased $13.7 million, or 11.0%, in 2020 as compared to 2019, due primarily to lower advertising and marketing costs as we controlled our discretionary spending.
We also benefited from lower travel-related expenses, due to travel restrictions imposed during the COVID-19 pandemic.
While we will continue our discipline in controlling discretionary spending in 2021, we anticipate that certain costs that were reduced in 2020 will be restored in future periods.
Depreciation and amortization increased $7.6 million, or 3.0%, in 2020 as compared to 2019.
While our 2020 capital expenditure plan was lower than in 2019, particularly with respect to revenue equipment and real estate, we believe depreciation expense will continue to increase in future periods as we maintain our focus on expanding capacity to support our anticipated growth and long-term strategic initiatives.
The changes in cash flows used in financing activities for all periods were due primarily to fluctuations in capital returned to shareholders and fluctuations in our long-term debt.
| | | Year Ended December 31, | | | | | | |
We believe our current sources of liquidity will be sufficient to satisfy our expected capital expenditures.
During the years ended December 31, 2020 and 2019, we repurchased 2,507,885 and 2,403,336 shares of our common stock under our repurchase programs for an aggregate of $364.1 million and $241.0 million, respectively.
As of December 31, 2020, we had $555.2 million remaining authorized under the 2020 Repurchase Program.
Split-adjusted quarterly per-share metrics may not recalculate precisely due to rounding.
Senior Note Agreements
We had an unsecured senior note agreement with a principal amount outstanding of $45.0 million at December 31, 2019 (the “Senior Note”).
An excerpt. Shown here: 40 of 100 rewritten, 40 of 56 added and 40 of 64 removed. The counts are complete. For every sentence, read Item 7. MANAGEMENT’S DISCUSSION AND ANALYSIS OF FINANCIAL CONDITION AND RESULTS OF OPERATIONS in the FY2021 filing and the FY2020 filing.
Item 7A. QUANTITATIVE AND QUALITATIVE DISCLOSURES ABOUT MARKET RISK
6 rewritten, 0 added, 0 removed, 11 unchanged
[removed: At December 31, 2020, these] [added: These] investments totaled [added: $254.4 million and] $330.3 [removed: million.][added: million at December 31, 2021 and 2020, respectively.]
A hypothetical 100 basis point change in market interest rates [removed: at December 31, 2020] would have had an immaterial impact on the fair value of these [removed: investments.][added: investments at December 31, 2021 and 2020.]
The cash surrender value in life insurance contracts included on our Balance Sheets at December 31, [removed: 2020] [added: 2021] and [removed: 2019] [added: 2020] was [removed: $65.4] [added: $75.2] million and [removed: $59.0] [added: $65.4] million, respectively.
The portion of underlying investments with exposure to market fluctuations was [removed: $51.2] [added: $59.9] million and [removed: $56.7] [added: $51.2] million at December 31, [removed: 2020] [added: 2021] and [removed: 2019,] [added: 2020,] respectively.
To provide a meaningful assessment of the market risk for investments relating to Company-owned life insurance contracts, we performed a sensitivity analysis using a 10% change in market value in those investments on December 31, [removed: 2020.][added: 2021.]
A 10% change in market value would have caused a [removed: $5.1] [added: $6.0] million and a [removed: $5.7] [added: $5.1] million impact on our pre-tax income in [removed: 2020] [added: 2021] and [removed: 2019,] [added: 2020,] respectively.
Item 1. BUSINESS
36 rewritten, 13 added, 15 removed, 137 unchanged
In addition to numerous service center renovations, expansions, and relocations of existing service centers, we opened [removed: 8, 19] [added: 7, 25] and [removed: 31] [added: 35] new service centers over the past one, five and ten years, respectively, for a total of [removed: 244] [added: 251] service centers at December 31, [removed: 2020.][added: 2021.]
We believe [removed: this expansion] [added: these expansions] produced increased capacity within our service center network and [removed: provides] [added: provide] us with opportunities for future growth.
Our integrated structure allows us to offer our customers [removed: consistent] [added: consistent,] high-quality service from origin to destination, and we believe our operating structure and proprietary information systems enable us to efficiently manage our operating costs.
Our services are complemented by our technological capabilities, which we believe [removed: provide the tools to] improve the efficiency of our operations while also empowering our customers to manage their individual shipping needs.
LTL motor carriers generally require a more expansive network of local pickup and delivery [added: (“P&D”) service centers, as well as larger breakbulk, or hub, facilities.]
The American Trucking Associations reported total transportation revenue in the United States of [removed: $984.9] [added: $911.2] billion in [removed: 2019,] [added: 2020,] which included approximately [removed: $43.3] [added: $41.1] billion for the LTL industry based on information reported in Transport Topics.
The largest 5 and 10 LTL motor carriers accounted for approximately [removed: 56%] [added: 58%] and [removed: 80%,] [added: 83%,] respectively, of the [added: domestic] LTL market in [removed: 2019.][added: 2020.]
We believe consolidation in our industry will continue due to increased customer demand for transportation providers [removed: offering] [added: that can offer] both regional and national service as well as other complementary value-added services.
At December 31, [removed: 2020,] [added: 2021,] we operated [removed: 244] [added: 251] service center locations, of which we owned [removed: 217] [added: 227] and leased [removed: 27.][added: 24.]
[added: Our management team monitors freight] movements, transit times, load factors and many other productivity measurements to help ensure that we maintain our high levels of service and efficiency.
We utilize scheduled [removed: routes,] [added: routes] and additional linehaul dispatches as necessary to meet our published transit times.
The use of twin 28-foot trailers permits us to transport freight directly from its point of origin to destination with minimal unloading and reloading, which also reduces our exposure [removed: to potential cargo loss and damage expenses.]
At December 31, [removed: 2020,] [added: 2021,] we owned [removed: 9,288] [added: 10,403] tractors.
The table below reflects, as of December 31, [removed: 2020,] [added: 2021,] the average age of our tractors and trailers:
We [added: generally] believe there is sufficient capacity among suppliers to help ensure an uninterrupted supply of equipment to support our operations.
The table below sets forth our capital expenditures for tractors and trailers for the years ended December 31, [removed: 2020] [added: 2021] and [removed: 2019.][added: 2020.]
| (In thousands) | | [removed: 2020] [added: 2021] | | | | [removed: 2019] [added: 2020] | | |
| Tractors | | $ | [removed: 17,518] [added: 130,772] | | | $ | [removed: 75,418] [added: 17,518] | |
| Trailers | | | [removed: 2,151] [added: 140,594] | | | | [removed: 88,115] [added: 2,151] | |
At December 31, [removed: 2020,] [added: 2021,] we operated [removed: 42] [added: 43] fleet maintenance centers at strategic service center locations throughout our network.
Trailers are also scheduled for [removed: preventative] [added: preventive] maintenance every 90 days.
In [removed: 2020,] [added: 2021,] our largest customer accounted for approximately [removed: 4.7%] [added: 5.4%] of our revenue and our largest 5, 10 and 20 customers accounted for [removed: 15.1%, 21.8%] [added: 16.0%, 22.3%] and [removed: 29.7%] [added: 30.2%] of our revenue, respectively.
[added: Customers generally solicit bids for relatively large] numbers of shipments for a period of one to two years and typically choose to enter into contractual arrangements with a limited number of motor carriers based upon price and service.
Our revenue and operating margins in the first and fourth quarters are typically lower than those during the second and third quarters due to reduced shipments during the winter months; however, the effects of the COVID-19 pandemic on the domestic economy [removed: has impacted,] [added: impacted our normal seasonal trends during 2020] and may continue to [removed: impact,] [added: impact] our [removed: normal] seasonal [removed: trends.][added: trends in future periods.]
We employ vehicle safety systems, [added: forward-facing cameras,] on-board computer [removed: systems and] [added: systems,] smart phones, freight handling systems and logistics technology to reduce costs and transit times, as well as to meet regulatory requirements.
We depend heavily upon the availability and quality of diesel [added: fuel, including alternative] fuel [added: types,] to provide our transportation services.
As of December 31, [removed: 2020,] [added: 2021,] we employed [removed: 19,779] [added: 23,663] active full-time employees, none of which were represented under a collective bargaining agreement.
| Fleet technicians | | | [removed: 597] [added: 609] | |
| Sales, administrative and other | | | [removed: 5,182] [added: 5,902] | |
We also provide our employees with a comprehensive benefits package, including a plan that covers our eligible employees’ premium for health insurance, [added: voluntary disability and life insurance coverages,] a flexible paid time off policy, a 401(k) plan with a guaranteed employer match as well as a discretionary [added: employer] match opportunity, and various wellness programs designed to assist employees with establishing and living a healthy and balanced lifestyle.
As of December 31, [removed: 2020,] [added: 2021,] we employed [removed: 5,310] [added: 6,158] linehaul drivers and [removed: 4,804] [added: 5,644] P&D drivers on a full-time basis.
Since 1988, we have provided a no-cost opportunity for qualified employees to become drivers through the “Old Dominion Driver Training Program.” There are currently [removed: 3,069] [added: 3,389] active drivers who have successfully completed this training, which was approximately [removed: 30.3%] [added: 28.7%] of our driver workforce as of December 31, [removed: 2020.][added: 2021.]
In addition, we have experienced an annual turnover rate for our driver graduates of approximately [removed: 6.3%,] [added: 6.4%,] which is below our Company-wide turnover rate for all drivers of approximately [removed: 8.0%.][added: 9.0%.]
Our safety bonuses paid to drivers totaled [removed: $4.7] [added: $4.9] million, [removed: $4.6] [added: $4.7] million and [removed: $4.1] [added: $4.6] million in [removed: 2020, 2019] [added: 2021, 2020] and [removed: 2018,] [added: 2019,] respectively.
We are registered as a motor carrier with the Commercial Driver’s License Drug and Alcohol [removed: Clearinghouse (“DAC”)] [added: Clearinghouse,] which requires us to check for drug and alcohol violations of current drivers at least annually and prospective employees prior to hiring.
We do not believe that the cost of future compliance with current environmental laws or regulations will have a material adverse effect on our operations, financial condition, competitive position or capital expenditures for the remainder of [removed: 2021] [added: 2022] or fiscal year [removed: 2022.][added: 2023.]
Our network includes major breakbulk facilities, as well as various other service centers that are used for additional limited breakbulk activity in order to serve our next-day markets.
to potential cargo loss and damage expenses.
| Tractors | | | 10,403 | | | | 5.0 | |
| Linehaul trailers | | | 27,917 | | | | 7.8 | |
| P&D trailers | | | 13,303 | | | | 7.5 | |
Supply chain challenges have impacted our equipment manufacturers during 2021 and may continue to impact them during 2022.
We will continue to use older equipment that would have otherwise been replaced based on our normal equipment cycle to help ensure that we have adequate capacity to support anticipated growth.
We will also continue to utilize purchased transportation, as needed, in order to support the capacity of our workforce and equipment needs.
| Total | | $ | 271,366 | | | $ | 19,669 | |
| Drivers | | | 11,802 | |
| Platform | | | 5,350 | |
| Total | | | 23,663 | |
In fact, over 18% of our drivers have achieved one million safe driving miles or more.
(“P&D”) service centers, as well as larger breakbulk, or hub, facilities.
Our network includes nine major breakbulk facilities located in Atlanta, Georgia; Columbus, Ohio; Indianapolis, Indiana; Greensboro, North Carolina; Harrisburg, Pennsylvania; Memphis and Morristown, Tennessee; Dallas, Texas; and Salt Lake City, Utah, while using various other service centers for additional limited breakbulk activity in order to serve our next-day markets.
Our management team monitors freight
| Tractors | | | 9,288 | | | | 4.7 | |
| Linehaul trailers | | | 24,583 | | | | 7.9 | |
| P&D trailers | | | 12,067 | | | | 7.4 | |
| Total | | $ | 19,669 | | | $ | 163,533 | |
Customers generally solicit bids for relatively large
More specifically, we experienced a decrease in LTL shipments driven by the impact of a slowdown in the domestic economy associated with the COVID-19 pandemic, primarily during the second quarter of 2020.
| Drivers | | | 10,114 | |
| Platform | | | 3,886 | |
| Total | | | 19,779 | |
During 2020, the outbreak of COVID-19 was declared a pandemic by the World Health Organization.
We provided personal protective equipment and also implemented increased physical distancing in workspaces and enhanced cleaning protocols.
We are subject to future rulemaking by the FMCSA and other regulatory agencies, which could be more stringent, require additional changes to our operations, increase our operating costs or otherwise adversely impact our results of operations.
Cover and table of contents
25 rewritten, 1 added, 0 removed, 84 unchanged
For the fiscal year ended December 31, [removed: 2020][added: 2021]
[removed: ][added: ]
The aggregate market value of voting stock held by non-affiliates of the registrant as of June 30, [removed: 2020] [added: 2021] was [removed: $16,302,404,841,] [added: $24,053,489,079,] based on the closing sales price as reported on the Nasdaq Global Select Market.
As of February [removed: 22, 2021,] [added: 21, 2022,] the registrant had [removed: 116,937,111] [added: 114,863,803] outstanding shares of Common Stock ($0.10 par value).
Certain portions of the Company’s Proxy Statement for the [removed: 2021] [added: 2022] Annual Meeting of Shareholders are incorporated by reference into Part III of this report.
| Item 3 | [Legal Proceedings](#ITEM_3_LEGAL_PROCEEDINGS) | | [removed: 16] [added: 17] |
| Item 4 | [Mine Safety Disclosures](#ITEM_4_MINE_SAFETY_DISCLOSURES) | | [removed: 16] [added: 17] |
| [Part II](#PART_II) | | | [removed: 17] [added: 18] |
| Item 5 | [Market for Registrant’s Common Equity, Related Stockholder Matters and Issuer Purchases of Equity Securities](#ITEM_5_MARKET_FOR_REGISTRANTS_COMMON_EQU) | | [removed: 17] [added: 18] |
| Item 8 | [Financial Statements and Supplementary Data](#ITEM_8_FINANCIAL_STATEMENTS_SUPPLEMENTAR) | | [removed: 29] [added: 28] |
| Item 9 | [Changes in and Disagreements With Accountants on Accounting and Financial Disclosure](#ITEM_9_CHANGES_IN_DISAGREEMENTS_WITH_ACC) | | [removed: 46] [added: 45] |
| Item 9A | [Controls and Procedures](#ITEM_9A_CONTROLS_PROCEDURES) | | [removed: 46] [added: 45] |
| Item 9B | [Other Information](#ITEM_9B_OR_INFORMATION) | | [removed: 48] [added: 47] |
| [Part III](#PART_III) | | | [removed: 48] [added: 47] |
| Item 10 | [Directors, Executive Officers and Corporate Governance](#ITEM_10_DIRECTORS_EXECUTIVE_FICERS_CORPO) | | [removed: 48] [added: 47] |
| Item 11 | [Executive Compensation](#ITEM_11_EXECUTIVE_COMPENSATION) | | [removed: 48] [added: 47] |
| Item 12 | [Security Ownership of Certain Beneficial Owners and Management and Related Stockholder Matters](#ITEM_12_SECURITY_OWNERSHIP_CERTAIN_BENEF) | | [removed: 48] [added: 47] |
| Item 13 | [Certain Relationships and Related Transactions, and Director Independence](#ITEM_13_CERTAIN_RELATIONSHIPS_RELATED_TR) | | [removed: 48] [added: 47] |
| Item 14 | [Principal Accounting Fees and Services](#ITEM_14_PRINCIPAL_ACCOUNTING_FEES_SERVIC) | | [removed: 48] [added: 47] |
| [Part IV](#PART_IV) | | | [removed: 49] [added: 48] |
| Item 15 | [Exhibits, Financial Statement Schedules](#ITEM_15_EXHIBITS_FINANCIAL_STATEMENT_SCH) | | [removed: 49] [added: 48] |
| Item 16 | [Form 10-K Summary](#ITEM_16_FORM_10K_SUMMARY) | | [removed: 49] [added: 48] |
| [Exhibit Index](#EXHIBIT_INDEX) | | | [removed: 50] [added: 49] |
| [Signatures](#SIGNATURES) | | | [removed: 54] [added: 52] |
These forward-looking statements include, but are not limited to, statements relating to our goals, strategies, expectations, competitive environment, compliance with regulations, availability of resources, [removed: the impact of the novel coronavirus (“COVID-19”) pandemic on our business,] future events and future financial performance.
| Item 9C | [Disclosure Regarding Foreign Jurisdictions that Prevent Inspections](#ITEM_9C_DISCLOSURE_REGARDING_FOREIGN_JUR) | | 47 |
Item 2. PROPERTIES
3 rewritten, 1 added, 14 removed, 3 unchanged
Our owned service centers include most of our larger facilities and account for approximately [removed: 94%] [added: 95%] of the total door capacity in our network.
Our [removed: 244] facilities are strategically dispersed over the states in which we operate.
At December 31, [removed: 2020,] [added: 2021,] the terms of our leased properties ranged from month-to-month to a lease that expires in 2039.
We own our principal executive office located in Thomasville, North Carolina, and 227 of the 251 service centers we operated as of December 31, 2021.
We own our principal executive office located in Thomasville, North Carolina, consisting of a two-story office building of approximately 168,000 square feet on 31.8 acres of land.
At December 31, 2020, we operated 244 service centers, of which 217 were owned and 27 were leased.
We own each of our major breakbulk facilities listed below and have provided the number of doors as of December 31, 2020.
| Service Center | | Doors | | |
| --- | --- | --- | --- | --- |
| Morristown, Tennessee | | | 347 | |
| Indianapolis, Indiana | | | 318 | |
| Dallas, Texas | | | 304 | |
| Columbus, Ohio | | | 301 | |
| Harrisburg, Pennsylvania | | | 300 | |
| Memphis, Tennessee | | | 267 | |
| Greensboro, North Carolina | | | 256 | |
| Atlanta, Georgia | | | 225 | |
| Salt Lake City, Utah | | | 188 | |
Item 5. MARKET FOR REGISTRANT’S COMMON EQUITY, RELATED STOCKHOLDER MATTERS AND ISSUER PURCHASES OF EQUITY SECURITIES
3 rewritten, 11 added, 20 removed, 5 unchanged
At February [removed: 18, 2021,] [added: 17, 2022,] there were [removed: 123,513] [added: 287,277] holders of our common stock, including 103 shareholders of record.
The following graph compares the total shareholder cumulative returns, assuming the reinvestment of all dividends, of $100 invested on December 31, [removed: 2015,] [added: 2016,] in (i) our common stock, (ii) the S&P 500 Total Return Index, [removed: and] (iii) the [added: Dow Jones Transportation Average, and (iv) the] Nasdaq Industrial Transportation Index, for the five-year period ended December 31, [removed: 2020.][added: 2021.]
[removed: 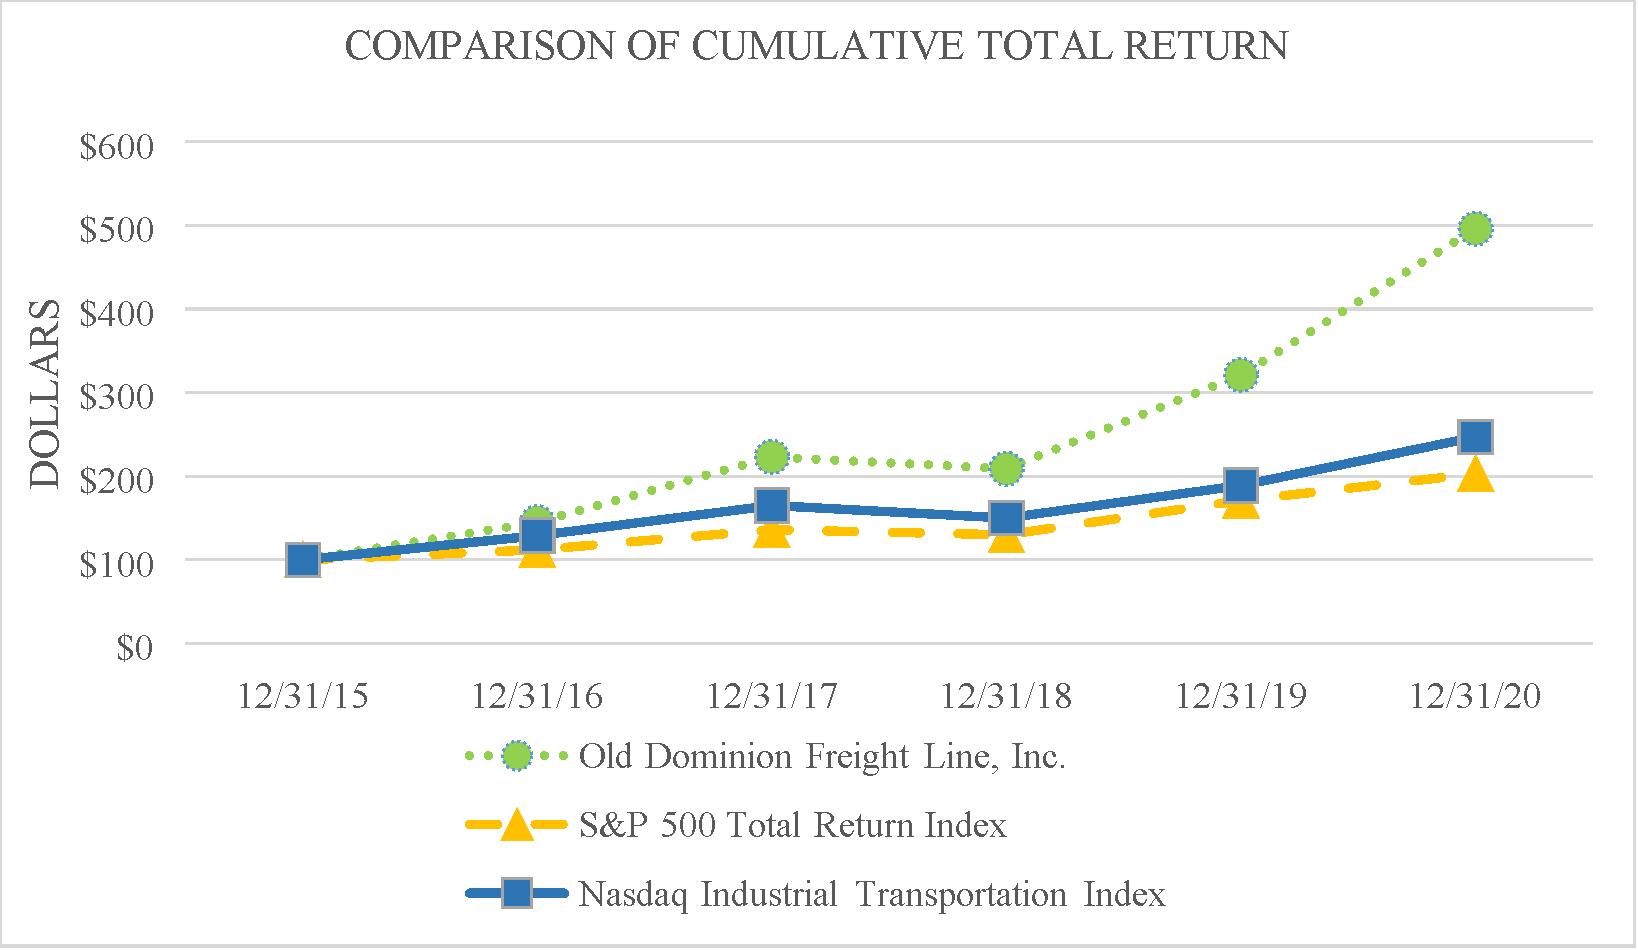][added: 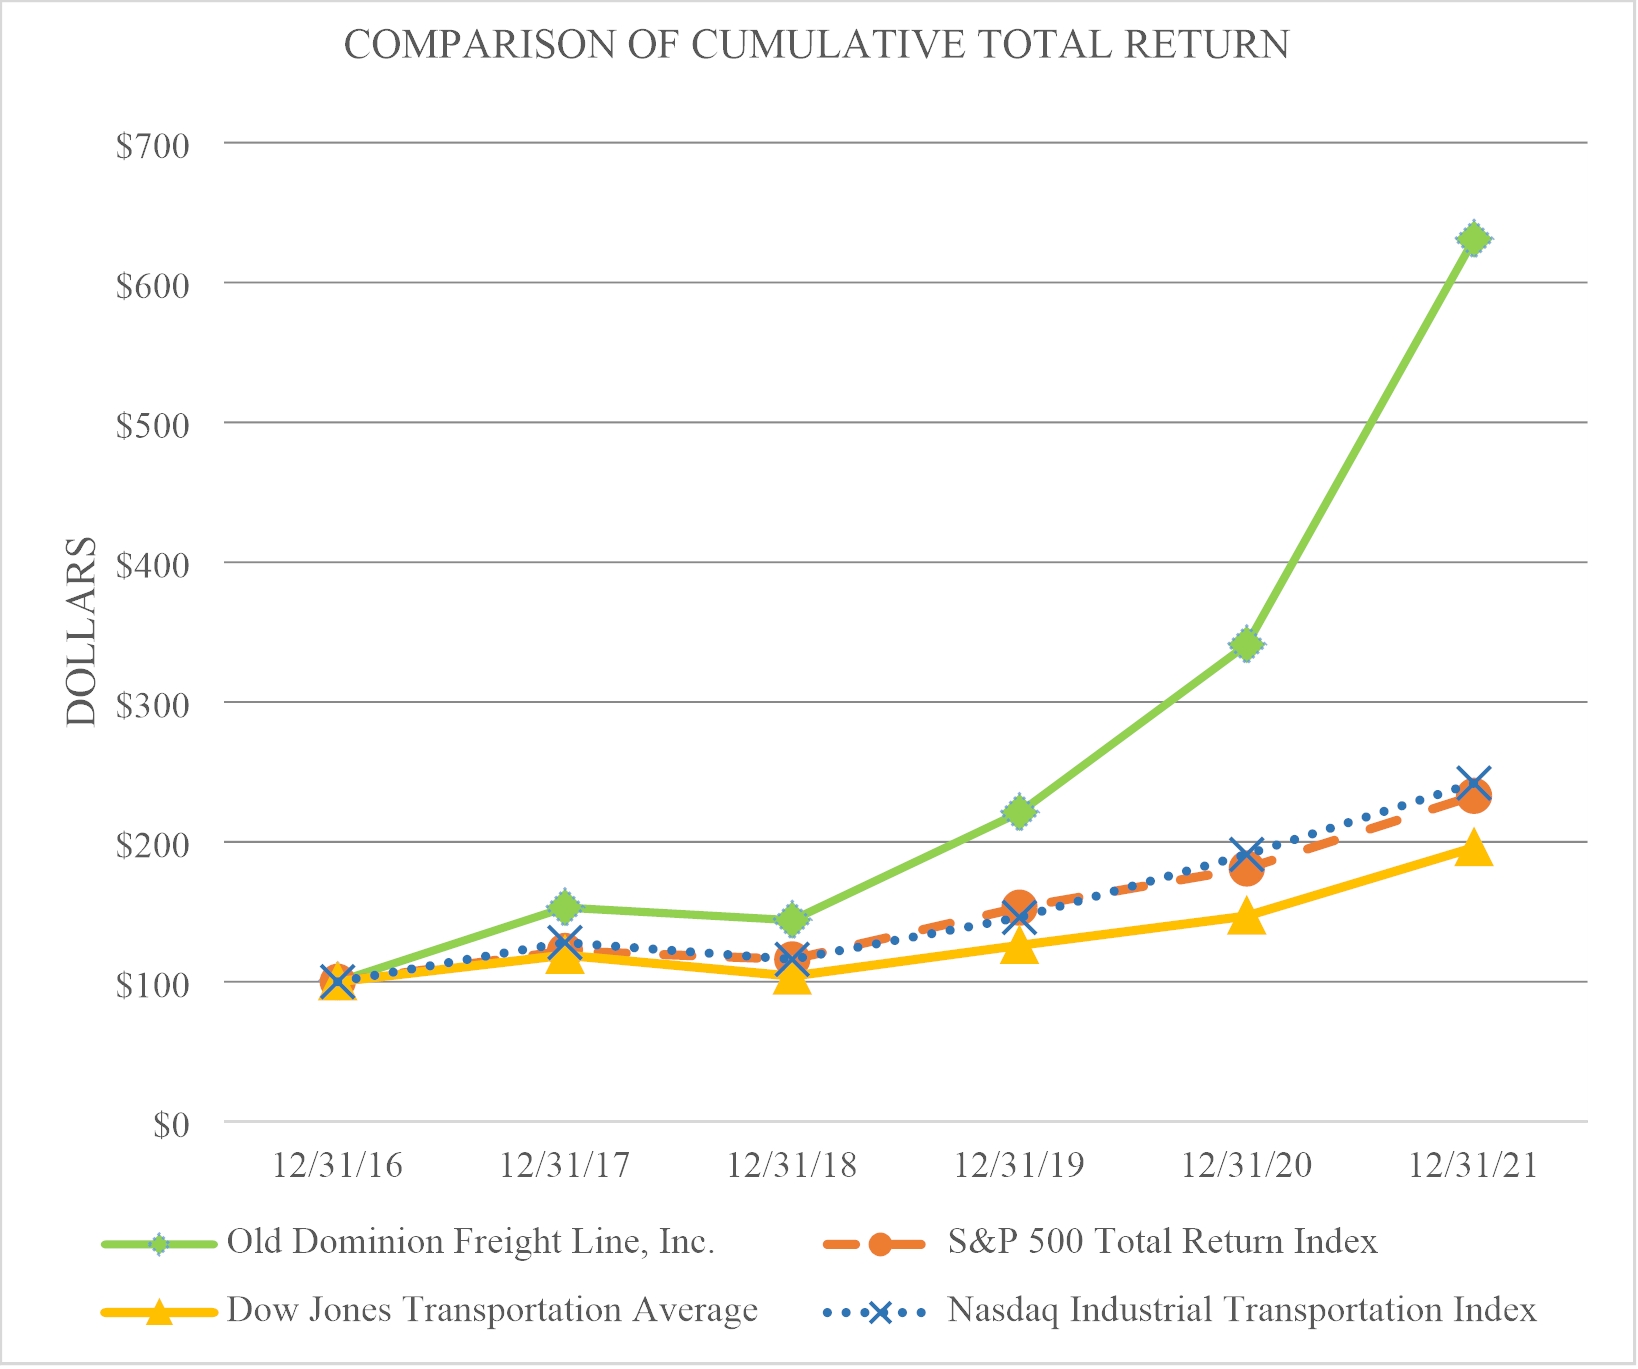]
We did not repurchase any shares of our common stock during the fourth quarter of 2021.
The Company was added to the Dow Jones Transportation Average in December 2021.
As a result, our performance graphs going forward will use the Dow Jones Transportation Average rather than the Nasdaq Industrial Transportation Index.
For comparative purposes, however, we have included the Nasdaq Industrial Transportation Index in the performance graph below.
| | | 12/31/16 | | | | 12/31/17 | | | | 12/31/18 | | | | 12/31/19 | | | | 12/31/20 | | | | 12/31/21 | | |
| Old Dominion Freight Line, Inc. | | $ | 100 | | | $ | 153 | | | $ | 144 | | | $ | 221 | | | $ | 341 | | | $ | 631 | |
| S&P 500 Total Return Index | | $ | 100 | | | $ | 122 | | | $ | 116 | | | $ | 153 | | | $ | 181 | | | $ | 233 | |
| New Index: | | | | | | | | | | | | | | | | | | | | | | | | |
| Dow Jones Transportation Average | | $ | 100 | | | $ | 119 | | | $ | 104 | | | $ | 126 | | | $ | 147 | | | $ | 196 | |
| Former Index: | | | | | | | | | | | | | | | | | | | | | | | | |
| Nasdaq Industrial Transportation Index | | $ | 100 | | | $ | 128 | | | $ | 116 | | | $ | 146 | | | $ | 191 | | | $ | 242 | |
The following table provides information regarding our repurchases of our common stock during the fourth quarter of 2020:
| ISSUER PURCHASES OF EQUITY SECURITIES | | | | | | | | | | | | | | | | |
| --- | --- | --- | --- | --- | --- | --- | --- | --- | --- | --- | --- | --- | --- | --- | --- | --- |
| | | | | | | | | | | | | | | | | |
| | | Total Number of Shares Purchased | | | | Average Price Paid per Share | | | | Total Number of Shares Purchased as Part of Publicly Announced Programs | | | | Approximate Dollar Value of Shares that May Yet Be Purchased Under the Programs | | |
| October 1-31, 2020 | | | — | | | $ | — | | | | — | | | $ | 612,499,955 | |
| November 1-30, 2020 (1) | | | 172,007 | | | $ | 202.91 | | | | 172,007 | | | $ | 575,000,000 | |
| December 1-31, 2020 | | | 98,558 | | | $ | 200.56 | | | | 98,558 | | | $ | 555,233,528 | |
| Total | | | 270,565 | | | $ | 202.05 | | | | 270,565 | | | | | |
(1) The total number of shares purchased includes the final settlement of 172,007 shares of our common stock under our Accelerated Share Repurchase Agreement (the “ASR Agreement”) entered into with a third-party financial institution on May 29, 2020 as part of our 2020 Repurchase Program (as defined below).
This delivery of shares and their market price at time of delivery are included in the table above.
The final number of shares received was based on the daily volume-weighted average share price during the term of the ASR Agreement, less a negotiated discount.
On May 1, 2020, we announced that our Board of Directors had approved a new two-year stock repurchase program authorizing us to repurchase up to an aggregate of $700.0 million of our outstanding common stock (the “2020 Repurchase Program”).
The 2020 Repurchase Program became effective upon the termination of our $350.0 million repurchase program on May 29, 2020, as of which date $21.5 million remained authorized under the prior program.
Under the 2020 Repurchase Program, we may repurchase shares from time to time in open market purchases or through privately negotiated transactions.
Shares of our common stock repurchased under our repurchase programs are canceled at the time of repurchase and are classified as authorized but unissued shares of our common stock.
| | | 12/31/15 | | | | 12/31/16 | | | | 12/31/17 | | | | 12/31/18 | | | | 12/31/19 | | | | 12/31/20 | | |
| Old Dominion Freight Line, Inc. | | $ | 100 | | | $ | 145 | | | $ | 223 | | | $ | 209 | | | $ | 321 | | | $ | 496 | |
| S&P 500 Total Return Index | | $ | 100 | | | $ | 112 | | | $ | 136 | | | $ | 130 | | | $ | 171 | | | $ | 203 | |
| Nasdaq Industrial Transportation Index | | $ | 100 | | | $ | 129 | | | $ | 165 | | | $ | 150 | | | $ | 189 | | | $ | 247 | |
Item 8. FINANCIAL STATEMENTS AND SUPPLEMENTARY DATA
203 rewritten, 64 added, 49 removed, 318 unchanged
| (In thousands, except share and per share data) | | [added: 2021 | | | |] 2020 | | | | 2019 | | |
| Cash and cash equivalents [added: at beginning of year] | | [removed: $] | 401,430 | | | [removed: $] | 403,571 | | [added: | | 190,282 | |]
| Short-term investments | | | [removed: 330,274] [added: 254,433] | | | | [removed: —] [added: 330,274] | |
| Customer receivables, less allowances of [removed: $8,979] [added: $9,855] and [removed: $8,866,] [added: $8,979,] respectively | | | [removed: 444,653] [added: 567,474] | | | | [removed: 397,579] [added: 444,653] | |
| Other receivables | | | [removed: 9,569] [added: 12,410] | | | | [removed: 10,586] [added: 9,569] | |
| Prepaid expenses and other current assets | | | [removed: 57,413] [added: 67,688] | | | | [removed: 55,098] [added: 57,413] | |
| Total current assets | | | [removed: 1,243,339] [added: 1,383,787] | | | | [removed: 866,834] [added: 1,243,339] | |
| Revenue equipment | | | [removed: 1,885,649] [added: 2,146,205] | | | | [removed: 1,898,999] [added: 1,885,649] | |
| Land and structures | | | [removed: 2,218,290] [added: 2,463,949] | | | | [removed: 2,039,937] [added: 2,218,290] | |
| Other fixed assets | | | [removed: 475,264] [added: 512,340] | | | | [removed: 482,425] [added: 475,264] | |
| Leasehold improvements | | | [removed: 12,226] [added: 13,131] | | | | [removed: 11,709] [added: 12,226] | |
| Total property and equipment | | | [removed: 4,591,429] [added: 5,135,625] | | | | [removed: 4,433,070] [added: 4,591,429] | |
| Less: Accumulated depreciation | | | [removed: (1,677,398] [added: (1,919,939] | ) | | | [removed: (1,464,235] [added: (1,677,398] | ) |
| Net property and equipment | | | [removed: 2,914,031] [added: 3,215,686] | | | | [removed: 2,968,835] [added: 2,914,031] | |
| Other assets | | | [removed: 212,040] [added: 222,071] | | | | [removed: 159,899] [added: 212,040] | |
| Total assets | | $ | [removed: 4,369,410] [added: 4,821,544] | | | $ | [removed: 3,995,568] [added: 4,369,410] | |
| Accounts payable | | $ | [removed: 68,511] [added: 82,519] | | | $ | [removed: 70,254] [added: 68,511] | |
| Compensation and benefits | | | [removed: 191,303] [added: 257,905] | | | | [removed: 192,524] [added: 191,303] | |
| Claims and insurance accruals | | | [removed: 53,092] [added: 61,822] | | | | [removed: 54,330] [added: 53,092] | |
| Other accrued liabilities | | | [removed: 51,513] [added: 61,988] | | | | [removed: 46,130] [added: 51,513] | |
| Income taxes payable | | | [removed: 8,711] [added: —] | | | | [removed: 2,847] [added: 8,711] | |
| Total current liabilities | | | [removed: 373,130] [added: 464,234] | | | | [removed: 366,085] [added: 373,130] | |
| Long-term debt | | | [removed: 99,931] [added: 99,947] | | | | [removed: 45,000] [added: 99,931] | |
| Other non-current liabilities | | | [removed: 349,851] [added: 328,838] | | | | [removed: 241,802] [added: 349,851] | |
| Deferred income taxes | | | [removed: 220,210] [added: 248,718] | | | | [removed: 261,964] [added: 220,210] | |
| Total long-term liabilities | | | [removed: 669,992] [added: 677,503] | | | | [removed: 548,766] [added: 669,992] | |
| Total liabilities | | | [removed: 1,043,122] [added: 1,141,737] | | | | [removed: 914,851] [added: 1,043,122] | |
| Common stock - $0.10 par value, 280,000,000 shares authorized, [added: 115,011,172 and] 117,057,696 shares outstanding at December 31, [removed: 2020] [added: 2021] and [removed: 140,000,000 shares authorized, 119,532,534 shares outstanding at] December 31, [removed: 2019] [added: 2020, respectively.] | | | [removed: 11,706] [added: 11,501] | | | | [removed: 11,953] [added: 11,706] | |
| Capital in excess of par value | | | [removed: 226,451] [added: 174,445] | | | | [removed: 218,462] [added: 226,451] | |
| Retained earnings | | | [removed: 3,088,131] [added: 3,493,861] | | | | [removed: 2,850,302] [added: 3,088,131] | |
| Total shareholders’ equity | | | [removed: 3,326,288] [added: 3,679,807] | | | | [removed: 3,080,717] [added: 3,326,288] | |
| Total liabilities and shareholders’ equity | | $ | [removed: 4,369,410] [added: 4,821,544] | | | $ | [removed: 3,995,568] [added: 4,369,410] | |
| (In thousands, except share and per share data) | | [removed: 2020 | | | | 2019] [added: 2021] | | | | [removed: 2018] [added: 2020] | | |
| Revenue from operations | | $ | [removed: 4,015,129] [added: 5,256,328] | | | $ | [removed: 4,109,111] [added: 4,015,129] | | | $ | [removed: 4,043,695] [added: 4,109,111] | |
| Salaries, wages and benefits | | | [removed: 2,053,894] [added: 2,467,985] | | | | [removed: 2,122,464] [added: 2,053,894] | | | | [removed: 2,075,602] [added: 2,122,464] | |
| Operating supplies and expenses | | | [removed: 373,431] [added: 567,615] | | | | [removed: 473,114] [added: 373,431] | | | | [removed: 497,476] [added: 473,114] | |
| General supplies and expenses | | | [removed: 110,279] [added: 136,059] | | | | [removed: 123,975] [added: 110,279] | | | | [removed: 119,180] [added: 123,975] | |
| Operating taxes and licenses | | | [removed: 116,943] [added: 133,452] | | | | [removed: 116,839] [added: 116,943] | | | | [removed: 112,210] [added: 116,839] | |
| Insurance and claims | | | [removed: 42,364] [added: 53,549] | | | | [removed: 52,549] [added: 42,364] | | | | [removed: 44,118] [added: 52,549] | |
| Communications and utilities | | | [removed: 31,542] [added: 34,149] | | | | [removed: 29,601] [added: 31,542] | | | | [removed: 31,070] [added: 29,601] | |
| Cash and cash equivalents | | $ | 462,564 | | | $ | 401,430 | |
| Income taxes receivable | | | 19,218 | | | | — | |
| Net income | | | — | | | | — | | | | — | | | | 1,034,375 | | | | 1,034,375 | |
| Share repurchases | | | (2,083 | ) | | | (209 | ) | | | — | | | | (536,256 | ) | | | (536,465 | ) |
| Forward contract for accelerated share repurchases | | | — | | | | — | | | | (62,500 | ) | | | — | | | | (62,500 | ) |
| Balance as of December 31, 2021 | | | 115,011 | | | $ | 11,501 | | | $ | 174,445 | | | $ | 3,493,861 | | | $ | 3,679,807 | |
| Net income | | $ | 1,034,375 | | | $ | 672,682 | | | $ | 615,518 | |
| Forward contract for accelerated share repurchases | | | (62,500 | ) | | | — | | | | — | |
| | | | | | | | | | | | | |
| Supplemental disclosure of noncash investing and financing activities: | | | | | | | | | | | | |
| Noncash purchases of property | | $ | 16,034 | | | $ | — | | | $ | — | |
As of December 31, 2021 and 2020, there were no unsettled phantom stock awards accounted for as a liability under the Phantom Plans, as defined in Note 8.
On July 28, 2021, we announced that our Board of Directors had approved a new stock repurchase program authorizing us to repurchase up to an
aggregate of $2.0 billion of our outstanding common stock (the “2021 Repurchase Program”).
The 2021 Repurchase Program, which does not have an expiration date, began after the completion of the 2020 Repurchase Program in January 2022.
On May 29, 2020, we entered into an accelerated share repurchase agreement (the “May 2020 ASR Agreement”) with a third-party financial institution.
The May 2020 ASR Agreement was settled during the fourth quarter of 2020, with the final number of shares received based on the daily volume-weighted average share price of our common stock over the term of the agreement, less a negotiated discount.
Under the May 2020 ASR Agreement, we repurchased 683,434 shares for $125.0 million.
On February 25, 2021, we entered into an accelerated share repurchase agreement (the “February 2021 ASR Agreement”) with a third-party financial institution.
The February 2021 ASR Agreement was settled during the third quarter of 2021, with the final number of shares received based on the daily volume-weighted average share price of our common stock over the term of the agreement, less a negotiated discount.
Under the February 2021 ASR Agreement, we repurchased 1,101,046 shares for $275.0 million.
On August 26, 2021, we entered into an accelerated share repurchase agreement (the “August 2021 ASR Agreement”) with a third-party financial institution.
Under the August 2021 ASR Agreement, we paid the third-party financial institution $250.0 million and received an initial delivery of 655,365 shares of our common stock for $187.5 million, representing approximately 75% of the total value of shares to be received by us under the August 2021 ASR Agreement.
At December 31, 2021, our repurchase programs had $2.02 billion remaining available, including $62.5 million that was deferred until final settlement occurred on the August 2021 ASR Agreement, leaving $1.96 billion remaining available and uncommitted.
The August 2021 ASR Agreement was settled during January 2022, with the final number of shares received based on the daily volume-weighted average share price of our common stock over the term of the agreement, less a negotiated discount.
Under the August 2021 ASR Agreement, we repurchased 778,775 shares for $250.0 million.
The Company’s accelerated share repurchase agreements are each accounted for as a settled treasury stock purchase and a forward stock purchase contract.
The par value of the initial share delivery is recorded as a reduction to common stock, with the excess purchase price recorded as a reduction to retained earnings.
The forward stock purchase contract is accounted for as a contract indexed to our own stock and is classified within capital in excess of par value on our Statements of Changes in Shareholders’ Equity.
| (In thousands) | | 2021 | | | | 2020 | | |
Note Agreement
| 2022 | | $ | 16,909 | |
| 2023 | | | 15,650 | |
| 2024 | | | 13,480 | |
| 2025 | | | 11,012 | |
| 2026 | | | 10,734 | |
| Thereafter | | | 53,463 | |
| (In thousands) | | 2021 | | | | 2020 | | | | 2019 | | |
| (In thousands) | | 2021 | | | | 2020 | | | | 2019 | | |
| Total provision for income taxes | | $ | 354,048 | | | $ | 228,682 | | | $ | 208,431 | |
| --- | --- | --- | --- | --- | --- | --- | --- | --- | --- | --- | --- | --- |
| Balance as of December 31, 2017 | | | 123,564 | | | $ | 12,356 | | | $ | 134,395 | | | $ | 2,130,103 | | | $ | 2,276,854 | |
| Net income | | | — | | | | — | | | | — | | | | 605,668 | | | | 605,668 | |
| Share repurchases | | | (1,763 | ) | | | (176 | ) | | | — | | | | (163,089 | ) | | | (163,265 | ) |
| Cash and cash equivalents at end of year | | $ | 401,430 | | | $ | 403,571 | | | $ | 190,282 | |
Common Stock Split
On February 21, 2020, we announced that our Board of Directors approved a three-for-two split of our common stock for shareholders of record as of the close of business on the record date of March 10, 2020.
On March 24, 2020, those shareholders received one additional share of common stock for every two shares owned.
In lieu of fractional shares, shareholders received a cash payment based on the average of the high and low sales prices of our common stock on the record date.
All references in this report to shares outstanding, weighted average shares outstanding, earnings per share, and dividends per share amounts have been restated retroactively to reflect this stock split.
Split-adjusted per-share metrics may not recalculate precisely due to rounding.
As of December 31, 2020, we had $555.2 million remaining authorized under the 2020 Repurchase Program.
Recent Accounting Pronouncements
In June 2016, the Financial Accounting Standards Board (“FASB”) issued Accounting Standards Update (“ASU”) 2016-13, “Financial Instruments – Credit Losses – Measurement of Credit Losses on Financial Statements” (Topic 326).
This ASU modified the methodology for establishing a provision against financial assets, including customer receivables, to include an expected future performance component.
We adopted ASU 2016-13 on January 1, 2020.
The adoption did not have a material impact to our financial position, results of operations, or cash flow.
Senior Note Agreements
million through May 4, 2023.
The Series B Notes are senior unsecured obligations and rank pari passu with our other senior unsecured indebtedness.
The Credit Agreement replaced our previous five-year, $300.0 million senior unsecured revolving credit agreement dated as of December 15, 2015, as amended on September 9, 2016 (the “Prior Credit Agreement”).
| 2021 | | $ | 16,017 | |
| 2022 | | | 14,011 | |
| 2023 | | | 12,688 | |
| 2024 | | | 11,278 | |
| 2025 | | | 10,052 | |
| Thereafter | | | 63,790 | |
Each of Earl E.
Congdon, David S.
Congdon and John R.
Congdon, Jr. are related to one another and served in various management positions and/or on our Board of Directors during 2020.
| Unvested at January 1, 2020 | | | 163,723 | | | $ | 90.65 | |
| Granted | | | 75,638 | | | | 149.38 | |
| Vested | | | (80,349 | ) | | | 85.68 | |
| Forfeited | | | (19,149 | ) | | | 117.86 | |
All PBRSUs granted in 2019 were forfeited as the performance metrics were not met.
| Unvested at January 1, 2020 | | | — | | | $ | — | |
| Granted (a) | | | 31,072 | | | | 146.29 | |
| Vested | | | — | | | | — | |
(a) Amount represents PBRSUs granted at target.
An excerpt. Shown here: 40 of 203 rewritten, 40 of 64 added and 40 of 49 removed. The counts are complete. For every sentence, read Item 8. FINANCIAL STATEMENTS AND SUPPLEMENTARY DATA in the FY2021 filing and the FY2020 filing.
Item 9A. CONTROLS AND PROCEDURES
6 rewritten, 1 added, 1 removed, 31 unchanged
Management has conducted an evaluation, with the participation of our CEO and CFO, of the effectiveness of our internal control over financial reporting as of December 31, [removed: 2020] [added: 2021] based on the framework in *Internal Control – Integrated Framework* issued by the Committee of Sponsoring Organizations of the Treadway Commission (the “2013 Framework”).
Management concluded that our internal control over financial reporting was effective as of December 31, [removed: 2020,] [added: 2021,] based on our evaluation under the 2013 Framework.
The effectiveness of our internal control over financial reporting as of December 31, [removed: 2020] [added: 2021] has been audited by Ernst & Young LLP, an independent registered public accounting firm, as stated in its report dated February [removed: 24, 2021,] [added: 23, 2022,] which is included herein.
We have audited Old Dominion Freight Line, Inc.’s internal control over financial reporting as of December 31, [removed: 2020,] [added: 2021,] based on criteria established in Internal Control—Integrated Framework issued by the Committee of Sponsoring Organizations of the Treadway Commission (2013 framework) (the COSO criteria).
In our opinion, Old Dominion Freight Line, Inc. (the Company) maintained, in all material respects, effective internal control over financial reporting as of December 31, [removed: 2020,] [added: 2021,] based on the COSO criteria.
We also have audited, in accordance with the standards of the Public Company Accounting Oversight Board (United States) (PCAOB), the balance sheets of the Company as of December 31, [removed: 2020] [added: 2021] and [removed: 2019,] [added: 2020,] the related statements of operations, changes in shareholders’ equity and cash flows for each of the three years in the period ended December 31, [removed: 2020,] [added: 2021,] and the related notes and the financial statement schedule listed in the Index at Item 15(a)(2) and our report dated February [removed: 24, 2021] [added: 23, 2022] expressed an unqualified opinion thereon.
February 23, 2022
February 24, 2021
Item 9B. OTHER INFORMATION
0 rewritten, 0 added, 1 removed, 1 unchanged
PART III
Item 9C. DISCLOSURE REGARDING FOREIGN JURISDICTIONS THAT PREVENT INSPECTIONS
0 rewritten, 2 added, 0 removed, 0 unchanged
New section this year
Not applicable.
PART III
Item 10. DIRECTORS, EXECUTIVE OFFICERS AND CORPORATE GOVERNANCE
1 rewritten, 0 added, 0 removed, 3 unchanged
The information required by Item 10 of Form 10-K will appear in the Company’s proxy statement for its [removed: 2021] [added: 2022] Annual Meeting of Shareholders under the captions “Proposal 1 – Election of Directors,” “Executive Officers,” “Corporate Governance – Attendance and Committees of the Board – Audit Committee,” and “Corporate Governance – Director Nominations,” and the information therein is incorporated herein by reference.
Item 11. EXECUTIVE COMPENSATION
1 rewritten, 0 added, 0 removed, 0 unchanged
The information required by Item 11 of Form 10-K will appear in the Company’s proxy statement for its [removed: 2021] [added: 2022] Annual Meeting of Shareholders under the captions “Corporate Governance – Compensation Committee Interlocks and Insider Participation,” “Compensation Discussion and Analysis,” “Compensation Committee Report,” “Executive Compensation,” and “Director Compensation,” and the information therein is incorporated herein by reference.
Item 12. SECURITY OWNERSHIP OF CERTAIN BENEFICIAL OWNERS AND MANAGEMENT AND RELATED STOCKHOLDER MATTERS
1 rewritten, 0 added, 0 removed, 0 unchanged
The information required by Item 12 of Form 10-K will appear in the Company’s proxy statement for its [removed: 2021] [added: 2022] Annual Meeting of Shareholders under the captions “Equity Compensation Plan Information” and “Security Ownership of Management and Certain Beneficial Owners,” and the information therein is incorporated herein by reference.
Item 13. CERTAIN RELATIONSHIPS AND RELATED TRANSACTIONS, AND DIRECTOR INDEPENDENCE
1 rewritten, 0 added, 0 removed, 0 unchanged
The information required by Item 13 of Form 10-K will appear in the Company’s proxy statement for the [removed: 2021] [added: 2022] Annual Meeting of Shareholders under the captions “Corporate Governance – Independent Directors” and “Related Person Transactions,” and the information therein is incorporated herein by reference.
Item 14. PRINCIPAL ACCOUNTING FEES AND SERVICES
1 rewritten, 0 added, 0 removed, 1 unchanged
The information required by Item 14 of Form 10-K will appear in the Company’s proxy statement for its [removed: 2021] [added: 2022] Annual Meeting of Shareholders under the captions “Corporate Governance – Audit Committee Pre-Approval Policies and Procedures” and “Independent Registered Public Accounting Firm Fees and Services,” and the information therein is incorporated herein by reference.
Item 15. EXHIBITS, FINANCIAL STATEMENT SCHEDULES
4 rewritten, 2 added, 1 removed, 24 unchanged
Balance Sheets – December 31, [removed: 2020] [added: 2021] and December 31, [removed: 2019][added: 2020]
Statements of Operations – Years ended December 31, [removed: 2020,] [added: 2021,] December 31, [removed: 2019] [added: 2020] and December 31, [removed: 2018][added: 2019]
Statements of Changes in Shareholders’ Equity – Years ended December 31, [removed: 2020,] [added: 2021,] December 31, [removed: 2019] [added: 2020] and December 31, [removed: 2018][added: 2019]
Statements of Cash Flows – Years ended December 31, [removed: 2020,] [added: 2021,] December 31, [removed: 2019] [added: 2020] and December 31, [removed: 2018][added: 2019]
Report of Independent Registered Public Accounting Firm (PCAOB ID: 42)
| 2021 | | $ | 4,095 | | | $ | 3,773 | | | $ | 1,829 | | | $ | 6,039 | |
| 2018 | | $ | 3,488 | | | $ | 3,846 | | | $ | 3,702 | | | $ | 3,632 | |
Item 16. FORM 10-K SUMMARY
26 rewritten, 4 added, 5 removed, 141 unchanged
FOR YEAR ENDED DECEMBER 31, [removed: 2020][added: 2021]
| 3.2 | | [Amended and Restated Bylaws of Old Dominion Freight Line, Inc. [added: (as amended through May 19, 2021)] (Incorporated by reference to the exhibit of the same number contained in the Company’s [removed: Annual] [added: Current] Report on Form [removed: 10-K for the year ended December 31, 2012,] [added: 8-K] filed on [removed: February 28, 2013)](http://www.sec.gov/Archives/edgar/data/878927/000087892713000012/odflexhibit32bylaws.htm)] [added: May 20, 2021)](http://www.sec.gov/Archives/edgar/data/0000878927/000156459021029086/odfl-ex32_126.htm)] |
| [removed: 4.11] [added: 4.14] | | [removed: [Note Purchase Agreement] [added: [Second Amended and Restated Credit Agreement, dated November 21, 2019,] among Old Dominion Freight Line, [removed: Inc.] [added: Inc., Wells Fargo Bank, National Association, as Administrative Agent,] and the [removed: Purchasers set forth in Schedule A thereto, dated as of January 3, 2011] [added: Lenders named therein] (Incorporated by reference to the exhibit of the same number contained in the Company’s Current Report on Form 8-K filed on [removed: January 6, 2011)](http://www.sec.gov/Archives/edgar/data/878927/000129993311000081/exhibit2.htm)] [added: November 21, 2019)](http://www.sec.gov/Archives/edgar/data/0000878927/000156459019044074/odfl-ex414_53.htm)] |
| [removed: 10.18.14*] [added: 10.18.15*] | | [Old Dominion Freight Line, Inc. Non-Employee Director Compensation Structure, effective as of the [removed: 2020] [added: 2022] Annual Meeting of [removed: Shareholders (Incorporated by reference to the exhibit of the same number contained in the Company’s Annual Report on Form 10-K for the year ended December 31, 2019, filed on February 26, 2020)](http://www.sec.gov/Archives/edgar/data/878927/000156459020006626/odfl-ex101814_265.htm)] [added: Shareholders](https://www.sec.gov/Archives/edgar/data/878927/000156459022006303/odfl-ex1018_6.htm)] |
| [removed: 10.23.1*] [added: 10.23.4*] | | [Form of Old Dominion Freight Line, Inc. 2016 Stock Incentive Plan Restricted Stock Award Agreement [removed: (Employees) (Incorporated by reference to the exhibit of the same number contained in the Company’s Quarterly Report on Form 10-Q for the quarter ended June 30, 2016, filed on August 8, 2016)](http://www.sec.gov/Archives/edgar/data/878927/000087892716000079/odflexhibit10231-2q2016.htm)] [added: (Employees)](https://www.sec.gov/Archives/edgar/data/878927/000156459022006303/odfl-ex1023_8.htm)] |
| [removed: 10.23.3*] [added: 10.23.5*] | | [Form of Old Dominion Freight Line, Inc. 2016 Stock Incentive Plan Restricted Stock Unit Agreement (Performance-Based) [removed: (Employees) (Incorporated by reference to the exhibit of the same number contained in the Company’s Annual Report on Form 10-K for the year ended December 31, 2018, filed on February 27, 2019)](http://www.sec.gov/Archives/edgar/data/878927/000156459019004755/odfl-ex10233_187.htm)] [added: (Employees)](https://www.sec.gov/Archives/edgar/data/878927/000156459022006303/odfl-ex1023_12.htm)] |
| 23.1 | | [Consent of Ernst & Young [removed: LLP](https://www.sec.gov/Archives/edgar/data/878927/000156459021008056/odfl-ex231_12.htm)] [added: LLP](https://www.sec.gov/Archives/edgar/data/878927/000156459022006303/odfl-ex231_14.htm)] |
| 31.1 | | [Certification Pursuant to Rule 13a-14(a) or 15d-14(a) of the Exchange Act, as Adopted Pursuant to Section 302 of the Sarbanes-Oxley Act of [removed: 2002](https://www.sec.gov/Archives/edgar/data/878927/000156459021008056/odfl-ex311_11.htm)] [added: 2002](https://www.sec.gov/Archives/edgar/data/878927/000156459022006303/odfl-ex311_13.htm)] |
| 31.2 | | [Certification Pursuant to Rule 13a-14(a) or 15d-14(a) of the Exchange Act, as Adopted Pursuant to Section 302 of the Sarbanes-Oxley Act of [removed: 2002](https://www.sec.gov/Archives/edgar/data/878927/000156459021008056/odfl-ex312_8.htm)] [added: 2002](https://www.sec.gov/Archives/edgar/data/878927/000156459022006303/odfl-ex312_11.htm)] |
| 32.1 | | [Certification Pursuant to 18 U.S.C Section 1350, as Adopted Pursuant to Section 906 of the Sarbanes-Oxley Act of [removed: 2002](https://www.sec.gov/Archives/edgar/data/878927/000156459021008056/odfl-ex321_9.htm)] [added: 2002](https://www.sec.gov/Archives/edgar/data/878927/000156459022006303/odfl-ex321_9.htm)] |
| 32.2 | | [Certification Pursuant to 18 U.S.C Section 1350, as Adopted Pursuant to Section 906 of the Sarbanes-Oxley Act of [removed: 2002](https://www.sec.gov/Archives/edgar/data/878927/000156459021008056/odfl-ex322_7.htm)] [added: 2002](https://www.sec.gov/Archives/edgar/data/878927/000156459022006303/odfl-ex322_10.htm)] |
| 101 | | The following financial information from our Annual Report on Form 10-K for the year ended December 31, [removed: 2020,] [added: 2021,] filed on February [removed: 24, 2021,] [added: 23, 2022,] formatted in iXBRL (Inline eXtensible Business Reporting Language) includes: (i) the Balance Sheets at December 31, [removed: 2020] [added: 2021] and [removed: 2019,] [added: 2020,] (ii) the Statements of Operations for the years ended December 31, [removed: 2020, 2019] [added: 2021, 2020] and [removed: 2018,] [added: 2019,] (iii) the Statements of Changes in Shareholders’ Equity for the years ended December 31, [removed: 2020, 2019] [added: 2021, 2020] and [removed: 2018,] [added: 2019,] (iv) the Statements of Cash Flows for the years ended December 31, [removed: 2020, 2019] [added: 2021, 2020] and [removed: 2018,] [added: 2019,] and (v) the Notes to the Financial Statements |
| 104 | | The cover page from our Annual Report on Form 10-K for the year ended December 31, [removed: 2020,] [added: 2021,] formatted in iXBRL |
| Dated: | February [removed: 24, 2021] [added: 23, 2022] | | By: | /s/ GREG C. GANTT |
| /s/ DAVID S. CONGDON | | Executive Chairman of the Board of Directors | | February [removed: 24, 2021] [added: 23, 2022] |
| /s/ SHERRY A. AAHOLM | | Director | | February [removed: 24, 2021] [added: 23, 2022] |
| /s/ JOHN R. CONGDON, JR. | | Director | | February [removed: 24, 2021] [added: 23, 2022] |
| /s/ BRADLEY R. GABOSCH | | Director | | February [removed: 24, 2021] [added: 23, 2022] |
| /s/ PATRICK D. HANLEY | | Director | | February [removed: 24, 2021] [added: 23, 2022] |
| /s/ JOHN D. KASARDA | | Director | | February [removed: 24, 2021] [added: 23, 2022] |
| /s/ WENDY T. STALLINGS | | Director | | February [removed: 24, 2021] [added: 23, 2022] |
| /s/ LEO H. SUGGS | | Director | | February [removed: 24, 2021] [added: 23, 2022] |
| /s/ D. MICHAEL WRAY | | Director | | February [removed: 24, 2021] [added: 23, 2022] |
| /s/ GREG C. GANTT | | President, Chief Executive Officer and Director | | February [removed: 24, 2021] [added: 23, 2022] |
| /s/ ADAM N. SATTERFIELD | | Senior Vice President – Finance, | | February [removed: 24, 2021] [added: 23, 2022] |
| /s/ KIMBERLY S. MAREADY | | Vice President – Accounting and Finance | | February [removed: 24, 2021] [added: 23, 2022] |
| 4.15 | | [Description of Common Stock](https://www.sec.gov/Archives/edgar/data/878927/000156459022006303/odfl-ex415_7.htm) |
| /s/ THOMAS A. STITH, III | | Director | | February 23, 2022 |
| Thomas A. Stith, III | | | | |
| | | | | |
| Exhibit No. | | Description |
| --- | --- | --- |
| | | |
| 4.13 | | [Amended and Restated Credit Agreement among Wells Fargo Bank, National Association, as Administrative Agent; the Lenders named therein; and Old Dominion Freight Line, Inc., dated December 15, 2015 (Incorporated by reference to the exhibit of the same number contained in the Company’s Current Report on Form 8-K filed on December 21, 2015)](http://www.sec.gov/Archives/edgar/data/878927/000119312515408828/d106638dex413.htm) |
| 4.15 | | [Description of Common Stock (Incorporated by reference to the exhibit of the same number contained in the Company’s Annual Report on Form 10-K for the year ended December 31, 2019, filed on February 26, 2020)](http://www.sec.gov/Archives/edgar/data/878927/000156459020006626/odfl-ex415_266.htm) |