 filings.tools
ONEOK 10-K 2020-12-31
Filed 2021-02-23. 22 sections, 587K characters. Original on sec.gov · Markdown · JSON
Cover and table of contents
UNITED STATES
SECURITIES AND EXCHANGE COMMISSION
WASHINGTON, D.C. 20549
FORM 10-K
☒ ANNUAL REPORT PURSUANT TO SECTION 13 OR 15(d) OF THE SECURITIES EXCHANGE ACT OF 1934
For the fiscal year ended December 31, 2020.
OR
☐ TRANSITION REPORT PURSUANT TO SECTION 13 OR 15(d) OF THE SECURITIES EXCHANGE ACT OF 1934
For the transition period from __________ to __________.
Commission file number 001-13643

ONEOK, Inc.
(Exact name of registrant as specified in its charter)
| Oklahoma | 73-1520922 | ||||
| (State or other jurisdiction of incorporation or organization) | (I.R.S. Employer Identification No.) |
| 100 West Fifth Street, | Tulsa, | OK | 74103 | ||||||||||||||
| (Address of principal executive offices) | (Zip Code) |
Registrant’s telephone number, including area code (918) 588-7000
Securities registered pursuant to Section 12(b) of the Act:
| Title of each class | Trading Symbol(s) | Name of each exchange on which registered | ||||||
| Common stock, par value of $0.01 | OKE | New York Stock Exchange |
Securities registered pursuant to Section 12(g) of the Act: None
Indicate by check mark if the registrant is a well-known seasoned issuer, as defined in Rule 405 of the Securities Act. Yes ☒ No ☐.
Indicate by check mark if the registrant is not required to file reports pursuant to Section 13 or Section 15(d) of the Act. Yes ☐ No ☒.
Indicate by check mark whether the registrant (1) has filed all reports required to be filed by Section 13 or 15(d) of the Securities Exchange Act of 1934 during the preceding 12 months (or for such shorter period that the registrant was required to file such reports), and (2) has been subject to such filing requirements for the past 90 days. Yes ☒ No ☐
Indicate by check mark whether the registrant has submitted electronically every Interactive Data File required to be submitted pursuant to Rule 405 of Regulation S-T (§ 232.405 of this chapter) during the preceding 12 months (or for such shorter period that the registrant was required to submit such files). Yes ☒ No ☐
Indicate by check mark whether the registrant is a large accelerated filer, an accelerated filer, a non-accelerated filer, smaller reporting company or an emerging growth company. See the definitions of “large accelerated filer,” “accelerated filer,” “smaller reporting company” and “emerging growth company” in Rule 12b-2 of the Exchange Act.
Large accelerated filer ☒ Accelerated filer ☐ Non-accelerated filer ☐ Smaller reporting company ☐
Emerging growth company ☐
If an emerging growth company, indicate by check mark if the registrant has elected not to use the extended transition period for complying with any new or revised financial accounting standards provided pursuant to Section 13(a) of the Exchange Act. ☐
Indicate by check mark whether the registrant has filed a report on and attestation to its management’s assessment of the effectiveness of its internal control over financial reporting under Section 404(b) of the Sarbanes-Oxley Act (15 U.S.C. 7262(b)) by the registered public accounting firm that prepared or issued its audit report. ☒
Indicate by check mark whether the registrant is a shell company (as defined in Rule 12b-2 of the Act). Yes ☐ No ☒.
Aggregate market value of registrant’s common stock held by non-affiliates based on the closing trade price on June 30, 2020, was $14.5 billion.
On February 16, 2021, the Company had 444,983,595 shares of common stock outstanding.
DOCUMENTS INCORPORATED BY REFERENCE:
Portions of the definitive proxy statement to be delivered to shareholders in connection with the Annual Meeting of Shareholders to be held May 26, 2021, are incorporated by reference in Part III.
ONEOK, Inc.
2020 ANNUAL REPORT
As used in this Annual Report, references to “we,” “our,” or “us” refer to ONEOK, Inc., an Oklahoma corporation, and its predecessors and subsidiaries, unless the context indicates otherwise.
GLOSSARY
The abbreviations, acronyms and industry terminology used in this Annual Report are defined as follows:
| $1.5 Billion Term Loan Agreement | The senior unsecured delayed-draw three-year $1.5 billion term loan agreement dated November 19, 2018 | ||||
| $2.5 Billion Credit Agreement | ONEOK’s $2.5 billion revolving credit agreement, as amended | ||||
| AFUDC | Allowance for funds used during construction | ||||
| Annual Report | Annual Report on Form 10-K for the year ended December 31, 2020 | ||||
| ASU | Accounting Standards Update | ||||
| Bbl | Barrels, 1 barrel is equivalent to 42 United States gallons | ||||
| BBtu/d | Billion British thermal units per day | ||||
| Bcf | Billion cubic feet | ||||
| Bcf/d | Billion cubic feet per day | ||||
| CARES Act | Coronavirus Aid, Relief, and Economic Security Act | ||||
| CFTC | U.S. Commodity Futures Trading Commission | ||||
| Clean Air Act | Federal Clean Air Act, as amended | ||||
| Clean Water Act | Federal Water Pollution Control Act Amendments of 1972, as amended | ||||
| COVID-19 | Coronavirus disease 2019 | ||||
| DJ | Denver-Julesburg | ||||
| DOT | United States Department of Transportation | ||||
| EBITDA | Earnings before interest expense, income taxes, depreciation and amortization | ||||
| EPA | United States Environmental Protection Agency | ||||
| EPS | Earnings per share of common stock | ||||
| Exchange Act | Securities Exchange Act of 1934, as amended | ||||
| FERC | Federal Energy Regulatory Commission | ||||
| Fitch | Fitch Ratings, Inc. | ||||
| GAAP | Accounting principles generally accepted in the United States of America | ||||
| GHG | Greenhouse gas | ||||
| ICE | Intercontinental Exchange | ||||
| Intermediate Partnership | ONEOK Partners Intermediate Limited Partnership, a wholly owned subsidiary of ONEOK Partners, L.P. | ||||
| KCC | Kansas Corporation Commission | ||||
| LIBOR | London Interbank Offered Rate | ||||
| MBbl/d | Thousand barrels per day | ||||
| MDth/d | Thousand dekatherms per day | ||||
| MMBbl | Million barrels | ||||
| MMBbl/d | Million barrels per day | ||||
| MMBtu | Million British thermal units | ||||
| MMcf/d | Million cubic feet per day | ||||
| Moody’s | Moody’s Investors Service, Inc. | ||||
| Natural Gas Act | Natural Gas Act of 1938, as amended | ||||
| Natural Gas Policy Act | Natural Gas Policy Act of 1978, as amended | ||||
| NGL(s) | Natural gas liquid(s) | ||||
| NGL products | Marketable natural gas liquid purity products, such as ethane, ethane/propane mix, propane, iso-butane, normal butane and natural gasoline | ||||
| Northern Border Pipeline | Northern Border Pipeline Company, a 50% owned joint venture | ||||
| NYMEX | New York Mercantile Exchange | ||||
| NYSE | New York Stock Exchange | ||||
| OCC | Oklahoma Corporation Commission | ||||
| ONEOK | ONEOK, Inc. | ||||
| ONEOK Partners | ONEOK Partners, L.P., a wholly owned subsidiary of ONEOK, Inc. | ||||
| ONEOK Partners Term Loan Agreement | The senior unsecured three-year $1.0 billion term loan agreement dated January 8, 2016, as amended |
| ONEOK West Texas NGL | ONEOK West Texas NGL pipeline and Mesquite pipeline (formerly known as West Texas LPG pipeline and Mesquite pipeline) | ||||
| OPIS | Oil Price Information Service | ||||
| Overland Pass Pipeline | Overland Pass Pipeline Company, LLC, a 50% owned joint venture | ||||
| PHMSA | United States Department of Transportation Pipeline and Hazardous Materials Safety Administration | ||||
| POP | Percent of Proceeds | ||||
| Quarterly Report(s) | Quarterly Report(s) on Form 10-Q | ||||
| Roadrunner | Roadrunner Gas Transmission, LLC, a 50% owned joint venture | ||||
| RRC | Railroad Commission of Texas | ||||
| S&P | S&P Global Ratings | ||||
| SCOOP | South Central Oklahoma Oil Province, an area in the Anadarko Basin in Oklahoma | ||||
| SEC | Securities and Exchange Commission | ||||
| Securities Act | Securities Act of 1933, as amended | ||||
| Series E Preferred Stock | Series E Non-Voting, Perpetual Preferred Stock, par value $0.01 per share | ||||
| STACK | Sooner Trend Anadarko Canadian Kingfisher, an area in the Anadarko Basin in Oklahoma | ||||
| Tax Cuts and Jobs Act | H.R. 1, the tax reform bill, signed into law on December 22, 2017 | ||||
| Topic 606 | Accounting Standards Update 2014-09, “Revenue from Contracts with Customers” | ||||
| WTI | West Texas Intermediate | ||||
| XBRL | eXtensible Business Reporting Language |
The statements in this Annual Report that are not historical information, including statements concerning plans and objectives of management for future operations, economic performance or related assumptions, are forward-looking statements. Forward-looking statements may include words such as “anticipate,” “believe,” “continue,” “could,” “estimate,” “expect,” “forecast,” “goal,” “guidance,” “intend,” “may,” “might,” “outlook,” “plan,” “potential,” “project,” “scheduled,” “should,” “will,” “would” and other words and terms of similar meaning. Although we believe that our expectations regarding future events are based on reasonable assumptions, we can give no assurance that such expectations or assumptions will be achieved. Important factors that could cause actual results to differ materially from those in the forward-looking statements are described under Part I, Item 1A, Risk Factors, and Part II, Item 7, Management’s Discussion and Analysis of Financial Condition and Results of Operations and “Forward-Looking Statements,” in this Annual Report.
PART I
Item 1. BUSINESS
GENERAL
We are incorporated under the laws of the state of Oklahoma, and our common stock is listed on the NYSE under the trading symbol “OKE.” We are a leading midstream service provider and own one of the nation’s premier NGL systems, connecting NGL supply in the Rocky Mountain, Permian and Mid-Continent regions with key market centers and an extensive network of natural gas gathering, processing, storage and transportation assets. We apply our core capabilities of gathering, processing, fractionating, transporting, storing and marketing natural gas and NGLs through vertical integration across the midstream value chain to provide our customers with premium services while generating consistent and sustainable earnings growth.
Midstream Value Chain
| Legend | 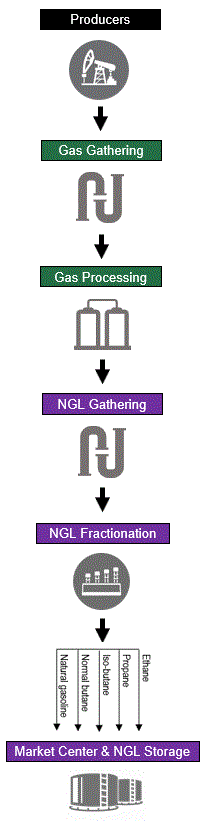 | ||||||||||||||||
| We are connected to supply in natural gas and NGL producing basins and have significant basin diversification, including the Williston, Permian, Powder River and DJ Basins and the STACK and SCOOP areas. In our Natural Gas Gathering and Processing segment, we have more than 3 million dedicated acres in the Williston Basin and approximately 300,000 dedicated acres in the STACK and SCOOP areas. In our Natural Gas Liquids segment, we are the largest NGL takeaway provider in the Williston and Powder River Basins; Oklahoma, including the STACK and SCOOP areas; Kansas; and the Texas Panhandle. We also have a significant presence in the Permian Basin. | |||||||||||||||||
| Natural Gas Gathering & Processing | |||||||||||||||||
| Natural Gas Liquids | |||||||||||||||||
| Natural Gas Pipelines | |||||||||||||||||
| Raw natural gas is typically gathered at the wellhead, compressed and transported through pipelines to our processing facilities. Most raw natural gas produced at the wellhead contains a mixture of NGL components, including ethane, propane, iso-butane, normal butane and natural gasoline. | |||||||||||||||||
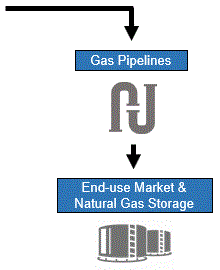
| Gathered wellhead natural gas is directed to our processing plants to remove NGLs, resulting in residue natural gas (primarily methane). | Once processed, residue natural gas is recompressed and delivered to intrastate and interstate natural gas pipelines primarily in our Natural Gas Pipelines segment. | ||||||||||||||||
 | |||||||||||||||||
| NGLs extracted at processing plants, both third-party and our own, are then gathered by our NGL gathering pipelines. | |||||||||||||||||
| Gathered NGLs are directed to our downstream fractionators in the Mid-Continent region and Mont Belvieu, Texas, to be separated into purity products. | |||||||||||||||||
| Residue natural gas is transported to storage facilities and end users, such as large industrial customers, natural gas and electric utilities serving commercial and residential consumers, and international markets through liquefied natural gas exports and cross-border pipelines. | |||||||||||||||||
| Purity products are stored or distributed to our customers, such as petrochemical companies, propane distributors, heating fuel users, ethanol producers, refineries and exporters. | |||||||||||||||||
EXECUTIVE SUMMARY
Business Update, Market Conditions and COVID-19 - Late in the first quarter 2020, the energy industry experienced historic events that led to a simultaneous demand and supply disruption. The World Health Organization declared COVID-19 a global pandemic and recommended containment and mitigation measures worldwide, which contributed to a massive economic slowdown and decreased demand for crude oil. In addition, Saudi Arabia and Russia increased production of crude oil as the two countries competed for market share. As a result, the global supply of crude oil significantly exceeded demand and led to a collapse in crude oil prices. Crude oil prices and the related impact on crude oil drilling impacts our business due to associated natural gas, which is natural gas produced by oil wells. Associated natural gas contains NGLs. The decline of crude oil prices resulted in crude oil and associated natural gas and NGL production being curtailed in the second quarter 2020. We are still experiencing global and regional economic disruptions due primarily to COVID-19; however, in the third quarter 2020, many of our producers reversed curtailments, bringing volumes back to pre-COVID-19 levels as prices and demand significantly improved from second quarter 2020 lows. The full impact of the continued global and regional economic disruption will depend on the unknown duration and severity of COVID-19 and, among other things, the impact of governmental actions imposed in response to COVID-19, the pace and scale of economic recovery and corresponding demand for crude oil and the impacts to commodity prices. We continue to monitor producers’ drilling, completion and production plans, which are increasingly positive as commodity prices have stabilized and improved, and our expectations for 2021 include the potential for an improving pace of drilling and completion activity.
The energy industry has experienced many up and down cycles, and as a result, we have positioned ourselves to minimize exposure to direct c
Showing the first 8K of 77K characters. Open the full section
Item 1A. RISK FACTORS
Our investors should consider the following risks that could affect us and our business. Although we have tried to identify key factors, our investors need to be aware that other risks may prove to be important in the future. New risks may emerge at any time, and we cannot predict such risks or estimate the extent to which they may affect our financial performance. Investors should consider carefully the following discussion of risks and the other information included or incorporated by reference in this Annual Report, including “Forward-Looking Statements,” which are included in Part II, Item 7, Management’s Discussion and Analysis of Financial Condition and Results of Operations.
RISK FACTORS RELATED TO OUR BUSINESS AND INDUSTRY
The COVID-19 pandemic has affected adversely, and could further affect adversely, our results of operations.
The COVID-19 pandemic led to global and regional economic disruption, volatility in the financial markets and a weakened commodity price environment. The outbreak and government measures taken in response, including extended quarantines, closures and reduced operations of businesses had a significant adverse impact, both direct and indirect, on our business and the economy. Due to reductions in economic activity, the world experienced reduced demand for crude oil, refined products, NGLs and natural gas, and weakened commodity prices, which affected adversely our operations.
Uncertainty remains regarding the duration of global impacts due to COVID-19 and the possible resurgence or mutation of the virus. This uncertainty, and the occurrence of these events and measures taken in response, could further affect adversely our results of operations by, among other things, reducing demand for the services we provide, impacting our supply chains and the availability and efficiency of our workforce, creating operational challenges and impacting our ability to access capital markets. The degree to which the pandemic further impacts our business and results of operations will depend on future developments beyond our control, including the success of actions to contain the virus, the length of time needed to vaccinate a significant segment of the global population, how quickly and to what extent normal economic and operating conditions can resume, and the severity and duration of the global and regional economic downturn that results from the pandemic.
If the level of drilling in the regions in which we operate declines substantially near our assets, our volumes and revenues could decline.
Our gathering and transportation pipeline systems are dependent upon production from natural gas and crude oil wells, which naturally declines over time. As a result, our cash flows associated with these wells will also decline over time. In order to maintain or increase throughput levels on our gathering and transportation pipeline systems and the asset utilization rates at our processing and fractionation facilities, we must continually obtain new supplies. Our ability to maintain or expand our businesses depends largely on the level of drilling and production by third parties in the regions in which we operate. Our natural gas and NGL supply volumes may be impacted if producers curtail or redirect drilling and production activities. Drilling and production are impacted by factors beyond our control, including:
-
demand and prices for natural gas, NGLs and crude oil;
-
producers’ access to capital;
-
producers’ finding and development costs of reserves;
-
producers’ desire and ability to obtain necessary permits, drilling rights and surface access in a timely manner and on reasonable terms;
-
crude oil and associated natural gas field characteristics and production performance; and
-
capacity constraints and/or shut downs on the pipelines that transport crude oil, natural gas and NGLs from producing areas and our facilities.
Commodity prices have experienced significant volatility. Drilling and production activity levels may vary across our geographic areas; however, a prolonged period of low commodity prices may reduce drilling and production activities across all areas. If we are not able to obtain new supplies to replace the natural decline in volumes from existing wells or because of competition, throughput on our gathering and transportation pipeline systems and the utilization rates of our processing and fractionation facilities would decline, which could affect adversely our business, results of operations, financial position and cash flows, and our ability to pay cash dividends.
Our operating results may be affected adversely by unfavorable economic and market conditions.
In addition to impacts from the COVID-19 pandemic, an adverse change in economic conditions worldwide or in the economic regions in which we operate could negatively affect the crude oil and natural gas markets, as well as in the specific segments in which we operate, resulting in reduced demand and increased price competition for our services and products. Our operating results in one or more geographic regions may also be affected by uncertain or changing economic conditions within that region. Volatility in commodity prices may have an impact on many of our suppliers and customers, which, in turn, could have a negative impact on their ability to meet their obligations to us. Periods of severe volatility in equity and credit markets may disrupt our access to such markets, make it difficult to obtain financing necessary to expand facilities or acquire assets, increase financing costs and result in the imposition of restrictive financial covenants. If adverse global or regional economic and market conditions remain uncertain or persist, spread or deteriorate further, we may experience material impacts on our business, results of operations, financial position, cash flows and liquidity.
The volatility of natural gas, crude oil and NGL prices could affect adversely our earnings and cash flows.
Lower commodity prices could reduce crude oil, natural gas and NGL production which could decrease the demand for our services. Additionally, a significant portion of our revenues are derived from the sale of commodities that are received in conjunction with natural gas gathering and processing services, the transportation and storage of natural gas, and from the purchase and sale of NGLs and NGL products. As commodity prices decline, we could be paid less for our commodities thereby reducing our cash flows. Historically, commodity prices have been volatile and can change quickly. For example, in March 2020, unsuccessful negotiations between the Organization of the Petroleum Exporting Countries (OPEC) and Russia regarding crude oil production cuts resulted in a price war between Saudi Arabia and Russia. As a result, the global supply of crude oil significantly exceeded demand and led to a collapse in crude oil prices. It is likely that commodity prices will continue to be volatile in the future.
The prices we receive for our commodities are subject to wide fluctuations in response to a variety of factors beyond our control, including, but not limited to, the following:
-
overall domestic and global economic conditions;
-
relatively minor changes in the supply of, and demand for, domestic and foreign energy;
-
market uncertainty;
-
geopolitical conditions impacting supply and demand for natural gas, NGLs and crude oil;
-
production decisions by other countries, such as the failure of countries to abide by recent agreements to reduce production volumes;
-
the availability and cost of third-party transportation, natural gas processing and fractionation capacity;
-
the level of consumer product demand and storage inventory levels;
-
ethane rejection;
-
weather conditions;
-
domestic and foreign governmental regulations and taxes;
-
the price and availability of alternative fuels;
-
speculation in the commodity futures markets;
-
th
Showing the first 8K of 63K characters. Open the full section
Item 1B. UNRESOLVED STAFF COMMENTS
Not applicable.
Item 2. PROPERTIES
A description of our properties is included in Item 1, Business.
Item 3. LEGAL PROCEEDINGS
Information about our legal proceedings is included in Note N of the Notes to Consolidated Financial Statements in this Annual Report.
Item 4. MINE SAFETY DISCLOSURES
Not applicable.
PART II
Item 5. MARKET FOR REGISTRANT’S COMMON EQUITY, RELATED STOCKHOLDER MATTERS AND ISSUER PURCHASES OF EQUITY SECURITIES
Our common stock is listed on the NYSE under the trading symbol “OKE.” The corporate name ONEOK is used in newspaper stock listings.
At February 16, 2021, there were 13,844 holders of record of our 444,983,595 outstanding shares of common stock.
For information regarding our Employee Stock Award Program and other equity compensation plans, see Note J of the Notes to Consolidated Financial Statements and “Equity Compensation Plan Information” included in Part III, Item 12, Security Ownership of Certain Beneficial Owners and Management and Related Stockholder Matters, in this Annual Report.
PERFORMANCE GRAPH
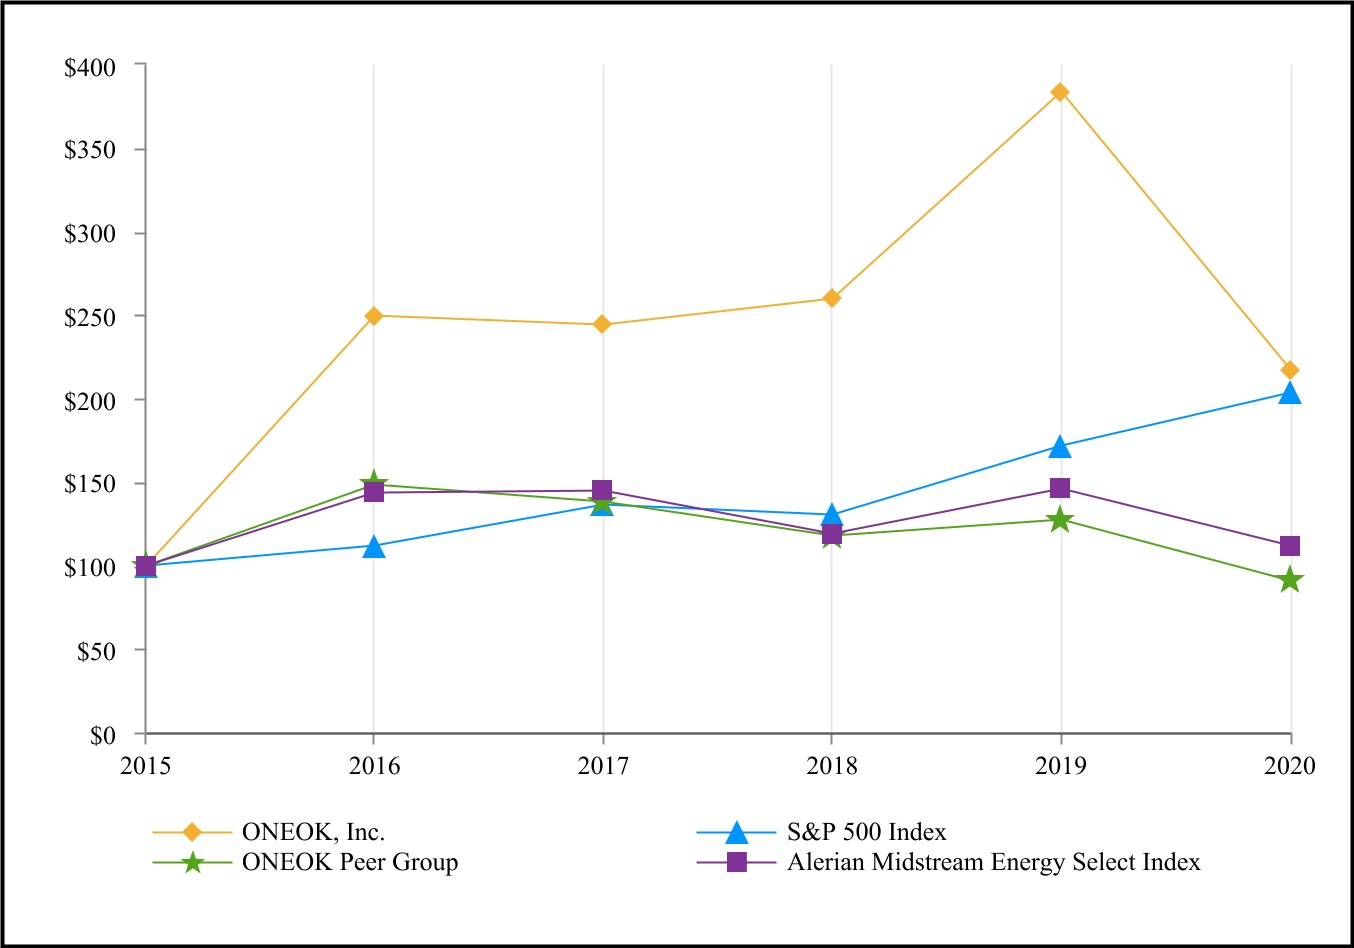
The following performance graph compares the performance of our common stock with the S&P 500 Index, the Alerian Midstream Energy Select Index and a ONEOK Peer Group during the period beginning on December 31, 2015, and ending on December 31, 2020.
Value of a $100 Investment, Assuming Reinvestment of Distributions/Dividends,
at December 31, 2015, and at the End of Every Year Through December 31, 2020.
| Cumulative Total Return | ||||||||||||||||||||||||||||||||
| Years Ended December 31, | ||||||||||||||||||||||||||||||||
| 2016 | 2017 | 2018 | 2019 | 2020 | ||||||||||||||||||||||||||||
| ONEOK, Inc. | $ | 249.37 | $ | 244.18 | $ | 259.53 | $ | 383.51 | $ | 217.21 | ||||||||||||||||||||||
| S&P 500 Index | $ | 111.96 | $ | 136.40 | $ | 130.42 | $ | 171.49 | $ | 203.04 | ||||||||||||||||||||||
| ONEOK Peer Group (a) | $ | 148.02 | $ | 138.01 | $ | 117.37 | $ | 127.36 | $ | 90.69 | ||||||||||||||||||||||
| Alerian Midstream Energy Select Index (b) | $ | 143.55 | $ | 144.65 | $ | 119.08 | $ | 145.69 | $ | 111.56 |
(a) - The ONEOK Peer Group is composed of the following companies: DCP Midstream, LP; Enable Midstream Partners, LP; Energy Transfer LP; EnLink Midstream, LLC; Enterprise Products Partners L.P.; Kinder Morgan, Inc.; Magellan Midstream Partners, L.P.; MPLX LP; NuStar Energy L.P.; Plains All American Pipeline, L.P.; Targa Resources Corp.; and The Williams Companies, Inc.
(b) - The Alerian Midstream Energy Select Index measures the composite performance of approximately 36 North American energy infrastructure companies who are engaged in midstream activities involving energy commodities.
Item 6. SELECTED FINANCIAL DATA
The following table sets forth our selected financial data for the periods indicated:
| Years Ended December 31, | ||||||||||||||||||||||||||||||||
| 2020 | 2019 | 2018 | 2017 | 2016 | ||||||||||||||||||||||||||||
| (Millions of dollars, except per share data) | ||||||||||||||||||||||||||||||||
| Revenues | $ | 8,542.2 | $ | 10,164.4 | $ | 12,593.2 | $ | 12,173.9 | $ | 8,920.9 | ||||||||||||||||||||||
| Net income | $ | 612.8 | $ | 1,278.6 | $ | 1,155.0 | $ | 593.5 | $ | 743.5 | ||||||||||||||||||||||
| Total assets | $ | 23,078.8 | $ | 21,812.1 | $ | 18,231.7 | $ | 16,845.9 | $ | 16,138.8 | ||||||||||||||||||||||
| Long-term debt, including current maturities | $ | 14,236.1 | $ | 12,487.4 | $ | 9,381.0 | $ | 8,524.3 | $ | 8,330.6 | ||||||||||||||||||||||
| EPS - total | ||||||||||||||||||||||||||||||||
| Basic | $ | 1.42 | $ | 3.09 | $ | 2.80 | $ | 1.30 | $ | 1.67 | ||||||||||||||||||||||
| Diluted | $ | 1.42 | $ | 3.07 | $ | 2.78 | $ | 1.29 | $ | 1.66 | ||||||||||||||||||||||
| Dividends declared per share of common stock | $ | 3.74 | $ | 3.53 | $ | 3.245 | $ | 2.72 | $ | 2.46 |
Changes in commodity prices and sales volumes affect both revenue and cost of sales and fuel, and, therefore, the changes in revenue in the above table are largely offset in cost of sales and fuel.
In 2020, we incurred $644.9 million in noncash impairment charges, which had an adverse impact on our financial results for the year ended December 31, 2020. In 2017, we recorded noncash impairment charges of $20.2 million.
Upon adoption of Topic 606 in January 2018, we determined that certain Natural Gas Gathering and Processing segment fee with POP contracts and Natural Gas Liquids segment exchange services contracts that include the purchase of commodities are supplier contracts. Contractual fees in these identified contracts are recorded as a reduction of the commodity purchase price in cost of sales and fuel. In 2017 and prior periods, these fees were recorded as services revenue.
In 2017, we recorded a one-time noncash charge to net income through income tax expense of $141.3 million, related to the revaluation of our deferred tax balances and a valuation allowance on certain state net operating loss and tax credit carryforwards resulting from the enactment of the Tax Cuts and Jobs Act.
Item 7. MANAGEMENT’S DISCUSSION AND ANALYSIS OF FINANCIAL CONDITION AND RESULTS OF OPERATIONS
The following discussion and analysis should be read in conjunction with Part I, Item 1, Business, our audited Consolidated Financial Statements and the Notes to Consolidated Financial Statements in this Annual Report.
RECENT DEVELOPMENTS
Please refer to the “Financial Results and Operating Information” and “Liquidity and Capital Resources” sections of Management’s Discussion and Analysis of Financial Condition and Results of Operations in this Annual Report for additional information.
COVID-19 - While we are still experiencing global and regional economic disruption due primarily to COVID-19, our producers have reversed curtailments that were put in place during the second quarter 2020, bringing volumes back to pre-COVID-19 levels as prices significantly improved from second quarter 2020 lows. The full impact of the continued global and regional economic disruption will depend on the unknown duration and severity of COVID-19, and, among other things, the impact of governmental actions imposed in response to COVID-19, the pace and scale of economic recovery and corresponding demand for crude oil, and the impacts to commodity prices. We continue to monitor producers’ drilling, completion and production plans, which are increasingly positive as commodity prices have stabilized and improved, and our expectations for 2021 include the potential for an improving pace of drilling and completion activity.
In this challenging market environment, we expect to maintain sufficient liquidity and financial stability into 2021 due to cash on hand from our June 2020 equity issuance, cash flows from operations and access to our undrawn $2.5 Billion Credit Agreement. We have no debt maturities prior to 2022, and our investment-grade credit ratings have remained stable.
Sustainability - In 2020, we were included in the Dow Jones Sustainability North America Index for the second consecutive year and added to the Dow Jones Sustainability World Index (DJSI World), which recognize companies for industry-leading
environmental, social and governance performance. We are currently the only North American energy company included in the DJSI World group of global sustainability leaders. We continue to look for ways to reduce our environmental impact and utilize more efficient technologies. We are preparing for the future energy transition and our role in meeting the world’s energy needs in an environmentally responsible way.
Growth Projects - We operate an integrated, reliable and diversified network of NGL and natural gas gathering, processing, fractionation, storage and transportation assets connecting supply in the Rocky Mountain, Mid-Continent and Permian regions with key market centers. We have completed significant capital-growth projects that include NGL pipelines, NGL fractionators, natural gas processing plants and related natural gas and NGL infrastructure. These projects provide us the capacity to benefit from future supply growth without significant capital investment. In the first quarter 2020, due to the decline in commodity prices and economic demand disruption caused by COVID-19, we suspended our announced plans to construct the Demicks Lake III natural gas processing plant, the fourth expansion of the ONEOK West Texas NGL pipeline system, and reduced the scope of the expansion of our Elk Creek pipeline and various other paused projects. These projects can be restarted quickly when producer activity warrants additional infrastructure. Our announced capital-growth projects are outlined in the table below:
| Project (b) | Scope | Approximate Costs (a) | Completion | ||||||||
| Natural Gas Gathering and Processing | (In millions) | ||||||||||
| Demicks Lake I plant and related infrastructure | 200 MMcf/d processing plant and related gathering infrastructure in the core of the Williston Basin | $400 | Completed October 2019 | ||||||||
| Supported by acreage dedications with long-term primarily fee-based contracts | |||||||||||
| Demicks Lake II plant and related infrastructure | 200 MMcf/d processing plant and related gathering infrastructure in the core of the Williston Basin | $410 | Completed January 2020 | ||||||||
| Supported by acreage dedications with long-term primarily fee-based contracts | |||||||||||
| Bear Creek plant expansion and related infrastructure | 200 MMcf/d processing plant expansion and related gathering infrastructure in the Williston Basin | $405 | Paused (c) | ||||||||
| Supported by acreage dedications with long-term primarily fee-based contracts | |||||||||||
| Natural Gas Liquids | |||||||||||
| Elk Creek pipeline and related infrastructure | 900-mile NGL pipeline from the Williston Basin to the Mid-Continent region, with capacity of up to 240 MBbl/d, and related infrastructure | $1,400 | Completed December 2019 | ||||||||
| Anchored by long-term contracts | |||||||||||
| Expansion capability up to 400 MBbl/d with additional pump facilities | |||||||||||
| Arbuckle II pipeline and related infrastructure | 530-mile NGL pipeline from the STACK area to Mont Belvieu, Texas, and related infrastructure | $1,360 | Completed March 2020 | ||||||||
| Supported by long-term contracts | |||||||||||
| Expansion capability up to 1 MMBbl/d | |||||||||||
| MB-4 fractionator and related infrastructure | 125 MBbl/d NGL fractionator in Mont Belvieu, Texas, and related infrastructure, which includes additional NGL storage in Mont Belvieu | $575 | Completed March 2020 (d) | ||||||||
| Fully contracted with long-term contracts | |||||||||||
| ONEOK West Texas NGL pipeline expansion and Arbuckle II connection | Increasing mainline capacity by 80 MBbl/d with additional pump facilities and pipeline looping | $295 | Completed June 2020 (e) | ||||||||
| Connecting ONEOK West Texas NGL pipeline system to the Arbuckle II pipeline | |||||||||||
| Supported by long-term dedicated production from six third-party processing plants expected to produce up to 60 MBbl/d | |||||||||||
| Bakken NGL pipeline extension | 75-mile NGL pipeline in the Williston Basin connecting to a third-party processing plant | $100 | Completed August 2020 | ||||||||
| Supported by a long-term contract with a minimum volume commitment | |||||||||||
| Arbuckle II extension project and additional gathering infrastructure | Provide additional takeaway capacity in the STACK area | $240 | Completed | ||||||||
| Allow increasing volumes on the Elk Creek pipeline access to fractionation capacity at Mont Belvieu, Texas | August 2020 | ||||||||||
| Arbuckle II pipeline expansion | Increasing mainline capacity with additional pump facilities | $60 | Paused (c) | ||||||||
| Increases capacity to 500 MBbl/d | |||||||||||
| MB-5 fractionator and related infrastructure | 125 MBbl/d NGL fractionator in Mont Belvieu, Texas, and related infrastructure, which includes additional NGL storage in Mont Belvieu | $750 | Paused (c) | ||||||||
| Fully contracted with long-term contracts | |||||||||||
| ONEOK West Texas NGL pipeline expansion | Increasing mainline capacity by 40 MBbl/d | $145 | Paused (c) | ||||||||
| Supported by long-term dedicated production from third-party processing plant |
Showing the first 8K of 97K characters. Open the full section
Item 7A. QUANTITATIVE AND QUALITATIVE DISCLOSURES ABOUT MARKET RISK
Our exposure to market risk discussed below includes forward-looking statements and represents an estimate of possible changes in future earnings that could occur assuming hypothetical future movements in interest rates or commodity prices. Our views on market risk are not necessarily indicative of actual results that may occur and do not represent the maximum possible gains and losses that may occur since actual gains and losses will differ from those estimated based on actual fluctuations in interest rates or commodity prices and the timing of transactions.
We are exposed to market risk due to commodity price and interest-rate volatility. Market risk is the risk of loss arising from adverse changes in market rates and prices. We may use financial instruments, including forward sales, swaps, options and futures, to manage the risks of certain identifiable or anticipated transactions and achieve more predictable cash flows. Our risk-management function follows policies and procedures established by our Risk Oversight and Strategy Committee to monitor our natural gas, condensate and NGL marketing activities and interest rates to ensure our hedging activities mitigate market risks and comply with approved thresholds or limits. We do not use financial instruments for trading purposes.
We utilize a sensitivity analysis model to assess the risk associated with our derivative portfolio. The sensitivity analysis measures the potential change in fair value of our derivative instruments based upon a hypothetical 10% movement in the underlying commodity prices or interest rates. In addition to these variables, the fair value of our derivative portfolio is influenced by fluctuations in the notional amounts of the instruments and the discount rates used to determine the present values. Because we enter into these derivative instruments for the purpose of mitigating the risks that accompany certain of our business activities, as described below, the change in the market value of our derivative portfolio would typically be offset largely by a corresponding gain or loss on the hedged item.
See Note A of the Notes to Consolidated Financial Statements in this Annual Report for discussion on our accounting policies for our derivative instruments and the impact on our Consolidated Financial Statements.
COMMODITY PRICE RISK
As part of our hedging strategy, we use commodity derivative financial instruments and physical-forward contracts described in Note C of the Notes to Consolidated Financial Statements in this Annual Report to reduce the impact of near-term price fluctuations of natural gas, NGLs and condensate.
Although our businesses are primarily fee-based, in our Natural Gas Gathering and Processing segment, we are exposed to commodity price risk as a result of retaining a portion of the commodity sales proceeds associated with our fee with POP contracts. Under certain fee with POP contracts, our contractual fees and POP percentage may increase or decrease if production volumes, delivery pressures or commodity prices change relative to specified thresholds. We are exposed to basis risk between the various production and market locations where we buy and sell commodities.
The following table presents the effect a hypothetical 10% change in the underlying commodity prices would have on the estimated fair value of our commodity derivative instruments for the periods indicated:
| Commodity Contracts | December 31, 2020 | December 31, 2019 | |||||||||
| (Millions of dollars) | |||||||||||
| Crude oil and NGLs | $ | 20.0 | $ | 26.1 | |||||||
| Natural gas | 10.6 | 12.7 | |||||||||
| Total change in estimated fair value of commodity contracts | $ | 30.6 | $ | 38.8 |
Our sensitivity analysis represents an estimate of the reasonably possible gains and losses that would be recognized on our commodity derivative contracts assuming hypothetical movements in future market prices and is not necessarily indicative of actual results that may occur. Actual gains and losses may differ from estimates due to actual fluctuations in market prices, as well as changes in our commodity derivative portfolio during the year.
The following tables set forth hedging information for our Natural Gas Gathering and Processing segment’s forecasted equity volumes for the periods indicated:
| Year Ending December 31, 2021 | |||||||||||||||||||||||
| Volumes Hedged | Average Price | Percentage Hedged | |||||||||||||||||||||
| NGLs - excluding ethane (MBbl/d) - Conway/Mont Belvieu | 10.4 | $ | 0.51 | / gallon | 60% | ||||||||||||||||||
| Condensate (MBbl/d) - WTI-NYMEX | 2.9 | $ | 42.87 | / Bbl | 74% | ||||||||||||||||||
| Natural gas (BBtu/d) - NYMEX and basis | 118.6 | $ | 2.64 | / MMBtu | 75% |
Our Natural Gas Gathering and Processing segment’s commodity price sensitivity is estimated as a hypothetical change in the price of NGLs, crude oil and natural gas at December 31, 2020. Condensate sales are typically based on the price of crude oil. Assuming normal operating conditions, we estimate the following for our forecasted equity volumes:
-
a $0.01 per gallon change in the composite price of NGLs, excluding ethane, would change adjusted EBITDA for the year ending December 31, 2021, by $2.7 million;
-
a $1.00 per barrel change in the price of crude oil would change adjusted EBITDA for the year ending December 31, 2021, by $1.4 million; and
-
a $0.10 per MMBtu change in the price of residue natural gas would change adjusted EBITDA for the year ending December 31, 2021, by $5.8 million.
These estimates do not include any effects of hedging or effects on demand for our services or natural gas processing plant operations that might be caused by, or arise in conjunction with, commodity price fluctuations. For example, a change in the gross processing spread may cause a change in the amount of ethane extracted from the natural gas stream, impacting gathering and processing financial results for certain contracts.
INTEREST-RATE RISK
We are exposed to interest-rate risk through borrowings under our $2.5 Billion Credit Agreement, commercial paper program and long-term debt issuances. Future increases in commercial paper rates or bond rates could expose us to increased interest costs on future borrowings. We manage interest-rate risk through the use of fixed-rate debt, floating-rate debt and interest-rate swaps. Interest-rate swaps are agreements to exchange interest payments at some future point based on specified notional amounts. In 2020, we settled $750 million of our forward-starting interest-rate swaps related to our underwritten public offerings of $1.75 billion senior unsecured notes and the remaining $1.3 billion of our interest-rate swaps used to hedge our LIBOR-based interest payments upon repayment of the remaining balance of our $1.5 Billion Term Loan Agreement.
At December 31, 2020 and 2019, we had forward-starting interest-rate swaps with notional amounts totaling $1.1 billion and $1.8 billion, respectively, to hedge the variability of interest payments on a portion of our forecasted debt issuances. At December 31, 2019, we had interest-rate swaps with notional amounts totaling $1.3 billion to hedge the variability of our LIBOR-based interest payments, all of which have settled as of December 31, 2020. All of our interest-rate swaps are designated as cash flow hedges. At December 31, 2020, we had derivative liabilities of $203.4 million related to these interest-rate swaps. At December 31, 2019, we had derivative assets of $0.6 million and derivative liabilities of $201.9 million related to these interest-rate swaps.
The following table presents the effect of a 10% hypothetical change in interest rates on the estimated fair value of our interest- rate derivative instruments for the periods indicated:
| December 31, 2020 | December 31, 2019 | ||||||||||
| (Millions of dollars) | |||||||||||
| Forward-starting interest-rate swaps | $ | 12.9 | $ | 40.5 |
Our sensitivity analysis represents an estimate of the reasonably possible gains and losses that would be recognized on our interest-rate derivative contracts assuming hypothetical movements in future interest rates and is not necessarily indicative of actual results that may occur. Actual gains and losses may differ from estimates due to actual fluctuations in interest rates, as well as changes in our interest-rate derivative portfolio during the year.
See Note C of the Notes to Consolidated Financial Statements in this Annual Report for more information on our hedging activities.
COUNTERPARTY CREDIT RISK
We assess the creditworthiness of our counterparties on an ongoing basis and require security, including prepayments and other forms of collateral, when appropriate. Certain of our counterparties may be impacted by a relatively low commodity price environment and could experience financial problems, which could result in nonpayment and/or nonperformance, which could impact adversely our results of operations.
Natural Gas Gathering and Processing - Our Natural Gas Gathering and Processing segment derives services revenue primarily from major and independent crude oil and natural gas producers, which include both large integrated and independent exploration and production companies. In this segment, our downstream commodity sales customers are primarily utilities, large industrial companies, marketing companies and our NGL affiliate. We are not typically exposed to material credit risk with producers under fee with POP contracts as we sell the commodities and remit a portion of the sales proceeds back to the producer less our contractual fees. In 2020 and 2019, approximately 90% of the downstream commodity sales in our Natural Gas Gathering and Processing segment were made to customers rated investment-grade by S&P, approved through comparable internal counterparty analysis, or were secured by letters of credit or other collateral.
Natural Gas Liquids - Our Natural Gas Liquids segment’s counterparties are primarily NGL and natural gas gathering and processing companies; major and independent crude oil and natural gas production companies; utilities; large industrial companies; natural gasoline distributors; propane distributors; municipalities; and petrochemical, refining and marketing companies. We charge fees to NGL and natural gas gathering and processing counterparties and NGL pipeline transportation customers. We are not typically exposed to material credit risk on the majority of our exchange services fees, as we purchase NGLs from our gathering and processing counterparties and deduct our fee from the amounts we remit. We also earn sales revenue on the downstream sales of NGL products. In 2020 and 2019, approximately 75% and 80%, respectively, of this segment’s commodity sales were made to customers rated investment-grade by S&P, approved through comparable internal counterparty analysis, or were secured by letters of credit or other collateral. In addition, the majority of our Natural Gas Liquids segment’s pipeline tariffs provide us the ability to require security from shippers.
Natural Gas Pipelines - Our Natural Gas Pipelines segment’s customers are primarily local natural gas distribution companies, electric-generation facilities, large industrial companies, municipalities, producers, processors and marketing companies. In 2020 and 2019, approximately 85% of our revenues in this segment were from customers rated investment-grade by S&P, approved through comparable internal counterparty analysis, or were secured by letters of credit or other collateral. In addition, the majority of our Natural Gas Pipelines segment’s pipeline tariffs provide us the ability to require security from shippers.
Item 8. FINANCIAL STATEMENTS AND SUPPLEMENTARY DATA
Report of Independent Registered Public Accounting Firm
To the Board of Directors and Shareholders of ONEOK, Inc.
Opinions on the Financial Statements and Internal Control over Financial Reporting
We have audited the accompanying consolidated balance sheets of ONEOK, Inc. and its subsidiaries (the “Company”) as of December 31, 2020 and 2019, the related consolidated statements of income, of comprehensive income, of changes in equity and of cash flows for each of the three years in the period ended December 31, 2020, including the related notes (collectively referred to as the “consolidated financial statements”). We also have audited the Company's internal control over financial reporting as of December 31, 2020, based on criteria established in Internal Control - Integrated Framework (2013) issued by the Committee of Sponsoring Organizations of the Treadway Commission (COSO).
In our opinion, the consolidated financial statements referred to above present fairly, in all material respects, the financial position of the Company as of December 31, 2020 and 2019, and the results of its operations and its cash flows for each of the three years in the period ended December 31, 2020 in conformity with accounting principles generally accepted in the United States of America. Also in our opinion, the Company maintained, in all material respects, effective internal control over financial reporting as of December 31, 2020, based on criteria established in Internal Control - Integrated Framework (2013) issued by the COSO.
Change in Accounting Principle
As discussed in Note A to the consolidated financial statements, the Company changed the manner in which it accounts for revenue from contracts with customers in 2018.
Basis for Opinions
The Company's management is responsible for these consolidated financial statements, for maintaining effective internal control over financial reporting, and for its assessment of the effectiveness of internal control over financial reporting, included in Management's Report on Internal Control Over Financial Reporting appearing under Item 9A. Our responsibility is to express opinions on the Company’s consolidated financial statements and on the Company's internal control over financial reporting based on our audits. We are a public accounting firm registered with the Public Company Accounting Oversight Board (United States) (PCAOB) and are required to be independent with respect to the Company in accordance with the U.S. federal securities laws and the applicable rules and regulations of the Securities and Exchange Commission and the PCAOB.
We conducted our audits in accordance with the standards of the PCAOB. Those standards require that we plan and perform the audits to obtain reasonable assurance about whether the consolidated financial statements are free of material misstatement, whether due to error or fraud, and whether effective internal control over financial reporting was maintained in all material respects.
Our audits of the consolidated financial statements included performing procedures to assess the risks of material misstatement of the consolidated financial statements, whether due to error or fraud, and performing procedures that respond to those risks. Such procedures included examining, on a test basis, evidence regarding the amounts and disclosures in the consolidated financial statements. Our audits also included evaluating the accounting principles used and significant estimates made by management, as well as evaluating the overall presentation of the consolidated financial statements. Our audit of internal control over financial reporting included obtaining an understanding of internal control over financial reporting, assessing the risk that a material weakness exists, and testing and evaluating the design and operating effectiveness of internal control based on the assessed risk. Our audits also included performing such other procedures as we considered necessary in the circumstances. We believe that our audits provide a reasonable basis for our opinions.
Definition and Limitations of Internal Control over Financial Reporting
A company’s internal control over financial reporting is a process designed to provide reasonable assurance regarding the reliability of financial reporting and the preparation of financial statements for external purposes in accordance with generally accepted accounting principles. A company’s internal control over financial reporting includes those policies and procedures that (i) pertain to the maintenance of records that, in reasonable detail, accurately and fairly reflect the transactions and dispositions of the assets of the company; (ii) provide reasonable assurance that transactions are recorded as necessary to permit preparation of financial statements in accordance with generally accepted accounting principles, and that receipts and expenditures of the company are being made only in accordance with authorizations of management and directors of the
company; and (iii) provide reasonable assurance regarding prevention or timely detection of unauthorized acquisition, use, or disposition of the company’s assets that could have a material effect on the financial statements.
Because of its inherent limitations, internal control over financial reporting may not prevent or detect misstatements. Also, projections of any evaluation of effectiveness to future periods are subject to the risk that controls may become inadequate because of changes in conditions, or that the degree of compliance with the policies or procedures may deteriorate.
Critical Audit Matters
The critical audit matters communicated below are matters arising from the current period audit of the consolidated financial statements that were communicated or required to be communicated to the audit committee and that (i) relate to accounts or disclosures that are material to the consolidated financial statements and (ii) involved our especially challenging, subjective, or complex judgments. The communication of critical audit matters does not alter in any way our opinion on the consolidated financial statements, taken as a whole, and we are not, by communicating the critical audit matters below, providing separate opinions on the critical audit matters or on the accounts or disclosures to which they relate.
Valuation of Level 3 Commodity Derivative Assets and Liabilities
As described in Notes A and B to the consolidated financial statements, the Company’s level 3 commodity contracts derivative assets and liabilities total $103.8 million and $135.1 million, respectively, as of December 31, 2020. As disclosed by management, commodity price risk includes basis risk, which is the difference in price between various locations where commodities are purchased and sold. Management records all derivative instruments at fair value, with the exception of normal purchases and normal sales transactions that are expected to result in physical delivery. Many of the contracts in its derivative portfolio are executed in liquid markets where price transparency exists. Fair value measurements classified as Level 3 are composed predominantly of exchange-cleared and over-the-counter derivatives to hedge NGL price risk and natural gas basis risk. These measurements are based on inputs that may include one or more unobservable inputs, including internally developed commodity price curves, that incorporate market data from broker quotes and third-party pricing services. The commodity derivatives are generally valued using forward quotes provided by third-party pricing services that are validated with other market data.
The principal considerations for our determination that performing procedures relating to the valuation of level 3 commodity derivative assets and liabilities is a critical audit matter are (i) the significant judgment by management to determine the fair value of these derivatives; (
Showing the first 8K of 249K characters. Open the full section
Item 9. CHANGES IN AND DISAGREEMENTS WITH ACCOUNTANTS ON ACCOUNTING AND
FINANCIAL DISCLOSURE
None.
Item 9A. CONTROLS AND PROCEDURES
Evaluation of Disclosure Controls and Procedures
Our Chief Executive Officer (Principal Executive Officer) and Chief Financial Officer (Principal Financial Officer) have concluded that our disclosure controls and procedures were effective as of the end of the period covered by this report based on the evaluation of the controls and procedures required by Rules 13a-15(b) and 15d-15(b) of the Exchange Act.
Management’s Report on Internal Control Over Financial Reporting
Our management is responsible for establishing and maintaining adequate internal control over financial reporting, as such term is defined in Exchange Act Rule 13a-15(f). Under the supervision and with the participation of our management, including our Principal Executive Officer and Principal Financial Officer, we evaluated the effectiveness of our internal control over financial reporting based on the framework in Internal Control-Integrated Framework (2013) issued by the Committee of Sponsoring Organizations of the Treadway Commission. Because of inherent limitations, internal control over financial reporting may not prevent or detect misstatements. Also, projections of any evaluation of effectiveness to future periods are subject to the risk that controls may become inadequate because of changes in conditions, or that the degree of compliance with the policies or procedures may deteriorate. Based on our evaluation under that framework, our management concluded that our internal control over financial reporting was effective as of December 31, 2020.
The effectiveness of our internal control over financial reporting as of December 31, 2020, has been audited by PricewaterhouseCoopers LLP, an independent registered public accounting firm, as stated in their report which is included herein (Item 8).
Changes in Internal Control Over Financial Reporting
There have been no changes in our internal control over financial reporting during the quarter ended December 31, 2020, that have materially affected, or are reasonably likely to materially affect, our internal control over financial reporting.
Item 9B. OTHER INFORMATION
Not applicable.
PART III
Item 10. DIRECTORS, EXECUTIVE OFFICERS AND CORPORATE GOVERNANCE
Directors of the Registrant
Information concerning our directors is set forth in our 2021 definitive Proxy Statement and is incorporated herein by this reference.
Executive Officers of the Registrant
Information concerning our executive officers is included in Part I, Item 1, Business, of this Annual Report.
Compliance with Section 16(a) of the Exchange Act
Information on compliance with Section 16(a) of the Exchange Act is set forth in our 2021 definitive Proxy Statement and is incorporated herein by this reference.
Code of Ethics
Information concerning the code of ethics, or code of business conduct, is set forth in our 2021 definitive Proxy Statement and is incorporated herein by this reference.
Nominating Committee Procedures
Information concerning the Nominating Committee procedures is set forth in our 2021 definitive Proxy Statement and is incorporated herein by this reference.
Audit Committee
Information concerning the Audit Committee is set forth in our 2021 definitive Proxy Statement and is incorporated herein by this reference.
Audit Committee Financial Experts
Information concerning the Audit Committee Financial Experts is set forth in our 2021 definitive Proxy Statement and is incorporated herein by this reference.
Item 11. EXECUTIVE COMPENSATION
Information on executive compensation is set forth in our 2021 definitive Proxy Statement and is incorporated herein by this reference.
Item 12. SECURITY OWNERSHIP OF CERTAIN BENEFICIAL OWNERS AND MANAGEMENT AND RELATED STOCKHOLDER MATTERS
Security Ownership of Certain Beneficial Owners
Information concerning the ownership of certain beneficial owners is set forth in our 2021 definitive Proxy Statement and is incorporated herein by this reference.
Security Ownership of Management
Information on security ownership of directors and officers is set forth in our 2021 definitive Proxy Statement and is incorporated herein by this reference.
Equity Compensation Plan Information
The following table sets forth certain information concerning our equity compensation plans as of December 31, 2020:
| Number of Securities to be Issued Upon Exercise of Outstanding Options, Warrants and Rights | Weighted-Average Exercise Price of Outstanding Options, Warrants and Rights | Number of Securities Remaining Available For Future Issuance Under Equity Compensation Plans (Excluding Securities in Column (a)) | ||||||||||||||||||||||||||||||
| Plan Category | (a) | (b) (3) | (c) | |||||||||||||||||||||||||||||
| Equity compensation plans approved by security holders (1) | 2,854,622 | — | 7,937,940 | |||||||||||||||||||||||||||||
| Equity compensation plans not approved by security holders (2) | 295,620 | $ | 38.38 | — | ||||||||||||||||||||||||||||
| Total | 3,150,242 | $ | 38.38 | 7,937,940 |
(1) - Includes shares granted under our Employee Stock Purchase Plan, Employee Stock Award Program and restricted stock incentive unit awards and performance unit awards granted under our former Long-Term Incentive Plan, our former Equity Compensation Plan and our Equity Incentive Plan. For a brief description of the material features of these plans, see Note J of the Notes to Consolidated Financial Statements in this Annual Report. Column (c) includes 1,031,485, 130,204 and 6,776,251 shares available for future issuance under our Employee Stock Purchase Plan, Employee Stock Award Program and Equity Incentive Plan, respectively.
(2) - Includes our NQDC Plan, Deferred Compensation Plan for Non-Employee Directors and our former Stock Compensation Plan for Non-Employee Directors. For a brief description of the material features of these plans, see Notes K and J of the Notes to Consolidated Financial Statements in this Annual Report.
(3) - There is no exercise price associated with restrictive stock incentive unit awards and performance unit awards. Compensation deferred into our common stock under our Deferred Compensation Plan for Non-Employee Directors is distributed to participants at fair market value on the date of distribution. The price used for these plans to calculate the weighted-average exercise price in the table is $38.38, which represents the 2020 year-end closing price of our common stock on the NYSE.
Item 13. CERTAIN RELATIONSHIPS AND RELATED TRANSACTIONS, AND DIRECTOR INDEPENDENCE
Information on certain relationships and related transactions and director independence is set forth in our 2021 definitive Proxy Statement and is incorporated herein by this reference.
Item 14. PRINCIPAL ACCOUNTING FEES AND SERVICES
Information concerning the principal accountant’s fees and services is set forth in our 2021 definitive Proxy Statement and is incorporated herein by this reference.
PART IV
Item 15. EXHIBITS, FINANCIAL STATEMENT SCHEDULES
| (1) Financial Statements | Page No. | ||||||||||
| (a) | Report of Independent Registered Public Accounting Firm | 57-59 | |||||||||
| (b) | Consolidated Statements of Income for the years ended December 31, 2020, 2019 and 2018 | 60 | |||||||||
| (c) | Consolidated Statements of Comprehensive Income for the years ended December 31, 2020, 2019 and 2018 | 61 | |||||||||
| (d) | Consolidated Balance Sheets as of December 31, 2020 and 2019 | 62-63 | |||||||||
| (e) | Consolidated Statements of Cash Flows for the years ended December 31, 2020, 2019 and 2018 | 65 | |||||||||
| (f) | Consolidated Statements of Changes in Equity for the years ended December 31, 2020, 2019 and 2018 | 66-67 | |||||||||
| (g) | Notes to Consolidated Financial Statements | 68-106 | |||||||||
| (2) Financial Statements Schedules | |||||||||||
| All schedules have been omitted because of the absence of conditions under which they are required. |
| 101.CAL | Inline XBRL Taxonomy Calculation Linkbase Document. | |||||||
| 101.DEF | Inline XBRL Taxonomy Extension Definitions Document. | |||||||
| 101.LAB | Inline XBRL Taxonomy Label Linkbase Document. | |||||||
| 101.PRE | Inline XBRL Taxonomy Presentation Linkbase Document. | |||||||
| 104 | Cover Page Interactive Data File (formatted in Inline XBRL and contained in Exhibit 101). |
Attached as Exhibit 101 to this Annual Report are the following Inline XBRL-related documents: (i) Document and Entity Information; (ii) Consolidated Statements of Income for the years ended December 31, 2020, 2019 and 2018; (iii) Consolidated Statements of Comprehensive Income for the years ended December 31, 2020, 2019 and 2018; (iv) Consolidated Balance Sheets at December 31, 2020 and 2019; (v) Consolidated Statements of Cash Flows for the years ended December 31, 2020, 2019 and 2018; (vi) Consolidated Statements of Changes in Equity for the years ended December 31, 2020, 2019 and 2018; and (vii) Notes to Consolidated Financial Statements.
Item 16. FORM 10-K SUMMARY
None.
Signatures
Pursuant to the requirements of Section 13 or 15(d) of the Exchange Act, the registrant has duly caused this report to be signed on its behalf by the undersigned, thereunto duly authorized.
| ONEOK, Inc. | ||||||||
| Registrant | ||||||||
| Date: February 23, 2021 | By: | /s/ Walter S. Hulse III | ||||||
| Walter S. Hulse III | ||||||||
| Chief Financial Officer, Treasurer and | ||||||||
| Executive Vice President, Strategy | ||||||||
| and Corporate Affairs | ||||||||
| (Principal Financial Officer) |
Pursuant to the requirements of the Exchange Act, this report has been signed below by the following persons on behalf of the registrant and in the capacities indicated on this 23rd day of February 2021.
| /s/ John W. Gibson | /s/ Terry K. Spencer | ||||||||||
| John W. Gibson | Terry K. Spencer | ||||||||||
| Chairman of the Board | President, Chief Executive Officer and | ||||||||||
| Director | |||||||||||
| /s/ Walter S. Hulse III | /s/ Mary M. Spears | ||||||||||
| Walter S. Hulse III | Mary M. Spears | ||||||||||
| Chief Financial Officer, Treasurer and | Vice President and | ||||||||||
| Executive Vice President, Strategy | Chief Accounting Officer | ||||||||||
| and Corporate Affairs | |||||||||||
| /s/ Brian L. Derksen | /s/ Julie H. Edwards | ||||||||||
| Brian L. Derksen | Julie H. Edwards | ||||||||||
| Director | Director | ||||||||||
| /s/ Mark W. Helderman | /s/ Randall J. Larson | ||||||||||
| Mark W. Helderman | Randall J. Larson | ||||||||||
| Director | Director | ||||||||||
| /s/ Steven J. Malcolm | /s/ Jim W. Mogg | ||||||||||
| Steven J. Malcolm | Jim W. Mogg | ||||||||||
| Director | Director | ||||||||||
| /s/ Pattye L. Moore | /s/ Eduardo A. Rodriguez | ||||||||||
| Pattye L. Moore | Eduardo A. Rodriguez | ||||||||||
| Director | Director | ||||||||||
| /s/ Gerald B. Smith | |||||||||||
| Gerald B. Smith | |||||||||||
| Director | |||||||||||