 filings.tools
Item 5. Market for Registrant’s Common Equity, Related Stockholder Matters and Issuer Purchases of Equity Securities
4K characters. Original on sec.gov · Markdown
Item 5. Market for Registrant’s Common Equity, Related Stockholder Matters and Issuer Purchases of Equity Securities
Common stock:
Shares of the Company’s common stock are traded on The Nasdaq Global Select Market (“Nasdaq”) under the symbol “ORLY.” The Company’s common stock began trading on April 22, 1993; no cash dividends have been declared since that time, and the Company does not anticipate paying any cash dividends in the foreseeable future.
As of February 16, 2023, the Company had approximately 827,000 shareholders of common stock based on the number of holders of record and an estimate of individual participants represented by security position listings.
Sales of unregistered securities:
There were no sales of unregistered securities during the year ended December 31, 2022.
Issuer purchases of equity securities:
The following table identifies all repurchases during the fourth quarter ended December 31, 2022, of any of the Company’s securities registered under Section 12 of the Securities Exchange Act of 1934, as amended, by or on behalf of the Company or any affiliated purchaser (in thousands, except per share price data):
| | | | | | | | | | | |
|---|---|---|---|---|---|---|---|---|---|---|
| | | | | Total Number of | Maximum Dollar Value | |||||
| | | Total | | Average | | Shares Purchased as | | of Shares that May Yet | ||
| | | Number of | | Price Paid | | Part of Publicly | | Be Purchased Under the | ||
| Period | | Shares Purchased | | per Share | | Announced Programs | | Programs (1) | ||
| October 1, 2022, to October 31, 2022 | 236 | | $ | 730.16 | 236 | | $ | 471,502 | ||
| November 1, 2022, to November 30, 2022 | 58 | | 831.62 | 58 | | 1,923,010 | ||||
| December 1, 2022, to December 31, 2022 | 241 | | 830.22 | 241 | | $ | 1,723,320 | |||
| Total as of December 31, 2022 | 535 | | $ | 786.19 | 535 | |
| (1) | The authorizations under the share repurchase program that currently have capacity are scheduled to expire on May 16, 2025 and November 11, 2025. No other share repurchase programs existed during the twelve months ended December 31, 2022. See Note 9 “Share Repurchase Program” to the Consolidated Financial Statements for further information on our share repurchases. |
|---|
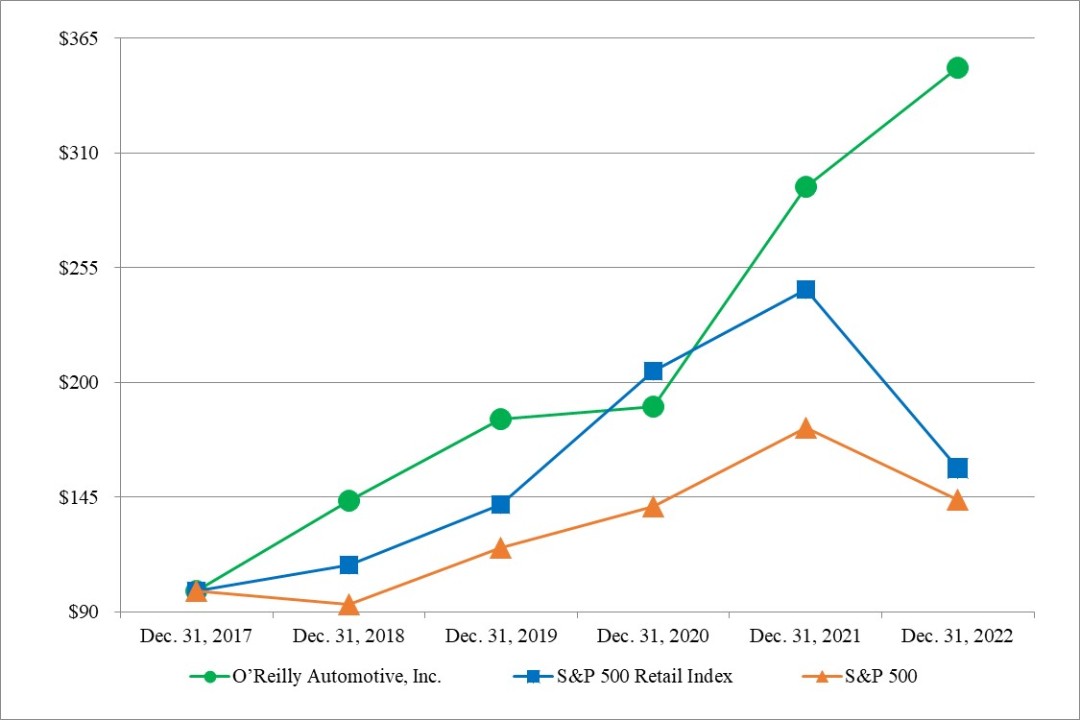
Stock performance graph:
The graph below shows the cumulative total shareholder return assuming the investment of $100, on December 31, 2017, and the reinvestment of dividends thereafter, if any, in the Company’s common stock versus the Standard and Poor’s S&P 500 Retail Index (“S&P 500 Retail Index”) and the Standard and Poor’s S&P 500 Index (“S&P 500”).
| | | | | | | | | | | | | | | | | | | |
|---|---|---|---|---|---|---|---|---|---|---|---|---|---|---|---|---|---|---|
| | | December 31, | ||||||||||||||||
| Company/Index | 2017 | 2018 | 2019 | 2020 | 2021 | 2022 | ||||||||||||
| O’Reilly Automotive, Inc. | | $ | 100 | | $ | 143 | | $ | 182 | | $ | 188 | | $ | 294 | | $ | 351 |
| S&P 500 Retail Index | | 100 | | 113 | | 141 | | 206 | | 245 | | 159 | ||||||
| S&P 500 | | $ | 100 | | $ | 94 | | $ | 121 | | $ | 140 | | $ | 178 | | $ | 144 |
Previous: Item 4. Mine Safety Disclosures · Next: Item 6. [Reserved]