 filings.tools
Item 5. MARKET FOR REGISTRANT'S COMMON EQUITY, RELATED STOCKHOLDER MATTERS AND ISSUER PURCHASES OF EQUITY SECURITIES
9K characters. Original on sec.gov · Markdown
Item 5. MARKET FOR REGISTRANT'S COMMON EQUITY, RELATED STOCKHOLDER MATTERS AND ISSUER PURCHASES OF EQUITY SECURITIES
TRADING PRICE RANGE AND DIVIDENDS
This section incorporates by reference the quarterly financial data appearing under the caption "Quarterly Financial Data (Unaudited)" after the Notes to the Consolidated Financial Statements, and the information appearing under the caption "Liquidity and Capital Resources" in the MD&A section of this report. Occidental’s common stock was held by approximately 24,500 stockholders of record at January 31, 2018, and by approximately 700,000 additional stockholders whose shares were held for them in street name or nominee accounts. The common stock is listed and traded on the New York Stock Exchange. The quarterly financial data set forth the range of trading prices for the common stock as reported on the composite tape of the New York Stock Exchange and quarterly dividend information.
Dividends declared on the common stock were $0.76 for the first and second quarter of 2017 and $0.77 for the third and fourth quarter ($3.06 for the year). On February 8, 2018, a quarterly dividend of $0.77 per share was declared on the common stock, payable on April 16, 2018, to stockholders of record on March 9, 2018. The current annual dividend rate of $3.08 per share has increased by over 500 percent since 2002. The declaration of future dividends is a business decision made by the Board of Directors from time to time, and will depend on Occidental’s financial condition and other factors deemed relevant by the Board.
SECURITIES AUTHORIZED FOR ISSUANCE UNDER EQUITY COMPENSATION PLANS
All of Occidental's stock-based compensation plans for its employees and non-employee directors have been approved by the stockholders. The aggregate number of shares of Occidental common stock authorized for issuance under such plans is approximately 35 million, of which approximately 6.1 million had been reserved for issuance through December 31, 2017. The following is a summary of the securities available for issuance under such plans:
| a) | Number of securities to be issued upon exercise of outstanding options, warrants and rights | b) | Weighted-average exercise price of outstanding options, warrants and rights | c) | Number of securities remaining available for future issuance under equity compensation plans (excluding securities in column (a)) | ||
| 7,339,506 (1) | 79.98 (2) | 18,836,578 (3) |
| (1) | Includes shares reserved to be issued pursuant to restricted stock units, stock options (Options), and performance-based awards. Shares for performance-based awards are included assuming maximum payout, but may be paid out at lesser amounts, or not at all, according to achievement of performance goals. |
| (2) | Price applies only to the Options included in column (a). Exercise price is not applicable to the other awards included in column (a). |
| (3) | A plan provision requires each share covered by an award (other than stock appreciation rights (SARs) and Options) to be counted as if three shares were issued in determining the number of shares that are available for future awards. Accordingly, the number of shares available for future awards may be less than the amount shown depending on the type of award granted. Additionally, under the plan, the amount shown may increase, depending on the award type, by the number of shares currently unvested or forfeitable, or three times that number as applicable, that (i) fail to vest, (ii) are forfeited or canceled, or (iii) correspond to the portion of any stock-based awards settled in cash. |
SHARE REPURCHASE ACTIVITIES
Occidental’s share repurchase activities for the year ended December 31, 2017, were as follows:
| Period | Total Number of Shares Purchased | Average Price Paid per Share | Total Number of Shares Purchased as Part of Publicly Announced Plans or Programs | Maximum Number of Shares that May Yet Be Purchased Under the Plans or Programs | |||||||||||||||||
| First Quarter 2017 | — | $ | — | — | |||||||||||||||||
| Second Quarter 2017 | 96,828 | (a) | $ | 60.77 | — | ||||||||||||||||
| Third Quarter 2017 | 96,933 | (a) | $ | 60.62 | — | ||||||||||||||||
| October 1 - 31, 2017 | — | $ | — | — | |||||||||||||||||
| November 1 - 30, 2017 | 98,015 | (a) | $ | 69.90 | — | ||||||||||||||||
| December 1 - 31, 2017 | 95,113 | (a) | $ | 72.58 | — | ||||||||||||||||
| Fourth Quarter 2017 | 193,128 | (a) | $ | 71.22 | — | ||||||||||||||||
| Total 2017 | 386,889 | (a) | $ | 65.95 | — | 63,756,544 | (b) |
| (a) | Represents purchases from the trustee of Occidental's defined contribution savings plan that are not part of publicly announced plans or programs. |
| (b) | Represents the total number of shares remaining at year end under Occidental's share repurchase program of 185 million shares. The program was initially announced in 2005. The program does not obligate Occidental to acquire any specific number of shares and may be discontinued at any time. |
PERFORMANCE GRAPH
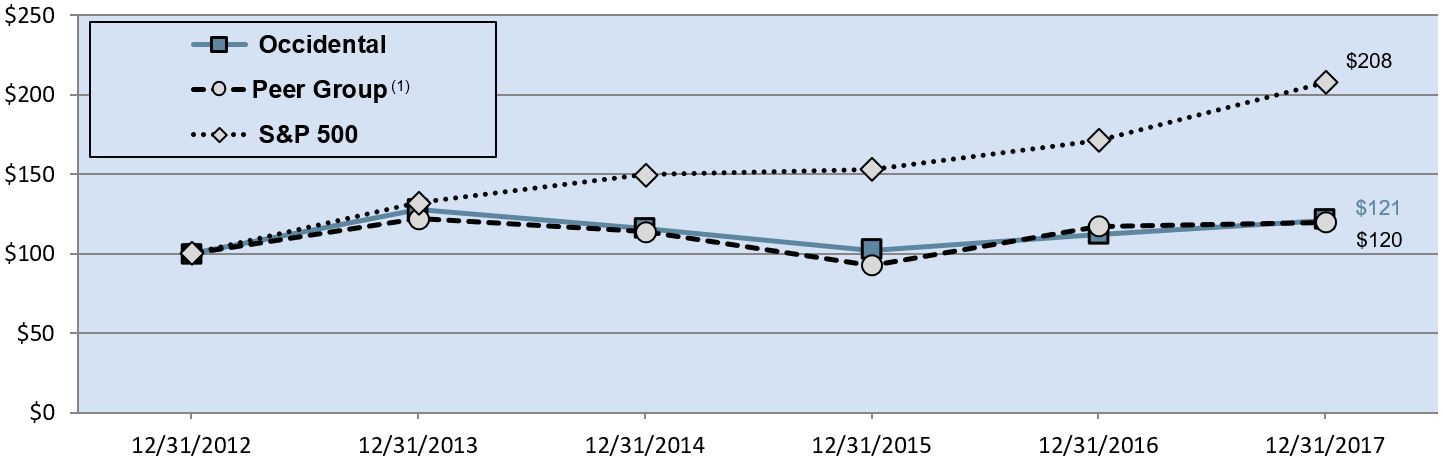
The following graph compares the yearly percentage change in Occidental’s cumulative total return on its common stock with the cumulative total return of the Standard & Poor's 500 Stock Index (S&P 500), which Occidental is included in, and with that of Occidental’s peer group over the five-year period ended on December 31, 2017. The graph assumes that $100 was invested at the beginning of the five-year period shown in the graph below in: (i) Occidental common stock, (ii) the stock of the companies in the S&P 500, and (iii) each of the peer group companies' common stock weighted by their relative market values within the peer group, and that all dividends were reinvested.
Occidental's peer group consists of Anadarko Petroleum Corporation, Apache Corporation, Canadian Natural Resources Limited, Chevron Corporation, ConocoPhillips, Devon Energy Corporation, EOG Resources Inc., ExxonMobil Corporation, Hess Corporation, Marathon Oil Corporation, Total S.A. and Occidental.
| 12/31/2012 | 12/31/2013 | 12/31/2014 | 12/31/2015 | 12/31/2016 | 12/31/2017 | |||||||||||||
 | $ | 100 | $ | 128 | $ | 116 | $ | 102 | $ | 112 | $ | 121 | ||||||
 | 100 | 122 | 114 | 93 | 117 | 120 | ||||||||||||
 | 100 | 132 | 150 | 153 | 171 | 208 |
The information provided in this Performance Graph shall not be deemed "soliciting material" or "filed" with the SEC or subject to Regulation 14A or 14C under the Exchange Act, other than as provided in Item 201 to Regulation S-K under the Exchange Act, or subject to the liabilities of Section 18 of the Exchange Act and shall not be deemed incorporated by reference into any filing under the Securities Act of 1933 or the Exchange Act except to the extent Occidental specifically requests that it be treated as soliciting material or specifically incorporates it by reference.
| (1) | The cumulative total return of the peer group companies' common stock includes the cumulative total return of Occidental's common stock. |
Previous: Item 4. MINE SAFETY DISCLOSURES · Next: Item 6. SELECTED FINANCIAL DATA