 filings.tools
Item 7. MANAGEMENT'S DISCUSSION AND ANALYSIS OF FINANCIAL CONDITION AND RESULTS OF OPERATIONS (MD&A)
137K characters. Original on sec.gov · Markdown
Item 7. MANAGEMENT'S DISCUSSION AND ANALYSIS OF FINANCIAL CONDITION AND RESULTS OF OPERATIONS (MD&A)
In this report, "Occidental" means Occidental Petroleum Corporation (OPC), or OPC and one or more entities in which it owns a controlling interest (subsidiaries). Occidental's principal businesses consist of three segments. The oil and gas segment explores for, develops and produces oil and condensate, natural gas liquids (NGLs) and natural gas. The chemical segment (OxyChem) mainly manufactures and markets basic chemicals and vinyls. The midstream and marketing segment gathers, processes, transports, stores, purchases and markets oil, condensate, NGLs, natural gas, carbon dioxide (CO2) and power. It also trades around its assets, including transportation and storage capacity. Additionally, the midstream and marketing segment operates a crude oil export terminal, as well as invests in entities that conduct similar activities.
Occidental's oil and gas assets are located in some of the world’s highest-margin basins and are characterized by an advantaged mix of short- and long-cycle, high-return development opportunities. In the United States, Occidental continues to hold a leading position in the Permian Basin. Other core operations are in the Middle East (Oman, Qatar and UAE) and Latin America (Colombia). Occidental's midstream and marketing business provides access to domestic and international markets through pipeline infrastructure and Occidental's Ingleside Crude Terminal with an emphasis on operational excellence. OxyChem is a world-class chemical business that generates high financial returns.
STRATEGY
General
Occidental is focused on delivering a unique shareholder value proposition through continual enhancements to its asset quality, organizational capability and innovative technical applications that provide competitive advantages. The attributes of Occidental's strategy include its mix of short- and long-cycle investment opportunities, low base production declines, strong financial position and focus on generating shareholder returns through its value-based development approach. Occidental aims to maximize shareholder returns through a combination of:
| Ø | Consistent dividend growth; |
| Ø | Value growth through oil and gas development that meets above cost-of-capital returns and return targets of greater than 15 percent and 20 percent for domestic and international projects, respectively; |
| Ø | Targeted production growth rates of 5 to 8 percent average per year over the long-term; and |
| Ø | Maintenance of a strong balance sheet to secure business and enhance shareholder value. |
Occidental conducts its operations with a focus on its social responsibility commitments and initiatives, including health and safety, and environmental stewardship. Capital is employed to operate all assets in a safe and environmentally sound manner. Occidental accepts
commodity, engineering and limited exploration risks. Occidental seeks to limit its financial and political risks.
Price volatility is inherent in the oil and gas business and Occidental’s strategy is to position the business to thrive in an up- or down-cycle commodity price environment. Recent strategic initiatives have resulted in Occidental exiting its non-core areas, including South Texas in 2017, and strengthening its position in areas where Occidental has a competitive advantage and an advantaged asset portfolio. In 2017, Occidental continued to build upon its business, including a growing dividend and production growth at low oil prices. During the year, Occidental's board of directors and management implemented a short-term strategic plan that is intended to maintain production and sustain the dividend at a West Texas Intermediate (WTI) oil price of $40 per barrel. At $50 WTI, Occidental’s plan anticipates that the business will generate additional capital to cover production growth of 5 to 8 percent, and fulfill Occidental's dividend growth goal. This plan has continued into 2018 and, longer term, Occidental will continue to build upon this low-cost, high-margin value proposition through development and operation of its focused and advantaged assets.
The following describes the application of Occidental’s overall strategy for each of its operating segments:
Oil and Gas
Occidental’s oil and gas segment focuses on long-term value creation and leadership in health, safety and the environment. In each core operating area, Occidental's operations benefit from scale, technical expertise, environmental and safety leadership, and commercial and governmental collaboration. These attributes allow Occidental to bring additional production quickly to market, extend the life of older fields at lower costs, and provide low-cost growth opportunities with advanced technology.
As a result of Occidental's strategic positioning, Occidental's assets provide current production and a future portfolio of projects that are flexible, have short-cycle investment paybacks, deliver a low base decline and provide decades of diverse and unique opportunities to support energy demand across many future scenarios. Together with Occidental's technical capabilities, the oil and gas segment is able to achieve low development and operating costs to obtain full-cycle value while promoting innovative ideas that differentiate Occidental's approach and provide future opportunities.
The oil and gas business implements Occidental's strategy primarily by:
| Ø | Operating and developing areas where reserves are known to exist and to increase production from core areas, primarily in the Permian Basin, Colombia, Oman, Qatar and UAE; |
| Ø | Focusing on cost-reduction efficiencies, improvement in new well productivity and better base management to reduce total spend per barrel; |
| Ø | Using enhanced oil recovery techniques, such as CO2, water and steam floods, in mature fields; |
| Ø | Focusing many of Occidental's subsurface characterization and technical activities on unconventional opportunities, primarily in the Permian Basin. This focus is in support of a sizable capital program within these developments and |
| Ø | Maintaining a disciplined and prudent approach to capital expenditures with focus on returns and maintain discipline and an emphasis on creating value and further enhancing Occidental's existing positions. |
In 2017, oil and gas capital expenditures were approximately $3.0 billion, and were mainly comprised of expenditures in the Permian Basin and the Middle East. This activity reflects Occidental's strategy to focus on achieving returns well above the cost of capital even in a low price environment.
Management believes Occidental's oil and gas segment growth will occur primarily through exploitation and development opportunities in the Permian Basin and Colombia and focused international projects in the Middle East.
Chemical
The primary objective of OxyChem is to generate cash flow in excess of its normal capital expenditure requirements and achieve above-cost-of-capital returns. The chemical segment's strategy is to be a low-cost producer in order to maximize its cash flow generation. OxyChem concentrates on the chlorovinyls chain beginning with chlorine, which is co-produced with caustic soda, and markets both to external customers. In addition, chlorine, together with ethylene, is converted through a series of intermediate products into polyvinyl chloride (PVC). OxyChem's focus on chlorovinyls allows it to maximize the benefits of integration and take advantage of economies of scale. Capital is employed to sustain production capacity in a safe and environmentally sound manner, as well as to focus on projects and developments designed to improve the competitiveness of segment assets. Acquisitions and plant development opportunities may be pursued when they are expected to enhance the existing core chlor-alkali and PVC businesses or take advantage of other specific opportunities. In the first quarter of 2017, OxyChem, through a 50/50 joint venture with Mexichem S.A.B. de C.V., began commercial operations on a 1.2 billion pound-per-year ethylene cracker at the OxyChem Ingleside facility. The joint venture provides an opportunity to capitalize on the advantage that U.S. shale gas development has presented to U.S. chemical producers by providing low-cost ethane as a raw material. The joint venture will provide OxyChem with an ongoing source of ethylene, significantly reducing OxyChem's reliance on third-party ethylene suppliers. In 2017, capital expenditures for OxyChem totaled $308 million. An additional $39 million was contributed to the Mexichem joint venture. OxyChem completed construction on the previously announced expansion of its manufacturing plant in Geismar, Louisiana, on budget and on time. In December 2017, the new facility began producing 4CPe, a new raw
material used in making next-generation, climate-friendly refrigerants with a low global-warming and zero ozone-depletion potential.
Midstream and Marketing
The midstream and marketing segment strives to maximize realized value by optimizing the use of its transportation, storage and terminal assets and by providing access to domestic and international market alternatives. To generate returns, the segment evaluates opportunities across the value chain and uses its assets to provide services to Occidental subsidiaries as well as third parties. The midstream and marketing segment invests in and operates pipeline and gathering systems, gas plants, co-generation facilities, storage facilities and terminal assets. This segment also seeks to minimize the costs of gas, power and other commodities used in Occidental's various businesses. Capital is employed to sustain or expand facilities in the gathering, transportation, storage and terminal assets to improve the competitiveness of Occidental's businesses. In 2017, capital expenditures totaled $284 million related to Permian Basin gas processing and gathering infrastructure, Al Hosn Gas, the Ingleside Crude Terminal, and expansion of the oil pipeline system in New Mexico by an additional 50 miles.
Key Performance Indicators
Occidental seeks to meet its strategic goals by continually measuring its success in its key performance metrics that drive total stockholder return. In addition to production growth and capital allocation and deployment discussed above, Occidental believes the following are its most significant metrics:
| Ø | Health, environmental and safety performance measures; |
| Ø | Total Shareholder Return, including funding the dividend; |
| Ø | Return on capital employed (ROCE) and cash return on capital employed (CROCE); and |
| Ø | Specific measures such as per-unit profit, production cost, cash flow, finding-and-development costs and reserves replacement percentages. |
OIL AND GAS SEGMENT
Business Environment
Oil and gas prices are the major variables that drive the industry’s financial performance. The following table presents the average daily West Texas Intermediate (WTI), Brent and New York Mercantile Exchange (NYMEX) prices for 2017 and 2016:
| 2017 | 2016 | |||||||
| WTI oil ($/barrel) | $ | 50.95 | $ | 43.32 | ||||
| Brent oil ($/barrel) | $ | 54.82 | $ | 45.04 | ||||
| NYMEX gas ($/Mcf) | $ | 3.09 | $ | 2.42 |
The following table presents Occidental's average realized prices as a percentage of WTI, Brent and NYMEX for 2017 and 2016:
| 2017 | 2016 | |||||
| Worldwide oil as a percentage of average WTI | 96 | % | 89 | % | ||
| Worldwide oil as a percentage of average Brent | 89 | % | 86 | % | ||
| Worldwide NGLs as a percentage of average WTI | 42 | % | 34 | % | ||
| Worldwide NGLs as a percentage of average Brent | 39 | % | 33 | % | ||
| Domestic natural gas as a percentage of NYMEX | 75 | % | 79 | % |
Average WTI and Brent oil price indexes increased 18 percent and 22 percent, from $43.32 and $45.04 in 2016 to $50.95 and $54.82 in 2017, respectively. Average worldwide realized oil prices rose $10.20, or 26 percent, in 2017 compared to 2016. WTI and Brent oil price indexes increased in the fourth quarter of 2017, closing at $60.42 per barrel and $66.87 per barrel, respectively, well above 2017 average prices. The average realized domestic natural gas price in 2017 increased 22 percent from 2016. Average NYMEX natural gas prices increased 28 percent, from $2.42 in 2016 to $3.09 in 2017.
Prices and differentials can vary significantly, even on a short-term basis, making it difficult to predict realized prices with a reliable degree of certainty.
Operations
2017 Developments
In the third quarter of 2017, Occidental closed on two divestitures of non-core acreage in the Permian Basin for proceeds of approximately $0.6 billion, resulting in a pre-tax gain of approximately $81 million. Concurrently, Occidental purchased additional ownership interests and assumed operatorship in CO2 enhanced oil recovery (EOR) properties located in the Seminole-San Andres Unit for approximately $0.6 billion, which was primarily allocated to proved property. In the fourth quarter of 2017, Occidental sold other non-core proved and unproved acreage in the Permian Basin for approximately $90 million, resulting in a pre-tax gain of approximately $55 million. Occidental also classified approximately $0.5 billion in non-core proved and unproved Permian acreage to assets held for sale at December 31, 2017.
In April 2017, Occidental completed the sale of its South Texas operations for net proceeds of $0.5 billion resulting in pre-tax gain of $0.5 billion.
Business Review
Domestic Interests
Occidental conducts its domestic operations through land leases, subsurface mineral rights it owns, or a combination of both surface land and subsurface mineral rights it owns. Occidental's domestic oil and gas leases have a primary term ranging from one to ten years, which is extended through the end of production once it commences. Of the total 3.4 million net acres in which Occidental has interests, approximately 83 percent is leased, 16 percent is owned subsurface mineral rights and 1 percent is owned land with mineral rights.
The following charts show Occidental’s domestic total production volumes for the last five years:
Domestic Production Volumes
(thousands BOE/day) 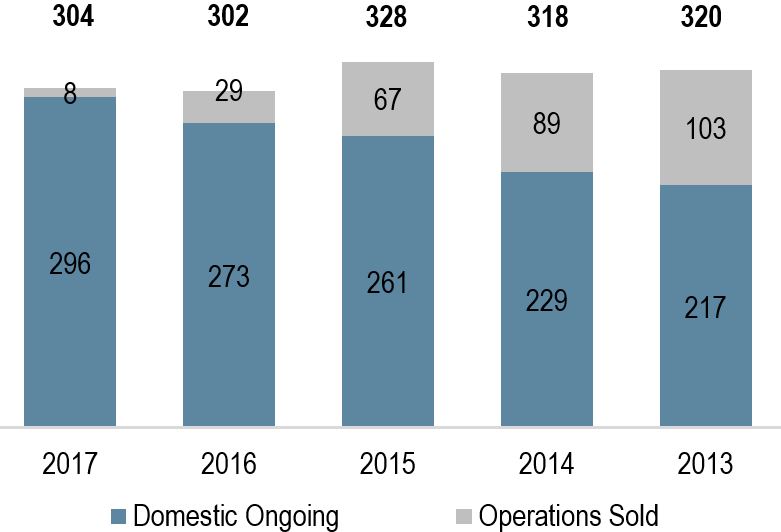
Notes:
| • | Excludes volumes from California Resources, which was separated on November 30, 2014, and included as discontinued operations for all applicable periods. |
| • | Operations sold include South Texas (sold in April 2017), Piceance (sold in March 2016), Williston (sold in November 2015) and Hugoton (sold in April 2014) |
United States Assets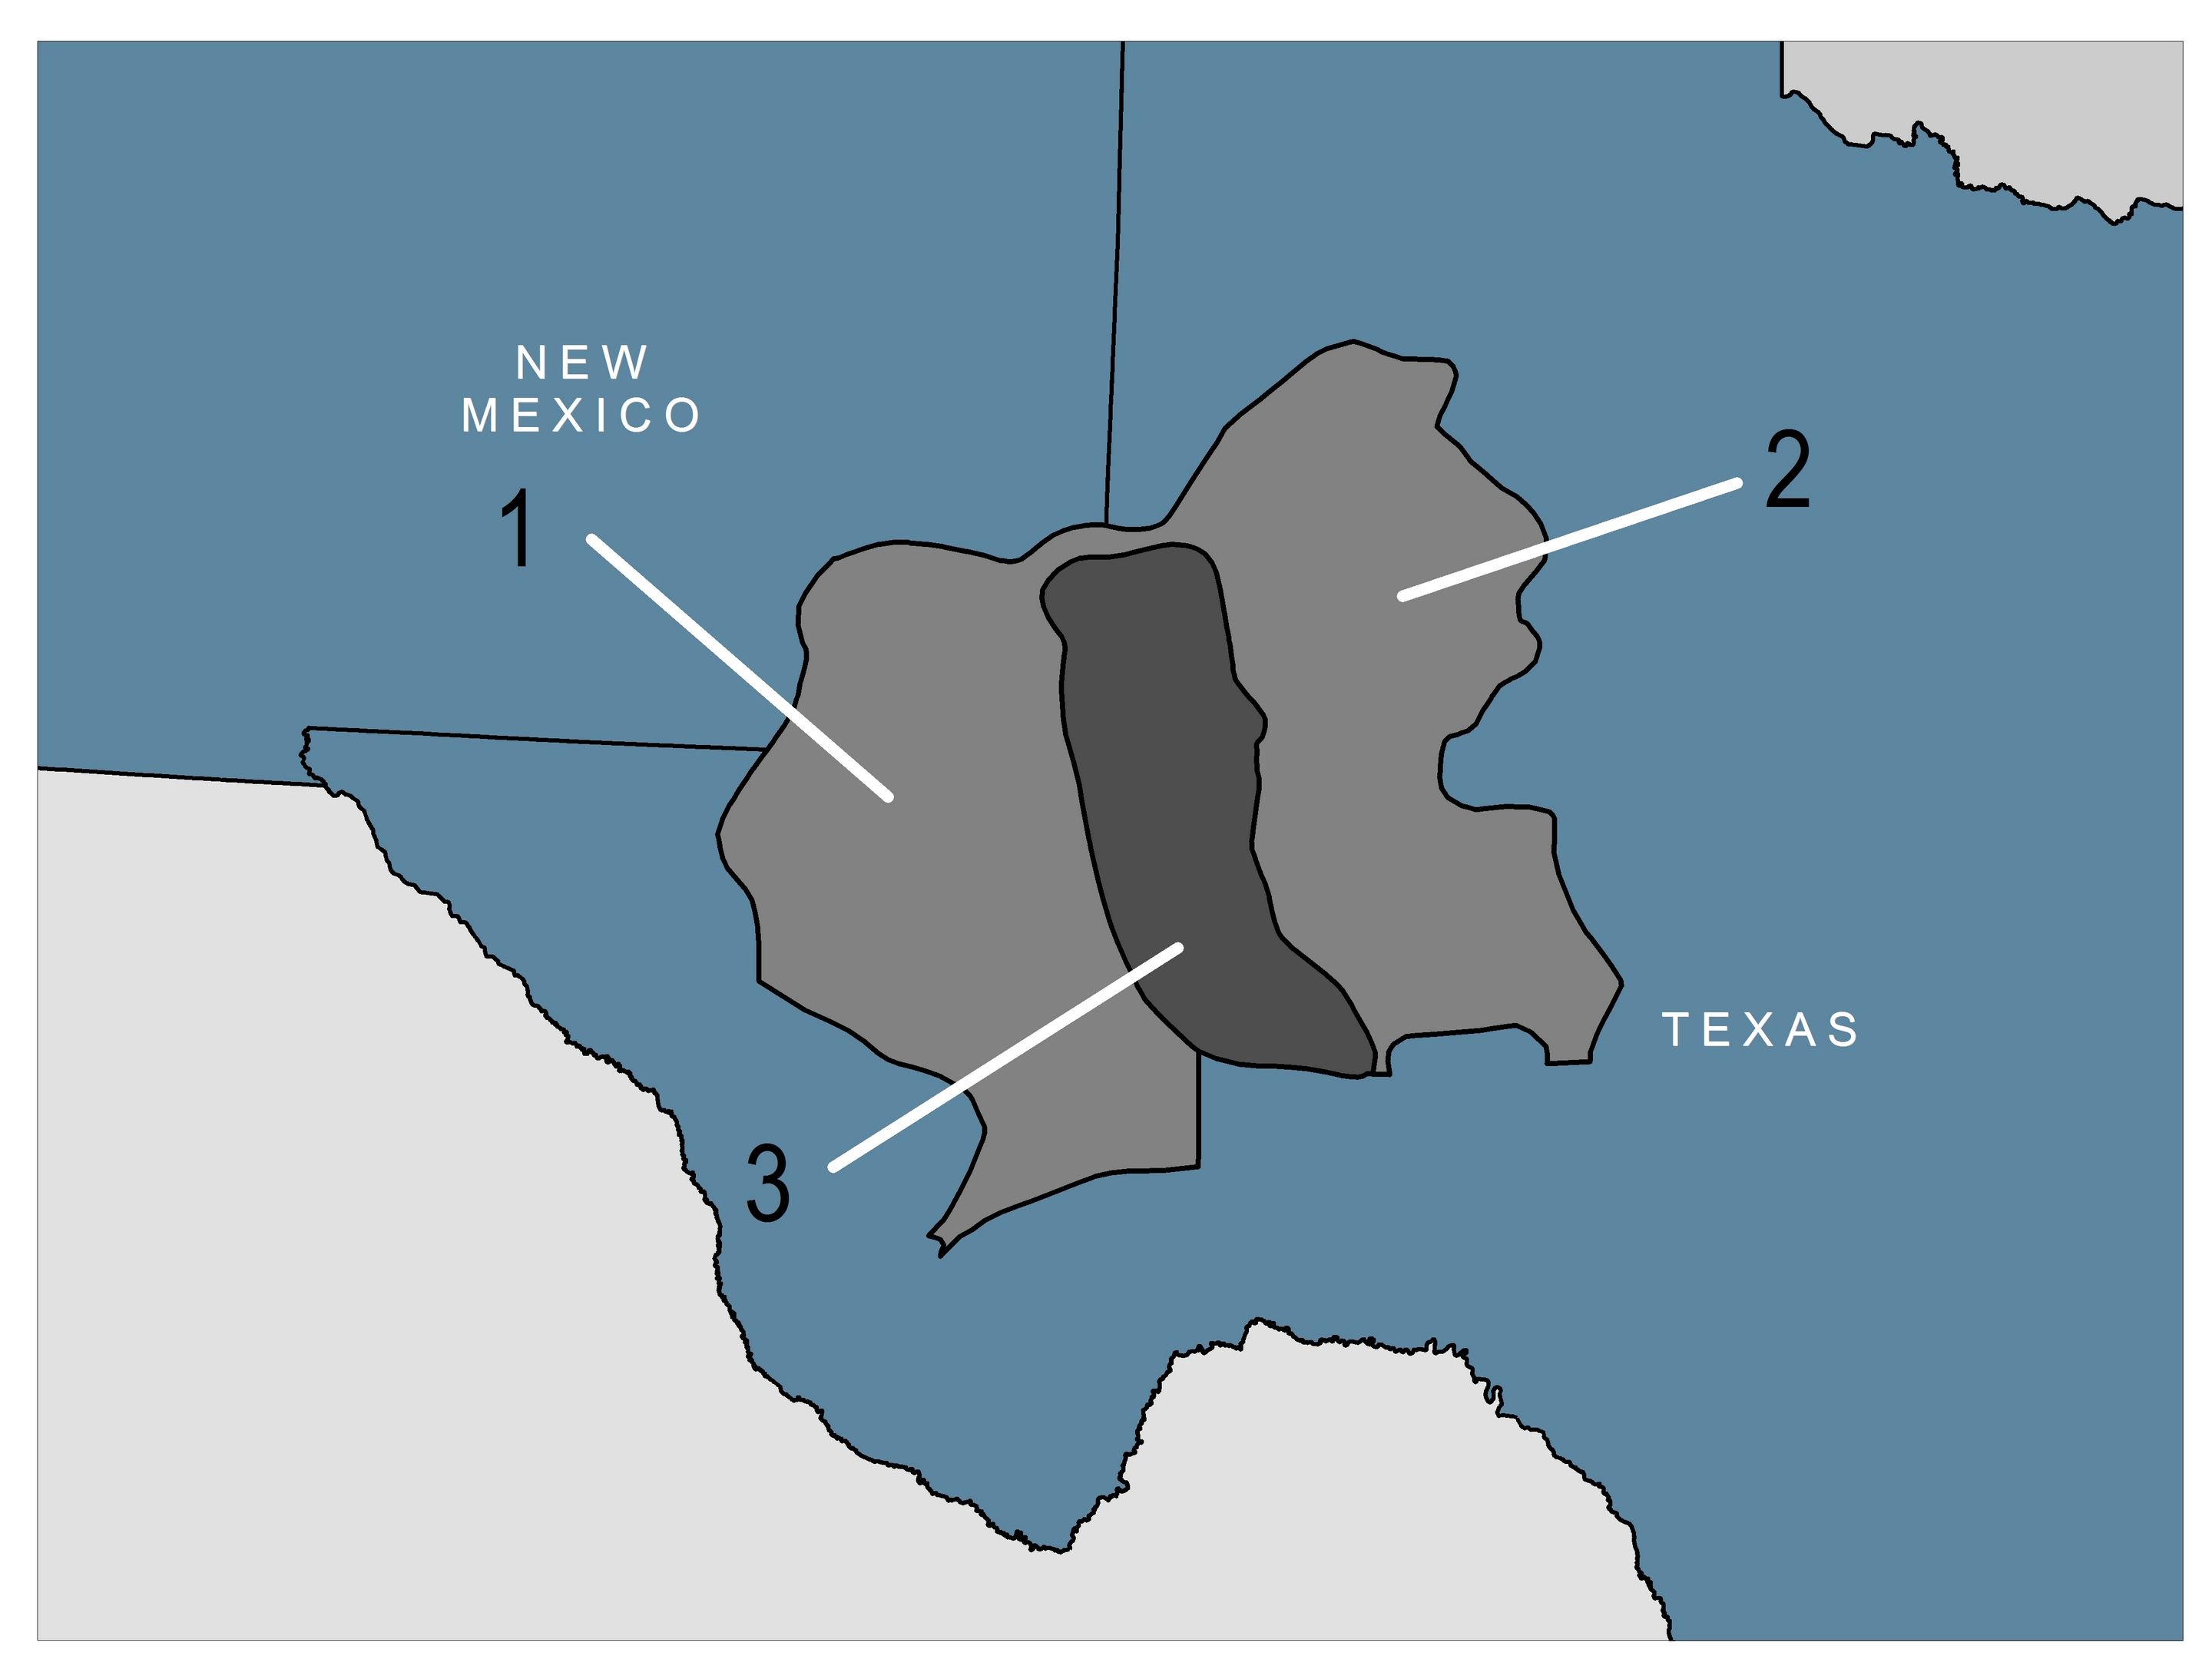
United States
| 1. | Delaware Basin |
| 2. | Midland Basin |
| 3. | Central Basin Platform |
Permian Basin
The Permian Basin extends throughout West Texas and southeast New Mexico and is one of the largest and most active oil basins in the United States, accounting for more than 20% of the total United States oil production.
Occidental manages its Permian Basin operations through two business units: Permian Resources, which includes growth-oriented unconventional opportunities, and Permian EOR, which utilizes enhanced oil recovery techniques such as CO2 floods and waterfloods. Occidental has a leading position in the Permian Basin, producing
approximately 9 percent of the total oil in the basin. By exploiting the natural synergies between Permian Resources and Permian EOR, Occidental is able to deliver unique short- and long-term advantages, efficiencies and expertise across its Permian Basin operations. Occidental can decrease its Permian Basin full-cycle breakeven costs, while continuing to add high-quality, low-cost breakeven inventory of future drilling locations faster than it is developed. The combined technical advancements, infrastructure utilization opportunities and operations across over 2.5 million net acres will provide sustainability of Occidental's low cost position in the Permian Basin.
In the next few years, growth within Occidental’s Permian Basin portfolio will be focused in the Permian Resources unconventional assets. In 2017, Occidental spent approximately $2.1 billion of capital in the Permian Basin, of which over 75 percent was spent on Permian Resources assets. In 2018, Occidental expects to allocate approximately half of its worldwide 2018 capital budget to Permian Resources for development and approximately 15 percent to Permian EOR for the expansion of existing facilities to increase CO2 production and injection capacity.
Permian Resources
Permian Resources' unconventional oil development projects provide very short-cycle investment payback, averaging less than two years, that replaces the lower return production from assets divested during the 2013-2017 portfolio optimization, while also providing some of the highest margin and returns of any oil and gas projects in the world. These investments provide better cash-flow and production growth, while increasing long-term value and sustainability through higher return on capital employed.
Occidental's Permian Resources inventory includes over 11,200 horizontal drilling locations in the Midland and Delaware sub-basins. As of December 31, 2017, approximately 750 of these drilling locations represented proved undeveloped reserves. In 2017, Permian Resources produced approximately 141,000 net BOE per day from approximately 5,050 net wells, of which 18 percent are operated by other companies. In 2017, Permian Resources drilled 138 horizontal wells and added 127 million BOE from improved recovery to Occidental's proved reserves.
Permian EOR
The Permian Basin’s concentration of large conventional reservoirs, favorable CO2 flooding performance and the proximity to naturally occurring CO2 supply has resulted in decades of steady growth in enhanced oil production. With 34 active floods and over 40 years of experience, Occidental is the industry leader in Permian Basin CO2 flooding, which can increase ultimate oil recovery by 10 to 25 percent. Technology improvements, such as the recent trend toward vertical expansion of the CO2 flooded interval into residual oil zone targets, continue to yield more recovery from existing projects. Occidental utilizes workover rigs to drill extra depth into additional CO2 floodable sections of the reservoir, and completed 91 well workovers in 2017 and has plans to complete 100 well workovers in 2018. In 2017, Permian EOR added 21 million
BOE to Occidental’s proved reserves for improved recovery additions, primarily as a result of executing CO2 flood development projects and expansions. Occidental's share of production from Permian EOR was approximately 150,000 BOE per day in 2017.
Significant opportunities also remain to gain additional recovery by expanding Occidental's existing CO2 projects into new portions of reservoirs that have only been water-flooded. Permian EOR has a large inventory of future CO2 projects which could be developed over the next 20 years or accelerated, depending on market conditions.
Other Domestic
Occidental holds approximately 908,000 net acres in other domestic locations. Occidental's share of production in other domestic locations was approximately 5,000 BOE per day.
International Interests
Production-Sharing Contracts
Occidental's interests in Oman and Qatar are subject to production sharing contracts (PSC). Under such contracts, Occidental records a share of production and reserves to recover certain development and production costs and an additional share for profit. In addition, certain contracts in Colombia are subject to contractual arrangements similar to a PSC. These contracts do not transfer any right of ownership to Occidental and reserves reported from these arrangements are based on Occidental’s economic interest as defined in the contracts. Occidental’s share of production and reserves from these contracts decreases when product prices rise and increases when prices decline. Overall, Occidental’s net economic benefit from these contracts is greater when product prices are higher.
The following charts show Occidental’s international production volumes for the last five years:
International Production Volumes
(thousands BOE/day)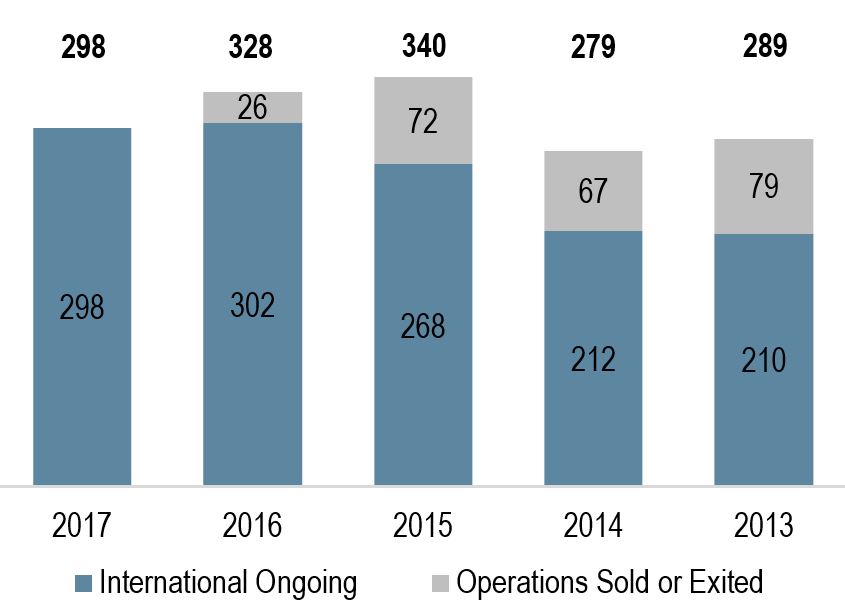
Notes:
| • | Operations sold or exited include Bahrain, Iraq, Libya and Yemen. |
Middle East Assets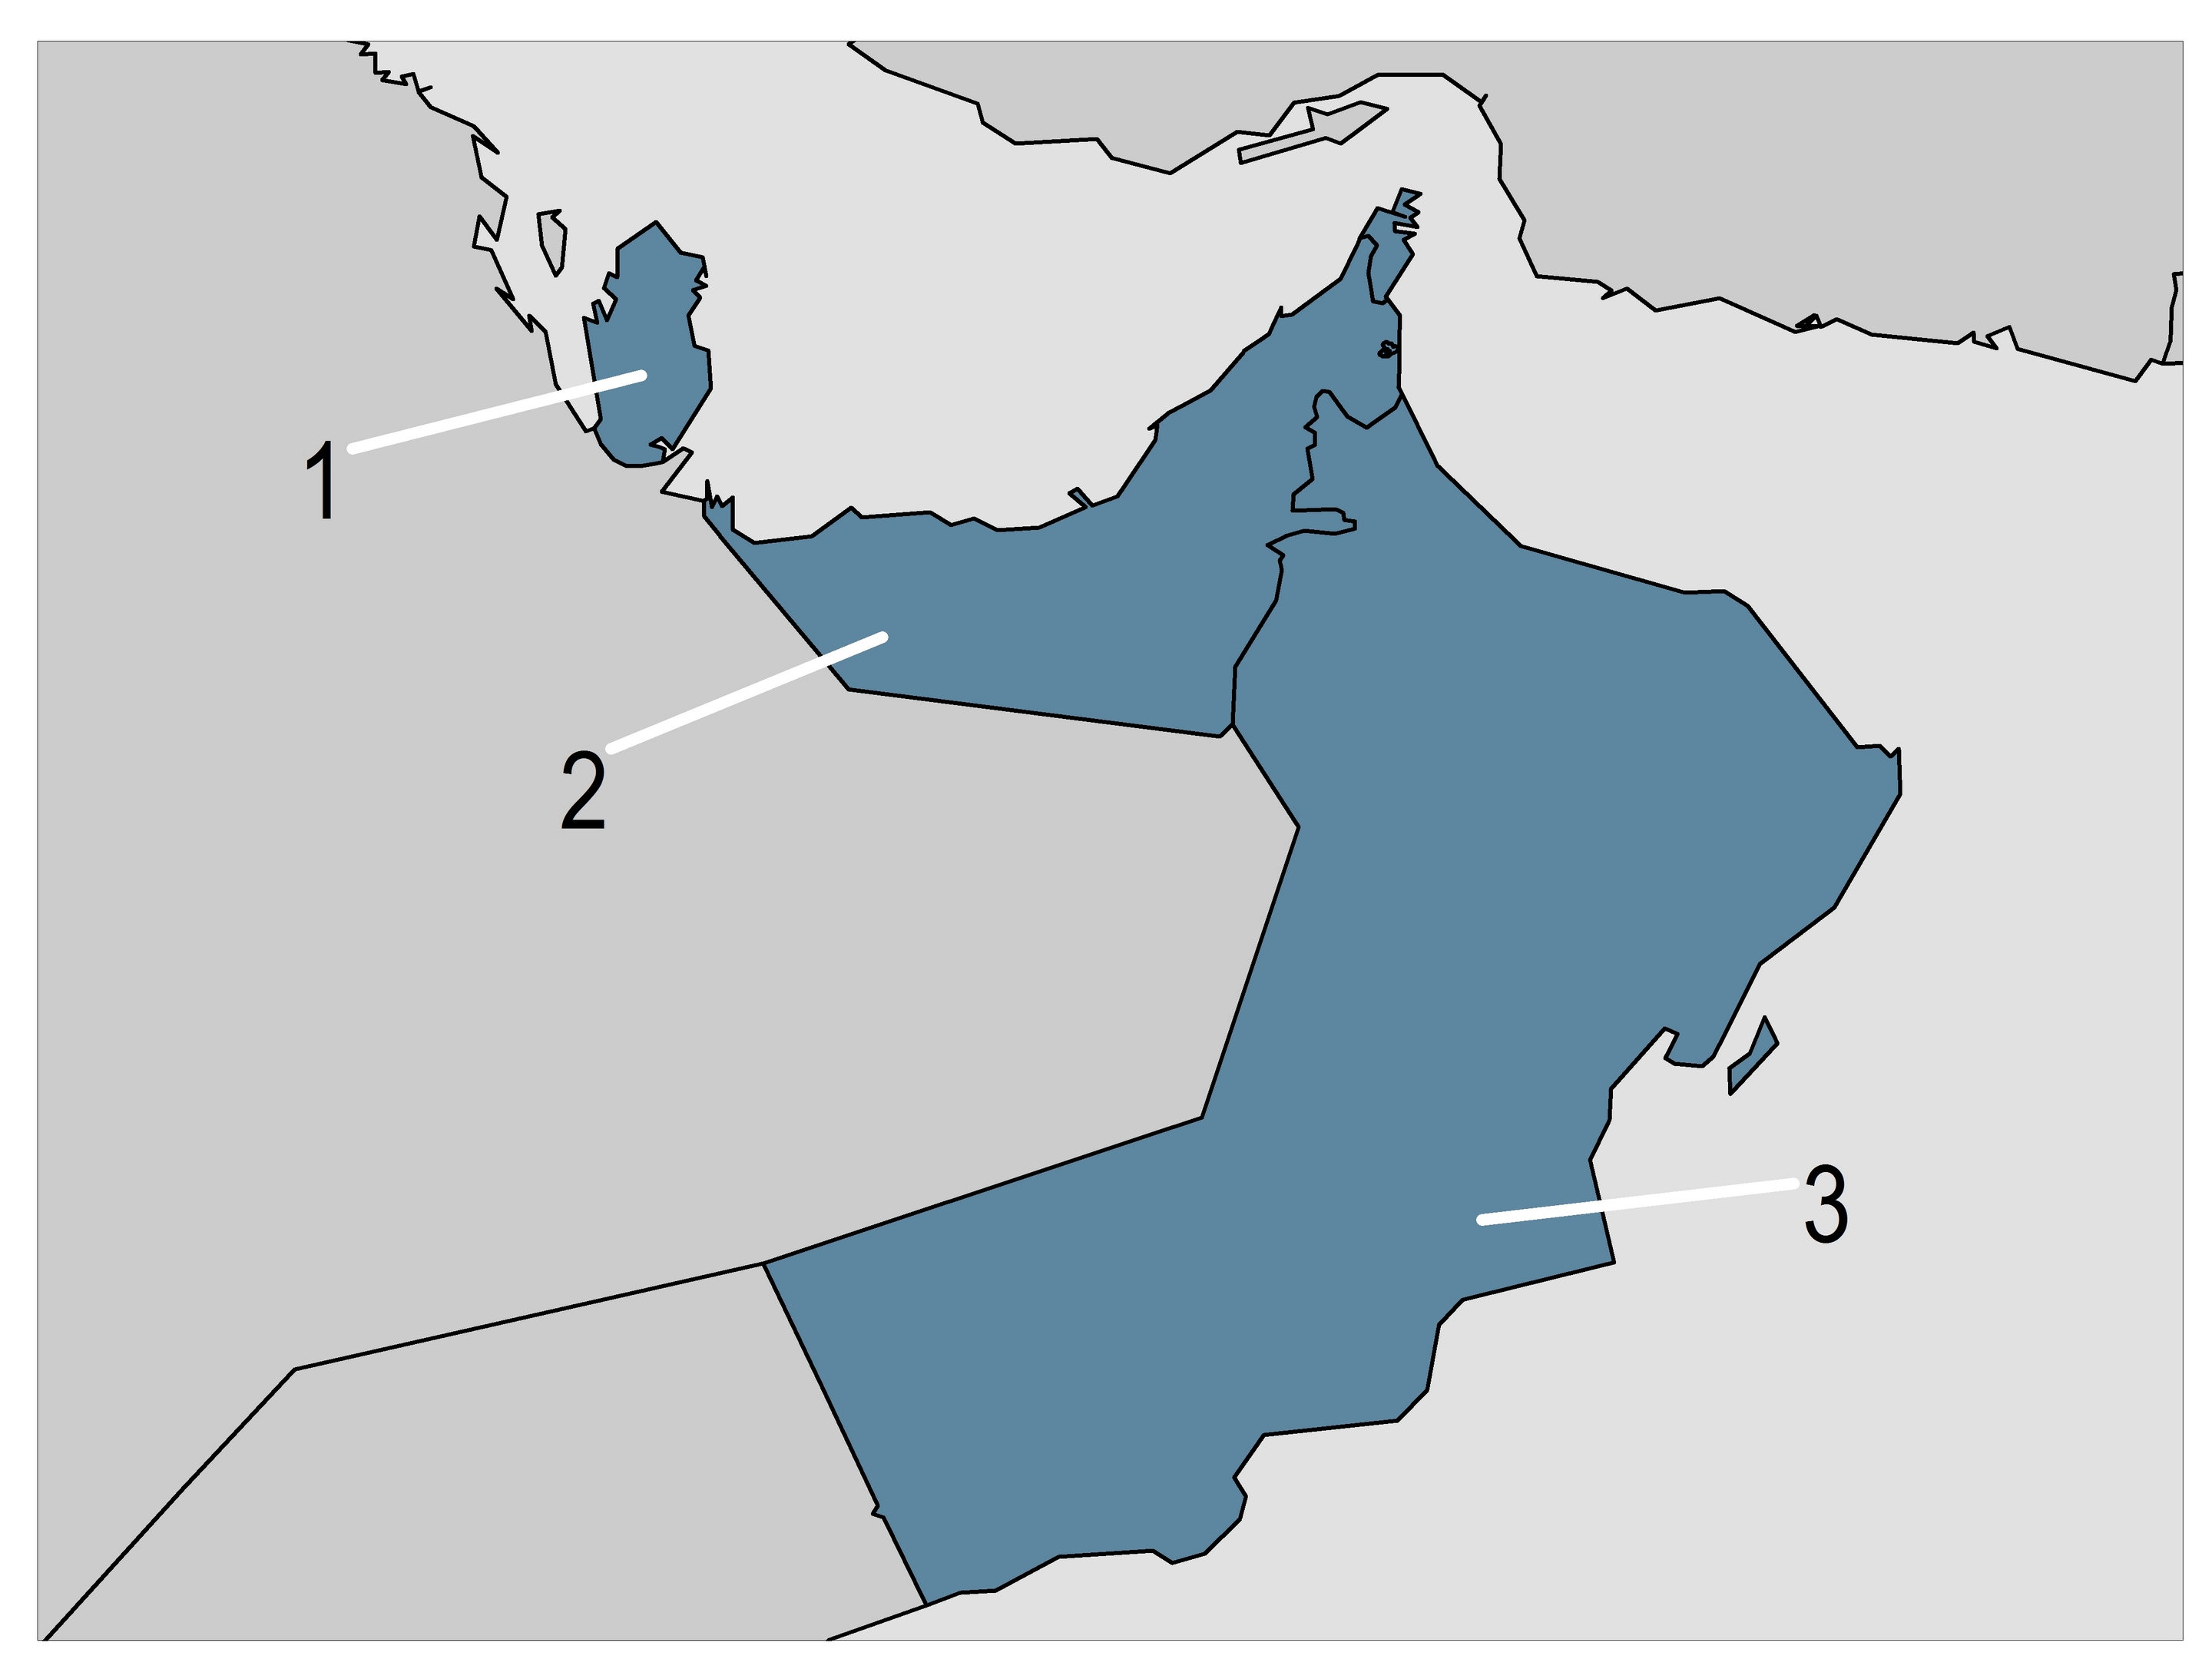
| 1. | Qatar |
| 2. | United Arab Emirates |
| 3. | Oman |
Oman
In Oman, Occidental is the operator of Block 9 with a 50-percent working interest, Block 27 with a 65-percent working interest, Block 53 with a 45-percent working interest; and Block 62, with an 80-percent working interest. Also, in November 2017, Occidental was awarded a three-year exploration contract in Block 30.
In December 2015, the existing PSC for Block 9 expired and Occidental agreed to operate Block 9 under modified operating terms until a new contract was approved. The Block 9 Exploration and Production Sharing Agreement 15-year extension was signed in January 2017 and was ratified in March 2017 through Royal Decree. In 2017, the average gross production from Block 9 was 91,000 BOE per day.
The term for Block 27 expires in 2035 and the average gross production was 16,000 BOE per day in 2017.
A 30-year PSC for Block 53 (Mukhaizna Field) was signed with the Government of Oman in 2005, pursuant to which Occidental assumed operation of the field. By the end of 2017, Occidental had drilled more than 3,000 new wells and continued implementation of a major steamflood project. In 2017, the average gross daily production was 123,000 BOE per day.
In 2008, Occidental was awarded a 20-year contract for Block 62, subject to declaration of commerciality, where it is pursuing development and exploration opportunities targeting natural gas and condensate resources. In 2014, Occidental signed a five-year extension for the initial phase for the discovered non-associated gas area (natural gas not in contact with crude oil in a reservoir) for Block 62. In 2017, the average gross daily production was 22,000 BOE per day.
Occidental's Oman operations reached a significant milestone in November 2017 with the production of its one billionth gross barrel of oil, including condensate, from all its blocks. Over two-thirds of this production has come in the last ten years, illustrating the tremendous growth achieved over that period. In 2017, Occidental's share of production in Oman averaged 95,000 BOE per day.
Qatar
In Qatar, Occidental is the operator of the offshore fields Idd El Shargi North Dome (ISND) and Idd El Shargi South Dome (ISSD), with a 100-percent working interest in each. The terms for ISND and ISSD expire in October 2019 and December 2022, respectively. Occidental's net share of production from ISND and ISSD was 53,000 BOE and 4,000 BOE per day respectively, in 2017.
Occidental operated Al-Rayyan (Block 12) until the term expired on May 31, 2017, when Block 12 was successfully transitioned back to the Government of Qatar. Production from Block 12 in 2017 was not significant.
Occidental has continued to successfully implement large scale water flooding projects combined with state-of-the-art horizontal drilling, advanced completion techniques as well as utilizing extensive automated artificial lift systems that are significantly extending the life of the fields. Since the commencement of its operations in 1994, Occidental has boosted the production from the Idd El Shargi fields by over 400 percent with current gross oil rates of around 91,000 BOE per day.
Utilizing Occidental’s expertise in artificial lift, together with other game-changing technologies and innovations, the ISSD field continues to outperform expectations and exited 2017 with record gross production rates of over 9,000 BOE per day. Despite complex marine operations, Occidental is recognized as a regional leader in its safety performance as well as being the lowest-cost offshore oil operator in the State of Qatar.
Occidental also partners in the Dolphin Energy project, an investment that is comprised of two separate economic interests. Occidental has a 24.5-percent interest in the upstream operations to develop and produce natural gas, NGLs and condensate from Qatar’s North Field through mid-2032. Occidental also has a 24.5-percent interest in Dolphin Energy Limited which operates a pipeline and is discussed further in "Midstream and Marketing Segment – Pipeline Transportation. Occidental's net share of production from the Dolphin upstream operations was 42,000 BOE per day in 2017.
Occidental's share of production from Qatar was approximately 100,000 BOE per day in 2017.
United Arab Emirates
In 2011, Occidental acquired a 40-percent participating interest in Al Hosn Gas, joining with the Abu Dhabi National Oil Company (ADNOC) in a 30-year joint venture agreement. In 2017, Al Hosn Gas gross production exceeded expectations, producing over 525 MMcf per day of natural gas and 90,000 barrels per day of NGLs and condensate. Occidental’s share of production from Al Hosn Gas was 211 MMcf per day of natural gas and 36,000 barrels per day of NGLs and condensate in 2017. Al Hosn Gas includes gas processing facilities which are discussed further in "Midstream and Marketing Segment - Gas Processing Plants and CO2 Fields and Facilities".
Occidental conducts a majority of its Middle East business development activities through its office in Abu Dhabi, which also provides various support functions for Occidental’s Middle East oil and gas operations.
Latin America Assets 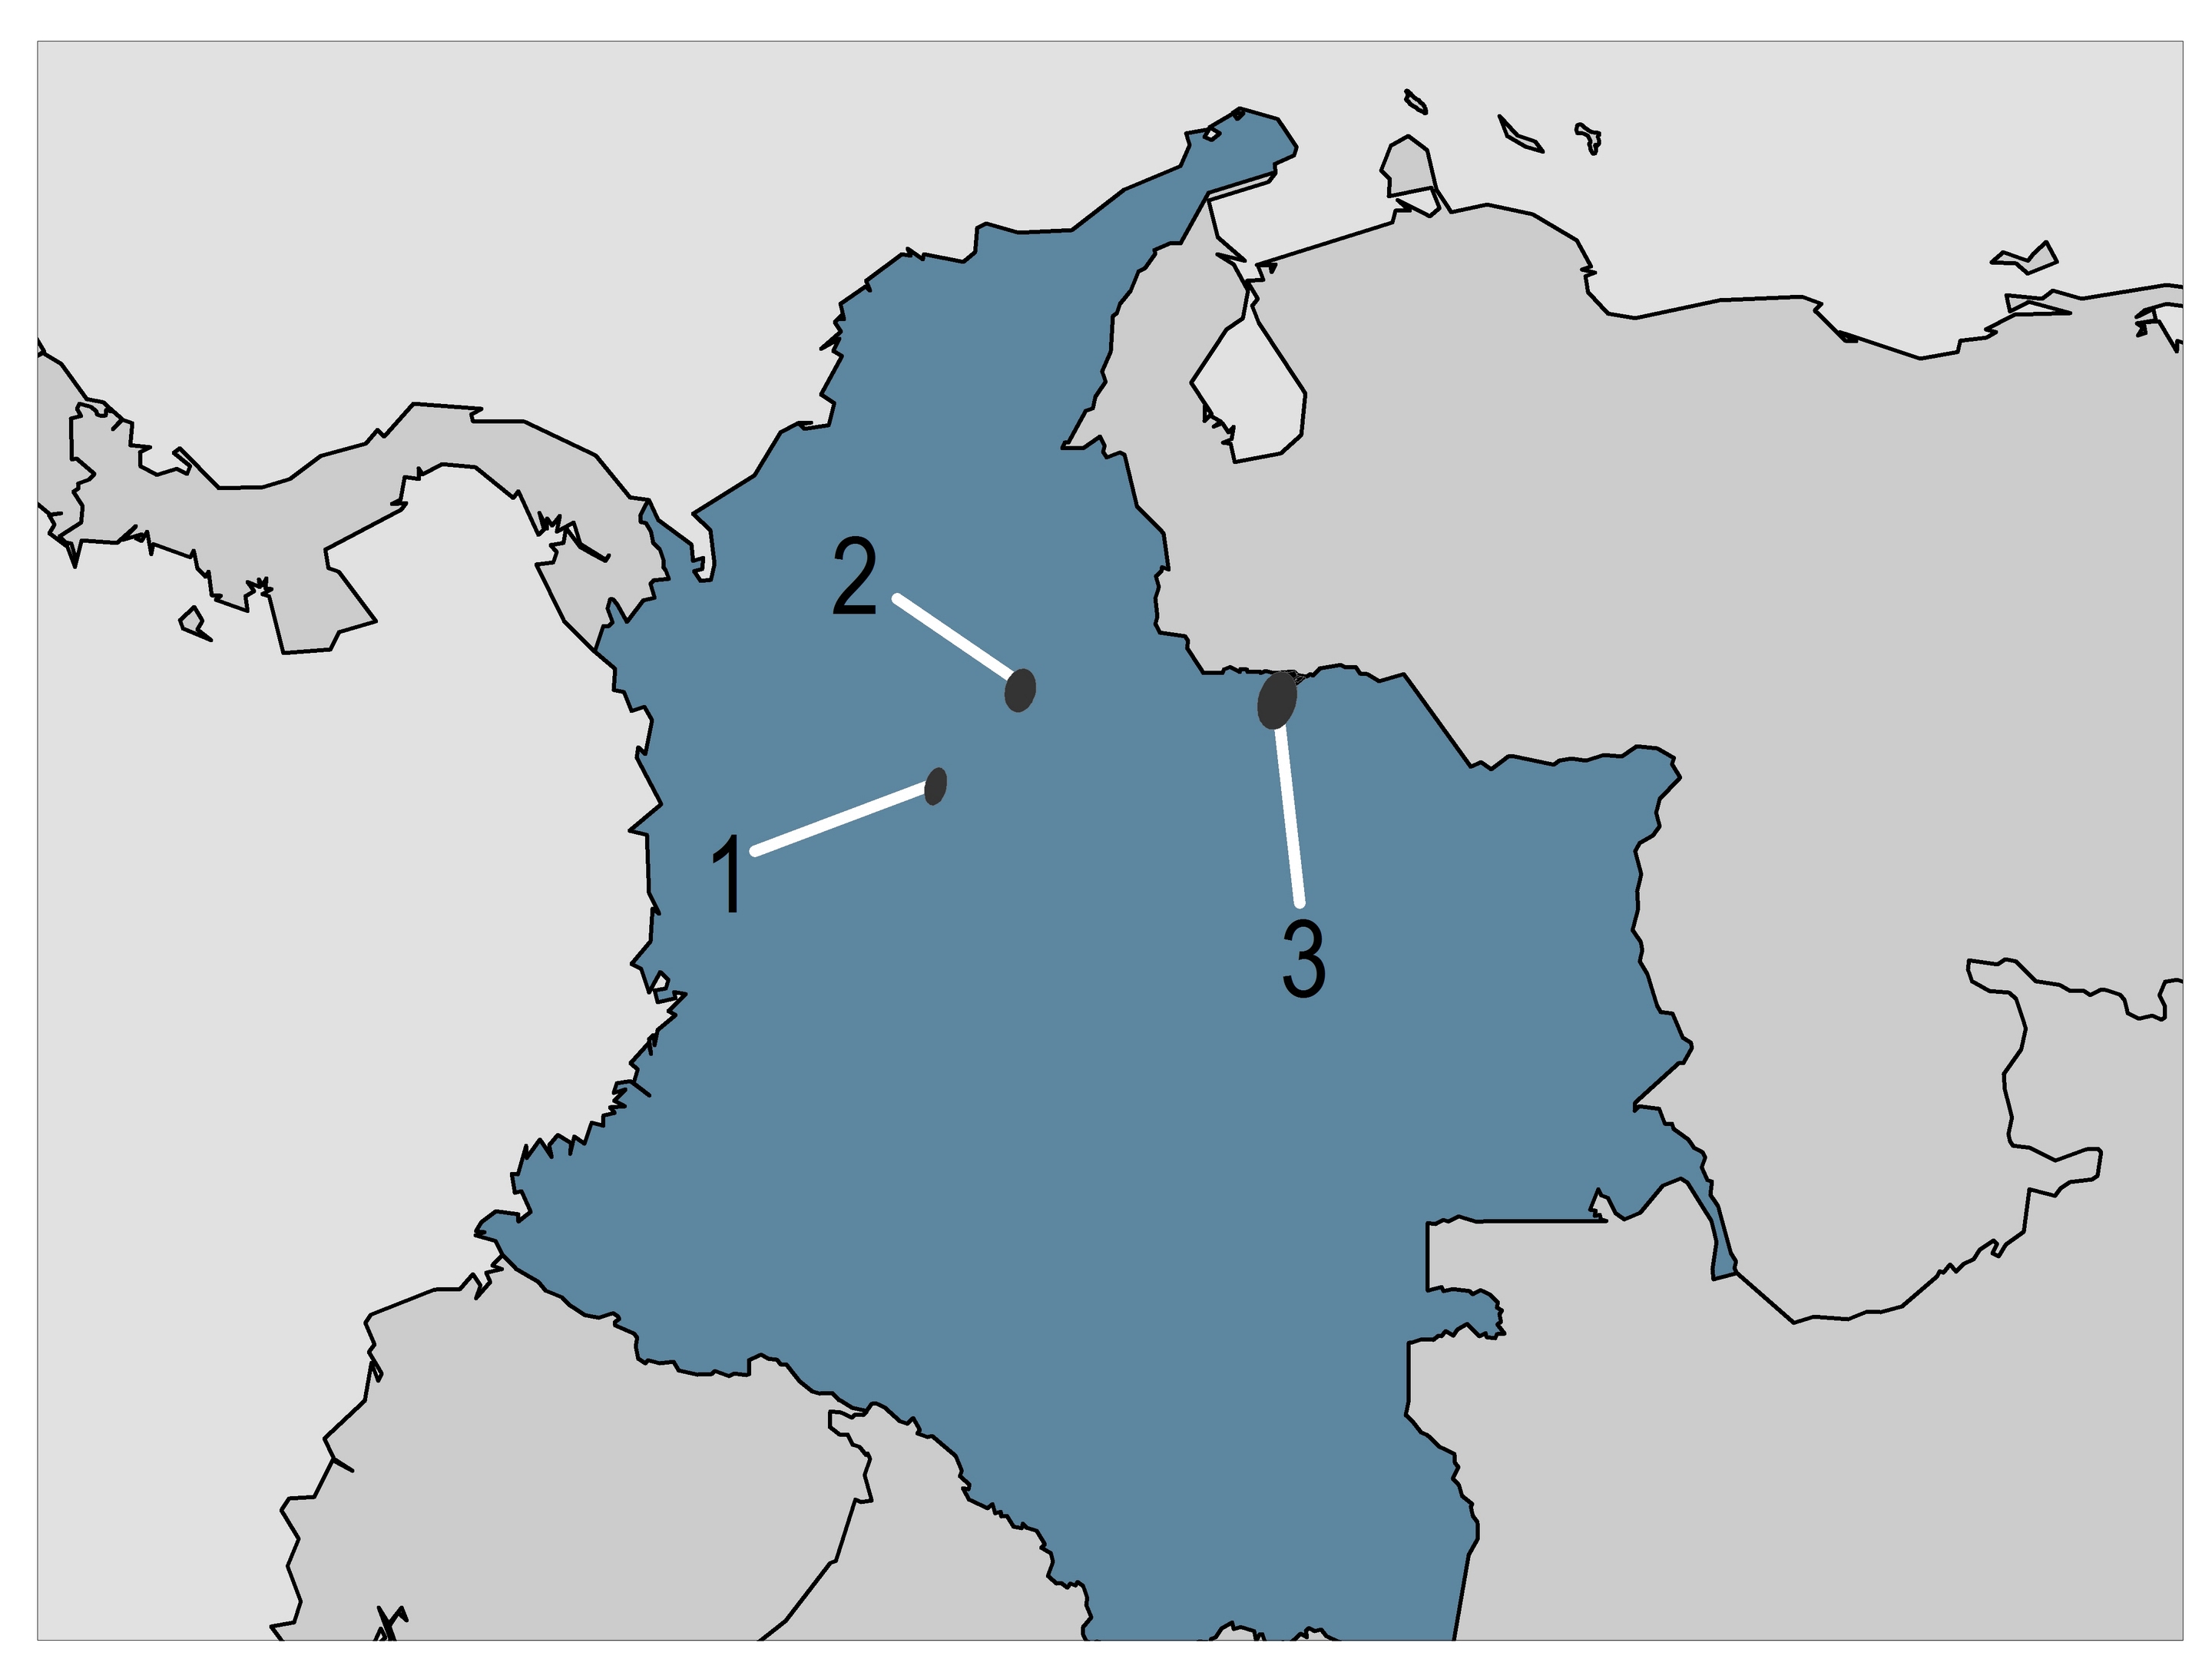
| 1. | Teca Heavy Oil Area |
| 2. | La Cira-Infantas Waterflood Area |
| 3. | Northern Llanos Basin |
Colombia
Occidental has working interests in the La Cira-Infantas and Teca areas and has operations within the Llanos Norte Basin. Occidental's interests range from 39 to 61 percent and certain interests expire between 2023 and 2038, while others extend through the economic limit of the areas. In 2017, Occidental continued a thermal recovery pilot at the Teca heavy oil field and the initial results are better than anticipated. Production began from these pilots in 2016. Occidental's share of production from Colombia was approximately 31,000 BOE per day in 2017.
Proved Reserves
Proved oil, NGLs and gas reserves were estimated using the unweighted arithmetic average of the first-day-of-the-month price for each month within the year, unless prices were defined by contractual arrangements. Oil, NGLs and natural gas prices used for this purpose were based on posted benchmark prices and adjusted for price differentials including gravity, quality and transportation costs. For the 2017, 2016 and 2015 disclosures, the calculated average West Texas Intermediate oil prices were $51.34, $42.75 and $50.28 per barrel, respectively. The calculated average Brent oil prices for 2017, 2016 and 2015 disclosures were $54.93, $44.49 and $55.57, per barrel, respectively. The calculated average Henry Hub gas prices for 2017, 2016 and 2015 were $3.08, $2.55 and $2.66 per MMBtu, respectively.
Occidental had proved reserves at year-end 2017 of 2,598 million BOE, compared to the year-end 2016 amount of 2,406 million BOE. Proved reserves at year-end 2017 and 2016 consisted of, respectively, 58 percent and 56 percent oil, 17 percent and 17 percent NGLs and 25 percent and 27 percent natural gas. Proved developed reserves represented approximately 74 percent and 77 percent, respectively, of Occidental’s total proved reserves at year-end 2017 and 2016.
Occidental does not have any reserves from non-traditional sources. For further information regarding Occidental's proved reserves, see "Supplemental Oil and Gas Information" following the "Financial Statements."
Changes in Proved Reserves
Occidental's total proved reserves increased 192 million BOE in 2017, which included additions of 206 million BOE from Occidental's development program.
Changes in reserves were as follows:
| (in millions of BOE) | 2017 | ||
| Revisions of previous estimates | 151 | ||
| Improved recovery | 201 | ||
| Extensions and discoveries | 5 | ||
| Purchases | 99 | ||
| Sales | (44 | ) | |
| Production | (220 | ) | |
| Total | 192 |
Occidental's ability to add reserves, other than through purchases, depends on the success of improved recovery, extension and discovery projects, each of which depends on reservoir characteristics, technology improvements and oil and natural gas prices, as well as capital and operating costs. Many of these factors are outside management’s control, and may negatively or positively affect Occidental's reserves.
Revisions of Previous Estimates
Revisions can include upward or downward changes to previous proved reserve estimates for existing fields due to the evaluation or interpretation of geologic, production decline or operating performance data. In addition, product price changes affect proved reserves recorded by Occidental. For example, lower prices may decrease the economically recoverable reserves, particularly for domestic properties, because the reduced margin limits the expected life of the operations. Offsetting this effect, lower prices increase Occidental's share of proved reserves under PSCs because more oil is required to recover costs. Conversely, when prices rise, Occidental's share of proved reserves decreases for PSCs and economically recoverable reserves may increase for other operations. In 2017, Occidental had positive revisions of 151 million BOE, mainly in the Permian Basin and Oman.
Reserve estimation rules require that estimated ultimate recoveries be much more likely to increase or remain constant than to decrease, as changes are made due to increased availability of technical data.
Improved Recovery
In 2017, Occidental added proved reserves of 201 million BOE mainly associated with the Permian Basin and UAE. These properties comprise both conventional projects, which are characterized by the deployment of EOR development methods, largely employing application of CO2 flood, waterflood or steam flood, and unconventional projects. These types of conventional EOR development methods can be applied through existing wells, though additional drilling is frequently required to fully optimize the development configuration. Waterflooding is the technique of injecting water into the formation to displace the oil to the offsetting oil production wells. The use of either CO2 or steam flooding depends on the geology of the formation, the evaluation of engineering data, availability and cost of
either CO2 or steam and other economic factors. Both techniques work similarly to lower viscosity causing the oil to move more easily to the producing wells. Many of Occidental's projects, including unconventional projects, rely on improving permeability to increase flow in the wells. In addition, some improved recovery comes from drilling infill wells that allow recovery of reserves that would not be recoverable from existing wells.
Extensions and Discoveries
Occidental also added proved reserves from extensions and discoveries, which are dependent on successful exploration and exploitation programs. In 2017, extensions and discoveries added 5 million BOE related primarily to the recognition of proved developed reserves in Oman.
Purchases of Proved Reserves
Occidental continues to seek opportunities to add reserves through acquisitions when properties are available at prices it deems reasonable. As market conditions change, the available supply of properties may increase or decrease accordingly.
In 2017, Occidental purchased 99 million BOE of proved reserves in the Permian Basin, which mainly came from acquisitions made in the third quarter of 2017.
Sales of Proved Reserves
In 2017, Occidental sold 44 million BOE in proved reserves mainly related to the sales of South Texas and non-core Permian acreage.
Proved Undeveloped Reserves
Occidental had proved undeveloped reserves at year-end 2017 of 670 million BOE, compared to the year-end 2016 amount of 550 million BOE.
Changes in proved undeveloped reserves were as follows:
| (in millions of BOE) | 2017 | |||
| Revisions of previous estimates | 51 | |||
| Improved recovery | 127 | |||
| Extensions and discoveries | 3 | |||
| Purchases | 37 | |||
| Sales | (9 | ) | ||
| Transfer to proved developed reserves | (89 | ) | ||
| Total | 120 |
The increase in proved undeveloped reserves from the Permian Basin added approximately 168 million BOE through improved recovery, positive revisions and purchases. The remaining additions mainly came from Oman and UAE.
The 2017 additions to proved undeveloped reserves were partially offset by 89 million BOE of transfers to proved developed reserves, mainly from the Permian Basin, and sales of proved undeveloped reserves related to the sales of South Texas and non-core Permian acreage.
Occidental’s highest-return projects and most active development areas are located in the Permian Basin, which
represented 73 percent of the proved undeveloped reserves as of December 31, 2017. The majority of Occidental’s 2018 capital program of $3.9 billion is allocated to the development program in the Permian Basin. Overall, Occidental plans to spend approximately $8 billion, or over 76 percent of total estimated future development costs, over the next five years to develop its proved undeveloped reserves in the Permian Basin.
Occidental’s proved undeveloped reserves in international locations are associated with approved long-term international development projects.
Reserves Evaluation and Review Process
Occidental's estimates of proved reserves and associated future net cash flows as of December 31, 2017, were made by Occidental’s technical personnel and are the responsibility of management. The estimation of proved reserves is based on the requirement of reasonable certainty of economic producibility and funding commitments by Occidental to develop the reserves. This process involves reservoir engineers, geoscientists, planning engineers and financial analysts. As part of the proved reserves estimation process, all reserve volumes are estimated by a forecast of production rates, operating costs and capital expenditures. Price differentials between benchmark prices (the unweighted arithmetic average of the first-day-of-the-month price for each month within the year) and realized prices and specifics of each operating agreement are then used to estimate the net reserves. Production rate forecasts are derived by a number of methods, including estimates from decline curve analysis, type curve analysis, material balance calculations that take into account the volumes of substances replacing the volumes produced, and associated reservoir pressure changes, seismic analysis and computer simulation of the reservoir performance. These field-tested technologies have demonstrated reasonably certain results with consistency and repeatability in the formation being evaluated or in an analogous formation. Operating and capital costs are forecast using the current cost environment applied to expectations of future operating and development activities.
Net proved developed reserves are those volumes that are expected to be recovered through existing wells with existing equipment and operating methods for which the incremental cost of any additional required investment is relatively minor.
Net proved undeveloped reserves are those volumes that are expected to be recovered from new wells on undrilled acreage, or from existing wells where a relatively major expenditure is required for recompletion. Proved undeveloped reserves are supported by a five-year, detailed, field-level development plan, which includes the timing, location and capital commitment of the wells to be drilled. The development plan is reviewed and approved annually by senior management and technical personnel. Annually a detailed review is performed by Occidental’s Worldwide Reserves Group and its technical personnel on a lease-by-lease basis to assess whether proved undeveloped reserves are being converted on a timely basis within five years from the initial disclosure date. Any leases not showing timely transfers from proved
undeveloped reserves to proved developed reserves are reviewed by senior management to determine if the remaining reserves will be developed in a timely manner and has sufficient capital committed in the development plan. Only proved undeveloped reserves that are reasonably certain to be drilled within five years of booking and are supported by a final investment decision to drill them are included in the development plan. A portion of the proved developed reserves associated with international operations are expected to be developed beyond the five years and are tied to approved long-term development plans.
The current Senior Vice President, Reserves for Oxy Oil and Gas is responsible for overseeing the preparation of reserve estimates, in compliance with U.S. Securities and Exchange Commission (SEC) rules and regulations, including the internal audit and review of Occidental's oil and gas reserves data. He has over 30 years of experience in the upstream sector of the exploration and production business, and has held various assignments in North America, Asia and Europe. He is a three-time past Chair of the Society of Petroleum Engineers Oil and Gas Reserves Committee. He is an American Association of Petroleum Geologists (AAPG) Certified Petroleum Geologist and currently serves on the AAPG Committee on Resource Evaluation. He is a member of the Society of Petroleum Evaluation Engineers, the Colorado School of Mines Potential Gas Committee and the UNECE Expert Group on Resource Classification. He has Bachelor of Science and Master of Science degrees in geology from Emory University in Atlanta.
Occidental has a Corporate Reserves Review Committee (Reserves Committee), consisting of senior corporate officers, to review and approve Occidental's oil and gas reserves. The Reserves Committee reports to the Audit Committee of Occidental's Board of Directors during the year. Since 2003, Occidental has retained Ryder Scott Company, L.P. (Ryder Scott), independent petroleum engineering consultants, to review its annual oil and gas reserve estimation processes.
In 2017, Ryder Scott conducted a process review of the methods and analytical procedures utilized by Occidental’s engineering and geological staff for estimating the proved reserves volumes, preparing the economic evaluations and determining the reserves classifications as of December 31, 2017, in accordance with the SEC regulatory standards. Ryder Scott reviewed the specific application of such methods and procedures for selected oil and gas properties considered to be a valid representation of Occidental’s 2017 year-end total proved reserves portfolio. In 2017, Ryder Scott reviewed approximately 20 percent of Occidental’s proved oil and gas reserves. Since being engaged in 2003, Ryder Scott has reviewed the specific application of Occidental’s reserve estimation methods and procedures for approximately 80 percent of Occidental’s existing proved oil and gas reserves. Management retains Ryder Scott to provide objective third-party input on its methods and procedures and to gather industry information applicable to Occidental’s reserve estimation and reporting process. Ryder Scott has not been engaged to render an opinion as to the reasonableness of reserves quantities reported by
Occidental. Occidental has filed Ryder Scott's independent report as an exhibit to this Form 10-K.
Based on its reviews, including the data, technical processes and interpretations presented by Occidental, Ryder Scott has concluded that the overall procedures and methodologies Occidental utilized in estimating the proved reserves volumes, documenting the changes in reserves from prior estimates, preparing the economic evaluations and determining the reserves classifications for the reviewed properties are appropriate for the purpose thereof and comply with current SEC regulations.
Industry Outlook
The petroleum industry is highly competitive and subject to significant volatility due to various market conditions. WTI and Brent oil price indexes for 2017 were above the 2016 index prices closing at $60.42 per barrel and $66.87 per barrel, respectively, as of December 31, 2017. Commodity prices remained relatively constant in 2017 and started to increase in the latter part of the fourth quarter.
Oil prices will continue to be affected by: (i) global supply and demand, which are generally a function of global economic conditions, inventory levels, production disruptions, technological advances, regional market conditions and the actions of OPEC, other significant producers and governments; (ii) transportation capacity, infrastructure constraints, and costs in producing areas; (iii) currency exchange rates; and (iv) the effect of changes in these variables on market perceptions.
NGLs prices are related to the supply and demand for the components of products making up these liquids. Some of them more typically correlate to the price of oil while others are affected by natural gas prices as well as the demand for certain chemical products for which they are used as feedstock. In addition, infrastructure constraints magnify the pricing volatility from region to region.
Domestic natural gas prices and local differentials are strongly affected by local supply and demand fundamentals, as well as government regulations and availability of transportation capacity from producing areas.
These and other factors make it difficult to predict the future direction of oil, NGLs and domestic gas prices reliably. For purposes of the current capital plan, Occidental anticipates 2018 oil prices to be higher than average 2017 oil prices. International gas prices are generally fixed under long-term contracts. Occidental continues to respond to economic conditions by adjusting capital expenditures in line with current economic conditions with the goal of keeping returns well above its cost of capital.
CHEMICAL SEGMENT
Business Environment
In 2017, U.S. economic growth surpassed that of 2016 and was supported by growing demand for domestically produced energy and feedstocks, even though natural gas and ethylene pricing was higher on average than in 2016. Hurricane Harvey impacted the ethylene market in the second half of 2017 and ethylene pricing on average ended the year slightly higher than 2016. The impact of higher energy and feedstock costs was offset in 2017, as tighter supply and increased demand in the caustic market
resulted in higher margins, while PVC margins slightly improved as prices kept up with raw material costs.
Business Review
Basic Chemicals
In 2017, the U.S. economic growth rate was expected to exceed the 1.5 percent experienced in 2016. The higher U.S. growth rate bolstered domestic demand as the 2017 industry chlorine operating rate increased by 4 percent, to 88 percent, resulting in an improvement in chlorine pricing in the second half of 2017. Exports of downstream chlorine derivatives into the vinyls chain were stable in 2017 as U.S. ethylene and energy costs remained advantaged over global pricing. Liquid caustic soda prices improved both domestically and globally in 2017, as increased demand and tighter supply supported the higher pricing.
Vinyls
Demand for PVC improved year-over-year with domestic demand improving 5 percent and export demand being on par with 2016. Domestic demand was driven by construction as housing starts continued their year-over-year increase and rising home values drove increased home remodeling. Export volume remains a significant portion of PVC sales, representing over 30 percent of total North American producer’s production. PVC industry operating rates decreased less than one percent compared to 2016, despite impact from Hurricane Harvey. Industry PVC margins slightly improved in 2017, as PVC pricing kept pace with higher ethylene cost.
Industry Outlook
Industry performance will depend on the health of the global economy, specifically in the housing, construction, automotive and durable goods markets. Margins also depend on market supply-and-demand balances and feedstock and energy prices. Strengthening in the petroleum industry may positively affect the demand and pricing of a number of Occidental’s products that are consumed by industry participants. U.S. commodity export markets will continue to be impacted by the relative strength of the U.S. dollar, which is anticipated to be relatively neutral in 2018.
Basic Chemicals
Continued improvement in the United States housing, automotive and durable goods markets should drive a moderate increase in domestic demand for basic chemical products in 2018. Export demand for caustic is also expected to remain firm in 2018. Chlor-alkali operating rates should improve moderately with higher demand and continued competitive energy and raw material pricing as compared to global feedstock costs. Businesses such as calcium chloride and muriatic acid continue to improve as oil and gas drilling activity increases in the U.S., which is expected to continue in 2018.
Vinyls
North American demand should continue to show improvement in 2018 over 2017 levels as growth in construction spending continues with further upside potential driven by new infrastructure projects. North
American operating rates are expected to remain relatively flat with 2017 but margins should improve as demand in the United States strengthens.
MIDSTREAM AND MARKETING SEGMENT
Business Environment
Midstream and marketing segment earnings are affected by the performance of its various businesses including its gas processing, transportation, power-generation assets, and storage facilities and terminal business. The marketing business aggregates markets, and stores Occidental's and third-party volumes. Marketing performance is affected primarily by commodity price changes and margins in oil and gas transportation and storage programs. Gas processing and transportation results are affected by the volumes that are processed and transported through the segment's plants and pipelines, as well as the margins obtained on related services.
The midstream and marketing segment earnings in 2017 were significantly higher than those in 2016 primarily due to improved Permian to Gulf Coast price differentials, higher plant income due to higher NGL prices and higher income from a full year of operating the Ingleside Crude Terminal.
Business Review
Pipeline and Gathering Systems and Transportation
Margin and cash flow from pipeline transportation operations mainly reflect volumes shipped. Dolphin Energy owns and operates a 230-mile-long, 48-inch-diameter natural gas pipeline (Dolphin Pipeline), which transports dry natural gas from Qatar to the UAE and Oman. The Dolphin Pipeline contributes significantly to Occidental's pipeline transportation results through Occidental's 24.5-percent interest in Dolphin Energy. The Dolphin Pipeline has capacity to transport up to 3.2 Bcf of natural gas per day and currently transports approximately 2.2 Bcf per day, and up to 2.5 Bcf per day in the summer.
Occidental owns an oil common carrier pipeline and storage system with approximately 2,950 miles of pipelines from southeast New Mexico across the Permian Basin in West Texas to Cushing, Oklahoma. The system has a current throughput capacity of about 720,000 barrels per day, 7.1 million barrels of active storage capability and 128 truck unloading facilities at various points along the system, which allow for additional volumes to be delivered into the pipeline. In 2017, Occidental expanded its oil pipeline system in New Mexico by an additional 50 miles.
Occidental's 2017 pipeline transportation earnings increased from 2016 due to higher throughput volumes and improved margins.
Gas Processing Plants and CO2 Fields and Facilities
Occidental processes its and third-party domestic wet gas to extract NGLs and other gas byproducts, including CO2, and delivers dry gas to pipelines. Margins primarily result from the difference between inlet costs of wet gas and market prices for NGLs. Occidental’s 2017 earnings from these operations increased compared to 2016 due to higher throughput volumes and higher realized NGL pricing.
Occidental has a 40-percent participating interest in Al Hosn Gas which is designed to process 1.0 Bcf per day of
natural gas and separate it into sales gas, condensate, NGLs and sulfur. The facilities produce approximately 10,500 tons per day of sulfur, of which approximately 4,200 tons is Occidental's share. Al Hosn Gas facilities generate revenues from gas processing fees and the sale of sulfur. The increase in 2017 earnings compared to 2016 was primarily due to higher throughput volumes and higher sulfur pricing.
Power Generation Facilities
Earnings from power and steam generation facilities are derived from sales to affiliates and third parties. The decrease in earnings in 2017 compared to 2016 was a result of lower production due to longer outages and lower ancillary sales.
Storage Facilities and Terminal Assets
Occidental owns the Oxy Ingleside Energy Center, which includes the Ingleside Crude Terminal, a crude oil storage and export terminal located in the Port of Corpus Christi in Ingleside, Texas. The facility has a competitive advantage over other similarly situated export terminals, with a location near port entry, access to deep water, industry-leading loading rates and reduced lay times while berthed. The facility has over 300,000 barrels per day of throughput capacity, along with 2.1 million barrels of storage and three loading berths with 80,000 barrels per hour loading capability. The terminal is currently capable of loading articulated tug barges (ATB), medium range (MR), Aframax and Suezmax size vessels.
In 2017, Occidental became the largest exporter of Permian light sweet crude from the United States (U.S.) Gulf Coast. The export market for crude has developed since the lifting of the export ban in 2016. While U.S. producers have increased production of light crude, U.S. refineries are constrained in their ability to process incremental volumes of light crude without significant incremental capital investment, necessitating exports to international markets. In response to the increase in Permian production and the need to export these barrels, Occidental is expanding its terminal to approximately 750,000 barrels per day of capacity and 6.8 million barrels of storage which will be operational by the end of 2019. Occidental is also expanding the facility to be capable of loading VLCC size vessels by the fourth quarter of 2018.
Marketing
The marketing group markets substantially all of Occidental’s oil, NGLs and gas production, as well as trades around its assets, including its own and third-party transportation and storage capacity. Occidental’s third-party marketing activities focus on purchasing oil, NGLs and gas for resale from parties whose oil and gas supply is located near its transportation and storage assets. These purchases allow Occidental to aggregate volumes to better utilize and optimize its assets. Marketing performance in 2017 improved compared to 2016 due to favorable Permian-to-Gulf Coast crude oil price differentials and higher marketing volumes.
Industry Outlook
The pipeline transportation and power generation businesses are expected to remain relatively stable. Marketing results can have significant volatile results depending on significant price swings, as well as Permian-to-Gulf Coast crude oil differentials. The gas processing plant operations could have volatile results depending on NGLs prices. Generally, higher NGLs prices result in higher profitability.
SEGMENT RESULTS OF OPERATIONS AND SIGNIFICANT ITEMS AFFECTING EARNINGS
Segment earnings exclude income taxes, interest income, interest expense, environmental remediation expenses, unallocated corporate expenses and discontinued operations, but include gains and losses from dispositions of segment assets and income from the segments' equity investments. Seasonality is not a primary driver of changes in Occidental's consolidated quarterly earnings during the year.
The following table sets forth the sales and earnings of each operating segment and corporate items:
| (in millions, except per share amounts) | ||||||||||||
| For the years ended December 31, | 2017 | 2016 | 2015 | |||||||||
| NET SALES (a) | ||||||||||||
| Oil and Gas | $ | 7,870 | $ | 6,377 | $ | 8,304 | ||||||
| Chemical | 4,355 | 3,756 | 3,945 | |||||||||
| Midstream and Marketing | 1,157 | 684 | 891 | |||||||||
| Eliminations | (874 | ) | (727 | ) | (660 | ) | ||||||
| $ | 12,508 | $ | 10,090 | $ | 12,480 | |||||||
| SEGMENT RESULTS AND EARNINGS | ||||||||||||
| Domestic | $ | (589 | ) | $ | (1,552 | ) | $ | (4,151 | ) | |||
| Foreign | 1,767 | 965 | (3,747 | ) | ||||||||
| Exploration | (67 | ) | (49 | ) | (162 | ) | ||||||
| Oil and Gas | 1,111 | (636 | ) | (8,060 | ) | |||||||
| Chemical | 822 | 571 | 542 | |||||||||
| Midstream and Marketing | 85 | (381 | ) | (1,194 | ) | |||||||
| 2,018 | (446 | ) | (8,712 | ) | ||||||||
| Unallocated corporate items | ||||||||||||
| Interest expense, net | (324 | ) | (275 | ) | (141 | ) | ||||||
| Income taxes | (17 | ) | 662 | 1,330 | ||||||||
| Other | (366 | ) | (943 | ) | (623 | ) | ||||||
| Income (loss) from continuing operations | 1,311 | (1,002 | ) | (8,146 | ) | |||||||
| Discontinued operations, net | — | 428 | 317 | |||||||||
| Net income (loss) | $ | 1,311 | $ | (574 | ) | $ | (7,829 | ) | ||||
| Basic Earnings per Common Share | $ | 1.71 | $ | (0.75 | ) | $ | (10.23 | ) |
| (a) | Intersegment sales eliminate upon consolidation and are generally made at prices approximating those that the selling entity would be able to obtain in third-party transactions. |
Oil and Gas
| (in millions) | ||||||||||||
| For the years ended December 31, | 2017 | 2016 | 2015 | |||||||||
| Segment Sales | $ | 7,870 | $ | 6,377 | $ | 8,304 | ||||||
| Segment Results (a) | ||||||||||||
| Domestic | $ | (589 | ) | $ | (1,552 | ) | $ | (4,151 | ) | |||
| Foreign | 1,767 | 965 | (3,747 | ) | ||||||||
| Exploration | (67 | ) | (49 | ) | (162 | ) | ||||||
| $ | 1,111 | $ | (636 | ) | $ | (8,060 | ) | |||||
| Significant items affecting results | ||||||||||||
| Asset sale gains (b) | $ | 655 | $ | 107 | $ | 10 | ||||||
| Asset impairments and related items domestic (c) | $ | (397 | ) | $ | (1 | ) | $ | (3,457 | ) | |||
| Asset impairments and related items international (d) | $ | (4 | ) | $ | (70 | ) | $ | (5,050 | ) | |||
| Total Oil and Gas | $ | 254 | $ | 36 | $ | (8,497 | ) |
| (a) | Results include significant items listed below. |
| (b) | The 2017 gain on sale of assets included the sale of South Texas and non-core acreage in the Permian Basin. The 2016 gain on sale of assets included the sale of Piceance and South Texas oil and gas properties. |
| (c) | The 2017 amount included $397 million of impairment and related charges associated with non-core proved and unproved Permian acreage. The 2015 amount included approximately $1.6 billion of impairment and related charges associated with non-core domestic oil and gas assets in the Williston Basin (sold in November 2015) and Piceance Basin (sold in March 2016). The remaining 2015 charges were mainly associated with the decline in commodity prices and management changes to future development plans. |
| (d) | The 2016 amount included a net charge of $61 million related to the sale of Libya and exit from Iraq. The 2015 amount included impairment and related charges of approximately $1.7 billion for operations where Occidental exited or reduced its involvement in and $3.4 billion related to the decline in commodity prices. |
| (in millions) | ||||||||||||
| For the years ended December 31, | 2017 | 2016 | 2015 | |||||||||
| Average Realized Prices | ||||||||||||
| Oil Prices ($ per bbl) | ||||||||||||
| United States | $ | 47.91 | $ | 39.38 | $ | 45.04 | ||||||
| Latin America | $ | 48.50 | $ | 37.48 | $ | 44.49 | ||||||
| Middle East/North Africa | $ | 50.38 | $ | 38.25 | $ | 49.65 | ||||||
| Total worldwide | $ | 48.93 | $ | 38.73 | $ | 47.10 | ||||||
| NGLs Prices ($ per bbl) | ||||||||||||
| United States | $ | 23.67 | $ | 14.72 | $ | 15.35 | ||||||
| Middle East/North Africa | $ | 18.05 | $ | 15.01 | $ | 17.88 | ||||||
| Total worldwide | $ | 21.63 | $ | 14.82 | $ | 15.96 | ||||||
| Gas Prices ($ per Mcf) | ||||||||||||
| United States | $ | 2.31 | $ | 1.90 | $ | 2.15 | ||||||
| Latin America | $ | 5.08 | $ | 3.78 | $ | 5.20 | ||||||
| Total worldwide | $ | 1.84 | $ | 1.53 | $ | 1.49 |
Domestic oil and gas results were losses of $0.6 billion, $1.6 billion and $4.2 billion in 2017, 2016 and 2015, respectively. Excluding significant items affecting results, domestic oil and gas results in 2017 increased from 2016, due to a 22 percent increase in realized oil prices, and lower DD&A rates.
Excluding significant items affecting results, domestic oil and gas results in 2016 were lower than 2015, due to a 13 percent decrease in realized oil prices, higher DD&A rates, and lower oil volumes due to the sale of non-core domestic operations. These decreases were partially offset by lower operating expenses.
International oil and gas earnings were $1.8 billion and $1.0 billion in 2017 and 2016, respectively and a loss of $3.7 billion in 2015. Excluding significant items affecting results, international oil and gas earnings in 2017, increased from 2016. The improved 2017 earnings reflected a 32 and 20 percent increase in realized crude oil and NGL prices in the Middle East, respectively.
Excluding significant items affecting results, the decrease in international oil and gas results in 2016, compared to 2015, reflected lower realized crude oil prices, which had decreased by 23 percent in the Middle East and 16 percent in Latin America. The decrease in prices was partially offset by lower DD&A rates.
Average production costs for 2017, excluding taxes other than on income, were $11.73 per BOE, compared to $10.76 per BOE for 2016. The increase in average production costs per BOE reflected the sales of low margin non-core gas assets, including South Texas and Piceance Basin. Permian Resources production costs per BOE for 2017 decreased by 5 percent from the prior year due to continued improved operational efficiencies.
Average production costs for 2016, excluding taxes other than on income, were $10.76 per BOE,compared to $11.57 per BOE for 2015. The decrease in average costs reflected lower maintenance, workover, and support costs as a result of improvements in operating efficiencies, especially in domestic operations.
The following table sets forth the production volumes of oil, NGLs and natural gas per day from ongoing operations for each of the three years in the period ended December 31, 2017.
| Production per Day from Ongoing Operations (MBOE) | 2017 | 2016 | 2015 | ||||||
| United States | |||||||||
| Permian Resources | 141 | 124 | 110 | ||||||
| Permian EOR | 150 | 145 | 145 | ||||||
| Other Domestic | 5 | 4 | 6 | ||||||
| Total | 296 | 273 | 261 | ||||||
| Latin America | 32 | 34 | 37 | ||||||
| Middle East | |||||||||
| Al Hosn Gas | 71 | 64 | 35 | ||||||
| Dolphin | 42 | 43 | 41 | ||||||
| Oman | 95 | 96 | 89 | ||||||
| Qatar | 58 | 65 | 66 | ||||||
| Total | 266 | 268 | 231 | ||||||
| Total Production Ongoing Operations | 594 | 575 | 529 | ||||||
| Sold domestic operations | 8 | 29 | 67 | ||||||
| Sold or Exited MENA operations | — | 26 | 72 | ||||||
| Total Production (MBOE) (a) | 602 | 630 | 668 |
| (a) | Natural gas volumes have been converted to BOE based on energy content of six Mcf of gas to one barrel of oil. Barrels of oil equivalence does not necessarily result in price equivalence. Please refer to "Supplemental Oil and Gas Information (unaudited)" for additional information on oil and gas production and sales. |
Average daily production volumes were 602,000 BOE and 630,000 BOE for 2017 and 2016, respectively, and included production from assets sold or exited of 8,000 BOE and 55,000 BOE for 2017 and 2016, respectively. Excluding production for assets sold or exited, average daily production volumes were 594,000 BOE and 575,000 BOE for 2017 and 2016, respectively. The increase in production mainly reflected higher Permian Resources production which increased by 14 percent from the prior year.
Average daily production volumes were 630,000 BOE and 668,000 BOE for 2016 and 2015, respectively, and included production from assets sold or exited of 55,000 BOE and 139,000 BOE for 2016 and 2015, respectively. Excluding production for assets sold or exited, average daily production volumes were 575,000 BOE and 529,000 BOE for 2016 and 2015, respectively. The increase in production from on-going operations mainly reflected higher production from Al Hosn Gas as it was not fully operational in 2015 and higher production from Permian Resources, which increased its 2016 production by 13 percent compared to 2015. These increases were offset by lower production from South Texas and Other due to curtailed drilling.
Chemical
| (in millions) | ||||||||||||
| For the years ended December 31, | 2017 | 2016 | 2015 | |||||||||
| Segment Sales | $ | 4,355 | $ | 3,756 | $ | 3,945 | ||||||
| Segment Results (a) | $ | 822 | $ | 571 | $ | 542 | ||||||
| Significant items affecting results | ||||||||||||
| Asset sale gains (b) | $ | 5 | $ | 88 | $ | 98 | ||||||
| Asset impairments and related items | — | — | (121 | ) | ||||||||
| Total Chemicals | $ | 5 | $ | 88 | $ | (23 | ) |
| (a) | Results include significant items listed below. |
| (b) | The 2016 amount included the $57 million gain on sale of the Occidental Tower in Dallas and a $31 million gain on the sale of a non-core specialty chemicals business. The 2015 amount included a $98 million gain on sale of an idled facility. |
Chemical segment earnings were $822 million, $571 million and $542 million for 2017, 2016 and 2015, respectively. Excluding significant items affecting results, the year over year increase in 2017 earnings compared to 2016, was the result of higher realized pricing for caustic soda, improved vinyls margins, higher sales volumes across most product lines, and the addition of equity income from the joint venture ethylene cracker in Ingleside, Texas.
Excluding significant items affecting results, the decrease in 2016 earnings, compared to 2015, reflected lower PVC margins as PVC pricing decreased with lower ethylene pricing, which was partially offset by lower ethylene and energy costs.
Midstream and Marketing
| (in millions) | ||||||||||||
| For the years ended December 31, | 2017 | 2016 | 2015 | |||||||||
| Segment Sales | $ | 1,157 | $ | 684 | $ | 891 | ||||||
| Segment Results (a) | $ | 85 | $ | (381 | ) | $ | (1,194 | ) | ||||
| Significant items affecting results | ||||||||||||
| Asset and equity investment gains (b) | $ | 94 | $ | — | $ | — | ||||||
| Asset impairments and related items(c) | (120 | ) | (160 | ) | (1,259 | ) | ||||||
| Total Midstream and Marketing | $ | (26 | ) | $ | (160 | ) | $ | (1,259 | ) |
| (a) | Results include significant items listed below. |
| (b) | The 2017 amount included a $94 million non-cash fair value gain on the Plains equity investment. |
| (c) | The 2017 amount included $120 million of impairment and related charges related to idled midstream facilities. The 2016 amount included charges related to the termination of crude oil supply contracts. The 2015 amount included an impairment charge of $814 million related to the Century gas processing plant as a result of our partner's inability to provide volumes to the plant and meet its contractual obligations to deliver CO2. |
Midstream and marketing segment results were earnings of $0.1 billion and losses of $0.4 billion and $1.2 billion in 2017, 2016 and 2015, respectively. Excluding significant items affecting results, the increase in 2017 results compared to 2016, reflected higher marketing margins due to improved spreads, higher plant income due to higher NGL prices and higher income from a full year of operating the Ingleside Crude Terminal.
Excluding the significant items noted above, the decrease in 2016 results compared to 2015 reflected lower marketing margins due to unfavorable contract pricing on long-term supply agreements as well as unfavorable Permian-to-Gulf Coast differentials, decreased throughput and lower realized NGLs pricing.
Corporate
The following table sets forth significant transactions and events affecting Occidental’s earnings that vary widely and unpredictably in nature, timing and amount.
| Benefit (Charge) (in millions) | 2017 | 2016 | 2015 | |||||||||
| CORPORATE | ||||||||||||
| Asset sale losses | $ | — | $ | — | $ | (8 | ) | |||||
| Asset impairments and related items(a) | — | (619 | ) | (235 | ) | |||||||
| Severance, spin-off and other | — | — | (118 | ) | ||||||||
| Tax effect of pre-tax and other adjustments | 392 | 424 | 1,903 | |||||||||
| Discontinued operations, net of tax(b) | — | 428 | 317 | |||||||||
| TOTAL | $ | 392 | $ | 233 | $ | 1,859 |
| (a) | The 2016 amount included charges of $541 million related to a reserve for doubtful accounts and $78 million loss on the distribution of the remaining CRC stock. The 2015 amount included a $227 million other-than-temporary loss on Occidental’s investment in California Resources. |
| (b) | The 2016 and 2015 amounts included gains related to the Ecuador settlement. See Note 2 of the consolidated financial statements. |
TAXES
On December 22, 2017, Tax Reform was enacted which made significant changes to the U.S. federal income tax law, including lowering the federal corporate income tax rate from 35 percent to 21 percent, repealing the corporate AMT and mandating a deemed repatriation of accumulated earnings and profits of U.S.-owned foreign corporations. Occidental recorded the effects of the changes in the tax law for which the accounting was complete. In accordance with the guidance from the SEC, Occidental recorded a provisional estimate for the federal and state tax associated with the mandatory deemed repatriation and the resulting impact to the net federal deferred tax liability. Tax Reform resulted in a one-time non-cash gain of $583 million due to the remeasurement of net deferred tax liabilities to the new federal corporate income tax rate. Occidental recognized a noncurrent receivable of $221 million for its corporate AMT credit carryforwards. The tax impact of Occidental's deemed repatriation of accumulated earnings was fully offset by foreign tax credits. At December 31, 2017, Occidental reversed its indefinite re-investment assertion with regards to its investments in foreign subsidiaries and as a result, a deferred foreign tax liability of $99 million was recorded. The ultimate impact of Tax Reform may differ from Occidental’s estimates due to changes in interpretations and assumptions as well as additional regulatory guidance. Occidental will adjust provisional amounts as updated information is evaluated. Refer to Note 10 in the Consolidated Financial Statements for additional details.
Deferred tax liabilities, net of deferred tax assets of $1.8 billion, were $581 million at December 31, 2017. The deferred tax assets, net of allowances, are expected to be realized through future operating income and reversal of temporary differences.
Worldwide Effective Tax Rate
The following table sets forth the calculation of the worldwide effective tax rate for income from continuing operations:
| (in millions) | 2017 | 2016 | 2015 | |||||||||
| SEGMENT RESULTS | ||||||||||||
| Oil and Gas | $ | 1,111 | $ | (636 | ) | $ | (8,060 | ) | ||||
| Chemical | 822 | 571 | 542 | |||||||||
| Midstream and Marketing | 85 | (381 | ) | (1,194 | ) | |||||||
| Unallocated Corporate Items | (690 | ) | (1,218 | ) | (764 | ) | ||||||
| Pre-tax (loss) income | 1,328 | (1,664 | ) | (9,476 | ) | |||||||
| Income tax (benefit) expense | ||||||||||||
| Federal and State | (903 | ) | (1,298 | ) | (2,070 | ) | ||||||
| Foreign | 920 | 636 | 740 | |||||||||
| Total income tax (benefit) expense | 17 | (662 | ) | (1,330 | ) | |||||||
| Income (loss) from continuing operations | $ | 1,311 | $ | (1,002 | ) | $ | (8,146 | ) | ||||
| Worldwide effective tax rate | 1 | % | 40 | % | 14 | % |
In 2017, Occidental's worldwide effective tax rate was 1 percent, which is lower than the 2016 rate mainly due to the remeasurement of net deferred tax liabilities to the new federal corporate income tax rate. Excluding the impact of impairments, tax rate changes and other nonrecurring
items, Occidental's worldwide effective tax rate for 2017 would be 37 percent.
CONSOLIDATED RESULTS OF OPERATIONS
Changes in components of Occidental's results of continuing operations are discussed below:
Revenue and Other Income Items
| (in millions) | 2017 | 2016 | 2015 | |||||||||
| Net sales | $ | 12,508 | $ | 10,090 | $ | 12,480 | ||||||
| Interest, dividends and other income | $ | 99 | $ | 106 | $ | 118 | ||||||
| Gain on sale of equity investments and other assets | $ | 667 | $ | 202 | $ | 101 |
The increase in net sales in 2017, compared to 2016, was mainly due to the increase in average worldwide realized oil and NGLs prices, as well as higher realized prices for caustic soda in the Chemical business. Average worldwide realized oil prices rose approximately 26 percent from 2016 to 2017.
The decrease in net sales in 2016, compared to 2015, was mainly due to the decline in average worldwide realized oil prices in 2016 and a decline in worldwide production as Occidental exited non-core areas. Average worldwide realized oil prices fell by approximately 18 percent from 2015 to 2016.
Price and volume changes in the oil and gas segment generally represent the majority of the change in oil and gas segment sales, which is a substantially larger portion of the overall change in sales than the chemical and midstream and marketing segments.
The 2017 gain on sale included the sale of South Texas and non-core proved and unproved Permian acreage. The 2016 gain on sale included the sale of Piceance and South Texas oil and gas properties, the Occidental Tower building in Dallas, and a non-core specialty chemicals business. The 2015 gain on sale included $98 million for the sale of an idled chemical facility.
Expense Items
| (in millions) | 2017 | 2016 | 2015 | |||||||||
| Cost of sales | $ | 5,594 | $ | 5,189 | $ | 5,804 | ||||||
| Selling, general and administrative and other operating expenses | $ | 1,424 | $ | 1,330 | $ | 1,270 | ||||||
| Depreciation, depletion and amortization | $ | 4,002 | $ | 4,268 | $ | 4,544 | ||||||
| Asset impairments and related items | $ | 545 | $ | 825 | $ | 10,239 | ||||||
| Taxes other than on income | $ | 311 | $ | 277 | $ | 343 | ||||||
| Exploration expense | $ | 82 | $ | 62 | $ | 36 | ||||||
| Interest and debt expense, net | $ | 345 | $ | 292 | $ | 147 |
Cost of sales increased in 2017 from 2016 due primarily to increases in chemical feedstock and energy costs and higher oil and gas purchase injectants. Cost of sales decreased in 2016 from the prior year due primarily to lower oil and gas maintenance costs and lower chemical feedstock and energy costs.
Selling, general and administrative and other operating expenses increased in 2017 compared to 2016, due to the change in timing of incentive compensation awards. Selling,
general and administrative and other operating expenses increased in 2016 compared to 2015, due to lower compensation accruals in 2015 related to Occidental's decision not to pay bonuses.
DD&A expense decreased in 2017, compared to 2016, due to lower volumes and lower DD&A rates. DD&A expense decreased in 2016, compared to 2015, due to lower volumes from the exited non-core oil and gas operations and lower DD&A rates in the Middle East.
In 2017, Occidental incurred impairment and related items charges of $545 million, of which $397 million related to proved and unproved non-core Permian acreage and $120 million for idled midstream assets. In 2016, Occidental incurred impairment and related items charges of $825 million, of which $541 million related to a reserve for doubtful accounts and $160 million for the termination of crude oil supply contracts, $78 million related to the disposal of CRC stock and $61 million related to exits from Libya and Iraq. The allowance for doubtful accounts recorded during 2016 includes a reserve against the long-term receivable related to environmental sites indemnified by Maxus described in Note 8, Environmental Liabilities and Expenditures. Occidental recorded a reserve against this receivable due to the uncertainty of collection as a result of the Maxus bankruptcy.
Asset impairments and related items in 2015 of $10.2 billion included charges of $3.5 billion related to domestic oil and gas assets due to Occidental’s exit from the Williston and Piceance basins, as well as the decline in the futures price curve and management’s decision not to pursue activities associated with certain non-producing acreage. International oil and gas charges of $5.0 billion were due to a combination of Occidental’s strategic plan to exit or reduce its exposure in certain Middle East and North Africa operations as well as the decline in the futures price curve, which have made certain projects in the region unprofitable. Midstream charges of $1.3 billion included the impairment of Occidental’s Century gas processing plant as a result of our partner’s inability to provide volumes to the plant and meet their contractual obligations to deliver CO2. Occidental recorded an other-than-temporary loss of $227 million for its available for sale investment in California Resources.
Taxes other than on income in 2017 increased from 2016 due primarily to higher oil, NGL and natural gas prices, which resulted in higher production taxes. Taxes other than on income decreased in 2016 from 2015 due primarily to lower production taxes, which are directly tied to lower commodity prices.
Other Items
| Income/(expense) (in millions) | 2017 | 2016 | 2015 | |||||||||
| (Provision for) benefit from income taxes | $ | (17 | ) | $ | 662 | $ | 1,330 | |||||
| Income from equity investments | $ | 357 | $ | 181 | $ | 208 | ||||||
| Discontinued operations, net | $ | — | $ | 428 | $ | 317 |
In 2017, Occidental recorded an income tax expense as opposed to an income tax benefit recorded in 2016, due to higher pre-tax operating income as a result of a recovery in commodity prices, partially offset by the deferred tax benefit from Tax Reform. The benefit from income taxes
decreased in 2016 from the prior year as a result of a lower net loss in 2016, compared to 2015, which reflected significant impairments and related item charges.
The increase in income from equity investments in 2017 from 2016 is the result of the OxyChem Ingleside facility beginning operations in the first quarter of 2017 and a non-cash fair value gain on the Plains equity investment. The decline in income from equity investments in 2016 from 2015 is the result of lower Dolphin gas sales.
There were no charges for discontinued operations in 2017. Discontinued operations, net in 2016 and 2015 of $428 and $317 million, respectively, primarily include settlement payments by the Republic of Ecuador. See Note 2 of the Consolidated Financial Statements.
CONSOLIDATED ANALYSIS OF FINANCIAL POSITION
The changes in select components of Occidental’s balance sheet are discussed below:
| (in millions) | 2017 | 2016 | ||||||
| CURRENT ASSETS | ||||||||
| Cash and cash equivalents | $ | 1,672 | $ | 2,233 | ||||
| Trade receivables, net | 4,145 | 3,989 | ||||||
| Inventories | 1,246 | 866 | ||||||
| Assets held for sale | 474 | — | ||||||
| Other current assets | 733 | 1,340 | ||||||
| Total current assets | $ | 8,270 | $ | 8,428 | ||||
| Investments in unconsolidated entities | $ | 1,515 | $ | 1,401 | ||||
| Property, plant and equipment, net | $ | 31,174 | $ | 32,337 | ||||
| Long-term receivables and other assets, net | $ | 1,067 | $ | 943 | ||||
| CURRENT LIABILITIES | ||||||||
| Current maturities of long-term debt | $ | 500 | $ | — | ||||
| Accounts payable | 4,408 | 3,926 | ||||||
| Accrued liabilities | 2,492 | 2,436 | ||||||
| Total current liabilities | $ | 7,400 | $ | 6,362 | ||||
| Long-term debt, net | $ | 9,328 | $ | 9,819 | ||||
| DEFERRED CREDITS AND OTHER LIABILITIES | ||||||||
| Deferred domestic and foreign income taxes | $ | 581 | $ | 1,132 | ||||
| Asset retirement obligations | $ | 1,241 | $ | 1,245 | ||||
| Pension and postretirement obligations | $ | 1,005 | $ | 963 | ||||
| Environmental remediation reserves | $ | 728 | $ | 739 | ||||
| Other | $ | 1,171 | $ | 1,352 | ||||
| Total deferred credits and other liabilities | $ | 4,726 | $ | 5,431 | ||||
| STOCKHOLDERS' EQUITY | $ | 20,572 | $ | 21,497 |
Assets
See "Liquidity and Capital Resources — Cash Flow Analysis" for discussion of the change in cash and cash equivalents and restricted cash.
The increase in trade receivables, net, was the result of improved oil and gas prices at the end of 2017, compared to the end of 2016. Average December WTI and Brent prices increased approximately 11 percent and 17 percent, per barrel, respectively from 2016 to 2017. The increase in inventories in 2017 was the result of more exported domestic crude oil in transit in the midstream and marketing segment. Assets held for sale at the end of 2017 mainly reflected non-core proved and unproved Permian acreage. Other current assets decreased as a result of the receipt of a federal tax refund related to the 2016 net operating loss
carryback. The increase in investments in unconsolidated entities was due to contributions to the ethylene cracker joint venture, and the second quarter non-cash fair value gain related to Occidental's equity investment in Plains Pipeline. The decrease in property, plant and equipment, net (PP&E), was due to depletion and sales of non-core assets, which was partially offset by capital additions and acquisitions.
Liabilities and Stockholders' Equity
Current maturities of long-term debt represent the $0.5 billion of 1.50-percent senior notes due 2018.
The increase in accounts payable reflected higher marketing payables as a result of higher oil and gas prices at the end of 2017, compared to the end of 2016.
The decrease in deferred credits and other liabilities-income taxes was primarily due to the remeasurement of net deferred taxes as a result of a reduction in the federal corporate income tax rate. The decrease in long-term debt is the result of the reclassification of notes to current maturities of long-term debt. The decrease in stockholders' equity reflected the distribution of cash dividends, partially offset by the 2017 net income.
LIQUIDITY AND CAPITAL RESOURCES
At December 31, 2017, Occidental had approximately $1.7 billion in cash and cash equivalents. A substantial majority of this cash is held and available for use in the United States. Income and cash flows are largely dependent on the oil and gas segment's prices, sales volumes and costs.
Occidental utilized the remaining restricted cash balance resulting from the spin-off of California Resources in the first quarter of 2016 to retire debt and pay dividends.
In November 2016, Occidental issued $1.5 billion of senior notes, comprised of $750 million of 3.0-percent senior notes due 2027 and $750 million of 4.1-percent senior notes due 2047. Occidental received net proceeds of $1.49 billion. Interest on the senior notes is payable semi-annually in arrears in February and August each year for each series of senior notes beginning August 15, 2017. Occidental used the proceeds for general corporate purposes.
In May and June 2016, respectively, Occidental utilized part of the proceeds from the April 2016 senior note offering (described below) to exercise the early redemption option on $1.25 billion of 1.75-percent senior notes due in the first quarter of 2017 and to retire all $750 million of 4.125-percent senior notes that matured in June 2016.
In April 2016, Occidental issued $2.75 billion of senior notes, comprised of $0.4 billion of 2.6-percent senior notes due 2022, $1.15 billion of 3.4-percent senior notes due 2026 and $1.2 billion of 4.4-percent senior notes due 2046. Occidental received net proceeds of approximately $2.72 billion. Interest on the senior notes is payable semi-annually in arrears in April and October of each year for each series of senior notes, beginning on October 15, 2016. Occidental used a portion of the proceeds to retire debt in May and June 2016, and used the remaining proceeds for general corporate purposes.
In February 2016, Occidental retired $700 million of 2.5-percent senior notes that had matured.
In June 2015, Occidental issued $1.5 billion of debt that was comprised of $750 million of 3.50-percent senior unsecured notes due 2025 and $750 million of 4.625-percent senior unsecured notes due 2045. Occidental received net proceeds of approximately $1.48 billion. Interest on the notes is payable semi-annually in arrears in June and December of each year for both series of notes, beginning on December 15, 2015.
As of December 31, 2017, Occidental had an undrawn $2.0 billion revolving credit facility (2014 Credit Facility). Occidental did not draw down any amounts under the 2014 Credit Facility during 2017 or 2016, and no amounts were outstanding as of December 31, 2017.
In January 2018, Occidental entered into a new five-year, $3.0 billion revolving credit facility (2018 Credit Facility), which replaced the 2014 Credit Facility, that was scheduled to expire in August 2019. The 2018 Credit Facility has similar terms to the 2014 Credit Facility and does not contain material adverse change clauses or debt ratings triggers that could restrict Occidental's ability to borrow under the facility.
As of December 31, 2017, under the most restrictive covenants of its financing agreements, Occidental had substantial capacity for additional unsecured borrowings, the payment of cash dividends and other distributions on, or acquisitions of, Occidental stock.
Occidental expects to fund its liquidity needs, including future dividend payments, through cash on hand, cash generated from operations, monetization of non-core assets or investments and through future borrowings, and if necessary, proceeds from other forms of capital issuance.
Cash Flow Analysis
| Cash provided by operating activities | ||||||||||||
| (in millions) | 2017 | 2016 | 2015 | |||||||||
| Operating cash flow from continuing operations | $ | 4,996 | $ | 2,519 | $ | 3,254 | ||||||
| Operating cash flow from discontinued operations, net of taxes | — | 864 | 97 | |||||||||
| Net cash provided by operating activities | $ | 4,996 | $ | 3,383 | $ | 3,351 |
Cash provided by operating activities from continuing operations in 2017 increased $2.5 billion to $5.0 billion, from $2.5 billion in 2016. Operating cash flows were positively impacted by higher worldwide oil and NGLs prices and higher domestic volumes in the oil and gas business and improved margins in the midstream and marketing and chemicals businesses. Cash flows from continuing operations in 2017 also included $761 million of federal tax refunds.
Cash provided by operating activities from continuing operations in 2016 decreased $0.7 billion to $2.5 billion, from $3.3 billion in 2015. Operating cash flows were negatively impacted by lower worldwide average realized oil prices in the first half of 2016, which on a year-over-year basis declined 18 percent. The effect of lower commodity prices was partially offset by lower operating costs, especially in the oil and gas segment where year over year production costs decreased by 7 percent. Cash flows from
continuing operations in 2016 also included collections of $325 million of federal and state tax refunds. Operating cash flows from discontinued operations reflected the collection of the Ecuador settlement.
Other cost elements, such as labor costs and overhead, are not significant drivers of changes in cash flow because they are relatively stable within a narrow range over the short to intermediate term. Changes in these costs had a much smaller effect on cash flows than changes in oil and gas product prices, sales volumes and operating costs.
The chemical and midstream and marketing segments cash flows are significantly smaller and their overall cash flows are generally less significant than the impact of the oil and gas segment.
| Cash used by investing activities | ||||||||||||
| (in millions) | 2017 | 2016 | 2015 | |||||||||
| Capital expenditures | ||||||||||||
| Oil and Gas | $ | (2,945 | ) | $ | (1,978 | ) | $ | (4,442 | ) | |||
| Chemical | (308 | ) | (324 | ) | (254 | ) | ||||||
| Midstream and Marketing | (284 | ) | (358 | ) | (535 | ) | ||||||
| Corporate | (62 | ) | (57 | ) | (41 | ) | ||||||
| Total | (3,599 | ) | (2,717 | ) | (5,272 | ) | ||||||
| Other investing activities, net | 385 | (2,025 | ) | (151 | ) | |||||||
| Net cash used by investing activities | $ | (3,214 | ) | $ | (4,742 | ) | $ | (5,423 | ) |
Occidental’s capital expenditures increased by $0.9 billion in 2017 to $3.6 billion. The increase was a result of additional capital spending primarily in the Permian Basin due to a recovery in the commodity price environment.
Occidental’s net capital expenditures declined by $2.7 billion in 2016 to $2.9 billion, after contributions to the OxyChem Ingleside facility; which is included in other investing activities. The decline was a result of the oil and gas budget reduction due to lower commodity price environment and reductions in spending on long-term projects such as the OxyChem Ingleside facility, which came on line in early 2017.
Occidental remains committed to allocating capital to its highest-return projects and its 2018 capital spending is expected to be $3.9 billion.
In 2017, cash flows provided by other investing activities of $0.4 billion includes proceeds of $1.4 billion, which were primarily related to the sale of non-core Permian acreage and Occidental's South Texas operations, partially offset by $1.1 billion of acquisition costs primarily related to Permian properties.
In 2016, cash flows used in other investing activities of $2.0 billion is comprised primarily of the acquisition of acreage in the Permian in October 2016.
In 2015, cash flows used in other investing activities of $0.1 billion is comprised primarily of changes in the capital accrual and asset purchases offset by the sales of equity investments and assets.
| Cash provided (used) by financing activities | ||||||||||||
| (in millions) | 2017 | 2016 | 2015 | |||||||||
| Net cash provided (used) by financing activities | $ | (2,343 | ) | $ | 391 | $ | 1,484 |
Cash used by financing activities in 2017 was $2.3 billion, as compared to cash provided by financing activities in 2016 of $0.4 billion. Financing activities in 2017 mainly consist of dividend payments of $2.3 billion.
Cash provided by financing activities in 2016 was $0.4 billion, as compared to cash provided by financing activities in 2015 of $1.5 billion. Financing activities in 2016 included proceeds from long term debt of $4.2 billion and payments of long term debt of $2.7 billion. Occidental used restricted cash of $1.2 billion to pay dividends and retire debt.
OFF-BALANCE-SHEET ARRANGEMENTS
The following is a description of the business purpose and nature of Occidental's off-balance-sheet arrangements.
Guarantees
Occidental has guaranteed its portion of equity method investees' debt and has entered into various other guarantees including performance bonds, letters of credit, indemnities and commitments provided by Occidental to third parties, mainly to provide assurance that OPC or its subsidiaries and affiliates will meet their various obligations (guarantees). As of December 31, 2017, Occidental’s guarantees were not material and a substantial majority consisted of limited recourse guarantees on approximately $272 million of Dolphin Energy's debt. The fair value of the guarantees was immaterial.
Occidental has guaranteed certain obligations of its subsidiaries for various letters of credit, indemnities and commitments.
See "Oil and Gas Segment — Business Review — Qatar" and “Segment Results of Operations” for further information about Dolphin.
Leases
Occidental has entered into various operating lease agreements, mainly for transportation equipment, power plants, machinery, terminals, storage facilities, land and office space. Occidental leases assets when leasing offers greater operating flexibility. Lease payments are generally expensed as part of cost of sales and selling, general and administrative expenses. For more information, see "Contractual Obligations."
CONTRACTUAL OBLIGATIONS
The table below summarizes and cross-references Occidental’s contractual obligations. This summary indicates on- and off-balance-sheet obligations as of December 31, 2017.
| Contractual Obligations (in millions) | Payments Due by Year | |||||||||||||||||||
| Total | 2018 | 2019 and 2020 | 2021 and 2022 | 2023 and thereafter | ||||||||||||||||
| On-Balance Sheet | ||||||||||||||||||||
| Long-term debt (Note 5) (a) | $ | 9,907 | $ | 500 | $ | 116 | $ | 2,462 | $ | 6,829 | ||||||||||
| Other long-term liabilities (b) | 2,092 | 217 | 472 | 317 | 1,086 | |||||||||||||||
| Off-Balance Sheet | ||||||||||||||||||||
| Operating leases (Note 6) | 1,068 | 275 | 234 | 172 | 387 | |||||||||||||||
| Purchase obligations (c) | 8,095 | 1,582 | 2,031 | 1,288 | 3,194 | |||||||||||||||
| Total | $ | 21,162 | $ | 2,574 | $ | 2,853 | $ | 4,239 | $ | 11,496 |
| (a) | Excludes unamortized debt discount and interest on the debt. As of December 31, 2017, interest on long-term debt totaling $4.8 billion is payable in the following years (in millions): 2018 - $356, 2019 and 2020 - $695, 2021 and 2022 - $561, 2023 and thereafter - $3,141. |
| (b) | Includes obligations under postretirement benefit and deferred compensation plans, accrued transportation commitments and other accrued liabilities. |
| (c) | Amounts include payments which will become due under long-term agreements to purchase goods and services used in the normal course of business to secure terminal, pipeline and processing capacity, drilling rigs and services, CO2, electrical power, steam and certain chemical raw materials. Amounts exclude certain product purchase obligations related to marketing activities for which there are no minimum purchase requirements or the amounts are not fixed or determinable. Long-term purchase contracts are discounted at a 3.7 percent discount rate. |
Delivery Commitments
Occidental has commitments to certain refineries and other buyers to deliver oil, natural gas and NGLs. The domestic volumes contracted to be delivered, which are not presented in Note 7 of the consolidated financial statements, are approximately 279 million barrels of oil through 2025, 2 Bcf of gas through 2019 and 25 million barrels of NGLs through 2019. The price for these deliveries is set at the time of delivery of the product. Occidental has significantly more production capacity than the amounts committed and has the ability to secure additional volumes in case of a shortfall.
LAWSUITS, CLAIMS AND CONTINGENCIES
Occidental or certain of its subsidiaries are involved, in the normal course of business, in lawsuits, claims and other legal proceedings that seek, among other things, compensation for alleged personal injury, breach of contract, property damage or other losses, punitive damages, civil penalties, or injunctive or declaratory relief. Occidental or certain of its subsidiaries also are involved in proceedings under CERCLA and similar federal, state, local and foreign environmental laws. These environmental proceedings seek funding or performance of remediation and, in some cases, compensation for alleged property damage, punitive damages, civil penalties and injunctive relief. Usually Occidental or such subsidiaries are among
many companies in these environmental proceedings and have to date been successful in sharing response costs with other financially sound companies. Further, some lawsuits, claims and legal proceedings involve acquired or disposed assets with respect to which a third party or Occidental retains liability or indemnifies the other party for conditions that existed prior to the transaction.
In accordance with applicable accounting guidance, Occidental accrues reserves for outstanding lawsuits, claims and proceedings when it is probable that a liability has been incurred and the liability can be reasonably estimated. In Note 8, Occidental has disclosed its reserve balances for environmental remediation matters that satisfy this criteria. Reserve balances for matters, other than environmental remediation matters that satisfy this criteria as of December 31, 2017, and December 31, 2016, were not material to Occidental's consolidated balance sheet.
In 2017, Andes Petroleum Ecuador Ltd. filed a demand for arbitration, claiming it is entitled to a 40 percent share of the settlement payments made by the Republic of Ecuador to Occidental for the 2006 expropriation of Occidental’s Participation Contract for Ecuador’s Block 15. Occidental intends to vigorously defend against this claim in arbitration.
The ultimate outcome and impact of outstanding lawsuits, claims and proceedings on Occidental cannot be predicted. Management believes that the resolution of these matters will not, individually or in the aggregate, have a material adverse effect on Occidental's consolidated balance sheet, statements of operations or cash flows after consideration of recorded accruals. Occidental’s estimates are based on information known about the legal matters and its experience in contesting, litigating and settling similar matters. Occidental reassesses the probability and estimability of contingent losses as new information becomes available.
Tax Matters
During the course of its operations, Occidental is subject to audit by tax authorities for varying periods in various federal, state, local and foreign tax jurisdictions. Although taxable years through 2009 for U.S. federal income tax purposes have been audited by the United States Internal Revenue Service (IRS) pursuant to its Compliance Assurance Program, subsequent taxable years are currently under review. Taxable years from 2002 through the current year remain subject to examination by foreign and state government tax authorities in certain jurisdictions. In certain of these jurisdictions, tax authorities are in various stages of auditing Occidental’s income taxes. During the course of tax audits, disputes have arisen and other disputes may arise as to facts and matters of law. Occidental believes that the resolution of outstanding tax matters would not have a material adverse effect on its consolidated financial position or results of operations.
Indemnities to Third Parties
Occidental, its subsidiaries, or both, have indemnified various parties against specified liabilities those parties might incur in the future in connection with purchases and other transactions that they have entered into with Occidental. These indemnities usually are contingent upon
the other party incurring liabilities that reach specified thresholds. As of December 31, 2017, Occidental is not aware of circumstances that it believes would reasonably be expected to lead to indemnity claims that would result in payments materially in excess of reserves.
ENVIRONMENTAL LIABILITIES AND EXPENDITURES
Occidental’s operations are subject to stringent federal, state, local and foreign laws and regulations related to improving or maintaining environmental quality.
The laws that require or address environmental remediation, including CERCLA and similar federal, state, local and foreign laws, may apply retroactively and regardless of fault, the legality of the original activities or the current ownership or control of sites. OPC or certain of its subsidiaries participate in or actively monitor a range of remedial activities and government or private proceedings under these laws with respect to alleged past practices at operating, closed and third-party sites. Remedial activities may include one or more of the following: investigation involving sampling, modeling, risk assessment or monitoring; cleanup measures including removal, treatment or disposal; or operation and maintenance of remedial systems. The environmental proceedings seek funding or performance of remediation and, in some cases, compensation for alleged property damage, punitive damages, civil penalties, injunctive relief and government oversight costs.
Environmental Remediation
As of December 31, 2017, Occidental participated in or monitored remedial activities or proceedings at 148 sites. The following table presents Occidental’s current and non-current environmental remediation reserves as of December 31, 2017, 2016 and 2015, the current portion of which is included in accrued liabilities ($137 million in 2017, $131 million in 2016, and $70 million in 2015) and the remainder in deferred credits and other liabilities — Environmental remediation reserves ($728 million in 2017, $739 million in 2016, and $316 million in 2015). The reserves are grouped as environmental remediation sites listed or proposed for listing by the U.S. Environmental Protection Agency on the CERCLA National Priorities List (NPL) sites and three categories of non-NPL sites — third-party sites, Occidental-operated sites and closed or non-operated Occidental sites.
| ($ amounts in millions) | 2017 | 2016 | 2015 | ||||||||||||||||||
| # of Sites | Reserve Balance | # of Sites | Reserve Balance | # of Sites | Reserve Balance | ||||||||||||||||
| NPL sites | 34 | $ | 457 | 33 | $ | 461 | 34 | $ | 27 | ||||||||||||
| Third-party sites | 70 | 157 | 68 | 163 | 66 | 128 | |||||||||||||||
| Occidental-operated sites | 15 | 108 | 17 | 106 | 18 | 107 | |||||||||||||||
| Closed or non-operated Occidental sites | 29 | 143 | 29 | 140 | 31 | 124 | |||||||||||||||
| Total | 148 | $ | 865 | 147 | $ | 870 | 149 | $ | 386 |
As of December 31, 2017, Occidental’s environmental reserves exceeded $10 million each at 16 of the 148 sites
described above, and 89 of the sites had reserves from $0 to $1 million each.
As of December 31, 2017, three sites — the Diamond Alkali Superfund Site and a former chemical plant in Ohio (both of which are indemnified by Maxus Energy Corporation, as discussed further below), and a landfill in Western New York - accounted for 95 percent of its reserves associated with NPL sites. The reserve balance above includes 17 NPL sites indemnified by Maxus.
Five of the 70 third-party sites — a Maxus-indemnified chrome site in New Jersey, a former copper mining and smelting operation in Tennessee, an active plant outside of the United States, a sediment site in Louisiana and an active refinery in Louisiana where Occidental reimburses the current owner for certain remediation activities- accounted for 60 percent of Occidental’s reserves associated with these sites. The reserve balance above includes 9 third-party sites indemnified by Maxus.
Three sites — chemical plants in Kansas, Louisiana and Texas accounted for 49 percent of the reserves associated with the Occidental-operated sites.
Five other sites — a landfill in Western New York, former chemical plants in Tennessee, Washington and California, and a closed coal mine in Pennsylvania- accounted for 62 percent of the reserves associated with closed or non-operated Occidental sites.
Environmental reserves vary over time depending on factors such as acquisitions or dispositions, identification of additional sites and remedy selection and implementation.
Based on current estimates, Occidental expects to expend funds corresponding to approximately 40 percent of the current environmental reserves at the sites described above over the next three to four years and the balance at these sites over the subsequent 10 or more years. Occidental believes its range of reasonably possible additional losses beyond those liabilities recorded for environmental remediation at all of its environmental sites could be up to $1.1 billion.
Maxus Environmental Sites
When Occidental acquired Diamond Shamrock Chemicals Company (DSCC) in 1986, Maxus Energy Corporation (Maxus), a subsidiary of YPF S.A. (YPF), agreed to indemnify Occidental for a number of environmental sites, including the Diamond Alkali Superfund Site (Site) along a portion of the Passaic River. On June 17, 2016, Maxus and several affiliated companies filed for Chapter 11 bankruptcy in Federal District Court in the State of Delaware. Prior to filing for bankruptcy, Maxus defended and indemnified Occidental in connection with clean-up and other costs associated with the sites subject to the indemnity, including the Site.
In March 2016, the EPA issued a Record of Decision (ROD) specifying remedial actions required for the lower 8.3 miles of the Lower Passaic River. The ROD does not address any potential remedial action for the upper nine miles of the Lower Passaic River or Newark Bay. During the third quarter of 2016, and following Maxus’s bankruptcy filing, Occidental and the EPA entered into an Administrative Order on Consent (AOC) to complete the
design of the proposed clean-up plan outlined in the ROD at an estimated cost of $165 million. The EPA announced that it will pursue similar agreements with other potentially responsible parties.
Occidental has accrued a reserve relating to its estimated allocable share of the costs to perform the design and the remediation called for in the AOC and the ROD, as well as for certain other Maxus-indemnified sites. Occidental's accrued estimated environmental reserve does not consider any recoveries for indemnified costs. Occidental’s ultimate share of this liability may be higher or lower than the reserved amount, and is subject to final design plans and the resolution of Occidental's allocable share with other potentially responsible parties. Occidental continues to evaluate the costs to be incurred to comply with the AOC, the ROD and to perform remediation at other Maxus-indemnified sites in light of the Maxus bankruptcy and the share of ultimate liability of other potentially responsible parties.
In June 2017, the court overseeing the Maxus bankruptcy approved a Plan of Liquidation (Plan) to liquidate Maxus and create a trust to pursue claims against YPF, Repsol and others to satisfy claims by Occidental and other creditors for past and future cleanup and other costs. In July 2017, the court-approved Plan became final and the trust became effective. Among other responsibilities, the trust will pursue claims against YPF, Repsol and others and distribute assets to Maxus' creditors in accordance with the trust agreement and Plan.
Environmental Costs
Occidental’s environmental costs, some of which include estimates, are presented below for each segment for each of the years ended December 31:
| (in millions) | 2017 | 2016 | 2015 | |||||||||
| Operating Expenses | ||||||||||||
| Oil and Gas | $ | 68 | $ | 65 | $ | 93 | ||||||
| Chemical | 78 | 75 | 74 | |||||||||
| Midstream and Marketing | 15 | 11 | 13 | |||||||||
| $ | 161 | $ | 151 | $ | 180 | |||||||
| Capital Expenditures | ||||||||||||
| Oil and Gas | $ | 77 | $ | 43 | $ | 122 | ||||||
| Chemical | 18 | 25 | 41 | |||||||||
| Midstream and Marketing | 6 | 5 | 4 | |||||||||
| $ | 101 | $ | 73 | $ | 167 | |||||||
| Remediation Expenses | ||||||||||||
| Corporate | $ | 39 | $ | 61 | $ | 117 |
Operating expenses are incurred on a continual basis. Capital expenditures relate to longer-lived improvements in properties currently operated by Occidental. Remediation expenses relate to existing conditions from past operations.
Occidental presently estimates capital expenditures for environmental compliance of approximately $137 million for 2018.
FOREIGN INVESTMENTS
Many of Occidental’s assets are located outside North America. At December 31, 2017, the carrying value of Occidental’s assets in countries outside North America
aggregated approximately $9.8 billion, or 23 percent of Occidental’s total assets at that date. Of such assets, approximately $8.2 billion are located in the Middle East and approximately $1.1 billion are located in Latin America. For the year ended December 31, 2017, net sales outside North America totaled $4.4 billion, or approximately 35 percent of total net sales.
CRITICAL ACCOUNTING POLICIES AND ESTIMATES
The process of preparing financial statements in accordance with generally accepted accounting principles requires Occidental's management to make informed estimates and judgments regarding certain items and transactions. Changes in facts and circumstances or discovery of new information may result in revised estimates and judgments, and actual results may differ from these estimates upon settlement but generally not by material amounts. There has been no material change to Occidental's critical accounting policies over the past three years. The selection and development of these policies and estimates have been discussed with the Audit Committee of the Board of Directors. Occidental considers the following to be its most critical accounting policies and estimates that involve management's judgment.
Oil and Gas Properties
The carrying value of Occidental’s PP&E represents the cost incurred to acquire or develop the asset, including any asset retirement obligations and capitalized interest, net of accumulated depreciation, depletion, and amortization (DD&A) and any impairment charges. For assets acquired, PP&E cost is based on fair values at the acquisition date. Asset retirement obligations and interest costs incurred in connection with qualifying capital expenditures are capitalized and amortized over the lives of the related assets.
Occidental uses the successful efforts method to account for its oil and gas properties. Under this method, Occidental capitalizes costs of acquiring properties, costs of drilling successful exploration wells, and development costs. The costs of exploratory wells are initially capitalized pending a determination of whether proved reserves have been found. If proved reserves have been found, the costs of exploratory wells remain capitalized. Otherwise, Occidental charges the costs of the related wells to expense. In some cases, a determination of proved reserves cannot be made at the completion of drilling, requiring additional testing and evaluation of the wells. Occidental generally expenses the costs of such exploratory wells if a determination of proved reserves has not been made within a 12-month period after drilling is complete.
Occidental expenses annual lease rentals, the costs of injectants used in production, and geological, geophysical and seismic costs as incurred.
Occidental determines depreciation and depletion of oil and gas producing properties by the unit-of-production method. It amortizes acquisition costs over total proved reserves and capitalized development and successful exploration costs over proved developed reserves.
Proved oil and gas reserves are those quantities of oil and gas which, by analysis of geoscience and engineering
data, can be estimated with reasonable certainty to be economically producible—from a given date forward, from known reservoirs, and under existing economic conditions, operating methods, and government regulations—prior to the time at which contracts providing the right to operate expire, unless evidence indicates that renewal is reasonably certain, regardless of whether deterministic or probabilistic methods are used for the estimation. Occidental has no proved oil and gas reserves for which the determination of economic producibility is subject to the completion of major additional capital expenditures.
Several factors could change Occidental’s proved oil and gas reserves. For example, Occidental receives a share of production from PSCs to recover its costs and generally an additional share for profit. Occidental’s share of production and reserves from these contracts decreases when product prices rise and increases when prices decline. Overall, Occidental’s net economic benefit from these contracts is greater at higher product prices. In other cases, particularly with long-lived properties, lower product prices may lead to a situation where production of a portion of proved reserves becomes uneconomical. For such properties, higher product prices typically result in additional reserves becoming economical. Estimation of future production and development costs is also subject to change partially due to factors beyond Occidental's control, such as energy costs and inflation or deflation of oil field service costs. These factors, in turn, could lead to changes in the quantity of proved reserves. Additional factors that could result in a change of proved reserves include production decline rates and operating performance differing from those estimated when the proved reserves were initially recorded.
Additionally, Occidental performs impairment tests with respect to its proved properties whenever events or circumstances indicate that the carrying value of property may not be recoverable. If there is an indication the carrying amount of the asset may not be recovered due to declines in current and forward prices, significant changes in reserve estimates, changes in management's plans, or other significant events, management will evaluate the property for impairment. Under the successful efforts method, if the sum of the undiscounted cash flows is less than the carrying value of the proved property, the carrying value is reduced to estimated fair value and reported as an impairment charge in the period. Individual proved properties are grouped for impairment purposes at the lowest level for which there are identifiable cash flows. The fair value of impaired assets is typically determined based on the present value of expected future cash flows using discount rates believed to be consistent with those used by market participants. The impairment test incorporates a number of assumptions involving expectations of future cash flows which can change significantly over time. These assumptions include estimates of future product prices, contractual prices, estimates of risk-adjusted oil and gas reserves and estimates of future operating and development costs. It is reasonably possible that prolonged declines in commodity prices, reduced capital spending in response to lower prices or increases in operating costs could result in additional impairments.
For impairment testing, unless prices were contractually fixed, Occidental used observable forward strip prices for oil and natural gas prices when projecting future cash flows. Prices are held constant for periods beyond those covered by forward strip prices. Future operating and development costs were estimated using the current cost environment applied to expectations of future operating and development activities to develop and produce oil and gas reserves. Market prices for crude oil, natural gas and NGLs have been volatile and may continue to be volatile in the future. Current market fundamentals indicate improved prices for crude oil, natural gas and NGLs in 2018; however, changes in global supply and demand, transportation capacity, currency exchange rates, and applicable laws and regulations, and the effect of changes in these variables on market perceptions could impact current forecasts. Future fluctuations in commodity prices could result in estimates of future cash flows to vary significantly.
The most significant ongoing financial statement effect from a change in Occidental's oil and gas reserves or impairment of its proved properties would be to the DD&A rate. For example, a 5 percent increase or decrease in the amount of oil and gas reserves would change the DD&A rate by approximately $0.55 per barrel, which would increase or decrease pre-tax income by approximately $120 million annually at current production rates.
A portion of the carrying value of Occidental’s oil and gas properties is attributable to unproved properties. Net capitalized costs attributable to unproved properties were $1.0 billion and $1.4 billion at December 31, 2017 and 2016, respectively. The unproved amounts are not subject to DD&A until they are classified as proved properties. Capitalized costs attributable to the properties become subject to DD&A when proved reserves are assigned to the property. If the exploration efforts are unsuccessful, or management decides not to pursue development of these properties as a result of lower commodity prices, higher development and operating costs, contractual conditions or other factors, the capitalized costs of the related properties would be expensed. The timing of any writedowns of these unproved properties, if warranted, depends upon management's plans, the nature, timing and extent of future exploration and development activities and their results. Occidental believes its current plans and exploration and development efforts will allow it to realize its unproved property balance.
Chemical Assets
Occidental's chemical assets are depreciated using either the unit-of-production or the straight-line method, based upon the estimated useful lives of the facilities. The estimated useful lives of Occidental’s chemical assets, which range from three years to 50 years, are also used for impairment tests. The estimated useful lives for the chemical facilities are based on the assumption that Occidental will provide an appropriate level of annual expenditures to ensure productive capacity is sustained. Such expenditures consist of ongoing routine repairs and maintenance, as well as planned major maintenance activities (PMMA). Ongoing routine repairs and maintenance expenditures are expensed as incurred.
PMMA costs are capitalized and amortized over the period until the next planned overhaul. Additionally, Occidental incurs capital expenditures that extend the remaining useful lives of existing assets, increase their capacity or operating efficiency beyond the original specification or add value through modification for a different use. These capital expenditures are not considered in the initial determination of the useful lives of these assets at the time they are placed into service. The resulting revision, if any, of the asset’s estimated useful life is measured and accounted for prospectively.
Without these continued expenditures, the useful lives of these assets could decrease significantly. Other factors that could change the estimated useful lives of Occidental’s chemical assets include sustained higher or lower product prices, which are particularly affected by both domestic and foreign competition, demand, feedstock costs, energy prices, environmental regulations and technological changes.
Occidental performs impairment tests on its chemical assets whenever events or changes in circumstances lead to a reduction in the estimated useful lives or estimated future cash flows that would indicate that the carrying amount may not be recoverable, or when management’s plans change with respect to those assets. Any impairment loss would be calculated as the excess of the asset's net book value over its estimated fair value.
Occidental's net PP&E for the chemical segment is approximately $2.4 billion and its DD&A expense for 2018 is expected to be approximately $350 million. The most significant financial statement impact of a decrease in the estimated useful lives of Occidental's chemical plants would be on depreciation expense. For example, a reduction in the remaining useful lives of one year would increase depreciation and reduce pre-tax earnings by approximately $44 million per year.
Midstream, Marketing and Other Assets
Derivatives are carried at fair value and on a net basis when a legal right of offset exists with the same counterparty. Occidental applies hedge accounting when transactions meet specified criteria for cash-flow hedge treatment and management elects and documents such treatment. Otherwise, any fair value gains or losses are recognized in earnings in the current period. For cash-flow hedges, the gain or loss on the effective portion of the derivative is reported as a component of other comprehensive income (OCI) with an offsetting adjustment to the basis of the item being hedged. Realized gains or losses from cash-flow hedges, and any ineffective portion, are recorded as a component of net sales in the consolidated statements of operations. Ineffectiveness is primarily created by a lack of correlation between the hedged item and the hedging instrument due to location, quality, grade or changes in the expected quantity of the hedged item. Gains and losses from derivative instruments are reported net in the consolidated statements of operations. There were no fair value hedges as of and during the years ended December 31, 2017, 2016 and 2015.
A hedge is regarded as highly effective such that it qualifies for hedge accounting if, at inception and
throughout its life, it is expected that changes in the fair value or cash flows of the hedged item will be offset by 80 to 125 percent of the changes in the fair value or cash flows, respectively, of the hedging instrument. In the case of hedging a forecast transaction, the transaction must be probable and must present an exposure to variations in cash flows that could ultimately affect reported net income or loss. Occidental discontinues hedge accounting when it determines that a derivative has ceased to be highly effective as a hedge; when the hedged item matures or is sold or repaid; or when a forecast transaction is no longer deemed probable.
Occidental's midstream and marketing PP&E is depreciated over the estimated useful lives of the assets, using either the unit-of-production or straight-line method. Occidental performs impairment tests on its midstream and marketing assets whenever events or changes in circumstances lead to a reduction in the estimated useful lives or estimated future cash flows that would indicate that the carrying amount may not be recoverable, or when management’s plans change with respect to those assets. Any impairment loss would be calculated as the excess of the asset's net book value over its estimated fair value.
Fair Value Measurements
Occidental has categorized its assets and liabilities that are measured at fair value in a three-level fair value hierarchy, based on the inputs to the valuation techniques: Level 1 – using quoted prices in active markets for the assets or liabilities; Level 2 – using observable inputs other than quoted prices for the assets or liabilities; and Level 3 – using unobservable inputs. Transfers between levels, if any, are recognized at the end of each reporting period.
Fair Values - Recurring
Occidental primarily applies the market approach for recurring fair value measurements, maximizes its use of observable inputs and minimizes its use of unobservable inputs. Occidental utilizes the mid-point between bid and ask prices for valuing the majority of its assets and liabilities measured and reported at fair value. In addition to using market data, Occidental makes assumptions in valuing its assets and liabilities, including assumptions about the risks inherent in the inputs to the valuation technique. For assets and liabilities carried at fair value, Occidental measures fair value using the following methods:
| Ø | Occidental values exchange-cleared commodity derivatives using closing prices provided by the exchange as of the balance sheet date. These derivatives are classified as Level 1. |
Ø Over-the-Counter (OTC) bilateral financial commodity contracts, foreign exchange contracts, options and physical commodity forward purchase and sale contracts are generally classified as Level 2 and are generally valued using quotations provided by brokers or industry-standard models that consider various inputs, including quoted forward prices for commodities, time value, volatility factors, credit risk and current market and contractual prices for the underlying instruments, as well as other relevant economic measures. Substantially all of these inputs
are observable in the marketplace throughout the full term of the instrument, and can be derived from observable data or are supported by observable prices at which transactions are executed in the marketplace.
| Ø | Occidental values commodity derivatives based on a market approach that considers various assumptions, including quoted forward commodity prices and market yield curves. The assumptions used include inputs that are generally unobservable in the marketplace or are observable but have been adjusted based upon various assumptions and the fair value is designated as Level 3 within the valuation hierarchy. |
Occidental generally uses an income approach to measure fair value when there is not a market-observable price for an identical or similar asset or liability. This approach utilizes management's judgments regarding expectations of projected cash flows, and discounts those cash flows using a risk-adjusted discount rate.
Environmental Liabilities and Expenditures
Environmental expenditures that relate to current operations are expensed or capitalized as appropriate. Occidental records environmental reserves and related charges and expenses for estimated remediation costs that relate to existing conditions from past operations when environmental remediation efforts are probable and the costs can be reasonably estimated. In determining the reserves and the range of reasonably possible additional losses, Occidental refers to currently available information, including relevant past experience, remedial objectives, available technologies, applicable laws and regulations and cost-sharing arrangements. Occidental bases environmental reserves on management’s estimate of the most likely cost to be incurred, using the most cost-effective technology reasonably expected to achieve the remedial objective. Occidental periodically reviews reserves and adjusts them as new information becomes available. Occidental records environmental reserves on a discounted basis when it deems the aggregate amount and timing of cash payments to be reliably determinable at the time the reserves are established. The reserve methodology with respect to discounting for a specific site is not modified once it is established. Presently none of the environmental reserves are recorded on a discounted basis. Occidental generally records reimbursements or recoveries of environmental remediation costs in income when received, or when receipt of recovery is highly probable.
Many factors could affect Occidental’s future remediation costs and result in adjustments to its environmental reserves and range of reasonably possible additional losses. The most significant are: (1) cost estimates for remedial activities may be inaccurate; (2) the length of time, type or amount of remediation necessary to achieve the remedial objective may change due to factors such as site conditions, the ability to identify and control contaminant sources or the discovery of additional contamination; (3) a regulatory agency may ultimately reject or modify Occidental’s proposed remedial plan; (4) improved or alternative remediation technologies may change remediation costs; (5) laws and regulations may
change remediation requirements or affect cost sharing or allocation of liability; and (6) changes in allocation or cost-sharing arrangements may occur.
Certain sites involve multiple parties with various cost-sharing arrangements, which fall into the following three categories: (1) environmental proceedings that result in a negotiated or prescribed allocation of remediation costs among Occidental and other alleged potentially responsible parties; (2) oil and gas ventures in which each participant pays its proportionate share of remediation costs reflecting its working interest; or (3) contractual arrangements, typically relating to purchases and sales of properties, in which the parties to the transaction agree to methods of allocating remediation costs. In these circumstances, Occidental evaluates the financial viability of other parties with whom it is alleged to be jointly liable, the degree of their commitment to participate and the consequences to Occidental of their failure to participate when estimating Occidental's ultimate share of liability. Occidental records reserves at its expected net cost of remedial activities and, based on these factors, believes that it will not be required to assume a share of liability of such other potentially responsible parties in an amount materially above amounts reserved.
In addition to the costs of investigations and cleanup measures, which often take in excess of 10 years at NPL sites, Occidental's reserves include management's estimates of the costs to operate and maintain remedial systems. If remedial systems are modified over time in response to significant changes in site-specific data, laws, regulations, technologies or engineering estimates, Occidental reviews and adjusts its reserves accordingly.
If Occidental were to adjust the environmental reserve balance based on the factors described above, the amount of the increase or decrease would be recognized in earnings. For example, if the reserve balance were reduced by 10 percent, Occidental would record a pre-tax gain of $87 million. If the reserve balance were increased by 10 percent, Occidental would record an additional remediation expense of $87 million.
Other Loss Contingencies
Occidental is involved, in the normal course of business, in lawsuits, claims and other legal proceedings and audits. Occidental accrues reserves for these matters when it is probable that a liability has been incurred and the liability can be reasonably estimated. In addition, Occidental discloses, in aggregate, its exposure to loss in excess of the amount recorded on the balance sheet for these matters if it is reasonably possible that an additional material loss may be incurred. Occidental reviews its loss contingencies on an ongoing basis.
Loss contingencies are based on judgments made by management with respect to the likely outcome of these matters and are adjusted as appropriate. Management’s judgments could change based on new information, changes in, or interpretations of, laws or regulations, changes in management’s plans or intentions, opinions regarding the outcome of legal proceedings, or other factors. See "Lawsuits, Claims and Contingencies" for additional information.
SIGNIFICANT ACCOUNTING AND DISCLOSURE CHANGES
See Note 3 in the Notes to Condensed Consolidated Financial Statements in Part II Item 8 of this Form 10-K.
SAFE HARBOR DISCUSSION REGARDING OUTLOOK AND OTHER FORWARD-LOOKING DATA
Portions of this report, including Items 1 and 2, "Business and Properties," Item 3, "Legal Proceedings," Item 7 "Management's Discussion and Analysis of Financial Condition and Results of Operations," and Item 7A, "Quantitative and Qualitative Disclosures About Market Risk," contain forward-looking statements within the meaning of Section 27A of the Securities Act of 1933 and Section 21E of the Securities Exchange Act of 1934 and involve risks and uncertainties that could materially affect expected results of operations, liquidity, cash flows and business prospects. Words such as "estimate," "project," "predict," "will," "would," "should," "could," "may," "might," "anticipate," "plan," "intend," "believe," "expect," "aim," "goal," "target," "objective," "likely" or similar expressions that convey the prospective nature of events or outcomes generally indicate forward-looking statements. You should not place undue reliance on these forward-looking statements, which speak only as of the date of this report. Unless legally required, Occidental does not undertake any obligation to update any forward-looking statements as a result of new information, future events or otherwise. Factors that may cause Occidental’s results of operations and financial position to differ from expectations include the factors discussed in Item 1A, "Risk Factors" and elsewhere.
Previous: Item 6. SELECTED FINANCIAL DATA · Next: Item 7A. QUANTITATIVE AND QUALITATIVE DISCLOSURES ABOUT MARKET RISK