 filings.tools
Item 5. Market for Registrant’s Common Equity, Related Stockholder Matters and Issuer Purchases of Equity Securities
5K characters. Original on sec.gov · Markdown
Item 5. Market for Registrant’s Common Equity, Related Stockholder Matters and Issuer Purchases of Equity Securities
Our common stock trades on the NASDAQ Global Select Market under the symbol “PAYX.” Dividends have historically been paid on our common stock in August, November, February, and May. The level and continuation of future dividends are dependent on our future earnings and cash flows, and are subject to the discretion of our Board of Directors (the “Board.”)
As of June 30, 2016, there were 12,548 holders of record of our common stock, which includes registered holders and participants in the Paychex, Inc. Dividend Reinvestment and Stock Purchase Plan. There were also 5,813 participants in the Paychex, Inc. Employee Stock Purchase Plan and 4,841 participants in the Paychex, Inc. Employee Stock Ownership Plan.
The high and low sale prices for our common stock as reported on the NASDAQ Global Select Market and dividends for fiscal 2016 and the fiscal year ended May 31, 2015 (“fiscal 2015”) are as follows:
| Fiscal 2016 | Fiscal 2015 | |||||||||||
| Cash | Cash | |||||||||||
| dividends | dividends | |||||||||||
| Sales prices | declared | Sales prices | declared | |||||||||
| High | Low | per share | High | Low | per share | |||||||
| First quarter | $49.79 | $41.59 | $0.42 | $42.66 | $40.10 | $0.38 | ||||||
| Second quarter | $54.54 | $43.19 | $0.42 | $48.20 | $41.59 | $0.38 | ||||||
| Third quarter | $54.78 | $45.76 | $0.42 | $50.19 | $44.52 | $0.38 | ||||||
| Fourth quarter | $54.58 | $51.06 | $0.42 | $51.72 | $48.00 | $0.38 |
The closing price of our common stock as of May 31, 2016, as reported on the NASDAQ Global Select Market, was $54.22 per share.
In May 2014, the Board approved a program to repurchase up to $350 million of our common stock with authorization expiring on May 31, 2017. Shares repurchased under this program during fiscal 2016 and fiscal 2015 were as follows:
| Fiscal 2016 | Fiscal 2015 | ||||||||||
| In millions | Total number of shares purchased | Total dollars | Total number of shares purchased | Total dollars | |||||||
| First quarter | 1.3 | $ | 62.9 | 0.9 | $ | 37.5 | |||||
| Second quarter | — | — | 0.3 | 15.1 | |||||||
| Third quarter | 0.9 | 45.0 | 0.4 | 17.9 | |||||||
| Fourth quarter | — | — | 2.3 | 111.9 | |||||||
| Fiscal year | 2.2 | $ | 107.9 | 3.9 | $ | 182.4 |
As of May 31, 2016, the approximate dollar value of shares that may yet be purchased under the program is $59.7 million. Shares of stock repurchased during fiscal 2016 and fiscal 2015 were purchased pursuant to the program and were retired.
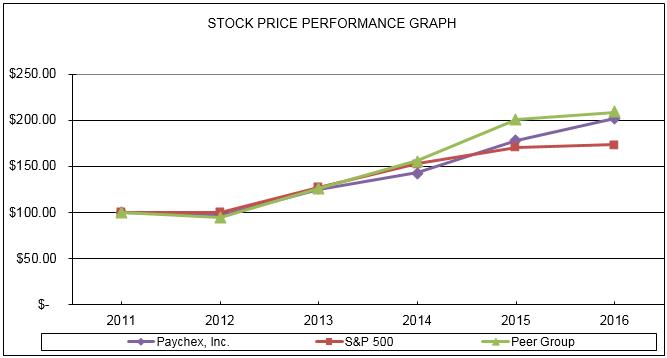
The following graph shows a five-year comparison of the total cumulative returns of investing $100 on May 31, 2011, in Paychex common stock, the S&P 500 Index, and a Peer Group Index. All comparisons of stock price performance shown assume reinvestment of dividends. We are a participant in the S&P 500 Index, a market group of companies with a larger than average market capitalization. Our Peer Group is a group of companies with comparable revenue and net income, who are in a comparable industry, or who are direct competitors of Paychex (as detailed below).
| May 31, | 2011 | 2012 | 2013 | 2014 | 2015 | 2016 | ||||||
| Paychex | $100.00 | $96.81 | $125.11 | $142.92 | $177.59 | $201.67 | ||||||
| S&P 500 | $100.00 | $99.59 | $126.75 | $152.67 | $170.69 | $173.25 | ||||||
| Peer Group | $100.00 | $94.61 | $125.45 | $155.83 | $200.87 | $208.71 |
There can be no assurance that our stock performance will continue into the future with the same or similar trends depicted in the graph above. We will neither make nor endorse any predictions as to future stock performance.
Our Peer Group for fiscal 2016 is comprised of the following companies:
| Automatic Data Processing, Inc. (direct competitor) | Broadridge Financial Solutions, Inc. | |
| Fiserv, Inc. | Robert Half International Inc. | |
| The Western Union Company | Intuit Inc. | |
| Total Systems Services, Inc. | Iron Mountain Incorporated | |
| Global Payments Inc. | Moody’s Corporation | |
| The Brink’s Company | H&R Block, Inc. | |
| DST System, Inc. | TD AMERITRADE Holding Corporation | |
| The Dun & Bradstreet Corporation |
Previous: Item 4. Mine Safety Disclosures · Next: Item 6. Selected Financial Data