 filings.tools
Item 5. MARKET FOR THE COMPANY’S COMMON EQUITY, RELATED STOCKHOLDER MATTERS AND ISSUER PURCHASES OF EQUITY SECURITIES
4K characters. Original on sec.gov · Markdown
Item 5. MARKET FOR THE COMPANY’S COMMON EQUITY, RELATED STOCKHOLDER MATTERS AND ISSUER PURCHASES OF EQUITY SECURITIES
The principal market for our common stock is the NYSE. Our common stock currently trades on the NYSE under the symbol “PFE”. As of February 15, 2024, there were 123,387 holders of record of our common stock.
The following summarizes purchases of our common stock during the fourth quarter of 2023(a):
| Period | Total Number of Shares Purchased(b) | Average Price Paid per Share(b) | Total Number of Shares Purchased as Part of Publicly Announced Plan | Approximate Value of Shares that May Yet Be Purchased Under the Plan(a) | |||||||||||||||||||
| October 2 through October 29, 2023 | 12,222 | $ | 32.93 | — | $ | 3,292,882,444 | |||||||||||||||||
| October 30 through November 30, 2023 | 25,825 | $ | 29.95 | — | $ | 3,292,882,444 | |||||||||||||||||
| December 1 through December 31, 2023 | 14,449 | $ | 28.58 | — | $ | 3,292,882,444 | |||||||||||||||||
| Total | 52,496 | $ | 30.26 | — |
(a)See Note 12.
(b)Represents (i) 49,685 shares of common stock surrendered to the Company to satisfy tax withholding obligations in connection with the vesting of awards under our long-term incentive programs and (ii) the open market purchase by the trustee of 2,811 shares of common stock in connection with the reinvestment of dividends paid on common stock held in trust for employees who deferred receipt of performance share awards.
PEER GROUP PERFORMANCE GRAPH
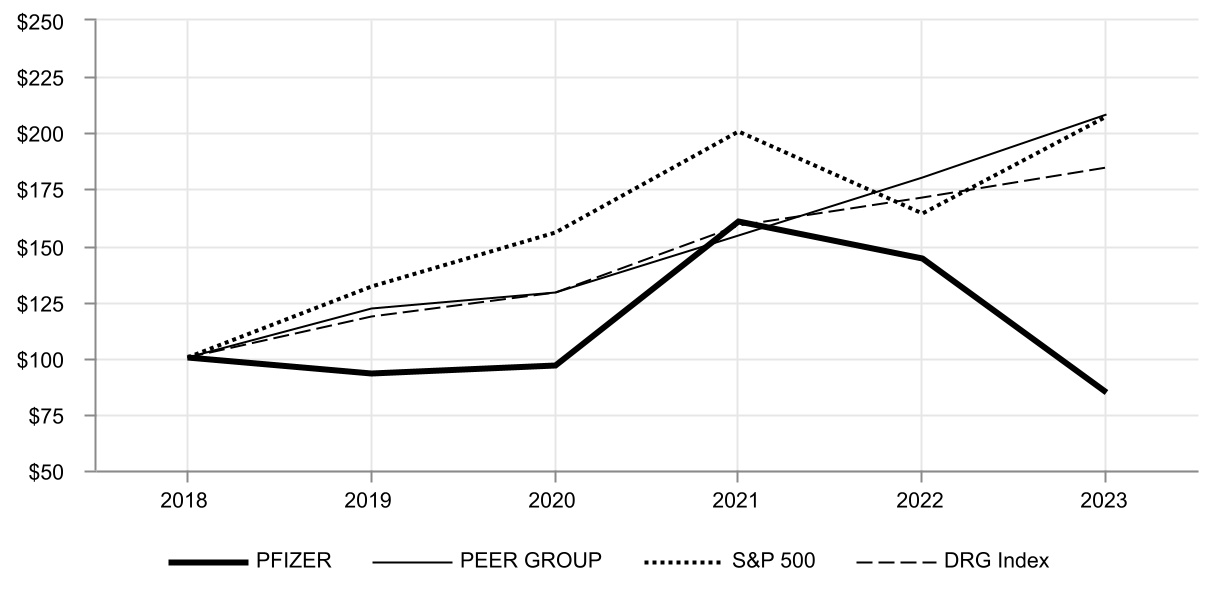
The following graph assumes a $100 investment on December 31, 2018, and reinvestment of all dividends, in each of the Company’s Common Stock, a composite peer group of the major U.S. and European-based pharmaceutical companies, which are: AbbVie Inc., Amgen Inc., AstraZeneca PLC, Bristol-Myers Squibb Company, Eli Lilly and Company, GSK plc, Johnson & Johnson, Merck & Co., Inc., Novartis AG, Novo Nordisk, Roche Holding AG and Sanofi SA, the S&P 500 Index and the NYSE Arca Pharmaceutical Index (DRG index).
Five Year Performance
| 2018 | 2019 | 2020 | 2021 | 2022 | 2023 | |||||||||||||||||||||||||||||||||
| PFIZER | $100.0 | $93.1 | $96.3 | $160.5 | $143.8 | $84.5 | ||||||||||||||||||||||||||||||||
| PEER GROUP | $100.0 | $122.0 | $128.7 | $154.4 | $179.9 | $207.8 | ||||||||||||||||||||||||||||||||
| S&P 500 | $100.0 | $131.5 | $155.6 | $200.3 | $164.0 | $207.0 | ||||||||||||||||||||||||||||||||
| DRG Index | $100.0 | $118.4 | $128.7 | $158.8 | $171.1 | $184.3 |
Previous: Item 3. LEGAL PROCEEDINGS · Next: Item 6. [RESERVED]