 filings.tools
PulteGroup 10-K 2016-12-31
Filed 2017-02-01. 21 sections, 359K characters. Original on sec.gov · Markdown · JSON
Cover and table of contents
10-K 1 a201610-k.htm 10-K
UNITED STATES
SECURITIES AND EXCHANGE COMMISSION
Washington, D.C. 20549
FORM 10-K
[X] ANNUAL REPORT PURSUANT TO SECTION 13 OR 15(d) OF THE
SECURITIES EXCHANGE ACT OF 1934
For the fiscal year ended December 31, 2016
OR
[ ] TRANSITION REPORT PURSUANT TO SECTION 13 OR 15(d) OF THE
SECURITIES EXCHANGE ACT OF 1934
Commission File Number 1-9804
PULTEGROUP, INC.
(Exact name of registrant as specified in its charter)
| MICHIGAN | 38-2766606 | |
| (State or other jurisdiction of incorporation or organization) | (I.R.S. Employer Identification No.) |
3350 Peachtree Road NE, Suite 150
Atlanta, Georgia 30326
(Address of principal executive offices) (Zip Code)
Registrant’s telephone number, including area code: (404) 978-6400
Securities registered pursuant to Section 12(b) of the Act:
| Title of each class | Name of each exchange on which registered | |
| Common Shares, par value $0.01 | New York Stock Exchange |
Securities registered pursuant to Section 12(g) of the Act:
NONE
Indicate by check mark if the registrant is a well-known seasoned issuer, as defined in Rule 405 of the Securities Act. YES [X] NO [ ]
Indicate by check mark if the registrant is not required to file reports pursuant to Section 13 or Section 15(d) of the Act. YES [ ] NO [X]
Indicate by check mark whether the registrant (1) has filed all reports required to be filed by Section 13 or 15(d) of the Securities Exchange Act of 1934 during the preceding 12 months (or for such shorter period that the registrant was required to file such reports), and (2) has been subject to such filing requirements for the past 90 days. YES [X] NO [ ]
Indicate by check mark whether the registrant has submitted electronically and posted on its corporate Web site, if any, every Interactive Data File required to be submitted and posted pursuant to Rule 405 of Regulation S-T (§ 232.405 of this chapter) during the preceding 12 months (or for such shorter period that the registrant was required to submit and post such files). Act. YES [X] NO [ ]
Indicate by check mark if disclosure of delinquent filers pursuant to Item 405 of Regulation S-K (§ 229.405 of this chapter) is not contained herein, and will not be contained, to the best of registrant’s knowledge, in definitive proxy or information statements incorporated by reference in Part III of this Form 10-K or any amendment to this Form 10-K. [X]
Indicate by check mark whether the registrant is a large accelerated filer, an accelerated filer, a non-accelerated filer, or a smaller reporting company. See the definitions of “large accelerated filer”, “accelerated filer”, and “smaller reporting company” in Rule 12b-2 of the Exchange Act. (Check one):
Large accelerated filer [X] Accelerated filer [ ] Non-accelerated filer [ ] Smaller reporting company [ ]
Indicate by check mark whether the registrant is a shell company (as defined in Rule 12b-2 of the Act). YES [ ] NO [X]
The aggregate market value of the registrant’s voting shares held by nonaffiliates of the registrant as of June 30, 2016, based on the closing sale price per share as reported by the New York Stock Exchange on such date, was $6,626,321,236.
As of January 26, 2017, the registrant had 317,833,859 shares of common shares outstanding.
Documents Incorporated by Reference
Applicable portions of the Proxy Statement for the 2017 Annual Meeting of Shareholders are incorporated by reference in Part III of this Form.
PULTEGROUP, INC.
TABLE OF CONTENTS
PART I
ITEM I. BUSINESS
PulteGroup, Inc.
PulteGroup, Inc. is a Michigan corporation organized in 1956. We are one of the largest homebuilders in the United States ("U.S."), and our common shares trade on the New York Stock Exchange under the ticker symbol “PHM”. Unless the context otherwise requires, the terms "PulteGroup", the "Company", "we", "us", and "our" used herein refer to PulteGroup, Inc. and its subsidiaries. While our subsidiaries engage primarily in the homebuilding business, we also have mortgage banking operations, conducted principally through Pulte Mortgage LLC (“Pulte Mortgage”), and title operations.
Homebuilding, our core business, includes the acquisition and development of land primarily for residential purposes within the U.S. and the construction of housing on such land. We offer a broad product line to meet the needs of homebuyers in our targeted markets. Through our brands, which include Centex, Pulte Homes, Del Webb, DiVosta Homes, and John Wieland Homes and Neighborhoods, we offer a wide variety of home designs, including single-family detached, townhouses, condominiums, and duplexes at different prices and with varying levels of options and amenities to our major customer groups: first-time, move-up, and active adult. Over our history, we have delivered nearly 680,000 homes.
As of December 31, 2016, we conducted our operations in 49 markets located throughout 25 states. For reporting purposes, our Homebuilding operations are aggregated into six reportable segments:
| Northeast: | Connecticut, Maryland, Massachusetts, New Jersey, New York, Pennsylvania, Virginia | |
| Southeast: | Georgia, North Carolina, South Carolina, Tennessee | |
| Florida: | Florida | |
| Midwest: | Illinois, Indiana, Kentucky, Michigan, Minnesota, Missouri, Ohio | |
| Texas: | Texas | |
| West: | Arizona, California, Nevada, New Mexico, Washington |
We also have a reportable segment for our financial services operations, which consist principally of mortgage banking and title operations. Our Financial Services segment operates generally in the same geographic markets as our Homebuilding segments.
Financial information for each of our reportable business segments is included in Note 4 to our Consolidated Financial Statements.
Available information
Our internet website address is www.pultegroupinc.com. Our annual reports on Form 10-K, quarterly reports on Form 10-Q, current reports on Form 8-K, and amendments to those reports filed or furnished pursuant to Section 13(a) or 15(d) of the Exchange Act are available free of charge through our website as soon as reasonably practicable after we electronically file them with or furnish them to the Securities and Exchange Commission. Our code of ethics for principal officers, our code of ethical business conduct, our corporate governance guidelines, and the charters of the Audit, Compensation and Management Development, Nominating and Governance, and Finance and Investment Committees of our Board of Directors are also posted on our website and are available in print, free of charge, upon request.
Homebuilding Operations
| Years Ended December 31, ($000’s omitted) | ||||||||||||||||||||
| 2016 | 2015 | 2014 | 2013 | 2012 | ||||||||||||||||
| Home sale revenues | $ | 7,451,315 | $ | 5,792,675 | $ | 5,662,171 | $ | 5,424,309 | $ | 4,552,412 | ||||||||||
| Home closings | 19,951 | 17,127 | 17,196 | 17,766 | 16,505 |
After several years of declining sales volume, new home sales in the U.S. increased in 2012 for the first time since 2005, beginning a multi-year recovery in demand. This trend continued in 2016 as new home sales in the U.S. rose 12% to approximately 563,000 homes, an approximate 84% increase from 2011, the bottom of the most recent housing downturn. Additionally, mortgage interest rates remain near historic lows and the overall inventory of homes available for sale, especially new homes, remains low. Although current industry volume remains low compared with historical levels, the improved environment and actions we have taken contributed to significant increases in our income before income taxes each year in the period 2013 - 2016. In the long term, we continue to believe that the national publicly-traded builders will have a competitive advantage over local builders through their ability to leverage economies of scale, access to more reliable and lower cost financing through the capital markets, ability to control and entitle large land positions, and greater geographic and product diversification. Among our national publicly-traded peer group, we believe that builders with broad geographic and product diversity and sustainable capital positions will benefit as market conditions continue to recover. In the short-term, we expect that overall market conditions will continue to improve but that improvements will occur unevenly across our markets. Our strategy to enhance shareholder value is centered around the following operational objectives:
| • | Effectively allocating the capital we invest in our business using a risk-based portfolio approach; |
| • | Maximizing our inventory turns while maintaining an adequate supply of house and land inventory; |
| • | Enhancing revenues by: establishing clear product offerings for each of our consumer groups based on systematic, consumer-driven input, optimizing our pricing through the use of options and lot premiums, and limiting our reliance on speculative home sales; |
| • | Optimizing our house costs through common house plan management, value-engineering our house plans, and working with suppliers to reduce costs; and |
| • | Maintaining an efficient overhead structure. |
Our Homebuilding operations are geographically diverse within the U.S. As of December 31, 2016, we had 726 active communities spanning 49 markets across 25 states. Sales prices of unit closings during 2016 ranged from approximately $100,000 to over $1,000,000, with 80% falling within the range of $150,000 to $500,000. The average unit selling price in 2016 was $373,000, compared with $338,000 in 2015, $329,000 in 2014, $305,000 in 2013, and $276,000 in 2012. The increase in average selling price in recent years resulted from a number of factors, including improved market conditions and a shift in our sales mix toward move-up homebuyers. Our average unit selling price in 2016 was also impacted by our acquisition in January 2016 of substantially all of the assets of JW Homes ("Wieland), which are geared toward move-up buyers.
Sales of single-family detached homes, as a percentage of total unit sales, were 87% in 2016, compared with 86% in 2015, 86% in 2014, 85% in 2013, and 81% in 2012. The increase in the percentage of single-family detached homes can be attributed to a shift in our business toward the move-up buyer, who tends to prefer detached homes.
Ending backlog, which represents orders for homes that have not yet closed, was $2.9 billion (7,422 units) at December 31, 2016 and $2.5 billion (6,731 units) at December 31, 2015. For orders in backlog, we have received a signed customer contract and customer deposit, which is refundable in certain instances. Of the orders in backlog at December 31, 2016, substantially all are scheduled to be closed during 2017, though all orders are subject to potential cancellation by or final negotiations with the customer. In the event of cancellation, the majority of our sales contracts stipulate that we have the right to retain the customer’s deposit, though we may choose to refund the deposit in certain instances.
Land acquisition and development
We acquire land primarily for the construction of homes for sale to homebuyers. We select locations for development of homebuilding communities after completing a feasibility study, which includes, among other things, soil tests, independent environmental studies and other engineering work, an evaluation of necessary zoning and other governmental entitlements, and extensive market research that enables us to match the location with our product offering to meet the needs of consumers. We consider factors such as proximity to developed areas, population and job growth patterns, and, if applicable, estimated development costs. We frequently manage a portion of the risk of controlling our land positions through the use of land option contracts, which enable us to defer acquiring portions of properties owned by land sellers until we have determined whether and when to exercise our option. Our use of land option agreements reduces the financial risk associated with long-term land holdings. We typically acquire land with the intent to complete sales of housing units within 24 to 36 months from the date of opening a community, except in the case of certain Del Webb active adult developments and other large master-planned projects for which the completion of community build-out requires a longer time period. While our overall supply of controlled land is in excess of our short-term needs in many of our markets, some of our controlled land consists of long-term positions that will not be converted to home sales in the near term. Accordingly, we remain active in our pursuit of new land investment. We may also periodically sell select parcels of land to third parties for commercial or other development if we determine that they do not fit into our strategic operating plans.
Land is generally purchased after it is zoned and developed, or is ready for development for our intended use. In the normal course of business, we periodically sell land not required by our homebuilding operations. Where we develop land, we engage directly in many phases of the development process, including: land and site planning; obtaining environmental and other regulatory approvals; and constructing roads, sewers, water and drainage facilities, and community amenities, such as parks, pools, and clubhouses. We use our staff and the services of independent engineers and consultants for land development activities. Land development work is performed primarily by independent contractors and, when needed, local government authorities who construct sewer and water systems in some areas. At December 31, 2016, we controlled 143,258 lots, of which 99,279 were owned and 43,979 were under land option agreements.
Sales and marketing
We are dedicated to improving the quality and value of our homes through innovative architectural and community designs. Analyzing various qualitative and quantitative data obtained through extensive market research, we stratify our potential customers into well-defined buyer groups. Such stratification provides a method for understanding the business opportunities and risks across the full spectrum of consumer groups in each market. Once the needs of potential buyers are understood, we link our home design and community development efforts to the specific lifestyle of each consumer group. Through our understanding of each consumer group, we are able to provide homes that better meet the needs and wants of each buyer.
| First-Time | Move-Up | Active Adult | |
| Portion of home closings: | |||
| 2016 | 29% | 43% | 28% |
| 2012 | 41% | 32% | 27% |
Our homes targeted to first-time buyers tend to be smaller with product offerings geared toward lower average selling prices or higher density. Move-up buyers tend to place more of a premium on location and amenities. These communities typically offer larger homes at higher price points. Through our Del Webb brand, we are better able to address the needs of active adults, to whom we offer both destination communities and “in place” communities, for buyers who prefer to remain in their current geographic area. Many of these communities are highly amenitized, offering a variety of features, including golf courses, recreational centers, and educational classes, to the age fifty-five and over buyer to maintain an active lifestyle. In order to make the cost of these highly amenitized communities affordable to the individual homeowner, Del Webb communities tend to be larger than first-time or move-up buyer communities. As illustrated in the above table, our sales mix has shifted in recent years toward the move-up buyer where demand has been stronger. This shift in U.S. housing demand has occurred primarily due to financial challenges facing the first-time buyer, including a recovering U.S. economy, the overhang of consumer debt, especially student loans related to higher education, and a more restrictive mortgage lending environment.
We market our homes to prospective buyers through internet listings and link placements, mobile applications, media advertising, illustrated brochures, and other advertising displays. We have made significant enhancements in our tools and business practices to adapt our selling efforts to today's tech-enabled customers. In addition, our websites (www.centex.com, www.pulte.com, www.delwebb.com, www.divosta.com, and www.jwhomes.com) provide tools to help users find a home that meets their needs, investigate financing alternatives, communicate moving plans, maintain a home, learn more about us, and communicate directly with us. There were approximately 10.4 million unique visits to our websites during 2016, compared with approximately 9.6 million in 2015.
To meet the demands of our various customers, we have established design expertise for a wide array of product lines. We believe that we are an innovator in consumer-inspired home design, and we view our design capabilities as an integral aspect of our marketing strategy. Our in-house architectural services teams and management, supplemented by outside consultants, follow a 12-step product development process to introduce new features and technologies based on customer-validated data. Following this disciplined process results in distinctive design features, both in exterior facades and interior options and features. We typically offer a variety of potential options and upgrades, such as different flooring, countertop, and appliance choices, and design our base house and option packages to meet the needs of our customers as defined through rigorous market research. Energy efficiency represents an important source of value for new homes compared with existing homes and represents a key area of focus for our home designs, including high efficiency heating, ventilation, and air conditioning systems and insulation, low-emissivity windows, solar power in certain geographies, and other energy-efficient features.
Typically, our sales teams, in some cases together with outside sales brokers, are responsible for guiding the customer through the sales process. We are committed to industry-leading customer service through a variety of quality initiatives, including our customer care program, which seeks to ensure that homeowners are comfortable at every stage of the building process. Fully furnished and landscaped model homes physically located in our communities, which leverage the expertise of our interior designers, are generally used to showcase our homes and their distinctive design features.
Construction
The construction of our homes is conducted under the supervision of our on-site construction field managers. Substantially all of our construction work is performed by independent subcontractors under contracts that generally cover both labor and materials on a fixed-price basis. Using a selective process, we have teamed up with what we believe are premier subcontractors and suppliers to deliver all aspects of the house construction process.
Continuous improvement in our house construction process is a key area of focus. We seek to maintain efficient construction operations by using standard materials and components from a variety of sources and by utilizing standard construction practices. We are improving our product offerings and production processes through the following programs:
| • | Common management of house plans in order to focus on building those house designs that customers value the most and that can be built at the highest quality and at an efficient cost; |
| • | Value engineering our house plans to optimize house designs in terms of material content and ease of construction while still providing a clear value to the customer (value engineering eliminates items that add cost but that have little to no value to the customer); |
| • | Improving our usage of Pulte Construction Standards, a proprietary system of internally required construction practices, through development of new or revised standards, training of our field leadership and construction personnel, communication with our suppliers, and auditing our compliance; and |
| • | Working with our suppliers to establish the "should cost", a data driven, collaborative effort to reduce construction costs to what the associated construction activities or materials “should cost” in the market. |
The ability to consistently source qualified labor at reasonable prices has become more challenging as labor supply growth has not kept pace with construction demand. Additionally, the cost of certain building materials, especially lumber, steel, concrete, copper, and petroleum-based materials, is influenced by changes in global commodity prices. To protect against changes in construction costs, the contracting and purchasing of building supplies and materials generally is negotiated at or near the time when related sales contracts are signed with customers. In addition, we leverage our size by actively negotiating for certain materials on a national or regional basis to minimize costs. We are also working to establish a more integrated system that can effectively link suppliers, contractors, and the production schedule. However, we cannot determine the extent to which necessary building materials and labor will be available at reasonable prices in the future.
Competition
The housing industry in the U.S. is fragmented and highly competitive. While we are one of the largest homebuilders in the U.S., our national market share represented only approximately 4% of U.S. new home sales in 2016. In each of our local markets, there are numerous national, regional, and local homebuilders with whom we compete. Additionally, new home sales have traditionally represented less than 15% of overall U.S. home sales (new and existing homes). Therefore, we also compete with sales of existing house inventory and any provider of for sale or rental housing units, including apartment operators. We compete primarily on the basis of location, price, quality, reputation, design, community amenities, and our customers' overall sales and homeownership experiences.
Seasonality
Although significant changes in market conditions have impacted our seasonal patterns in the past and could do so again, we historically experience variability in our quarterly results from operations due to the seasonal nature of the homebuilding industry. We generally experience increases in revenues and cash flow from operations during the fourth quarter based on the timing of home closings. This seasonal activity increases our working capital requirements in our third and fourth quarters to support our home production and loan origination volumes. As a result of the seasonality of our operations, our quarterly results of operations are not necessarily indicative of the results that may be expected for the full year.
Regulation and environmental matters
Our operations are subject to extensive regulations imposed and enforced by various federal, state, and local governing authorities. These regulations are complex and include building codes, land zoning and other entitlement restrictions, health and safety regulations, labor practices, marketing and sales practices, environmental regulations, rules and regulations relating to mortgage financing and title operations, and various other laws, rules, and regulations. Collectively, these regulations have a significant impact on the site selection and development of our communities, our house design and construction techniques, our relationships with customers, employees, and suppliers / subcontractors, and many other aspects of our business. The applicable governing authorities frequently have broad discretion in administering these regulations, including inspections of our homes prior to closing with the customer in the majority of municipalities in which we operate.
Financial Services Operations
We conduct our financial services business, which includes mortgage and title operations, through Pulte Mortgage and other subsidiaries. Pulte Mortgage arranges financing through the origination of mortgage loans primarily for the benefit of our homebuyers. We are a lender approved by the Federal Housing Administration ("FHA") and Department of Veterans Affairs ("VA") and are a seller/servicer approved by Government National Mortgage Association ("Ginnie Mae"), Federal National Mortgage Association ("Fannie Mae"), Federal Home Loan Mortgage Corporation ("Freddie Mac"), and other investors. In our conventional mortgage lending activities, we follow underwriting guidelines established by Fannie Mae, Freddie Mac, and private investors. We believe that our customers’ use of our in-house mortgage and title operations provides us with a competitive advantage by enabling more control over the quality of the overall home buying process for our customers, while also helping us align the timing of the house construction process with our customers’ financing needs.
Operating as a captive business model targeted to supporting our Homebuilding operations, the business levels of our Financial Services operations are highly correlated to Homebuilding. During 2016, 2015, and 2014, we originated mortgage loans for 65%, 65%, and 61%, respectively, of the homes we sold. Such originations represented substantially all of our total originations in each of those years. Our capture rate, which we define as loan originations from our homebuilding business as a percentage of total loan opportunities from our homebuilding business excluding cash settlements, was 81.2% in 2016, 82.9% in 2015, and 80.2% in 2014.
In originating mortgage loans, we initially use our own funds, including funds available pursuant to credit agreements with third parties, and subsequently sell such mortgage loans to third party investors in the secondary market. Substantially all of the loans we originate are sold in the secondary market within a short period of time after origination, generally within 30 days. We also sell the servicing rights for the loans we originate through fixed price servicing sales contracts to reduce the risks and costs inherent in servicing loans. This strategy results in owning the loans and related servicing rights for only a short period of time.
The mortgage industry in the U.S. is highly competitive. We compete with other mortgage companies and financial institutions to provide attractive mortgage financing to our homebuyers. We utilize a centralized fulfillment center for our mortgage operations that performs underwriting, processing, and closing functions. We believe centralizing both the fulfillment and origination of our loans improves the speed, efficiency, and quality of our mortgage operations, improving our profitability and allowing us to focus on providing attractive mortgage financing opportunities for our customers.
In originating and servicing mortgage loans, we are subject to the rules and regulations of the government-sponsored investors and other investors that purchase the loans we originate, as well as to those of other government agencies that have oversight of the government-sponsored investors or consumer lending rules in the U.S. In addition to being affected by changes in these programs, our mortgage banking business is also affected by many of the same factors that impact our homebuilding business.
Our mortgage operations may be responsible for losses associated with mortgage loans originated and sold to investors in the event of errors or omissions relating to representations and warranties made by us that the loans met certain requirements, including representations as to underwriting standards, the existence of primary mortgage insurance, and the validity of certain borrower representations in connection with the loan. If a loan is determined to be faulty, we either repurchase the loan from the investors or reimburse the investors' losses (a "make-whole" payment).
Our subsidiary title insurance companies serve as title insurance agents and underwriters in select markets by providing title insurance policies and examination and closing services to buyers of homes we sell. Historically, we have not experienced significant claims related to our title operations.
Financial Information About Geographic Areas
Substantially all of our operations are located within the U.S. We have some non-operating foreign subsidiaries and affiliates, which are insignificant to our consolidated financial results.
Organization/Employees
All subsidiaries and operating units operate independently with respect to daily operations. Homebuilding real estate purchases and other significant homebuilding, mortgage banking, financing activities, and similar operating decisions must be approved by the business unit’s management and/or corporate senior management.
At December 31, 2016, we employed 4,623 people, of which 829 people were employed in our Financial Services operations. Except for a small group of employees in our St. Louis homebuilding division, our employees are not represented by any union. Contracted work, however, may be performed by union contractors. Our local and corporate management personnel are paid incentive compensation based on a combination of individual performance and the performance of the applicable business unit or the Company. Each business unit is given a level of autonomy regarding employment of personnel, subject to adherence to our established policies and procedures, and our senior corporate management acts in an advisory capacity in the employment of subsidiary officers. We consider our employee and contractor relations to be satisfactory.
Item 1A. RISK FACTORS
Discussion of our business and operations included in this annual report on Form 10-K should be read together with the risk factors set forth below. They describe various risks and uncertainties to which we are, or may become, subject. These risks and uncertainties, together with other factors described elsewhere in this report, have the potential to affect our business, financial condition, results of operations, cash flows, strategies, or prospects in a material and adverse manner.
The homebuilding industry is cyclical and a deterioration in industry conditions or downward changes in general economic or other business conditions could adversely affect our business or our financial results.
The residential homebuilding industry is sensitive to changes in economic conditions and other factors, such as the level of employment, consumer confidence, consumer income, availability of financing, and interest rate levels. Adverse changes in any of these conditions generally, or in the markets where we operate, could decrease demand and pricing for new homes in these areas or result in customer cancellations of pending contracts, which could adversely affect the number of home deliveries we make or reduce the prices we can charge for homes, either of which could result in a decrease in our revenues and earnings that could adversely affect our financial condition.
Beginning in 2006 and continuing through 2011, the U.S. housing market was unfavorably impacted by severe weakness in new home sales attributable to, among other factors, weak consumer confidence, tightened mortgage standards, significant foreclosure activity, a more challenging appraisal environment, higher than normal unemployment levels, and significant uncertainty in the global economy. During this period, we incurred significant losses, including impairments of our land inventory and certain other assets. Since 2011, overall industry new home sales have increased, and we returned to profitability beginning in 2012. However, the overall demand for new homes remains below historical levels. Accordingly, we can provide no assurances that the adjustments we have made in our operating strategy will be successful if the current housing market was to deteriorate significantly.
If the market value of our land and homes drops significantly, our profits could decrease.
The market value of land, building lots, and housing inventories can fluctuate significantly as a result of changing market conditions, and the measures we employ to manage inventory risk may not be adequate to insulate our operations from a severe drop in inventory values. We acquire land for expansion into new markets and for replacement of land inventory and expansion within our current markets. If housing demand decreases below what we anticipated when we acquired our inventory, we may not be able to make profits similar to what we have made in the past, we may experience less than anticipated profits, and/or we may not be able to recover our costs when we sell and build homes. When market conditions are such that land values are not appreciating, option arrangements previously entered into may become less desirable, at which time we may elect to forego deposits and pre-acquisition costs and terminate the agreement. In the face of adverse market conditions, we may have substantial inventory carrying costs, we may have to write down our inventory to its fair value, and/or we may have to sell land or homes at a loss.
Supply shortages and other risks related to the demand for skilled labor and building materials could increase costs and delay deliveries.
The homebuilding industry is highly competitive for skilled labor and materials. Labor shortages in certain of our markets have become more acute in recent years as the supply chain adjusts to uneven industry growth. Additionally, the cost of certain building materials, especially lumber, steel, concrete, copper, and petroleum-based materials, is influenced by changes in local and global commodity prices. Increased costs or shortages of skilled labor and/or materials could cause increases in construction costs and / or construction delays. We may not be able to pass on increases in construction costs to customers and generally are unable to pass on any such increases to customers who have already entered into sales contracts as those sales contracts generally fix the price of the home at the time the contract is signed, which may be well in advance of the construction of the home. Sustained increases in construction costs may, over time, erode our margins, and pricing competition may restrict our ability to pass on any such additional costs, thereby decreasing our margins.
Our success depends on our ability to acquire land suitable for residential homebuilding at reasonable prices, in accordance with our land investment criteria.
The homebuilding industry is highly competitive for suitable land. The availability of finished and partially finished developed lots and undeveloped land for purchase that meet our internal criteria depends on a number of factors outside our control, including land availability in general, competition with other homebuilders and land buyers for desirable property, inflation in land prices, zoning, allowable housing density, and other regulatory requirements. Should suitable lots or land become less available, the number of homes we may be able to build and sell could be reduced, and the cost of land could be increased, perhaps substantially, which could adversely impact our results of operations.
Our long-term ability to build homes depends on our acquiring land suitable for residential building at reasonable prices in locations where we want to build. In the past, we experienced significant competition for suitable land as a result of land constraints in many of our markets. As competition for suitable land increases, and as available land is developed, the cost of acquiring suitable remaining land could rise, and the availability of suitable land at acceptable prices may decline. Any land shortages or any decrease in the supply of suitable land at reasonable prices could limit our ability to develop new communities or result in increased land costs. We may not be able to pass through to our customers any increased land costs, which could adversely impact our revenues, earnings, and margins.
We are subject to claims related to mortgage loans we sold in the secondary mortgage market that may be significant.
Our mortgage operations may be responsible for losses associated with mortgage loans originated and sold to investors in the event of errors or omissions relating to certain representations and warranties made by us that the loans met certain requirements, including representations as to underwriting standards, the type of collateral, the existence of primary mortgage insurance, and the validity of certain borrower representations in connection with the loan. To date, the significant majority of these losses relate to loans originated in 2006 and 2007, during which period inherently riskier loan products became more common in the origination market. We may also be required to indemnify underwriters that purchased and securitized loans originated by a former subsidiary of Centex Corporation ("Centex"), which we acquired in 2009, for losses incurred by investors in those securitized loans based on similar breaches of representations and warranties.
The resolution of claims related to alleged breaches of these representations and warranties and repurchase claims could have a material adverse effect on our financial condition, cash flows and results of operations. Given the ongoing volatility in the mortgage industry, changes in values of underlying collateral over time, and other uncertainties regarding the ultimate resolution of these claims, actual costs could differ from our current estimates. Accordingly, there can be no assurance that such reserves will not need to be increased in the future.
Future increases in interest rates, reductions in mortgage availability, or other increases in the effective costs of owning a home could prevent potential customers from buying our homes and adversely affect our business and financial results.
A large majority of our customers finance their home purchases through mortgage loans, many through our mortgage bank. While mortgage interest rates have increased moderately, they have been near historical lows for several years, which has made new homes more affordable. Increases in interest rates or decreases in the availability of mortgage financing could adversely affect the market for new homes. Potential homebuyers may be less willing or able to pay the increased monthly costs or to obtain mortgage financing. Lenders may increase the qualifications needed for mortgages or adjust their terms to address any increased credit risk. Even if potential customers do not need financing, changes in interest rates and mortgage availability could make it harder for them to sell their current homes to potential buyers who need financing. These factors could adversely affect the sales or pricing of our homes and could also reduce the volume or margins in our financial services business. Our financial services business could also be impacted to the extent we are unable to match interest rates and amounts on loans we have committed to originate through the various hedging strategies we employ. These developments have had, and may continue to have, a material adverse effect on the overall demand for new housing and thereby on the results of operations for our homebuilding business.
The liquidity provided by Fannie Mae and Freddie Mac to the mortgage industry is also critical to the housing market. The impact of the federal government’s conservatorship of Fannie Mae and Freddie Mac on the short-term and long-term demand for new housing remains unclear. Any limitations or restrictions on the availability of financing by these agencies could adversely affect interest rates, mortgage financing, and our sales of new homes and mortgage loans. Additionally, the availability of FHA and VA mortgage financing is an important factor in marketing some of our homes.
Mortgage interest expense and real estate taxes represent significant costs of homeownership, both of which are generally deductible for an individual’s federal and, in some cases, state income taxes. Any changes to income tax laws by the federal government or a state government to eliminate or substantially reduce these income tax deductions, as has been considered from time to time, would increase the after-tax cost of owning a home. Increases in real estate taxes by local governmental authorities also increase the cost of homeownership. Any such increases to the cost of homeownership could adversely impact the demand for and sales prices of new homes.
Adverse capital and credit market conditions may significantly affect our access to capital and cost of capital.
The capital and credit markets can experience significant volatility. We may need credit-related liquidity for the future development of our business and other capital needs. Without sufficient liquidity, we may not be able to purchase additional land or develop land, which could adversely affect our financial results. At December 31, 2016, we had cash, cash equivalents, and restricted cash of $723.2 million as well as $530.9 million available under our revolving credit facility, net of outstanding letters of credit. However, our internal sources of liquidity and revolving credit facility may prove to be insufficient, and in such case, we may not be able to successfully obtain additional financing on terms acceptable to us, or at all.
Another source of liquidity includes our ability to use letters of credit and surety bonds pursuant to certain performance-related obligations and as security for certain land option agreements and under various insurance programs. The majority of these letters of credit and surety bonds are in support of our land development and construction obligations to various municipalities, other government agencies, and utility companies related to the construction of roads, sewers, and other infrastructure. At December 31, 2016, we had outstanding letters of credit and surety bonds totaling $219.1 million and $1.1 billion, respectively. These letters of credit are issued via our unsecured revolving credit facility, which contains certain financial covenants and other limitations. If we are unable to obtain letters of credit or surety bonds when required, or the conditions imposed by issuers increase significantly, our financial condition and results of operations could be adversely affected.
Competition for homebuyers could reduce our deliveries or decrease our profitability.
The U.S. housing industry is highly competitive. We compete primarily on the basis of location, price, quality, reputation, design, community amenities, and our customers' overall sales and homeownership experiences. We compete in each of our markets with numerous national, regional, and local homebuilders. This competition with other homebuilders could reduce the number of homes we deliver or cause us to accept reduced margins in order to maintain sales volume.
We also compete with resales of existing or foreclosed homes, housing speculators, and available rental housing. Increased competitive conditions in the residential resale or rental market in the regions where we operate could decrease demand for new homes or unfavorably impact pricing for new homes.
Our income tax provision and tax reserves may be insufficient if a taxing authority is successful in asserting positions that are contrary to our interpretations and related reserves, if any.
Significant judgment is required in determining our provision for income taxes and our reserves for federal, state, and local taxes. In the ordinary course of business, there may be matters for which the ultimate outcome is uncertain. Our evaluation of our tax matters is based on a number of factors, including changes in facts or circumstances, changes in tax law, correspondence with tax authorities during the course of audits, and effective settlement of audit issues. Although we believe our approach to determining the tax treatment for such items is appropriate, no assurance can be given that the final tax authority review will not be materially different than that which is reflected in our income tax provision and related tax reserves. Such differences could have a material adverse effect on our income tax provision in the period in which such determination is made and, consequently, on our financial position, cash flows, or net income.
We are periodically audited by various federal, state, and local authorities regarding tax matters. Our current audits are in various stages of completion; however, no outcome for a particular audit can be determined with certainty prior to the conclusion of the audit, appeal, and, in some cases, litigation process. As each audit is concluded, adjustments, if any, are recorded in our financial statements in the period determined. To provide for potential tax exposures, we consider a variety of factors, including changes in facts or circumstances, changes in law, correspondence with taxing authorities, and effective settlement of audit issues. If these reserves are insufficient upon completion of an audit, there could be an adverse impact on our financial position, cash flows, and results of operations.
We may not realize our deferred tax assets.
As of December 31, 2016, we had deferred tax assets, net of deferred tax liabilities, of $1.1 billion, against which we provided a valuation allowance of $64.9 million. The ultimate realization of our deferred tax assets is dependent upon generating future taxable income. While we have recorded valuation allowances against certain of our deferred tax assets, the valuation allowances are subject to change as facts and circumstances change.
Our ability to utilize net operating losses (“NOLs”), built-in losses (“BILs”), and tax credit carryforwards to offset our future taxable income or income tax would be limited if we were to undergo an “ownership change” within the meaning of Section 382 of the Internal Revenue Code (the “IRC”). In general, an “ownership change” occurs whenever the percentage of the stock of a corporation owned by “5-percent shareholders” (within the meaning of Section 382 of the IRC) increases by more than 50 percentage points over the lowest percentage of the stock of such corporation owned by such “5-percent shareholders” at any time over the testing period.
An ownership change under Section 382 of the IRC would establish an annual limitation to the amount of NOLs, BILs, and tax credit carryforwards we could utilize to offset our taxable income or income tax in any single year. The application of these limitations might prevent full utilization of the deferred tax assets attributable to our NOLs, BILs, and tax credit carryforwards. To preserve our ability to utilize NOLs, BILs, and other tax benefits in the future without a Section 382 limitation, we adopted a shareholder rights plan, which is triggered upon certain transfers of our securities, and amended our by-laws to prohibit certain transfers of our securities. Our shareholder rights plan, as amended, expires June 1, 2019, unless our board of directors and shareholders approve an amendment to extend the term prior thereto. Notwithstanding the foregoing measures, there can be no assurance that we will not undergo an ownership change within the meaning of Section 382.
Our ability to use certain of Centex's federal losses and credits is limited under Section 382 of the IRC. We do not believe that the Section 382 limitations will prevent us from utilizing these Centex losses and credits. We do believe that full utilization of certain state NOL carryforwards will be limited due to Section 382.
The value of our deferred tax assets is also dependent upon the tax rates expected to be in effect at the time taxable income is expected to be generated. A decrease in enacted corporate tax rates in our major jurisdictions, especially the U.S. federal corporate tax rate, would decrease the value of our deferred tax assets, which could be material.
We have significant intangible assets. If these assets become impaired, then our profits and shareholders’ equity may be reduced.
We have significant intangible assets related to business combinations. We evaluate the recoverability of intangible assets whenever facts and circumstances indicate the carrying amount may not be recoverable. If the carrying value of intangible assets is deemed impaired, the carrying value is written down to fair value. This would result in a charge to our earnings. If management’s expectations of future results and cash flows decrease significantly, impairments of the remaining intangible assets may occur.
Government regulations could increase the cost and limit the availability of our development and homebuilding projects or affect our related financial services operations and adversely affect our business or financial results.
Our operations are subject to building, environmental, and other regulations imposed and enforced by various federal, state, and local governing authorities. New housing developments may also be subject to various assessments for schools, parks, streets, and other public improvements. These can cause an increase in the effective cost of our homes.
We also are subject to a variety of local, state, and federal laws and regulations concerning protection of health, safety, and the environment. The impact of environmental laws varies depending upon the prior uses of the building site or adjoining properties and may be greater in areas with less supply where undeveloped land or desirable alternatives are less available. These matters may result in delays, may cause us to incur substantial compliance, remediation and other costs, and can prohibit or severely restrict development and homebuilding activity in environmentally sensitive regions or areas. More stringent requirements could be imposed in the future on homebuilders and developers, thereby increasing the cost of compliance.
Our financial services operations are also subject to numerous federal, state, and local laws and regulations. These include eligibility requirements for participation in federal loan programs and compliance with consumer lending and similar requirements such as disclosure requirements, prohibitions against discrimination, and real estate settlement procedures. They also subject our operations to examination by applicable agencies, pursuant to which those agencies may limit our ability to
provide mortgage financing or title services to potential purchasers of our homes. For our homes to qualify for FHA or VA mortgages, we must satisfy valuation standards and site, material, and construction requirements of those agencies.
Homebuilding is subject to warranty and other claims in the ordinary course of business that can be significant.
As a homebuilder, we are subject to home warranty, construction defect, and other claims arising in the ordinary course of business. We record warranty and other reserves for the homes we sell based on historical experience in our markets and our judgment of the qualitative risks associated with the types of homes built. We have, and require our subcontractors to have, general liability, property, errors and omissions, workers compensation, and other business insurance. These insurance policies protect us against a portion of our risk of loss from claims, subject to certain self-insured per occurrence and aggregate retentions, deductibles, and available policy limits. In certain instances, we may offer our subcontractors the opportunity to purchase insurance through one of our captive insurance subsidiaries or participate in a project-specific insurance program provided by us. Policies issued by our captive insurance subsidiaries represent self-insurance of these risks by us. We reserve for costs to cover our self-insured and deductible amounts under these policies and for any costs of claims and lawsuits based on an analysis of our historical claims, which includes an estimate of claims incurred but not yet reported. Because of the uncertainties inherent in these matters, we cannot provide assurance that our insurance coverage, our subcontractor arrangements, and our reserves will be adequate to address all our warranty and construction defect claims in the future. Contractual indemnities can be difficult to enforce, we may be responsible for applicable self-insured retentions, and some types of claims may not be covered by insurance or may exceed applicable coverage limits. Additionally, the coverage offered by and the availability of general liability insurance for construction defects are currently costly and limited. We have responded to increases in insurance costs and coverage limitations by increasing our self-insured retentions and claim reserves. There can be no assurance that coverage will not be further restricted or become more costly. Additionally, we are exposed to counterparty default risk related to our subcontractors, our insurance carriers, and our subcontractors’ insurance carriers.
Natural disasters and severe weather conditions could delay deliveries, increase costs, and decrease demand for new homes in affected areas.
Our homebuilding operations are located in many areas that are subject to natural disasters and severe weather. The occurrence of natural disasters or severe weather conditions can delay new home deliveries, increase costs by damaging inventories, reduce the availability of materials, and negatively impact the demand for new homes in affected areas. Furthermore, if our insurance does not fully cover business interruptions or losses resulting from these events, our earnings, liquidity, or capital resources could be adversely affected.
Inflation may result in increased costs that we may not be able to recoup.
Inflation can have a long-term impact on us because increasing costs of land, materials, and labor may require us to increase the sales prices of homes in order to maintain satisfactory margins. However, we may not be able to raise home prices sufficiently to keep up with the rate of inflation and our margins could decrease. In addition, inflation is often accompanied by higher interest rates, which could have a negative impact on housing demand.
Information technology failures or data security breaches could harm our business.
We use information technology and other computer resources to carry out important operational activities and to maintain our business records. Our computer systems, including our back-up systems, are subject to damage or interruption from power outages, computer and telecommunications failures, computer viruses, security breaches (through cyberattacks from computer hackers and sophisticated organizations), catastrophic events such as fires, tornadoes and hurricanes, and usage errors by our associates. If our computer systems and our back-up systems are damaged, breached, or cease to function properly, we could suffer interruptions in our operations or unintentionally allow misappropriation of proprietary or confidential information (including information about our homebuyers and business partners), which could require us to incur significant costs to remediate or otherwise resolve these issues.
Item 1B. UNRESOLVED STAFF COMMENTS
None.
Item 2. PROPERTIES
Our homebuilding and corporate headquarters are located in leased office facilities at 3350 Peachtree Road NE, Suite 150, Atlanta, GA 30326. Pulte Mortgage leases its primary office facilities in Englewood, Colorado. We also maintain various support functions in leased facilities in Tempe, Arizona and Bloomfield Hills, Michigan. Our homebuilding divisions and financial services branches lease office space in the geographic locations in which they conduct their day-to-day operations.
Because of the nature of our homebuilding operations, significant amounts of property are held as inventory in the ordinary course. Such properties are not included in response to this Item.
Item 3. LEGAL PROCEEDINGS
We are involved in various legal and governmental proceedings incidental to our continuing business operations, many involving claims related to certain construction defects. The consequences of these matters are not presently determinable but, in our opinion, after consulting with legal counsel and taking into account insurance and reserves, the ultimate liability is not expected to have a material adverse impact on our results of operations, financial position, or cash flows. However, to the extent the liability arising from the ultimate resolution of any matter exceeds our estimates reflected in the recorded reserves relating to such matter, we could incur additional charges that could be significant.
Item 4. MINE SAFETY DISCLOSURES
This Item is not applicable.
Item 4A. EXECUTIVE OFFICERS OF THE REGISTRANT
Set forth below is certain information with respect to our executive officers.
| Name | Age | Position | Year Became An Executive Officer | |||
| Richard J. Dugas, Jr. | 51 | Executive Chairman | 2002 | |||
| Ryan R. Marshall | 42 | President and Chief Executive Officer | 2012 | |||
| Robert T. O'Shaughnessy | 51 | Executive Vice President and Chief Financial Officer | 2011 | |||
| James R. Ellinghausen | 58 | Executive Vice President, Human Resources | 2005 | |||
| Harmon D. Smith | 53 | Executive Vice President and Chief Operating Officer | 2011 | |||
| Steven M. Cook | 58 | Executive Vice President, Chief Legal Officer and Corporate Secretary | 2006 | |||
| James L. Ossowski | 48 | Vice President, Finance and Controller | 2013 |
The following is a brief account of the business experience of each officer during the past five years:
Mr. Dugas was appointed Chairman in August 2009 and Executive Chairman in September 2016. He served as Chief Executive Officer from July 2003 to September 2016 and was appointed Executive Vice President in December 2002 and Chief Operating Officer in May 2002.
Mr. Marshall was appointed Chief Executive Officer in September 2016. Previously, he held the position of President since February 2016 and Executive Vice President, Homebuilding Operations since May 2014. He was appointed Area President, Southeast in November 2012; Area President, Florida in May 2012; and Division President, South Florida in 2006.
Mr. O'Shaughnessy was appointed Executive Vice President and Chief Financial Officer in May 2011.
Mr. Ellinghausen was appointed Executive Vice President, Human Resources in December 2006.
Mr. Smith was appointed Executive Vice President and Chief Operating Office in February 2016 and previously held the positions of Executive Vice President, Field Operations since May 2014 and Homebuilding Operations and Area President, Texas since May 2012. He served as an Area President over various geographical markets since 2006.
Mr. Cook was appointed Executive Vice President, Chief Legal Officer and Corporate Secretary in September 2015 and previously held the positions of Senior Vice President, General Counsel and Secretary since December 2008.
Mr. Ossowski was appointed Vice President, Finance and Controller in February 2013 and previously held the position of Vice President, Finance - Homebuilding Operations since August 2010.
There is no family relationship between any of the officers. Each officer serves at the pleasure of the Board of Directors.
PART II
Item 5. MARKET FOR THE REGISTRANT’S COMMON EQUITY, RELATED SHAREHOLDER MATTERS AND ISSUER PURCHASES OF EQUITY SECURITIES
Our common shares are listed on the New York Stock Exchange (Symbol: PHM).
Related Shareholder Matters
The table below sets forth, for the quarterly periods indicated, the range of high and low intraday sales prices for our common shares and dividend per share information:
| December 31, 2016 | December 31, 2015 | ||||||||||||||||||||||
| High | Low | Declared Dividend | High | Low | Declared Dividend | ||||||||||||||||||
| 1st Quarter | $ | 18.82 | $ | 14.61 | $ | 0.09 | $ | 23.24 | $ | 20.56 | $ | 0.08 | |||||||||||
| 2nd Quarter | 19.80 | 16.60 | 0.09 | 22.78 | 18.85 | 0.08 | |||||||||||||||||
| 3rd Quarter | 22.40 | 19.04 | 0.09 | 22.02 | 18.72 | 0.08 | |||||||||||||||||
| 4th Quarter | 20.66 | 17.69 | 0.09 | 20.21 | 17.18 | 0.09 |
At January 26, 2017, there were 2,461 shareholders of record.
Issuer Purchases of Equity Securities
| Total number of shares purchased | Average price paid per share | Total number of shares purchased as part of publicly announced plans or programs | Approximate dollar value of shares that may yet be purchased under the plans or programs ($000’s omitted) | |||||||||||
| October 1, 2016 to October 31, 2016 | 3,963,535 | $ | 19.66 | 3,963,535 | $ | 1,179,181 | (2) | |||||||
| November 1, 2016 to November 30, 2016 | 4,743,500 | 18.59 | 4,743,500 | $ | 1,091,004 | (2) | ||||||||
| December 1, 2016 to December 31, 2016 | 4,523,842 | 19.07 | 4,521,729 | $ | 1,004,765 | (2) | ||||||||
| Total | 13,230,877 | $ | 19.07 | 13,228,764 |
| (1) | During the fourth quarter of 2016, participants surrendered 2,113 shares for payment of minimum tax obligations upon the vesting or exercise of previously granted share-based compensation awards. Such shares were not repurchased as part of our publicly-announced share repurchase programs. |
| (2) | The Board of Directors approved share repurchase authorizations totaling $300.0 million and $1.0 billion in December 2015 and July 2016, respectively, of which $1,004.8 million remained available as of December 31, 2016. There are no expiration dates for these programs. During 2016, we repurchased 30.9 million shares under these programs. |
The information required by this item with respect to equity compensation plans is set forth under Item 12 of this annual report on Form 10-K and is incorporated herein by reference.
Performance Graph
The following line graph compares for the fiscal years ended December 31, 2012, 2013, 2014, 2015, and 2016 (a) the yearly cumulative total shareholder return (i.e., the change in share price plus the cumulative amount of dividends, assuming dividend reinvestment, divided by the initial share price, expressed as a percentage) on PulteGroup’s common shares, with (b) the cumulative total return of the Standard & Poor’s 500 Stock Index, and with (c) the Dow Jones U.S. Select Home Construction Index. The Dow Jones U.S. Select Home Construction Index is a widely-recognized index comprised primarily of large national homebuilders. We believe comparison of our shareholder return to this index represents a meaningful analysis for investors.
COMPARISON OF FIVE YEAR CUMULATIVE TOTAL RETURN*
AMONG PULTEGROUP, INC., S&P 500 INDEX, AND PEER INDEX
Fiscal Year Ended December 31, 2016
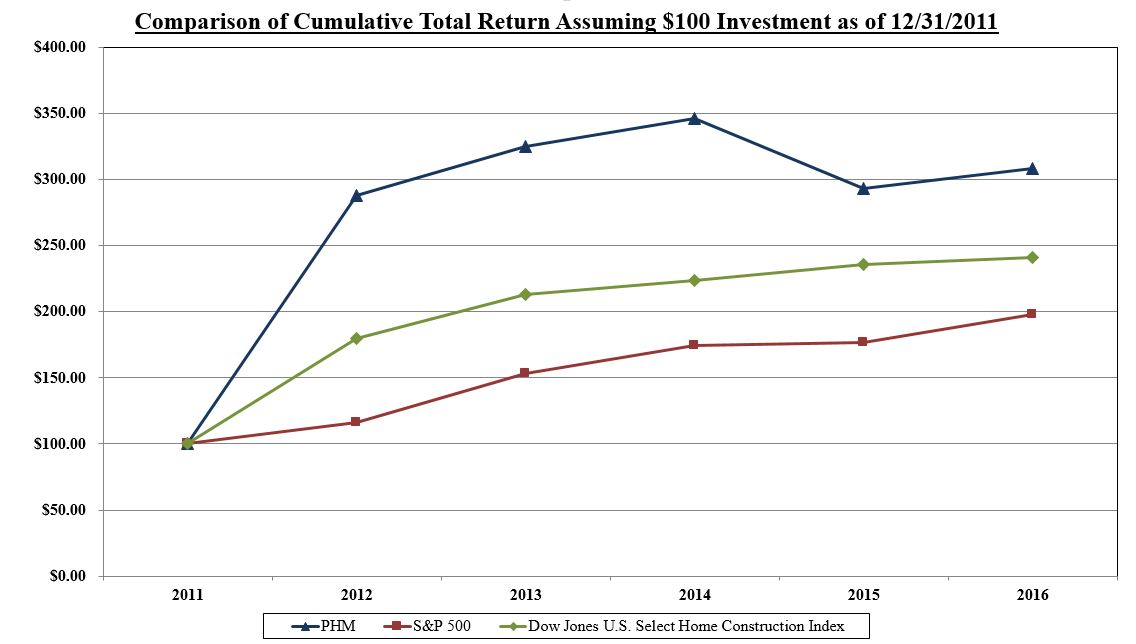
| 2011 | 2012 | 2013 | 2014 | 2015 | 2016 | |||||||||||||
| PULTEGROUP, INC. | 100.00 | 287.80 | 325.20 | 346.27 | 292.86 | 307.98 | ||||||||||||
| S&P 500 Index - Total Return | 100.00 | 116.00 | 153.57 | 174.60 | 177.01 | 198.18 | ||||||||||||
| Dow Jones U.S. Select Home Construction Index | 100.00 | 179.68 | 212.75 | 223.71 | 235.89 | 241.14 |
- Assumes $100 invested on December 31, 2011, and the reinvestment of dividends.
Item 6. SELECTED FINANCIAL DATA
Set forth below is selected consolidated financial data for each of the past five fiscal years. The selected financial data should be read in conjunction with Management’s Discussion and Analysis of Financial Condition and Results of Operations and our Consolidated Financial Statements and Notes thereto included elsewhere in this report.
| Years Ended December 31, (000’s omitted, except per share data) | |||||||||||||||||||
| 2016 | 2015 | 2014 | 2013 | 2012 | |||||||||||||||
| OPERATING DATA: | |||||||||||||||||||
| Homebuilding: | |||||||||||||||||||
| Revenues | $ | 7,487,350 | $ | 5,841,211 | $ | 5,696,725 | $ | 5,538,644 | $ | 4,659,110 | |||||||||
| Income before income taxes | $ | 860,766 | $ | 757,317 | $ | 635,177 | $ | 479,113 | $ | 157,991 | |||||||||
| Financial Services: | |||||||||||||||||||
| Revenues | $ | 181,126 | $ | 140,753 | $ | 125,638 | $ | 140,951 | $ | 160,888 | |||||||||
| Income before income taxes | $ | 73,084 | $ | 58,706 | $ | 54,581 | $ | 48,709 | $ | 25,563 | |||||||||
| Consolidated results: | |||||||||||||||||||
| Revenues | $ | 7,668,476 | $ | 5,981,964 | $ | 5,822,363 | $ | 5,679,595 | $ | 4,819,998 | |||||||||
| Income before income taxes | $ | 933,850 | $ | 816,023 | $ | 689,758 | $ | 527,822 | $ | 183,554 | |||||||||
| Income tax (expense) benefit | (331,147 | ) | (321,933 | ) | (215,420 | ) | 2,092,294 | 22,591 | |||||||||||
| Net income | $ | 602,703 | $ | 494,090 | $ | 474,338 | $ | 2,620,116 | $ | 206,145 | |||||||||
| PER SHARE DATA: | |||||||||||||||||||
| Net income per share: | |||||||||||||||||||
| Basic | $ | 1.76 | $ | 1.38 | $ | 1.27 | $ | 6.79 | $ | 0.54 | |||||||||
| Diluted | $ | 1.75 | $ | 1.36 | $ | 1.26 | $ | 6.72 | $ | 0.54 | |||||||||
| Number of shares used in calculation: | |||||||||||||||||||
| Basic | 339,747 | 356,576 | 370,377 | 383,077 | 381,562 | ||||||||||||||
| Effect of dilutive securities | 2,376 | 3,217 | 3,725 | 3,789 | 3,002 | ||||||||||||||
| Diluted | 342,123 | 359,793 | 374,102 | 386,866 | 384,564 | ||||||||||||||
| Shareholders’ equity | $ | 14.60 | $ | 13.63 | $ | 13.01 | $ | 12.19 | $ | 5.66 | |||||||||
| Cash dividends declared | $ | 0.36 | $ | 0.33 | $ | 0.23 | $ | 0.15 | $ | — |
| December 31, ($000’s omitted) | |||||||||||||||||||
| 2016 | 2015 | 2014 | 2013 | 2012 | |||||||||||||||
| BALANCE SHEET DATA: | |||||||||||||||||||
| House and land inventory | $ | 6,770,655 | $ | 5,450,058 | $ | 4,392,100 | $ | 3,978,561 | $ | 4,214,046 | |||||||||
| Total assets (a) | 10,178,200 | 9,189,406 | 8,560,187 | 8,719,886 | 6,719,093 | ||||||||||||||
| Senior notes and term loan (a) | 3,110,016 | 2,074,505 | 1,809,338 | 2,043,910 | 2,494,297 | ||||||||||||||
| Shareholders’ equity | 4,659,363 | 4,759,325 | 4,804,954 | 4,648,952 | 2,189,616 | ||||||||||||||
| Years Ended December 31, | |||||||||||||||||||
| 2016 | 2015 | 2014 | 2013 | 2012 | |||||||||||||||
| OTHER DATA: | |||||||||||||||||||
| Markets, at year-end | 49 | 50 | 49 | 48 | 58 | ||||||||||||||
| Active communities, at year-end | 726 | 620 | 598 | 577 | 670 | ||||||||||||||
| Closings (units) | 19,951 | 17,127 | 17,196 | 17,766 | 16,505 | ||||||||||||||
| Net new orders (units) | 20,326 | 18,008 | 16,652 | 17,080 | 19,039 | ||||||||||||||
| Backlog (units), at year-end | 7,422 | 6,731 | 5,850 | 5,772 | 6,458 | ||||||||||||||
| Average selling price (per unit) | $ | 373,000 | $ | 338,000 | $ | 329,000 | $ | 305,000 | $ | 276,000 | |||||||||
| Gross margin from home sales (b) | 25.0 | % | 26.9 | % | 26.7 | % | 24.1 | % | 19.6 | % |
| (a) | Certain prior period amounts have been reclassified to conform to the current year presentation following the adoption of ASU 2015-03, which resulted in the reclassification of applicable unamortized debt issuance costs from other assets to senior notes and term loan, and the reclassification of unbilled insurance receivables to other assets from accrued and other liabilities. See Note 1. |
| (b) | Homebuilding interest expense, which represents the amortization of capitalized interest, and land impairment charges are included in home sale cost of revenues. All periods reflect the reclassification of sales commissions expense from home sale cost of revenues to selling, general, and administrative expenses. See Note 1. |
Item 7. MANAGEMENT’S DISCUSSION AND ANALYSIS OF FINANCIAL CONDITION AND RESULTS OF OPERATIONS
Overview
Improved demand conditions in the overall U.S. housing market continued in 2016, though industry-wide new home sales continue to pace below historical averages. We remain pleased with the overall demand for new homes, which continues along a sustained path of recovery supported by ongoing job creation, low unemployment, a supportive interest rate environment, and a limited supply of new homes. Within this environment, we remain focused on driving additional gains in construction and asset efficiency to deliver higher returns on invested capital. Consistent with our positive market view and long-term business strategy, we expect to use our capital to support future growth while consistently returning funds to shareholders through dividends and share repurchases.
The nature of the homebuilding industry results in a lag between when investments made in land acquisition and development yield new community openings and related home closings. We have looked toward 2016 as a year where we would begin adding volume growth to the efficiency gains we have achieved in recent years. Our prior investments are allowing us to grow the business, as evidenced by 13% growth in net new orders and a 29% increase in home sale revenues to $7.5 billion. We achieved this growth while also maintaining our focus on gross margin performance through community location, strategic pricing, and construction efficiencies.
During 2016, we opened approximately 200 new communities across our local markets as a result of increased land investment over the last few years. Additionally, we acquired substantially all of the assets of JW Homes ("Wieland") in January 2016, which also contributed to the growth in community count. This volume of new community openings can present a challenge in today's environment where entitlement and land development delays are common. We have grown our investment in the business in a disciplined manner by emphasizing smaller projects and working to shorten our years of land supply, including the use of land option agreements when possible. We have also focused our land investments on closer-in locations where we think demand is more sustainable when the market ultimately moderates. We have accepted the trade-off of having to pay more for certain land positions where we can be more confident in future performance. Leveraging our increased land investments, we expect to open an even higher number of new communities in 2017 than we did in 2016, which we expect will help our volume grow in 2017.
Our financial position provided flexibility to increase our investments in future communities while also returning funds to shareholders through dividends and expanded share repurchases. Specifically, we accomplished the following in 2016:
| • | Increased our land investment spending by 24% to support future growth while also acquiring the Wieland assets for $430.5 million; |
| • | Maintained our quarterly dividend at $0.09 per share; |
| • | Repurchased $600.0 million of shares under our share repurchase plan and authorized an additional $1.0 billion for future repurchases; |
| • | Issued $2.0 billion of senior notes while also expanding and extending our unsecured revolving credit agreement; and |
| • | Ended the year with a debt to total capitalization ratio of 40.0%, which is within our targeted range, and a cash, cash equivalents, and restricted cash balance of $723.2 million with no borrowings outstanding under our unsecured revolving credit agreement. |
The following is a summary of our operating results by line of business ($000's omitted, except per share data):
| Years Ended December 31, | |||||||||||
| 2016 | 2015 | 2014 | |||||||||
| Income before income taxes: | |||||||||||
| Homebuilding | $ | 860,766 | $ | 757,317 | $ | 635,177 | |||||
| Financial Services | 73,084 | 58,706 | 54,581 | ||||||||
| Income before income taxes | 933,850 | 816,023 | 689,758 | ||||||||
| Income tax expense | (331,147 | ) | (321,933 | ) | (215,420 | ) | |||||
| Net income | $ | 602,703 | $ | 494,090 | $ | 474,338 | |||||
| Per share data - assuming dilution: | |||||||||||
| Net income | $ | 1.75 | $ | 1.36 | $ | 1.26 |
| • | Homebuilding income before income taxes improved each year from 2014 to 2016. Revenues increased each year and SG&A leverage improved. In 2016, the revenue increase was partially offset by lower gross margins and higher overhead costs, both of which were partially attributable to the assets acquired from Wieland in January 2016 (see Note 1). Homebuilding income before income taxes also reflected the following significant expense (income) items ($000's omitted): |
| 2016 | 2015 | 2014 | |||||||||
| Corporate office relocation (see Note 2) | $ | 8,284 | $ | 4,369 | $ | 16,344 | |||||
| Other severance and lease exit related costs (see Note 1) | 13,389 | — | — | ||||||||
| Land-related charges (see Note 3) | 19,336 | 11,467 | 11,168 | ||||||||
| Loss on debt retirements (see Note 6) | 657 | — | 8,584 | ||||||||
| Applecross matter (see Note 12) | — | 20,000 | — | ||||||||
| Settlement of disputed land transaction (see Note 12) | 15,000 | — | — | ||||||||
| Insurance reserve adjustments (see Note 12) | (55,243 | ) | (62,183 | ) | 69,267 | ||||||
| $ | 1,423 | $ | (26,347 | ) | $ | 105,363 |
For additional information on each of the above, see the applicable Notes to the Consolidated Financial Statements.
The acquisition of certain real estate assets from Wieland in January 2016 and Dominion Homes in August 2014 (see Note 1) were not material to our results of operations or financial condition.
| • | The increase in Financial Services income in 2016 compared with 2015 and 2014 was primarily due to an increase in mortgage origination volume. During 2015 and 2014, we reduced our loan origination liabilities by net reserve releases of $11.4 million and $18.6 million, respectively, which favorably impacted Financial Services income. See Note 12. |
| • | Our effective tax rate was 35.5%, 39.5% and 31.2% for 2016, 2015, and 2014, respectively. See Note 9. |
Homebuilding Operations
The following is a summary of income before income taxes for our Homebuilding operations ($000’s omitted):
| Years Ended December 31, | |||||||||||||||||
| 2016 | FY 2016 vs. FY 2015 | 2015 | FY 2015 vs. FY 2014 | 2014 | |||||||||||||
| Home sale revenues | $ | 7,451,315 | 29 | % | $ | 5,792,675 | 2 | % | $ | 5,662,171 | |||||||
| Land sale revenues | 36,035 | (26 | )% | 48,536 | 40 | % | 34,554 |
Showing the first 8K of 87K characters. Open the full section
Item 7A. QUANTITATIVE AND QUALITATIVE DISCLOSURES ABOUT MARKET RISK
We are subject to market risk on our debt instruments primarily due to fluctuations in interest rates. We utilize both fixed-rate and variable-rate debt. For fixed-rate debt, changes in interest rates generally affect the fair value of the debt instrument but not our earnings or cash flows. Conversely, for variable-rate debt, changes in interest rates generally do not affect the fair value of the debt instrument but could affect our earnings and cash flows. Except in very limited circumstances, we do not have an obligation to prepay our debt prior to maturity. As a result, interest rate risk and changes in fair value should not have a significant impact on our fixed-rate debt until we are required or elect to refinance or repurchase such debt.
The following tables set forth the principal cash flows by scheduled maturity, weighted-average interest rates, and estimated fair value of our debt obligations as of December 31, 2016 and 2015 ($000’s omitted).
| As of December 31, 2016 for the Years ending December 31, | |||||||||||||||||||||||||||||||
| 2017 | 2018 | 2019 | 2020 | 2021 | Thereafter | Total | Fair Value | ||||||||||||||||||||||||
| Rate-sensitive liabilities: | |||||||||||||||||||||||||||||||
| Fixed rate debt | $ | 134,482 | $ | — | $ | 3,900 | $ | 3,900 | $ | 700,000 | $ | 2,300,000 | $ | 3,142,282 | $ | 3,131,579 | |||||||||||||||
| Average interest rate | 7.12 | % | — | % | 5.00 | % | 5.00 | % | 4.25 | % | 7.19 | % | 5.58 | % | |||||||||||||||||
| Variable rate debt (a) | $ | 331,621 | $ | — | $ | — | $ | — | $ | — | $ | — | $ | 331,621 | $ | 331,621 | |||||||||||||||
| Average interest rate | 2.89 | % | — | % | — | % | — | % | — | % | — | % | 2.89 | % | |||||||||||||||||
| As of December 31, 2015 for the Years ending December 31, | |||||||||||||||||||||||||||||||
| 2016 | 2017 | 2018 | 2019 | 2020 | Thereafter | Total | Fair Value | ||||||||||||||||||||||||
| Rate-sensitive liabilities: | |||||||||||||||||||||||||||||||
| Fixed rate debt | $ | 487,485 | $ | 128,296 | $ | — | $ | 3,900 | $ | 3,900 | $ | 1,000,000 | $ | 1,623,581 | $ | 1,678,987 | |||||||||||||||
| Average interest rate | 6.24 | % | 7.00 | % | — | % | 5.00 | % | 5.00 | % | 6.71 | % | 6.57 | % | |||||||||||||||||
| Variable rate debt (a) | $ | 267,877 | $ | 500,000 | $ | — | $ | — | $ | — | $ | — | $ | 767,877 | $ | 767,877 | |||||||||||||||
| Average interest rate | 2.65 | % | 1.42 | % | — | % | — | % | — | % | — | % | 1.85 | % |
(a) Includes the Pulte Mortgage Repurchase Agreement and the Term Loan, which was retired in 2016. Does not include our Revolving Credit Facility, under which there were no borrowings outstanding at either December 31, 2016 or 2015.
Derivative instruments and hedging activities
Pulte Mortgage is exposed to market risks from commitments to lend, movements in interest rates, and canceled or modified commitments to lend. A commitment to lend at a specific interest rate (an interest rate lock commitment) is a derivative financial instrument (interest rate is locked to the borrower). The interest rate risk continues through the loan closing and until the loan is sold to an investor. We are generally not exposed to variability in cash flows of derivative instruments for more than approximately 90 days. In periods of rising interest rates, the length of exposure will generally increase due to customers locking in an interest rate sooner as opposed to letting the interest rate float. In periods of low or decreasing interest rates, the length of exposure will also generally increase as customers desire to lock before the possibility of rising rates.
In order to reduce these risks, we use other derivative financial instruments, principally cash forward placement contracts on mortgage-backed securities and whole loan investor commitments, to economically hedge the interest rate lock commitment. We generally enter into one of the aforementioned derivative financial instruments upon accepting interest rate lock commitments. Changes in the fair value of interest rate lock commitments and the other derivative financial instruments are recognized in Financial Services revenues. We do not use any derivative financial instruments for trading purposes.
At December 31, 2016 and 2015, residential mortgage loans available-for-sale had an aggregate fair value of $539.5 million and $442.7 million, respectively. At December 31, 2016 and 2015, we had aggregate interest rate lock commitments of $273.9 million and $208.2 million, respectively, which were originated at interest rates prevailing at the date of commitment. Unexpired forward contracts totaled $610.0 million and $525.0 million at December 31, 2016 and 2015, respectively, and
whole loan investor commitments totaled $157.6 million and $77.6 million, respectively, at such dates. Hypothetical changes in the fair values of our financial instruments arising from immediate parallel shifts in long-term mortgage rates would not be material to our financial results due to the offsetting nature in the movements in fair value of our financial instruments.
SPECIAL NOTES CONCERNING FORWARD-LOOKING STATEMENTS
As a cautionary note, except for the historical information contained herein, certain matters discussed in Item 2, Management's Discussion and Analysis of Financial Condition and Results of Operations, and Item 3, Quantitative and Qualitative Disclosures About Market Risk, are “forward-looking” statements within the meaning of the Private Securities Litigation Reform Act of 1995. Such forward-looking statements are subject to a number of risks, uncertainties and other factors that could cause our actual results, performance, prospects or opportunities, as well as those of the markets we serve or intend to serve, to differ materially from those expressed in, or implied by, these statements. You can identify these statements by the fact that they do not relate to matters of a strictly factual or historical nature and generally discuss or relate to forecasts, estimates or other expectations regarding future events. Generally, the words “believe,” “expect,” “intend,” “estimate,” “anticipate,” “plan,” “project,” “may,” “can,” “could,” “might,” "should", “will” and similar expressions identify forward-looking statements, including statements related to expected operating and performing results, planned transactions, planned objectives of management, future developments or conditions in the industries in which we participate and other trends, developments and uncertainties that may affect our business in the future.
Such risks, uncertainties and other factors include, among other things: interest rate changes and the availability of mortgage financing; competition within the industries in which we operate; the availability and cost of land and other raw materials used by us in our homebuilding operations; the impact of any changes to our strategy in responding to the cyclical nature of the industry, including any changes regarding our land positions and the levels of our land spend; the availability and cost of insurance covering risks associated with our businesses; shortages and the cost of labor; weather related slowdowns; slow growth initiatives and/or local building moratoria; governmental regulation directed at or affecting the housing market, the homebuilding industry or construction activities; uncertainty in the mortgage lending industry, including revisions to underwriting standards and repurchase requirements associated with the sale of mortgage loans; the interpretation of or changes to tax, labor and environmental laws; economic changes nationally or in our local markets, including inflation, deflation, changes in consumer confidence and preferences and the state of the market for homes in general; legal or regulatory proceedings or claims; our ability to generate sufficient cash flow in order to successfully implement our capital allocation priorities; required accounting changes; terrorist acts and other acts of war; and other factors of national, regional and global scale, including those of a political, economic, business and competitive nature. See Item 1A – Risk Factors for a further discussion of these and other risks and uncertainties applicable to our businesses. We undertake no duty to update any forward-looking statement, whether as a result of new information, future events or changes in our expectations.
Item 8. FINANCIAL STATEMENTS AND SUPPLEMENTARY DATA
PULTEGROUP, INC.
CONSOLIDATED BALANCE SHEETS
December 31, 2016 and 2015
($000’s omitted, except per share data)
| 2016 | 2015 | ||||||
| ASSETS | |||||||
| Cash and equivalents | $ | 698,882 | $ | 754,161 | |||
| Restricted cash | 24,366 | 21,274 | |||||
| Total cash, cash equivalents, and restricted cash | 723,248 | 775,435 | |||||
| House and land inventory | 6,770,655 | 5,450,058 | |||||
| Land held for sale | 31,728 | 81,492 | |||||
| Residential mortgage loans available-for-sale | 539,496 | 442,715 | |||||
| Investments in unconsolidated entities | 51,447 | 41,267 | |||||
| Other assets | 857,426 | 893,345 | |||||
| Intangible assets | 154,792 | 110,215 | |||||
| Deferred tax assets, net | 1,049,408 | 1,394,879 | |||||
| $ | 10,178,200 | $ | 9,189,406 | ||||
| LIABILITIES AND SHAREHOLDERS’ EQUITY | |||||||
| Liabilities: | |||||||
| Accounts payable, including book overdrafts of $99,690 and $60,547 in 2016 and 2015, respectively | $ | 405,455 | $ | 327,725 | |||
| Customer deposits | 187,891 | 186,141 | |||||
| Accrued and other liabilities | 1,448,994 | 1,516,783 | |||||
| Income tax liabilities | 34,860 | 57,050 | |||||
| Financial Services debt | 331,621 | 267,877 | |||||
| Term loan | — | 498,423 | |||||
| Senior notes | 3,110,016 | 1,576,082 | |||||
| Total liabilities | 5,518,837 | 4,430,081 | |||||
| Shareholders’ equity: | |||||||
| Preferred shares, $0.01 par value; 25,000,000 shares authorized, none issued | $ | — | $ | — | |||
| Common shares, $0.01 par value; 500,000,000 shares authorized, 319,089,720 and 349,148,351 shares issued and outstanding at December 31, 2016 and 2015, respectively | 3,191 | 3,491 | |||||
| Additional paid-in capital | 3,116,490 | 3,093,802 | |||||
| Accumulated other comprehensive loss | (526 | ) | (609 | ) | |||
| Retained earnings | 1,540,208 | 1,662,641 | |||||
| Total shareholders’ equity | 4,659,363 | 4,759,325 | |||||
| $ | 10,178,200 | $ | 9,189,406 |
See Notes to Consolidated Financial Statements.
PULTEGROUP, INC.
CONSOLIDATED STATEMENTS OF OPERATIONS
For the years ended December 31, 2016, 2015, and 2014
(000’s omitted, except per share data)
| 2016 | 2015 | 2014 | |||||||||
| Revenues: | |||||||||||
| Homebuilding | |||||||||||
| Home sale revenues | $ | 7,451,315 | $ | 5,792,675 | $ | 5,662,171 | |||||
| Land sale revenues | 36,035 | 48,536 | 34,554 | ||||||||
| 7,487,350 | 5,841,211 | 5,696,725 | |||||||||
| Financial Services | 181,126 | 140,753 | 125,638 | ||||||||
| Total revenues | 7,668,476 | 5,981,964 | 5,822,363 | ||||||||
| Homebuilding Cost of Revenues: | |||||||||||
| Home sale cost of revenues | (5,587,974 | ) | (4,235,945 | ) | (4,149,674 | ) | |||||
| Land sale cost of revenues | (32,115 | ) | (35,858 | ) | (23,748 | ) | |||||
| (5,620,089 | ) | (4,271,803 | ) | (4,173,422 | ) | ||||||
| Financial Services expenses | (108,573 | ) | (82,047 | ) | (71,057 | ) | |||||
| Selling, general, and administrative expenses | (957,150 | ) | (794,728 | ) | (861,390 | ) | |||||
| Other expense, net | (48,814 | ) | (17,363 | ) | (26,736 | ) | |||||
| Income before income taxes | 933,850 | 816,023 | 689,758 | ||||||||
| Income tax expense | (331,147 | ) | (321,933 | ) | (215,420 | ) | |||||
| Net income | $ | 602,703 | $ | 494,090 | $ | 474,338 | |||||
| Net income per share: | |||||||||||
| Basic | $ | 1.76 | $ | 1.38 | $ | 1.27 | |||||
| Diluted | $ | 1.75 | $ | 1.36 | $ | 1.26 | |||||
| Cash dividends declared | $ | 0.36 | $ | 0.33 | $ | 0.23 | |||||
| Number of shares used in calculation: | |||||||||||
| Basic | 339,747 | 356,576 | 370,377 | ||||||||
| Effect of dilutive securities | 2,376 | 3,217 | 3,725 | ||||||||
| Diluted | 342,123 | 359,793 | 374,102 |
See Notes to Consolidated Financial Statements.
PULTEGROUP, INC.
CONSOLIDATED STATEMENTS OF COMPREHENSIVE INCOME
For the years ended December 31, 2016, 2015, and 2014
(000’s omitted)
| 2016 | 2015 | 2014 | |||||||||
| Net income | $ | 602,703 | $ | 494,090 | $ | 474,338 | |||||
| Other comprehensive income, net of tax: | |||||||||||
| Change in value of derivatives | 83 | 81 | 105 | ||||||||
| Other comprehensive income | 83 | 81 | 105 | ||||||||
| Comprehensive income | $ | 602,786 | $ | 494,171 | $ | 474,443 |
See Notes to Consolidated Financial Statements.
PULTEGROUP, INC.
CONSOLIDATED STATEMENTS OF SHAREHOLDERS’ EQUITY
For the years ended December 31, 2016, 2015, and 2014
(000’s omitted, except per share data)
| Common Shares | Additional Paid-in Capital | Accumulated Other Comprehensive Income (Loss) | Retained Earnings (Accumulated Deficit) | Total | ||||||||||||||||||
| Shares | $ | |||||||||||||||||||||
| Shareholders' Equity, January 1, 2014 | 381,300 | $ | 3,813 | $ | 3,052,016 | $ | (795 | ) | $ | 1,593,918 | $ | 4,648,952 | ||||||||||
| Stock option exercises | 1,422 | 14 | 15,613 | — | — | 15,627 | ||||||||||||||||
| Share issuances, net of cancellations | (43 | ) | — | — | — | — | — | |||||||||||||||
| Dividends declared | — | — | 72 | — | (86,442 | ) | (86,370 | ) | ||||||||||||||
| Share repurchases | (13,220 | ) | (132 | ) | — | — | (252,887 | ) | (253,019 | ) | ||||||||||||
| Share-based compensation | — | — | 13,786 | — | 26 | 13,812 | ||||||||||||||||
| Excess tax benefits (deficiencies) from share-based compensation | — | — | (8,491 | ) | — | — | (8,491 | ) | ||||||||||||||
| Net income | — | — | — | — | 474,338 | 474,338 | ||||||||||||||||
| Other comprehensive income | — | — | — | 105 | — | 105 | ||||||||||||||||
| Shareholders' Equity, December 31, 2014 | 369,459 | $ | 3,695 | $ | 3,072,996 | $ | (690 | ) | $ | 1,728,953 | $ | 4,804,954 | ||||||||||
| Stock option exercises | 904 | 9 | 10,525 | — | — | 10,534 | ||||||||||||||||
| Share issuances, net of cancellations | 428 | 4 | 7,420 | — | 7,424 | |||||||||||||||||
| Dividends declared | — | — | 8 | — | (117,881 | ) | (117,873 | ) | ||||||||||||||
| Share repurchases | (21,642 | ) | (217 | ) |
Showing the first 8K of 161K characters. Open the full section
Item 9. CHANGES IN AND DISAGREEMENTS WITH ACCOUNTANTS ON ACCOUNTING AND FINANCIAL DISCLOSURE
This Item is not applicable.
Item 9A. CONTROLS AND PROCEDURES
Disclosure Controls and Procedures
Management, including our President and Chief Executive Officer and Executive Vice President and Chief Financial Officer, evaluated the effectiveness of the design and operation of our disclosure controls and procedures as of December 31, 2016. Based upon, and as of the date of that evaluation, our President and Chief Executive Officer and Executive Vice President and Chief Financial Officer concluded that the disclosure controls and procedures were effective as of December 31, 2016.
Internal Control Over Financial Reporting
| (a) | Management’s Annual Report on Internal Control Over Financial Reporting |
Management is responsible for the preparation and fair presentation of the consolidated financial statements included in this annual report. The consolidated financial statements have been prepared in conformity with U.S. generally accepted accounting principles and reflect management’s judgments and estimates concerning events and transactions that are accounted for or disclosed.
Management is also responsible for establishing and maintaining effective internal control over financial reporting, as such term is defined in Exchange Act Rule 13a-15(f). Management recognizes that there are inherent limitations in the effectiveness of any internal control and effective internal control over financial reporting can provide only reasonable assurance with respect to financial statement preparation. Additionally, because of changes in conditions, the effectiveness of internal control over financial reporting may vary over time.
In order to ensure that the Company’s internal control over financial reporting is effective, management regularly assesses such controls and did so most recently for its financial reporting as of December 31, 2016. Management’s assessment was based on criteria for effective internal control over financial reporting described in Internal Control – Integrated Framework issued by the Committee of Sponsoring Organizations of the Treadway Commission (2013 Framework). Based on this assessment, management asserts that the Company has maintained effective internal control over financial reporting as of December 31, 2016.
Ernst & Young LLP, the independent registered public accounting firm that audited the Company’s consolidated financial statements included in this annual report, has issued its report on the effectiveness of the Company’s internal control over financial reporting as of December 31, 2016.
| (b) | Report of Independent Registered Public Accounting Firm |
The Board of Directors and Shareholders of PulteGroup, Inc.
We have audited PulteGroup, Inc.’s internal control over financial reporting as of December 31, 2016, based on criteria established in Internal Control—Integrated Framework issued by the Committee of Sponsoring Organizations of the Treadway Commission (2013 Framework) (the COSO criteria). PulteGroup, Inc.’s management is responsible for maintaining effective internal control over financial reporting, and for its assessment of the effectiveness of internal control over financial reporting included in the accompanying Management’s Annual Report on Internal Control Over Financial Reporting. Our responsibility is to express an opinion on the company’s internal control over financial reporting based on our audit.
We conducted our audit in accordance with the standards of the Public Company Accounting Oversight Board (United States). Those standards require that we plan and perform the audit to obtain reasonable assurance about whether effective internal control over financial reporting was maintained in all material respects. Our audit included obtaining an understanding of internal control over financial reporting, assessing the risk that a material weakness exists, testing and evaluating the design and operating effectiveness of internal control based on the assessed risk, and performing such other procedures as we considered necessary in the circumstances. We believe that our audit provides a reasonable basis for our opinion.
A company’s internal control over financial reporting is a process designed to provide reasonable assurance regarding the reliability of financial reporting and the preparation of financial statements for external purposes in accordance with generally accepted accounting principles. A company’s internal control over financial reporting includes those policies and procedures that (1) pertain to the maintenance of records that, in reasonable detail, accurately and fairly reflect the transactions and dispositions of the assets of the company; (2) provide reasonable assurance that transactions are recorded as necessary to permit preparation of financial statements in accordance with generally accepted accounting principles, and that receipts and expenditures of the company are being made only in accordance with authorizations of management and directors of the company; and (3) provide reasonable assurance regarding prevention or timely detection of unauthorized acquisition, use or disposition of the company’s assets that could have a material effect on the financial statements.
Because of its inherent limitations, internal control over financial reporting may not prevent or detect misstatements. Also, projections of any evaluation of effectiveness to future periods are subject to the risk that controls may become inadequate because of changes in conditions, or that the degree of compliance with the policies or procedures may deteriorate.
In our opinion, PulteGroup, Inc. maintained, in all material respects, effective internal control over financial reporting as of December 31, 2016, based on the COSO criteria.
We also have audited, in accordance with the standards of the Public Company Accounting Oversight Board (United States), the consolidated balance sheets of PulteGroup, Inc. as of December 31, 2016 and 2015, and the related consolidated statements of operations, comprehensive income, shareholders’ equity, and cash flows for each of the three years in the period ended December 31, 2016 and our report dated February 1, 2017 expressed an unqualified opinion thereon.
/s/ Ernst & Young LLP
Atlanta, Georgia
February 1, 2017
| (c) | Changes in Internal Control Over Financial Reporting |
There has been no change in our internal control over financial reporting during the quarter ended December 31, 2016 that has materially affected, or is reasonably likely to materially affect, our internal control over financial reporting.
Item 9B. OTHER INFORMATION
This Item is not applicable.
PART III
Item 10. DIRECTORS, EXECUTIVE OFFICERS AND CORPORATE GOVERNANCE
Information required by this Item with respect to our executive officers is set forth in Item 4A of this Annual Report on Form 10-K. Information required by this Item with respect to members of our Board of Directors and with respect to our audit committee will be contained in the Proxy Statement for the 2017 Annual Meeting of Shareholders (“2017 Proxy Statement”), which will be filed no later than 120 days after December 31, 2016, under the captions “Election of Directors” and “Committees of the Board of Directors - Audit Committee” and in the chart disclosing Audit Committee membership and is incorporated herein by this reference. Information required by this Item with respect to compliance with Section 16(a) of the Securities Exchange Act of 1934 will be contained in the 2017 Proxy Statement under the caption “Beneficial Security Ownership - Section 16(a) Beneficial Ownership Reporting Compliance,” and is incorporated herein by this reference. Information required by this Item with respect to our code of ethics will be contained in the 2017 Proxy Statement under the caption “Corporate Governance - Governance Guidelines; Code of Ethical Business Conduct; Code of Ethics” and is incorporated herein by this reference.
Our code of ethics for principal officers, our code of ethical business conduct, our corporate governance guidelines, and the charters of the Audit, Compensation and Management Development, Nominating and Governance, and Finance and Investment committees of our Board of Directors are also posted on our website and are available in print, free of charge, upon request.
Item 11. EXECUTIVE COMPENSATION
Information required by this Item will be contained in the 2017 Proxy Statement under the captions “2016 Executive Compensation” and “2016 Director Compensation” and is incorporated herein by this reference, provided that the Compensation and Management Development Committee Report shall not be deemed to be “filed” with this Annual Report on Form 10-K.
Item 12. SECURITY OWNERSHIP OF CERTAIN BENEFICIAL OWNERS AND MANAGEMENT AND RELATED STOCKHOLER MATTERS
Information required by this Item will be contained in the 2017 Proxy Statement under the captions “Beneficial Security Ownership” and “Equity Compensation Plan Information” and is incorporated herein by this reference.
Item 13. CERTAIN RELATIONSHIPS AND RELATED TRANSACTIONS AND DIRECTOR INDEPENDENCE
Information required by this Item will be contained in the 2017 Proxy Statement under the captions “Certain Relationships and Related Transactions” and “Election of Directors - Independence” and is incorporated herein by this reference.
Item 14. PRINCIPAL ACCOUNTANT FEES AND SERVICES
Information required by this Item will be contained in the 2017 Proxy Statement under the captions “Audit and Non-Audit Fees” and “Audit Committee Preapproval Policies” and is incorporated herein by reference.
PART IV
Item 15. EXHIBITS AND FINANCIAL STATEMENT SCHEDULES
| (a) | The following documents are filed as part of this Annual Report on Form 10-K: |
(1) Financial Statements
| (2) | Financial Statement Schedules |
All schedules are omitted because the required information is not present, is not present in amounts sufficient to require submission of the schedule, or because the required information is included in the financial statements or notes thereto.
| (3) | Exhibits |
The following exhibits are filed with this Annual Report on Form 10-K or are incorporated herein by reference:
Exhibit Number and Description
| (3) | (a) | Restated Articles of Incorporation, of PulteGroup, Inc. (Incorporated by reference to Exhibit 3.1 of our Current Report on Form 8-K, filed with the SEC on August 18, 2009) | ||
| (b) | Certificate of Amendment to the Articles of Incorporation, dated March 18, 2010 (Incorporated by reference to Exhibit 3(b) of our Quarterly Report on Form 10-Q for the quarter ended March 31, 2010) | |||
| (c) | Certificate of Amendment to the Articles of Incorporation, dated May 21, 2010 (Incorporated by reference to Exhibit 3(c) of our Quarterly Report on Form 10-Q for the quarter ended September 30, 2010) | |||
| (d) | By-laws, as amended, of PulteGroup, Inc. (Incorporated by reference to Exhibit 3.2 of our Current Report on Form 8-K, filed with the SEC on May 6, 2016) | |||
| (e) | Certificate of Designation of Series A Junior Participating Preferred Shares, dated August 6, 2009 (Incorporated by reference to Exhibit 3(b) of our Registration Statement on Form 8-A, filed with the SEC on August 18, 2009) | |||
| (4) | (a) | Any instrument with respect to long-term debt, where the securities authorized thereunder do not exceed 10% of the total assets of PulteGroup, Inc. and its subsidiaries, has not been filed. The Company agrees to furnish a copy of such instruments to the SEC upon request. | ||
| (b) | Amended and Restated Section 382 Rights Agreement, dated as of March 18, 2010, between PulteGroup, Inc. and Computershare Trust Company, N.A., as rights agent, which includes the Form of Rights Certificate as Exhibit B thereto (Incorporated by reference to Exhibit 4 of PulteGroup, Inc.’s Registration Statement on Form 8-A/A filed with the SEC on March 23, 2010) | |||
| (c) | First Amendment to Amended and Restated Section 382 Rights Agreement, dated as of March 14, 2013, between PulteGroup, Inc. and Computershare Trust Company, N.A., as rights agent (Incorporated by reference to Exhibit 4.1 of PulteGroup, Inc.’s Current Report on Form 8-K, filed with the SEC on March 15, 2013) | |||
| (d) | Second Amendment to Amended and Restated Section 382 Rights Agreement, dated as of March 10, 2016, between PulteGroup, Inc. and Computershare Trust Company, N.A., as rights agent (Incorporated by reference to Exhibit 4.1 of PulteGroup, Inc.’s Current Report on Form 8-K, filed with the SEC on March 10, 2016) | |||
| (10) | (a) | PulteGroup, Inc. 401(k) Plan (Incorporated by reference to Exhibit 4.3 of our Registration Statement on Form S-8, No. 333-115570) | ||
| (b) | PulteGroup, Inc. 2002 Stock Incentive Plan (Incorporated by reference to our Proxy Statement dated April 3, 2002 and as Exhibit 4.3 of our Registration Statement on Form S-8, No. 333-123223) | |||
| (c) | PulteGroup, Inc. 2008 Senior Management Incentive Plan (Incorporated by reference to our Proxy Statement dated April 7, 2008) | |||
| (d) | PulteGroup, Inc. 2013 Senior Management Incentive Plan (Incorporated by reference to Exhibit 10.2 of our Current Report on Form 8-K, filed with the SEC on May 13, 2013) | |||
| (e) | PulteGroup, Inc. Long-Term Incentive Program (Incorporated by reference to Exhibit 10.2 of our Current Report on Form 8-K, filed with the SEC on May 20, 2008) | |||
| (f) | Form of PulteGroup, Inc. Long Term Incentive Award Agreement (Incorporated by reference to Exhibit 10.3 of our Current Report on Form 8-K, filed with the SEC on May 20, 2008) | |||
| (g) | Form of PulteGroup, Inc. 2008-2010 Grant Acceptance Agreement - Company Performance Measures (Incorporated by reference to Exhibit 10.4 of our Current Report on Form 8-K, filed with the SEC on May 20, 2008) | |||
| (h) | Form of PulteGroup, Inc. 2008-2010 Grant Acceptance Agreement - Individual Performance Measures (Incorporated by reference to Exhibit 10.5 of our Current Report on Form 8-K, filed with the SEC on May 20, 2008) | |||
| (i) | PulteGroup, Inc. 2013 Stock Incentive Plan (Incorporated by reference to Exhibit 10.1 of our Current Report on Form 8-K, filed with the SEC on May 13, 2013) | |||
| (j) | PulteGroup, Inc. 2004 Stock Incentive Plan (as Amended and Restated as of July 9, 2009) (Incorporated by reference to Exhibit 10(a) of our Quarterly Report on Form 10-Q for the quarter ended September 30, 2009) | |||
| (k) | Form of Restricted Stock Unit Award Agreement under PulteGroup, Inc. 2013 Stock Incentive Plan (Incorporated by reference to Exhibit 10(c) of our Quarterly Report on Form 10-Q for the quarter ended March 31, 2014) | |||
| (l) | Form of Restricted Stock Award Agreement (as amended) under PulteGroup, Inc. 2004 Stock Incentive Plan (Incorporated by reference to Exhibit 10(p) of our Annual Report on Form 10-K for the year ended December 31, 2013) | |||
| (m) | Form of Stock Option Agreement under PulteGroup, Inc. 2002 and 2004 Stock Incentive Plans (Incorporated by reference to Exhibit 10(s) of our Annual Report on Form 10-K for the year ended December 31, 2007) | |||
| (n) | Form of Stock Option Agreement (as amended) under PulteGroup, Inc. 2002 and 2004 Stock Incentive Plans (Incorporated by reference to Exhibit 10(t) of our Annual Report on Form 10-K for the year ended December 31, 2007) | |||
| (o) | Form of Performance Share Award Agreement under PulteGroup, Inc. 2004 Stock Incentive Plan (Incorporated by reference to Exhibit 10(w) of our Annual Report on Form 10-K for the year ended December 31, 2011 ) | |||
| (p) | PulteGroup, Inc. Long Term Compensation Deferral Plan (As Amended and Restated Effective January 1, 2004) (Incorporated by reference to Exhibit 10(a) of our Quarterly Report on Form 10-Q for the quarter ended March 31, 2006) | |||
| (q) | PulteGroup, Inc. Deferred Compensation Plan for Non-Employee Directors (as Amended and Restated Effective December 8, 2009) (Incorporated by reference to Exhibit 10(al) of our Annual Report on Form 10-K for the year ended December 31, 2009) | |||
| (r) | Assignment and Assumption Agreement dated as of August 18, 2009 between PulteGroup, Inc. and Centex Corporation (Incorporated by reference to Exhibit 10.2 of our Current Report on Form 8-K, filed with the SEC on August 20, 2009) | |||
| (s) | Form of Performance Award Agreement under PulteGroup, Inc. 2008 Senior Management Incentive Plan (Incorporated by reference to Exhibit 10(a) of our Quarterly Report on Form 10-Q for the quarter ended March 31, 2012) | |||
| (t) | PulteGroup, Inc. Executive Severance Policy (Incorporated by reference to Exhibit 10.1 of our Current Report on Form 8-K, filed with the SEC on February 12, 2013) | |||
| (u) | PulteGroup, Inc. Amended Retirement Policy (Incorporated by reference to Exhibit 10(a) of our Quarterly Report on Form 10-Q for the quarter ended June 30, 2015) | |||
| (v) | Amended and Restated Credit Agreement dated as of June 30, 2016 among PulteGroup, Inc., as Borrower, Bank of America, N.A., as Administrative Agent, Swing Line Lender and an L/C Issuer, and the other Lenders party thereto (Incorporated by reference to Exhibit 10.1 of PulteGroup, Inc.'s Current Report on Form 8-K, filed with the SEC on July 1, 2016) | |||
| (w) | Amended and Restated Master Repurchase Agreement dated September 4, 2015, among Comerica Bank, as Agent, Lead Arranger and a Buyer, the other Buyers party hereto and Pulte Mortgage LLC, as Seller (Incorporated by reference to Exhibit 10.1 of our Current Report on Form 8-K, filed with the SEC on September 8, 2015) | |||
| (x) | Second Amendment to Amended and Restated Master Repurchase Agreement dated June 24, 2016 (Incorporated by reference to Exhibit 10.1 of PulteGroup, Inc.'s Current Report on Form 8-K, filed with the SEC on June 29, 2016) | |||
| (y) | Third Amendment to Amended and Restated Master Repurchase Agreement dated August 15, 2016 (Incorporated by reference to Exhibit 10.1 of PulteGroup, Inc.'s Current Report on Form 8-K, filed with the SEC on August 17, 2016) | |||
| (z) | Fourth Amendment to Amended and Restated Master Repurchase Agreement dated December 27, 2016 (Incorporated by reference to Exhibit 10.1 of PulteGroup, Inc.'s Current Report on Form 8-K, filed with the SEC on December 29, 2016) | |||
| (aa) | Letter Agreement, dated July 20, 2016, by and between Elliott Associates, L.P., Elliott International, L.P. and PulteGroup, Inc. (Incorporated by reference to Exhibit 10(d) of PulteGroup, Inc.'s Form 10-Q, filed with the SEC on July 21, 2016) | |||
| (ab) | Letter Agreement by and among William J. Pulte (grandson of the founder), William J. Pulte (founder), William J. Pulte Trust dtd 01/26/90, Joan B. Pulte Trust dtd 01/26/90 and PulteGroup, Inc., dated September 8, 2016 (Incorporated by reference to Exhibit 10.1 of PulteGroup, Inc.'s Current Report on Form 8-K, filed with the SEC on September 8, 2016) | |||
| (ac) | Transition Agreement by and between PulteGroup, Inc. and Richard J. Dugas, Jr., dated September 8, 2016 (Incorporated by reference to Exhibit 10.2 of PulteGroup, Inc.'s Current Report on Form 8-K, filed with the SEC on September 8, 2016) | |||
| (12) | Ratio of Earnings to Fixed Charges at December 31, 2016 (Filed herewith) | |||
| (21) | Subsidiaries of the Registrant (Filed herewith) | |||
| (23) | Consent of Independent Registered Public Accounting Firm (Filed herewith) | |||
| (24) | Power of Attorney (filed herewith) | |||
| (31) | (a) | Rule 13a-14(a) Certification by Ryan R. Marshall, President and Chief Executive Officer (Filed herewith) | ||
| (b) | Rule 13a-14(a) Certification by Robert T. O'Shaughnessy, Executive Vice President and Chief Financial Officer (Filed herewith) | |||
| (32) | Certification Pursuant to 18 United States Code § 1350 and Rule 13a-14(b) of the Securities Exchange Act of 1934 (Filed herewith) | |||
| 101.INS | XBRL Instance Document | |||
| 101.SCH | XBRL Taxonomy Extension Schema Document | |||
| 101.CAL | XBRL Taxonomy Extension Calculation Linkbase Document | |||
| 101.DEF | XBRL Taxonomy Extension Definition Linkbase Document | |||
| 101.LAB | XBRL Taxonomy Extension Label Linkbase Document | |||
| 101.PRE | XBRL Taxonomy Extension Presentation Linkbase Document |
SIGNATURES
Pursuant to the requirements of Section 13 or 15(d) of the Securities Exchange Act of 1934, the Registrant has duly caused this report to be signed on its behalf by the undersigned, thereunto duly authorized.
PULTEGROUP, INC.
(Registrant)
| February 1, 2017 | By: | /s/ Robert T. O'Shaughnessy | |
| Robert T. O'Shaughnessy | |||
| Executive Vice President | |||
| and Chief Financial Officer |
Pursuant to the requirements of the Securities Exchange Act of 1934, this report has been signed below by the following persons on behalf of the Registrant and in the capacities and on the date indicated:
| February 1, 2017 | |||||||
| /s/ Ryan R. Marshall | /s/ Robert T. O'Shaughnessy | /s/ James L. Ossowski | |||||
| Ryan R. Marshall | Robert T. O'Shaughnessy | James L. Ossowski | |||||
| President and Chief Executive Officer (Principal Executive Officer) | Executive Vice President and Chief Financial Officer (Principal Financial Officer) | Vice President, Finance and Controller (Principal Accounting Officer) | |||||
| Brian P. Anderson | Member of Board of Directors | } | |||||
| Bryce Blair | Member of Board of Directors | } | |||||
| Richard W. Dreiling | Member of Board of Directors | } | |||||
| Richard J. Dugas, Jr. | Executive Chairman of the Board of Directors | } | /s/ Robert T. O'Shaughnessy | ||||
| Thomas J. Folliard | Member of Board of Directors | } | Robert T. O'Shaughnessy | ||||
| Joshua Gotbaum | Member of Board of Directors | } | Executive Vice President and Chief Financial Officer | ||||
| Cheryl W. Grisé | Member of Board of Directors | } | |||||
| André J. Hawaux | Member of Board of Directors | } | |||||
| Patrick J. O’Leary | Member of Board of Directors | } | |||||
| John R. Peshkin | Member of Board of Directors | } | |||||
| James J. Postl | Member of Board of Directors | } | |||||
| Scott F. Powers | Member of Board of Directors | } | |||||
| William J. Pulte | Member of Board of Directors | } | |||||