 filings.tools
Item 5. MARKET FOR THE REGISTRANT’S COMMON EQUITY, RELATED SHAREHOLDER MATTERS AND ISSUER PURCHASES OF EQUITY SECURITIES
5K characters. Original on sec.gov · Markdown
Item 5. MARKET FOR THE REGISTRANT’S COMMON EQUITY, RELATED SHAREHOLDER MATTERS AND ISSUER PURCHASES OF EQUITY SECURITIES
Our common shares are listed on the New York Stock Exchange (Symbol: PHM).
Related Shareholder Matters
The table below sets forth, for the quarterly periods indicated, the range of high and low intraday sales prices for our common shares and dividend per share information:
| December 31, 2017 | December 31, 2016 | ||||||||||||||||||||||
| High | Low | Declared Dividend | High | Low | Declared Dividend | ||||||||||||||||||
| 1st Quarter | $ | 24.05 | $ | 18.18 | $ | 0.09 | $ | 18.82 | $ | 14.61 | $ | 0.09 | |||||||||||
| 2nd Quarter | 24.73 | 21.41 | 0.09 | 19.80 | 16.60 | 0.09 | |||||||||||||||||
| 3rd Quarter | 27.51 | 23.81 | 0.09 | 22.40 | 19.04 | 0.09 | |||||||||||||||||
| 4th Quarter | 34.60 | 26.68 | 0.09 | 20.66 | 17.69 | 0.09 |
At February 1, 2018, there were 2,325 shareholders of record.
Issuer Purchases of Equity Securities
| Total number of shares purchased | Average price paid per share | Total number of shares purchased as part of publicly announced plans or programs | Approximate dollar value of shares that may yet be purchased under the plans or programs ($000’s omitted) | |||||||||||
| October 1, 2017 to October 31, 2017 | 281,900 | $ | 29.76 | 281,900 | $ | 336,561 | (1) | |||||||
| November 1, 2017 to November 30, 2017 | 2,423,700 | 32.23 | 2,423,700 | $ | 258,455 | (1) | ||||||||
| December 1, 2017 to December 31, 2017 | 4,877,262 | 33.71 | 4,865,706 | $ | 94,441 | (1) | ||||||||
| Total | 7,582,862 | $ | 33.09 | 7,571,306 |
| (1) | The Board of Directors approved a share repurchase authorization totaling $1.0 billion in July 2016, of which $94.4 million remained available as of December 31, 2017. During 2017, we repurchased 35.4 million shares under this program. In January 2018, the Board of Directors approved an increase of $500.0 million to our share repurchase authorization. There is no expiration date for this program. |
The information required by this item with respect to equity compensation plans is set forth under Item 12 of this annual report on Form 10-K and is incorporated herein by reference.
Performance Graph
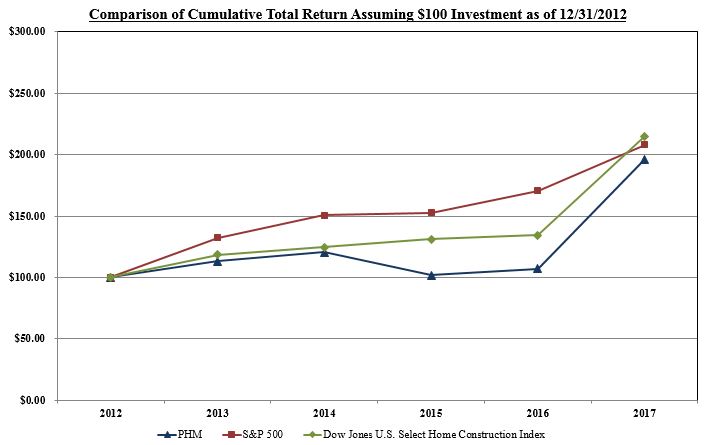
The following line graph compares, for the fiscal years ended December 31, 2013, 2014, 2015, 2016, and 2017, (a) the yearly cumulative total shareholder return (i.e., the change in share price plus the cumulative amount of dividends, assuming dividend reinvestment, divided by the initial share price, expressed as a percentage) on PulteGroup’s common shares, with (b) the cumulative total return of the Standard & Poor’s 500 Stock Index, and with (c) the Dow Jones U.S. Select Home Construction Index. The Dow Jones U.S. Select Home Construction Index is a widely-recognized index comprised primarily of large national homebuilders. We believe comparison of our shareholder return to this index represents a meaningful analysis for investors.
COMPARISON OF FIVE YEAR CUMULATIVE TOTAL RETURN*
AMONG PULTEGROUP, INC., S&P 500 INDEX, AND PEER INDEX
Fiscal Year Ended December 31, 2017
| 2012 | 2013 | 2014 | 2015 | 2016 | 2017 | |||||||||||||||||||
| PULTEGROUP, INC. | $ | 100.00 | $ | 113.15 | $ | 120.58 | $ | 101.85 | $ | 107.07 | $ | 196.37 | ||||||||||||
| S&P 500 Index - Total Return | 100.00 | 132.39 | 150.51 | 152.59 | 170.84 | 208.14 | ||||||||||||||||||
| Dow Jones U.S. Select Home Construction Index | 100.00 | 118.41 | 124.50 | 131.29 | 134.20 | 214.93 |
- Assumes $100 invested on December 31, 2012, and the reinvestment of dividends.
Previous: Item 4A. EXECUTIVE OFFICERS OF THE REGISTRANT · Next: Item 6. SELECTED FINANCIAL DATA