 filings.tools
Item 7. Management’s Discussion and Analysis of Financial Condition and Results of Operations
82K characters. Original on sec.gov · Markdown
Item 7. Management’s Discussion and Analysis of Financial Condition and Results of Operations
The following discussion should be read in conjunction with the Consolidated Financial Statements included in Item 8. Financial Statements and Supplementary Data of this report and the matters described under Item 1A. Risk Factors.
A discussion regarding our financial condition and results of operations for 2020 compared to 2019 is presented below. Information on 2018 is included in graphs only to show year over year trends in our results of operations and operating metrics. Our financial condition for 2018 and results of operations for 2018 and 2019 compared to 2018 can be found under Item 7. Management’s Discussion and Analysis of Financial Condition and Results of Operations, which is incorporated by reference herein to our Annual Report on Form 10-K for the fiscal year ended December 31, 2019, filed with the SEC on February 11, 2020, and is available on the SEC’s website at www.sec.gov and our Investor Relations website at www.ir.prologis.com.
MANAGEMENT’S OVERVIEW
Summary of 2020
Our financial condition and operating results remain strong in the COVID-19 environment and, in combination with the demand we see in our proprietary data, the pace of rent collections and dialogue with our customers, our outlook continues to improve in the first quarter of 2021. However, with the continued uncertainty across the globe until we put COVID-19 behind us, we cannot predict the impact on our business, future financial condition, and operating results.
We experienced minimal impacts from the current environment on our O&M portfolio operating fundamentals in 2020. This is the result of the high quality and location of our real estate portfolio, our customer base, favorable market fundamentals in the logistics real estate sector and significant in-place-to-market rent spreads. E-commerce continues to grow well above its historical average and customers that serve essential daily needs are thriving. Customers that have been negatively impacted by the current economy represent a minimal percentage of our annual rent. Leasing activity remained strong for the O&M portfolio throughout 2020 with the commencement of 150 million square feet of leases with an average term of 66 months, including 37 million square feet in the fourth quarter. Rent change in our O&M portfolio was 21.3% during 2020 and 23.8% in the fourth quarter. We expect market rents to continue to increase in 2021. The average number of days from lease proposal to commencement decreased since 2019 as some customers have increased the pace of activity.
We received requests from certain customers for rent concessions during 2020 and for those granted, we deferred the rental payments to a later period in 2020 or 2021. The deferral of rental payments did not impact revenue recognized from those leases. During 2020, on an O&M basis we deferred $45 million of rental payments which represented less than 1% of our total O&M annualized rental revenue. At January 25, 2021, we had collected $33 million, or 98%, of the deferred payments due at December 31st, with the remainder due in 2021. Although COVID-19 continues to have a minimal impact on our rent collections and bad debt is trending lower than we initially anticipated, we may experience an increase in bad debt.
Our capital deployment and disposition activities have continued throughout this time and we expect the volume of these activities to accelerate in 2021. By the fourth quarter of 2020, we restarted the majority of the speculative development projects that we suspended in the first quarter.
Our business continuity, communication plans and technology are allowing all functions of our business to work smoothly during this time. Generally, our employees have continued working remotely or in certain locations in our offices under protocols to keep a safe working environment. We have not had any lay-offs and we have extended financial assistance to employees in need. Our local property and leasing teams have continued to maintain our properties and work with our customers to help them navigate the new environment while following established measures to help keep them and our customers safe. In addition, we are providing assistance across the globe in the form of direct cash grants, supplies and donation of over one million square feet through our Space for Good program. In 2020, through the Prologis Foundation, we pledged $5 million to COVID-19 relief organizations and $1 million in support of racial equality causes.
We completed the following significant activities in 2020 as described in the Notes to the Consolidated Financial Statements:
| • | In January, our U.S. co-investment ventures, USLV and USLF, acquired the wholly owned real estate assets of IPT for $2.0 billion each, including the assumption and repayment of debt. As USLV is a consolidated co-investment venture, our Results of Operations section includes a discussion of the acquired properties. USLF is an unconsolidated co-investment venture and therefore the acquisition is included in the discussion of our O&M Operating Portfolio. |
|---|
| • | In February, we completed the Liberty Transaction for $13.0 billion through the issuance of equity and the assumption of debt. We assumed $2.8 billion of debt with a weighted average stated interest rate of 3.8%. We paid down $1.8 billion of the assumed debt with senior notes we issued at lower rates in February 2020, as detailed below. |
|---|
| • | We earned promotes aggregating $241 million ($164 million net of related expenses), primarily in June from our unconsolidated co-investment venture in the U.S. |
|---|
| • | We generated net proceeds of $3.0 billion and realized net gains of $717 million, principally from the contribution of properties to our unconsolidated co-investment ventures in the U.S., Europe, Mexico and Japan and dispositions to third parties in the U.S. and Europe, including a majority of the U.K. portfolio acquired in the Liberty Transaction. |
|---|
| • | Additionally, we completed the following consolidated financing activities that included the issuance of $6.2 billion and redemption of $3.0 billion of senior notes, with aggregate principal in U.S. dollars. This resulted in extending our weighted average remaining maturity to 10 years and lowering our weighted average effective interest rate to approximately 1.9% (principal in millions): |
|---|
| Aggregate Principal | Issuance Date Weighted Average | ||||||||||||||||||
|---|---|---|---|---|---|---|---|---|---|---|---|---|---|---|---|---|---|---|---|
| Initial Borrowing Date | Borrowing Currency | USD (1) | Interest Rate (2) | Term (3) | Maturity Dates | ||||||||||||||
| February (4) | € | 1,350 | $ | 1,485 | 0.6% | 10.7 | February 2022 – 2035 | ||||||||||||
| February | $ | 2,200 | $ | 2,200 | 2.4% | 15.0 | April 2027 – 2050 | ||||||||||||
| February | £ | 250 | $ | 322 | 1.9% | 15.8 | February 2035 | ||||||||||||
| June (4) | ¥ | 41,200 | $ | 386 | 1.0% | 12.4 | June 2027 – 2050 | ||||||||||||
| August (4) | $ | 1,250 | $ | 1,250 | 1.6% | 18.2 | October 2030 – 2050 | ||||||||||||
| September | ¥ | 19,700 | $ | 187 | 1.0% | 14.1 | September 2032 – 2040 | ||||||||||||
| December | € | 300 | $ | 365 | 0.0% | 2.0 | December 2022 | ||||||||||||
| Aggregate Principal | Redemption Date Weighted Average | ||||||||||||||||||
| Redemption Date | Borrowing Currency | USD (1) | Interest Rate (2) | Term (3) | Maturity Date | ||||||||||||||
| January | € | 400 | $ | 446 | 0.0% | 0.1 | January 2020 | ||||||||||||
| March | € | 700 | $ | 783 | 1.4% | 1.2 | May 2021 | ||||||||||||
| June | € | 213 | $ | 238 | 3.0% | 1.6 | January 2022 | ||||||||||||
| June | € | 100 | $ | 113 | 3.4% | 3.6 | February 2024 | ||||||||||||
| September | $ | 850 | $ | 850 | 4.3% | 2.9 | August 2023 | ||||||||||||
| December | € | 485 | $ | 596 | 3.0% | 1.1 | January 2022 |
| (1) | The exchange rate used to calculate into U.S. dollars was the spot rate at the settlement date. |
|---|
| (2) | The interest rate represents the fixed or variable interest rate at the issuance or redemption date of the related debt. |
|---|
| (3) | The issuance date and redemption date weighted average term represent the remaining maturity in years on the related debt at the issuance or redemption date, respectively. |
|---|
| (4) | Approximately $1.5 billion of the proceeds from the issuance of these notes were to fund sustainable and environmentally beneficial projects and buildings in accordance with our green bond framework. |
|---|
In February 2020, we completed an exchange offer for two series of Liberty’s senior notes for an aggregate amount of $750 million, with $690 million, or 92.0%, of the aggregate principal amount being validly tendered for exchange. These senior notes are included in the aggregate principal amounts of $400 million due in October 2026 with an interest rate of 3.3% and $350 million due in February 2029 with an interest rate of 4.4%. The senior notes were exchanged for notes issued by a wholly owned subsidiary and guaranteed by the OP. All other terms of the exchanged Liberty senior notes remained substantially the same.
At December 31, 2020, we had total available liquidity of $4.8 billion, principally due to current aggregate availability under our credit facilities of $3.9 billion and unrestricted cash balances of $598 million.
RESULTS OF OPERATIONS
We evaluate our business operations based on the NOI of our two operating segments: Real Estate Operations and Strategic Capital. NOI by segment is a non-GAAP performance measure that is calculated using revenues and expenses directly from our financial statements. We consider NOI by segment to be an appropriate supplemental measure of our performance because it helps management and investors understand our operating results.
Below is a reconciliation of our NOI by segment to Operating Income per the Consolidated Financial Statements (in millions). Each segment’s NOI is reconciled to a line item in the Consolidated Financial Statements in their respective segment discussions below.
| 2020 | 2019 | |||||||
|---|---|---|---|---|---|---|---|---|
| Real Estate Operations – NOI | $ | 2,820 | $ | 2,091 | ||||
| Strategic Capital – NOI | 419 | 307 | ||||||
| General and administrative expenses | (275 | ) | (266 | ) | ||||
| Depreciation and amortization expenses | (1,562 | ) | (1,140 | ) | ||||
| Operating income before gains on real estate transactions, net | 1,402 | 992 | ||||||
| Gains on dispositions of development properties and land, net | 465 | 468 | ||||||
| Gains on other dispositions of investments in real estate, net | 252 | 390 | ||||||
| Operating income | $ | 2,119 | $ | 1,850 | ||||
See Note 17 to the Consolidated Financial Statements for more information on our segments and a reconciliation of each business segment’s NOI to Operating Income and Earnings Before Income Taxes.
Real Estate Operations
This operating segment principally includes rental revenue and rental expenses recognized from our consolidated properties. We allocate the costs of our property management and leasing functions to the Real Estate Operations segment through Rental Expenses and the Strategic Capital segment through Strategic Capital Expenses based on the square footage of the relative portfolios. In addition, this segment is impacted by our development, acquisition and disposition activities.
Below are the components of Real Estate Operations revenues, expenses and NOI (in millions), derived directly from the Consolidated Financial Statements.
| 2020 | 2019 | |||||||
|---|---|---|---|---|---|---|---|---|
| Rental revenues | $ | 3,791 | $ | 2,832 | ||||
| Development management and other revenues | 11 | 6 | ||||||
| Rental expenses | (952 | ) | (734 | ) | ||||
| Other expenses | (30 | ) | (13 | ) | ||||
| Real Estate Operations – NOI | $ | 2,820 | $ | 2,091 |
The change in Real Estate Operations NOI in 2020 compared to 2019 was impacted by the following items (dollars in millions):
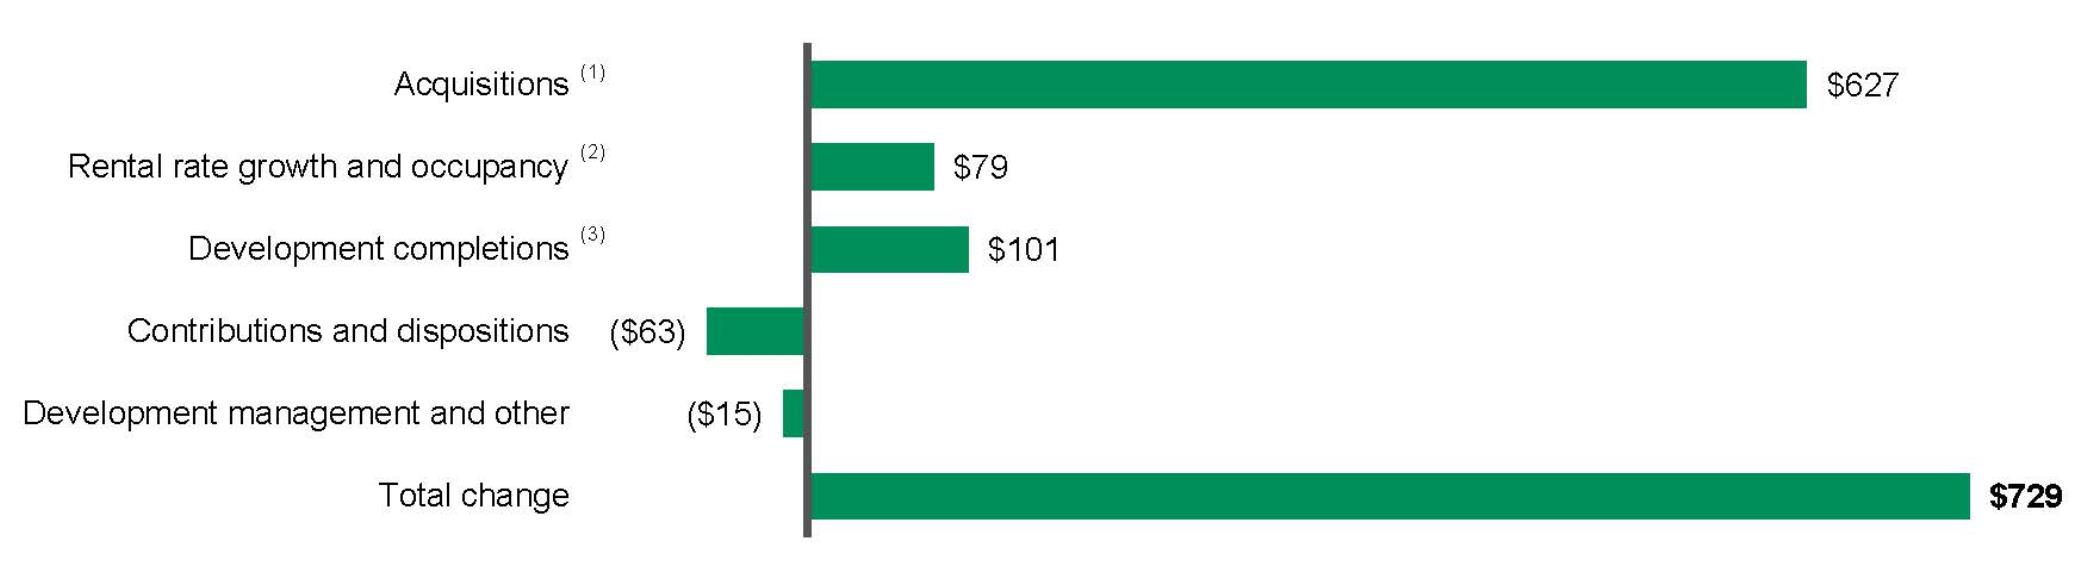
| (1) | Acquisition activity increased NOI in 2020, compared to 2019, principally due to the IPT Transaction and the Liberty Transaction. |
|---|
| (2) | During both years, we experienced positive rental rate growth. Rental rate growth is a combination of higher rental rates on rollover of leases (or rent change) and contractual rent increases on existing leases. If a lease has a contractual rent increase driven by a metric that is not known at the time the lease commences, such as the consumer price index or a similar metric, the rent increase is not included in rent leveling and therefore, impacts the rental revenue we recognize. See below for key metrics on rent change on rollover and occupancy for the consolidated operating portfolio. |
|---|
| (3) | We calculate changes in NOI from development completions period over period by comparing the change in NOI generated on the pool of developments that completed on or after January 1, 2019 through December 31, 2020. |
|---|
Below are key operating metrics of our consolidated operating portfolio, which excludes non-strategic industrial properties.
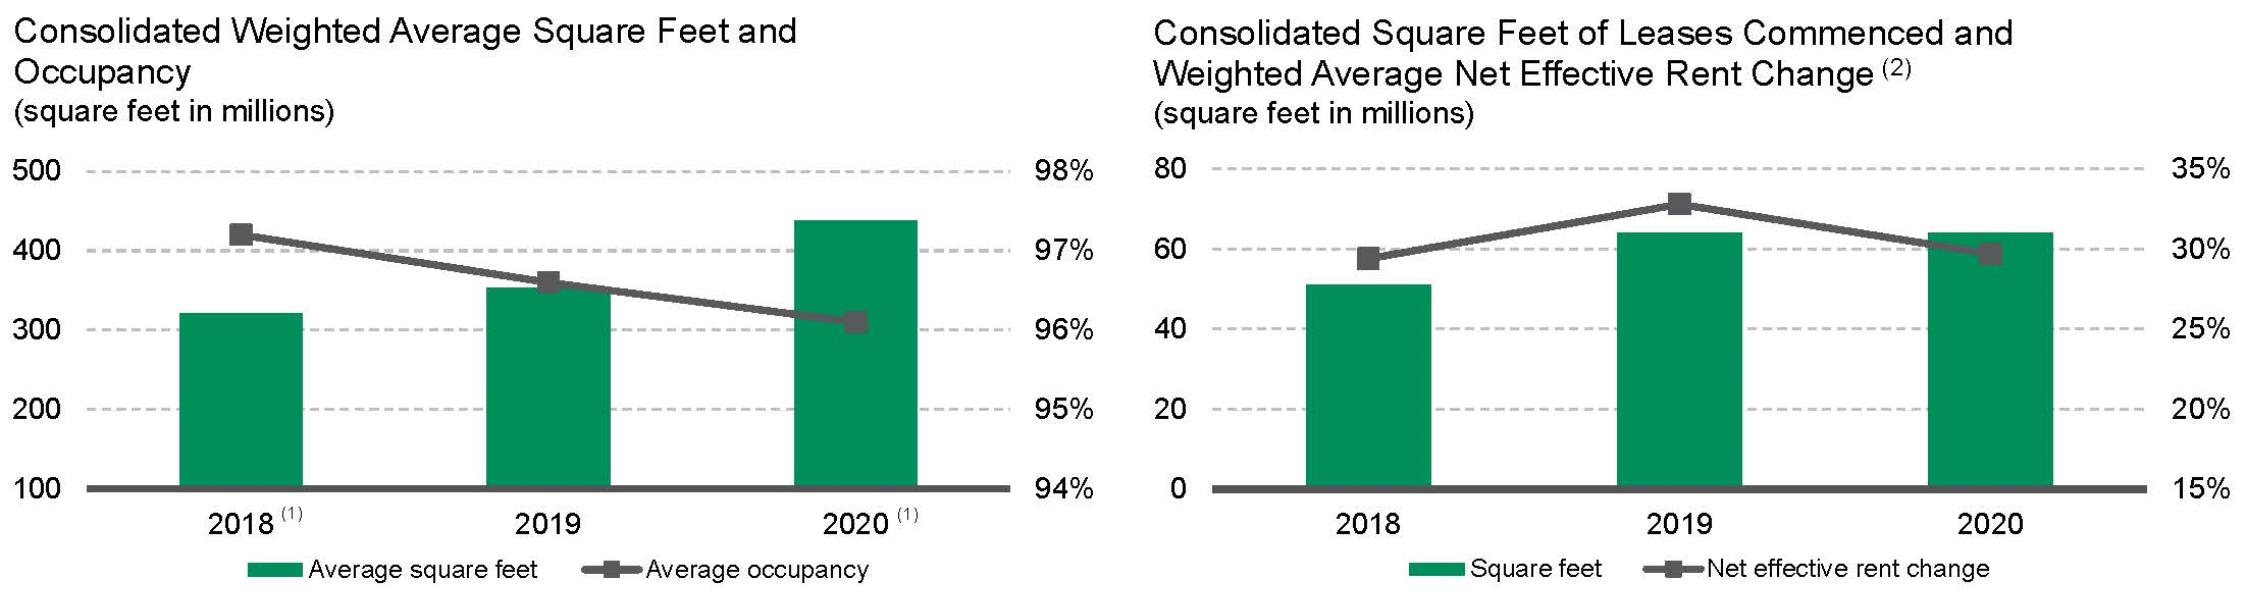
| (1) | In August 2018, we completed the acquisition of DCT Industrial Trust Inc. and DCT Industrial Operating Partnership LP (collectively “DCT” or the “DCT Transaction”) and acquired a portfolio of logistics real estate assets aggregating 68 million square feet. In January and February 2020, we completed the IPT Transaction and the Liberty Transaction, respectively. |
|---|
| (2) | Consolidated square feet of leases commenced and weighted average net effective rent change were calculated for leases with initial terms of one year or greater. |
|---|
Development Activity
The following table summarizes consolidated development activity (dollars and square feet in millions):
| 2020 | 2019 | |||||||
|---|---|---|---|---|---|---|---|---|
| Starts: | ||||||||
| Number of new development projects during the period | 42 | 74 | ||||||
| Square feet | 14 | 25 | ||||||
| TEI | $ | 1,997 | $ | 2,741 | ||||
| Percentage of build-to-suits based on TEI | 40.0 | % | 44.0 | % | ||||
| Stabilizations: | ||||||||
| Number of development projects stabilized during the period | 66 | 72 | ||||||
| Square feet | 23 | 26 | ||||||
| TEI | $ | 2,451 | $ | 2,422 | ||||
| Percentage of build-to-suits based on TEI | 48.9 | % | 36.9 | % | ||||
| Weighted average stabilized yield (1) | 6.3 | % | 6.3 | % | ||||
| Estimated value at completion | $ | 3,383 | $ | 3,313 | ||||
| Estimated weighted average margin | 38.0 | % | 36.8 | % |
| (1) | We calculate the weighted average stabilized yield as estimated NOI assuming stabilized occupancy divided by TEI. |
|---|
In the first quarter of 2020, we suspended several recently started speculative development projects for the short-term. Most of the suspended projects were restarted by the fourth quarter of 2020. At December 31, 2020, the outstanding suspended development projects had a TEI of $82 million and remain within our consolidated development portfolio. The remaining active consolidated development portfolio, including properties under development and prestabilized properties, is expected to be completed before August 2022 with a TEI of $3.7 billion, leaving $1.8 billion remaining to be spent, and was 61.6% leased. We expect our development activities to accelerate in 2021. For additional information on our development portfolio at December 31, 2020, see Item 2. Properties.
Capital Expenditures
We capitalize costs incurred in renovating, improving and leasing our operating properties as part of the investment basis or within other assets. The following graph summarizes our total capital expenditures, excluding development costs, and property improvements per average square foot of our consolidated operating properties during each year:
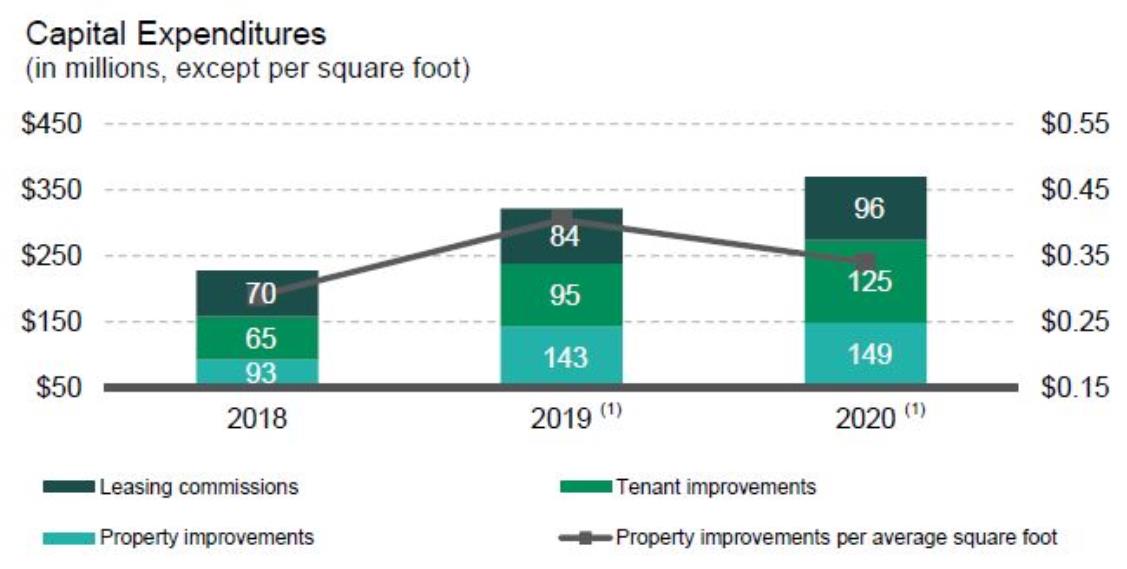
| (1) | Our capital expenditures have increased due to our larger portfolio as a result of acquisition activity discussed above. |
|---|
Strategic Capital
This operating segment includes revenues from asset and property management, other fees for services performed and promote revenue earned from the unconsolidated entities. Revenues associated with the Strategic Capital segment fluctuate because of changes in the size of the portfolios through acquisitions and dispositions, the fair value of the properties and other transactional activity including foreign currency exchange rates and timing of promotes. These revenues are reduced by the direct costs associated with the asset and property-level management expenses for the properties owned by these ventures. We allocate the costs of our property management and leasing functions to the Strategic Capital segment through Strategic Capital Expenses and to the Real Estate Operations segment through Rental Expenses based on the square footage of the relative portfolios.
Below are the components of Strategic Capital revenues, expenses and NOI, derived directly from the Consolidated Financial Statements (in millions):
| 2020 | 2019 | |||||||
|---|---|---|---|---|---|---|---|---|
| Strategic capital revenues | $ | 637 | $ | 492 | ||||
| Strategic capital expenses | (218 | ) | (185 | ) | ||||
| Strategic Capital – NOI | $ | 419 | $ | 307 | ||||
Below is additional detail of our Strategic Capital revenues, expenses and NOI (in millions):
| U.S. (1) | Other Americas | Europe | Asia | Total | |||||||||||||||||||||||||||||||||||||
|---|---|---|---|---|---|---|---|---|---|---|---|---|---|---|---|---|---|---|---|---|---|---|---|---|---|---|---|---|---|---|---|---|---|---|---|---|---|---|---|---|---|
| 2020 | 2019 | 2020 | 2019 | 2020 | 2019 | 2020 | 2019 | 2020 | 2019 | ||||||||||||||||||||||||||||||||
| Strategic capital revenues ($) | |||||||||||||||||||||||||||||||||||||||||
| Recurring fees (2) | 111 | 75 | 32 | 31 | 120 | 106 | 68 | 56 | 331 | 268 | |||||||||||||||||||||||||||||||
| Transactional fees (3) | 16 | 11 | 5 | 5 | 20 | 17 | 26 | 25 | 67 | 58 | |||||||||||||||||||||||||||||||
| Promote revenue (4) | 228 | - | 1 | 5 | 5 | 161 | 5 | - | 239 | 166 | |||||||||||||||||||||||||||||||
| Total strategic capital revenues ($) | 355 | 86 | 38 | 41 | 145 | 284 | 99 | 81 | 637 | 492 | |||||||||||||||||||||||||||||||
| Strategic capital expenses ($) (4) | (118 | ) | (97 | ) | (13 | ) | (14 | ) | (45 | ) | (38 | ) | (42 | ) | (36 | ) | (218 | ) | (185 | ) | |||||||||||||||||||||
| Strategic Capital - NOI ($) | 237 | (11 | ) | 25 | 27 | 100 | 246 | 57 | 45 | 419 | 307 | ||||||||||||||||||||||||||||||
| (1) | The U.S. expenses include compensation, personnel costs and PPP awards for employees who were based in the U.S. but also support other geographies. |
|---|
| (2) | Recurring fees include asset and property management fees. The increase in the U.S. is primarily due to the IPT Transaction. |
|---|
| (3) | Transactional fees include leasing commissions and acquisition, disposition, development and other fees. |
|---|
| (4) | We generally earn promote revenue directly from third-party investors in the co-investment ventures based on cumulative returns over a three-year period. Approximately 40% of the promote earned by us is paid to our employees as a combination of cash and stock awards pursuant to the terms of the PPP and expensed through Strategic Capital Expenses, as vested. For discussion on PPP awards, see Note 12 to the Consolidated Financial Statements. |
|---|
The following real estate investments were held through our unconsolidated co-investment ventures based on the historical cost at December 31 (dollars and square feet in millions):
| U.S. | Other Americas (1) | Europe | Asia | Total | ||||||||||||||||||||||||||||||||||||
|---|---|---|---|---|---|---|---|---|---|---|---|---|---|---|---|---|---|---|---|---|---|---|---|---|---|---|---|---|---|---|---|---|---|---|---|---|---|---|---|---|
| 2020 | 2019 | 2020 | 2019 | 2020 | 2019 | 2020 | 2019 | 2020 | 2019 | |||||||||||||||||||||||||||||||
| Ventures | 1 | 1 | 2 | 2 | 3 | 3 | 3 | 3 | 9 | 9 | ||||||||||||||||||||||||||||||
| Operating properties | 706 | 605 | 229 | 214 | 768 | 731 | 167 | 144 | 1,870 | 1,694 | ||||||||||||||||||||||||||||||
| Square feet | 117 | 99 | 51 | 44 | 185 | 176 | 67 | 59 | 420 | 378 | ||||||||||||||||||||||||||||||
| Total assets ($) (2) | 10,840 | 8,408 | 3,023 | 2,707 | 16,918 | 14,677 | 10,209 | 8,758 | 40,990 | 34,550 | ||||||||||||||||||||||||||||||
| (1) | PBLV and our other Brazilian joint ventures are combined as one venture for the purpose of this table. |
|---|
| (2) | The increase in total assets across all geographies was principally due to acquisitions, including IPT in the U.S., and movement in foreign currency exchange rates. |
|---|
See Note 5 to the Consolidated Financial Statements for additional information on our unconsolidated co-investment ventures.
G&A Expenses
G&A expenses were $275 million and $266 million for 2020 and 2019, respectively. Included in 2020 was a contribution of $5 million to the Prologis Foundation for donations to COVID-19 relief organizations. We capitalize certain internal costs, including salaries and related expenses, directly related to our development activities.
The following table summarizes capitalized G&A amounts (in millions):
| 2020 | 2019 | |||||||
|---|---|---|---|---|---|---|---|---|
| Building and land development activities | $ | 73 | $ | 68 | ||||
| Operating building improvements and other | 23 | 20 | ||||||
| Total capitalized G&A expenses | $ | 96 | $ | 88 | ||||
| Capitalized salaries and related costs as a percent of total salaries and related costs | 20.2 | % | 19.5 | % |
Depreciation and Amortization Expenses
Depreciation and amortization expenses were $1.6 billion and $1.1 billion for 2020 and 2019, respectively.
The following table highlights the key changes in depreciation and amortization expenses in 2020 as compared to 2019 (dollars in millions):
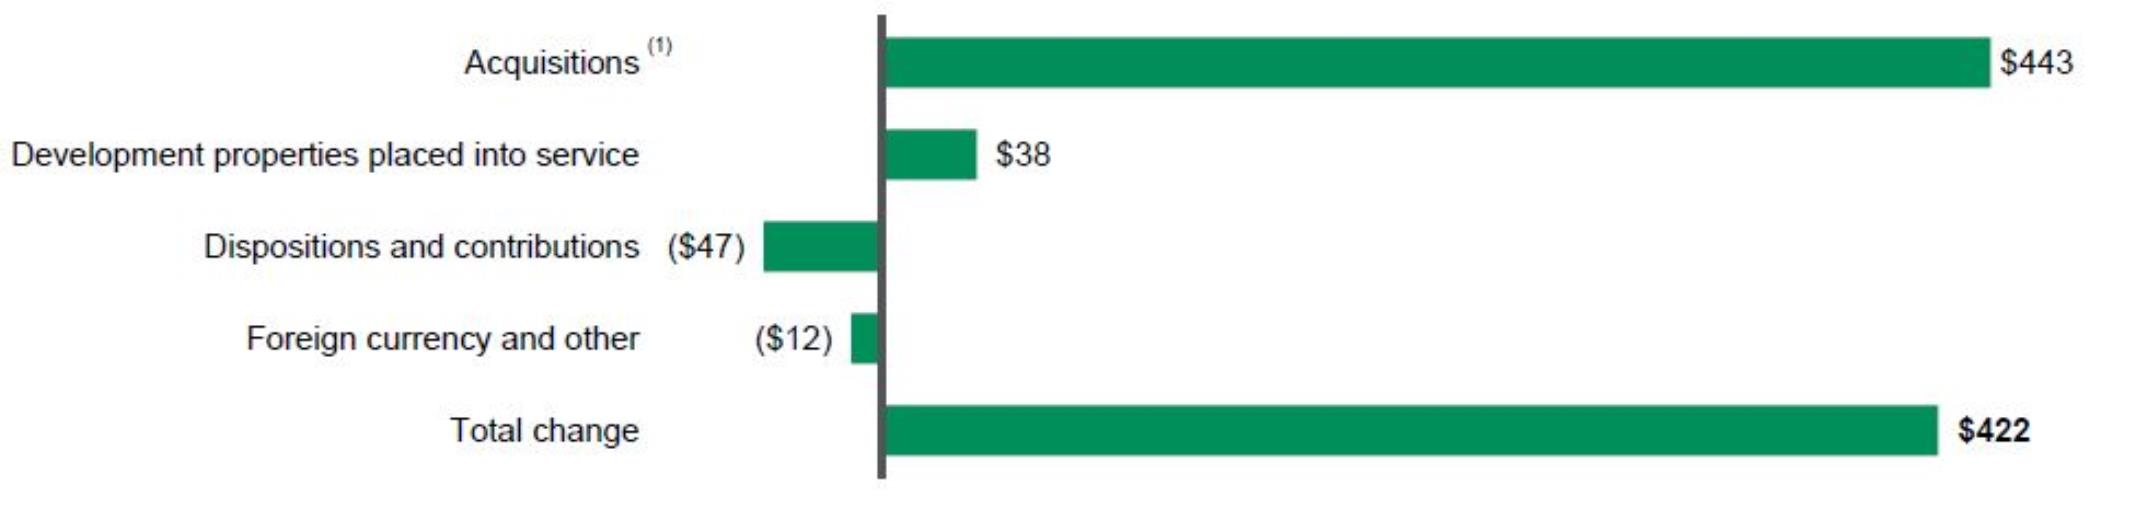
| (1) | Included in acquisitions are the operating properties, other real estate properties and related lease intangible assets acquired in the Liberty Transaction and the IPT Transaction. |
|---|
Gains on Real Estate Transactions, Net
The following table summarizes our Gains on Dispositions of Development Properties and Land, Net, which primarily includes contributions to our unconsolidated entities, and Gains on Other Dispositions of Investments in Real Estate, Net, which includes sales of operating properties and other real estate transactions, for the years ended December 31 (in millions):
| 2020 | 2019 | |||||||
|---|---|---|---|---|---|---|---|---|
| Gains on dispositions of development properties and land, net | ||||||||
| Contributions to unconsolidated entities and dispositions to third parties | $ | 465 | $ | 468 | ||||
| Total gains on dispositions of development properties and land, net | $ | 465 | $ | 468 | ||||
| Gains on other dispositions of investments in real estate, net | ||||||||
| Contributions to unconsolidated entities and dispositions to third parties | $ | 252 | $ | 255 | ||||
| Gains on partial redemption of investment in an unconsolidated co-investment venture | - | 135 | ||||||
| Total gains on other dispositions of investments in real estate, net | $ | 252 | $ | 390 |
We utilized the proceeds from these transactions primarily to fund our capital investments during both periods. See Note 4 to the Consolidated Financial Statements for further information on these transactions.
Our Owned and Managed (“O&M”) Operating Portfolio
We manage our business and review our operating fundamentals on an O&M basis, which includes properties wholly owned by us or owned by one of our co-investment ventures. We believe reviewing the fundamentals this way allows management to understand the entire impact to the financial statements, as it will affect both the Real Estate Operations and Strategic Capital segments, as well as the net earnings we recognize from our unconsolidated co-investment ventures based on our ownership. We do not control the unconsolidated co-investment ventures for purposes of GAAP and the presentation of the ventures’ operating information does not represent a legal claim.
Our O&M operating portfolio does not include our development portfolio, value-added properties, non-industrial properties or properties we do not have the intent to hold long-term that are classified as either held for sale or within other real estate investments. Value-added properties are properties that are expected to be repurposed or redeveloped to a higher and better use and recently acquired properties that present opportunities to create greater value. See below for information on our O&M operating portfolio at December 31 (square feet in millions):
| 2020 | 2019 | ||||||||||||||||||||||
|---|---|---|---|---|---|---|---|---|---|---|---|---|---|---|---|---|---|---|---|---|---|---|---|
| Number of Properties | Square Feet | Percentage Occupied | Number of Properties | Square Feet | Percentage Occupied | ||||||||||||||||||
| Consolidated | 2,252 | 441 | 96.6 | % | 1,882 | 359 | 96.1 | % | |||||||||||||||
| Unconsolidated | 1,849 | 416 | 95.9 | % | 1,676 | 376 | 96.8 | % | |||||||||||||||
| Total | 4,101 | 857 | 96.2 | % | 3,558 | 735 | 96.5 | % |
Below are the key operating metrics summarizing the leasing activity of our O&M operating portfolio.

| (1) | Square feet of leases commenced and weighted average net effective rent change were calculated for leases with initial terms of one year or greater. We retained more than 70% of our customers, based on the total square feet of leases commenced, for each year. |
|---|
| (2) | Turnover costs include external leasing commissions and tenant improvements and represent the obligations incurred in connection with the lease commencement for leases greater than one year. In 2020 and 2019, turnover costs per square foot increased, however, due to the longer terms and higher rents on leases commenced, this resulted in a lower cost as a percentage of lease value. |
|---|
Same Store Analysis
Our same store metrics are non-GAAP financial measures, which are commonly used in the real estate industry and expected from the financial community, on both a net effective and cash basis. We evaluate the performance of the operating properties we own and manage using a “same store” analysis because the population of properties in this analysis is consistent from period to period, which allows us and investors to analyze our ongoing business operations. We determine our same store metrics on property NOI, which is calculated as rental revenue less rental expense for the applicable properties in the same store population for both consolidated and unconsolidated properties based on our ownership interest, as further defined below.
We define our same store population for the three months ended December 31, 2020 as the properties in our O&M operating portfolio, including the property NOI for both consolidated properties and properties owned by the unconsolidated co-investment ventures at January 1, 2019 and owned throughout the same three-month period in both 2019 and 2020. We believe the drivers of property NOI for the consolidated portfolio are generally the same for the properties owned by the ventures in which we invest and therefore we evaluate the same store metrics of the O&M portfolio based on Prologis’ ownership in the properties (“Prologis Share”). The same store population excludes properties held for sale to third parties, along with development properties that were not stabilized at the beginning of the period (January 1, 2019) and properties acquired or disposed of to third parties during the period. To derive an appropriate measure of period-to-period operating performance, we remove the effects of foreign currency exchange rate movements by using the reported period-end exchange rate to translate from local currency into the U.S. dollar, for both periods.
As non-GAAP financial measures, the same store metrics have certain limitations as an analytical tool and may vary among real estate companies. As a result, we provide a reconciliation of Rental Revenues less Rental Expenses (“Property NOI”) (from our Consolidated Financial Statements prepared in accordance with U.S. GAAP) to our Same Store Property NOI measures.
We evaluate the results of our same store portfolio on a quarterly basis. The following is a reconciliation of our consolidated rental revenues, rental expenses and property NOI for each quarter in 2020 and 2019 to the full year, as included in the Consolidated Statements of Income and within Note 19 to the Consolidated Financial Statements and to the respective amounts in our same store portfolio analysis for the three months ended December 31 (dollars in millions):
| Three Months Ended | ||||||||||||||||||||
|---|---|---|---|---|---|---|---|---|---|---|---|---|---|---|---|---|---|---|---|---|
| March 31, | June 30, | September 30, | December 31, | Full Year | ||||||||||||||||
| 2020 | ||||||||||||||||||||
| Rental revenues | $ | 879 | $ | 944 | $ | 980 | $ | 988 | $ | 3,791 | ||||||||||
| Rental expenses | (228 | ) | (232 | ) | (245 | ) | (247 | ) | (952 | ) | ||||||||||
| Property NOI | $ | 651 | $ | 712 | $ | 735 | $ | 741 | $ | 2,839 | ||||||||||
| 2019 | ||||||||||||||||||||
| Rental revenues | $ | 697 | $ | 701 | $ | 711 | $ | 723 | $ | 2,832 | ||||||||||
| Rental expenses | (188 | ) | (181 | ) | (181 | ) | (184 | ) | (734 | ) | ||||||||||
| Property NOI | $ | 509 | $ | 520 | $ | 530 | $ | 539 | $ | 2,098 |
| Three Months Ended December 31, | |||||||||||
|---|---|---|---|---|---|---|---|---|---|---|---|
| 2020 | 2019 | % Change | |||||||||
| Reconciliation of Consolidated Property NOI to Same Store Property NOI measures: | |||||||||||
| Rental revenues | $ | 988 | $ | 723 | |||||||
| Rental expenses | (247 | ) | (184 | ) | |||||||
| Consolidated Property NOI | $ | 741 | $ | 539 | |||||||
| Adjustments to derive same store results: | |||||||||||
| Property NOI from consolidated properties not included in same store portfolio and other adjustments (1)(2) | (253 | ) | (61 | ) | |||||||
| Property NOI from unconsolidated co-investment ventures included in same store portfolio (1)(2) | 515 | 493 | |||||||||
| Third parties' share of Property NOI from properties included in same store portfolio (1)(2) | (415 | ) | (403 | ) | |||||||
| Prologis Share of Same Store Property NOI – Net Effective (2) | $ | 588 | $ | 568 | 3.5 | % | |||||
| Consolidated properties straight-line rent and fair value lease adjustments included in same store portfolio (3) | (11 | ) | (9 | ) | |||||||
| Unconsolidated co-investment ventures straight-line rent and fair value lease adjustments included in same store portfolio (3) | (11 | ) | (7 | ) | |||||||
| Third parties' share of straight-line rent and fair value lease adjustments included in same store portfolio (2)(3) | 9 | 6 | |||||||||
| Prologis Share of Same Store Property NOI – Cash (2)(3) | $ | 575 | $ | 558 | 3.0 | % |
| (1) | We exclude properties held for sale to third parties, along with development properties that were not stabilized at the beginning of the period and properties acquired or disposed of to third parties during the period. We also exclude net termination and renegotiation fees to allow us to evaluate the growth or decline in each property’s rental revenues without regard to one-time items that are not indicative of the property’s recurring operating performance. Net termination and renegotiation fees represent the gross fee negotiated to allow a customer to terminate or renegotiate their lease, offset by the write-off of the asset recorded due to the adjustment to straight-line rents over the lease term. Same Store Property NOI is adjusted to include an allocation of property management expenses for our consolidated properties based on the property management services provided to each property (generally, based on a percentage of revenues). On consolidation, these amounts are eliminated and the actual costs of providing property management services are recognized as part of our consolidated rental expense. |
|---|
| (2) | We include the Property NOI for the same store portfolio for both consolidated properties and properties owned by the co-investment ventures based on our investment in the underlying properties. In order to calculate our share of Same Store Property NOI from the co-investment ventures in which we own less than 100%, we use the co-investment ventures’ underlying Property NOI for the same store portfolio and apply our ownership percentage at December 31, 2020 to the Property NOI for both periods, including the properties contributed during the period. We adjust the total Property NOI from the same store portfolio of the co-investment ventures by subtracting the third parties’ share of both consolidated and unconsolidated co-investment ventures. |
|---|
During the periods presented, certain wholly owned properties were contributed to a co-investment venture and are included in the same store portfolio. Neither our consolidated results nor those of the co-investment ventures, when viewed individually, would be comparable on a same store basis because of the changes in composition of the respective portfolios from period to period (e.g. the results of a contributed property are included in our consolidated results through the contribution date and in the results of the venture subsequent to the contribution date based on our ownership interest at the end of the period). As a result, only line items labeled “Prologis Share of Same Store Property NOI” are comparable period over period.
| (3) | We further remove certain noncash items (straight-line rent and amortization of fair value lease adjustments) included in the financial statements prepared in accordance with U.S. GAAP to reflect a Same Store Property NOI – Cash measure. |
|---|
We manage our business and compensate our executives based on the same store results of our O&M portfolio at 100% as we manage our portfolio on an ownership blind basis. We calculate those results by including 100% of the properties included in our same store portfolio.
Other Components of Income (Expense)
Earnings from Unconsolidated Entities, Net
We recognized net earnings from unconsolidated entities, which are accounted for using the equity method, of $297 million and $200 million during 2020 and 2019, respectively. The earnings we recognize can be impacted by: (i) variances in revenues and expenses of each venture; (ii) the size and occupancy rate of the portfolio of properties owned by each venture; (iii) gains or losses from the dispositions of properties and extinguishment of debt; (iv) our ownership interest in each venture; and (v) fluctuations in foreign currency exchange rates used to translate our share of net earnings to U.S. dollars.
See the discussion of our unconsolidated entities above in the Strategic Capital segment discussion and in Note 5 to the Consolidated Financial Statements for a further breakdown of our share of net earnings recognized.
Interest Expense
The following table details our net interest expense (dollars in millions):
| 2020 | 2019 | |||||||
|---|---|---|---|---|---|---|---|---|
| Gross interest expense | $ | 348 | $ | 271 | ||||
| Amortization of debt discount and debt issuance costs, net | 9 | 17 | ||||||
| Capitalized amounts | (42 | ) | (48 | ) | ||||
| Net interest expense | $ | 315 | $ | 240 | ||||
| Weighted average effective interest rate during the year | 2.2 | % | 2.4 | % |
Interest expense increased due to higher debt balances in 2020 as compared to 2019, driven primarily by the issuance of senior notes and debt assumed in the Liberty Transaction, reduced partially by lower interest rates as a result of our refinancing activities as discussed under the Summary of 2020 section.
See Note 8 to the Consolidated Financial Statements and the Liquidity and Capital Resources section, for further discussion of our debt and borrowing costs.
Foreign Currency and Derivative Gains (Losses), Net
We are exposed to foreign currency exchange risk related to investments in and earnings from our foreign investments. We may use derivative financial instruments to manage foreign currency exchange rate risk. We recognize the change in fair value of the undesignated derivative contracts in unrealized gains and losses. Upon settlement of these transactions, we recognize realized gains or losses.
We primarily hedge our foreign currency risk by borrowing in the currencies in which we invest thereby providing a natural hedge. We have issued debt in a currency that is not the same functional currency of the borrowing entity and have designated a portion of the debt as a nonderivative net investment hedge. We recognize the remeasurement and settlement of the unhedged portion of the debt and accrued interest in unrealized gains or losses.
The following table details our foreign currency and derivative gains (losses), net included in earnings (in millions):
| 2020 | 2019 | |||||||
|---|---|---|---|---|---|---|---|---|
| Realized foreign currency and derivative gains (losses), net: | ||||||||
| Gains (losses) on the settlement of undesignated derivatives | $ | (6 | ) | $ | 28 | |||
| Gains on the settlement of transactions with third parties | - | 1 | ||||||
| Total realized foreign currency and derivative gains (losses), net | (6 | ) | 29 | |||||
| Unrealized foreign currency and derivative gains (losses), net: | ||||||||
| Losses on the change in fair value of undesignated derivatives and unhedged debt | (152 | ) | (74 | ) | ||||
| Gains (losses) on remeasurement of certain assets and liabilities | (9 | ) | 3 | |||||
| Total unrealized foreign currency and derivative losses, net | (161 | ) | (71 | ) | ||||
| Total foreign currency and derivative losses, net | $ | (167 | ) | $ | (42 | ) |
See Note 2 to the Consolidated Financial Statements for more information about our foreign currency and derivative financial instrument policies and Note 15 to the Consolidated Financial Statements for more information about our derivative and nonderivative transactions.
Losses on Early Extinguishment of Debt, Net
As discussed above, during 2020 we issued $6.2 billion of senior notes, aggregate principal in U.S. dollars, and used the proceeds to redeem certain higher interest rate debt before maturity. This resulted in extending our weighted average remaining maturity to 10 years and lowering our weighted average effective interest rate to approximately 1.9% at December 31, 2020 and the recognition of losses on early extinguishment of debt of $188 million during 2020. The losses included the extinguishment of debt assumed in the Liberty Transaction and the IPT Transaction, which represented the excess of the prepayment penalties over the premium recorded upon assumption of the debt. During 2019 we recognized $16 million of losses on early extinguishment of debt. See Note 8 to the Consolidated Financial Statements and the Liquidity and Capital Resources section, for more information regarding our debt repurchases.
Income Tax Expense
We recognize income tax expense related to our taxable REIT subsidiaries and in the local, state and foreign jurisdictions in which we operate. Our current income tax expense fluctuates from period to period based primarily on the timing of our taxable income, including
gains on the disposition and contribution of properties and fees earned from the co-investment ventures. Deferred income tax expense (benefit) is generally a function of the period’s temporary differences and the utilization of net operating losses generated in prior years that had been previously recognized as deferred income tax assets in taxable subsidiaries.
The following table summarizes our income tax expense (benefit) (in millions):
| 2020 | 2019 | |||||||
|---|---|---|---|---|---|---|---|---|
| Current income tax expense: | ||||||||
| Income tax expense | $ | 83 | $ | 48 | ||||
| Income tax expense on dispositions | 41 | 15 | ||||||
| Income tax expense on dispositions related to acquired tax liabilities | 6 | - | ||||||
| Total current income tax expense | 130 | 63 | ||||||
| Deferred income tax expense (benefit): | ||||||||
| Income tax expense | 6 | 12 | ||||||
| Income tax benefit on dispositions related to acquired tax liabilities | (6 | ) | - | |||||
| Total deferred income tax expense | - | 12 | ||||||
| Total income tax expense | $ | 130 | $ | 75 |
Our income taxes are discussed in more detail in Note 13 to the Consolidated Financial Statements.
Net Earnings Attributable to Noncontrolling Interests
This amount represents the third-party investors’ share of the earnings generated in consolidated entities in which we do not own 100% of the equity, reduced by the third-party share of fees or promotes payable to us and earned during the period. We had net earnings attributable to noncontrolling interests of $135 million and $129 million in 2020 and 2019, respectively. Included in these amounts were $42 million and $47 million in 2020 and 2019, respectively, of net earnings attributable to the common limited partnership unitholders of Prologis, L.P.
See Note 11 to the Consolidated Financial Statements for further information on our noncontrolling interests.
Other Comprehensive Income (Loss)
See Note 2 to the Consolidated Financial Statements for more information about our foreign currency and derivative financial instrument policies and Note 15 to the Consolidated Financial Statements for more information about our derivative and nonderivative transactions and other comprehensive income (loss).
ENVIRONMENTAL MATTERS
See Note 16 in the Consolidated Financial Statements for further information about environmental liabilities.
LIQUIDITY AND CAPITAL RESOURCES
Overview
We consider our ability to generate cash from operating activities, distributions from our co-investment ventures, contributions and dispositions of properties and available financing sources to be adequate to meet our anticipated future development, acquisition, operating, debt service, dividend and distribution requirements.
Near-Term Principal Cash Sources and Uses
In addition to dividends and distributions, we expect our primary cash needs will consist of the following:
| • | completion of the development and leasing of the properties in our active consolidated development portfolio (at December 31, 2020, 82 properties in our development portfolio were 61.6% leased with a current investment of $1.9 billion and a TEI of $3.7 billion when completed and leased, leaving $1.8 billion of estimated additional required investment); |
|---|
| • | development of new properties that we may hold for long-term investment or subsequently contribute to unconsolidated co-investment ventures, including the acquisition of land in certain markets; |
|---|
| • | capital expenditures and leasing costs on properties in our operating portfolio; |
|---|
| • | repayment of debt and scheduled principal payments of $376 million in 2021; |
|---|
| • | additional investments in current and future unconsolidated co-investment ventures and other ventures; |
|---|
| • | acquisition of operating properties or portfolios of operating properties, (depending on market and other conditions) for direct, long-term investment in our consolidated portfolio (this might include acquisitions from our co-investment ventures); and |
|---|
| • | repurchase of our outstanding debt or equity securities (depending on prevailing market conditions, our liquidity, contractual restrictions and other factors) through cash purchases, open-market purchases, privately negotiated transactions, tender offers or otherwise. |
|---|
We expect to fund our cash needs principally from the following sources (subject to market conditions):
| • | net cash flow from property operations; |
|---|
| • | fees earned for services performed on behalf of co-investment ventures, including promotes; |
|---|
| • | distributions received from co-investment ventures; |
|---|
| • | proceeds from disposition of properties, land parcels or other investments to third parties; |
|---|
| • | proceeds from contributions of properties to current or future co-investment ventures; |
|---|
| • | available unrestricted cash balances ($598 million at December 31, 2020); |
|---|
| • | borrowing capacity under our current credit facility arrangements and multi-currency term loan ($4.2 billion available at December 31, 2020); |
|---|
| • | proceeds from issuance of debt; and |
|---|
| • | proceeds from the sale of a portion of our investments in co-investment ventures to achieve long-term ownership targets. |
|---|
We may also generate proceeds from the issuance of equity securities, subject to market conditions.
Debt
The following table summarizes information about our consolidated debt by currency at December 31 (dollars in millions):
| 2020 | 2019 | |||||||||||||||||||||||
|---|---|---|---|---|---|---|---|---|---|---|---|---|---|---|---|---|---|---|---|---|---|---|---|---|
| Weighted Average Interest Rate | Amount Outstanding | % of Total | Weighted Average Interest Rate | Amount Outstanding | % of Total | |||||||||||||||||||
| British pound sterling | 2.2 | % | $ | 1,019 | 6.1 | % | 2.3 | % | $ | 657 | 5.5 | % | ||||||||||||
| Canadian dollar | 2.7 | % | 286 | 1.7 | % | 3.4 | % | 280 | 2.3 | % | ||||||||||||||
| Euro | 1.4 | % | 6,550 | 38.8 | % | 1.9 | % | 6,129 | 51.5 | % | ||||||||||||||
| Japanese yen | 0.8 | % | 2,877 | 17.1 | % | 0.7 | % | 2,329 | 19.6 | % | ||||||||||||||
| U.S. dollar | 2.8 | % | 6,117 | 36.3 | % | 4.4 | % | 2,511 | 21.1 | % | ||||||||||||||
| Total debt (1) | 1.9 | % | $ | 16,849 | 2.2 | % | $ | 11,906 |
| (1) | The weighted average maturity for total debt outstanding at December 31, 2020 and 2019 was 122 and 94 months, respectively. Of the amount of debt outstanding at December 31, 2020, $13.6 billion matures after 2025. Our refinancing activities in 2020 significantly lengthened the maturity of our senior notes. |
|---|
Our credit ratings at December 31, 2020, were A3 from Moody’s and A- from Standard & Poor’s, both with stable outlook. These ratings allow us to borrow at an advantageous interest rate. Adverse changes in our credit ratings could negatively impact our business and, in particular, our refinancing and other capital market activities, our ability to manage debt maturities, our future growth and our development and acquisition activity. A securities rating is not a recommendation to buy, sell or hold securities and is subject to revision or withdrawal at any time by the rating organization.
At December 31, 2020, we were in compliance with all of our financial debt covenants. These covenants include customary financial covenants for total debt, encumbered debt and fixed charge coverage ratios.
See Note 8 to the Consolidated Financial Statements for further discussion on our debt.
Equity Commitments Related to Certain Co-Investment Ventures
Certain co-investment ventures have equity commitments from us and our venture partners. Our venture partners fulfill their equity commitment with cash. We may fulfill our equity commitment through contributions of properties or cash.
The following table summarizes the remaining equity commitments at December 31, 2020 (in millions):
| Equity Commitments (1) | ||||||||||||||
|---|---|---|---|---|---|---|---|---|---|---|---|---|---|---|
| Prologis | Venture Partners | Total | Expiration Date | |||||||||||
| Prologis Targeted U.S. Logistics Fund | $ | - | $ | 763 | $ | 763 | 2023 (2) | |||||||
| Prologis European Logistics Fund | - | 1,813 | 1,813 | 2022 – 2023 (2) | ||||||||||
| Prologis UK Logistics Venture | 8 | 49 | 57 | 2024 | ||||||||||
| Prologis China Core Logistics Fund | - | 115 | 115 | 2022 – 2023 | ||||||||||
| Prologis China Logistics Venture | 289 | 1,636 | 1,925 | 2021 – 2028 | ||||||||||
| Prologis Brazil Logistics Venture | 49 | 195 | 244 | 2026 – 2027 | ||||||||||
| Total | $ | 346 | $ | 4,571 | $ | 4,917 |
| (1) | The equity commitments for co-investment ventures that operate in a different functional currency than the U.S. dollar are calculated using the foreign currency exchange rate at December 31, 2020. |
|---|
| (2) | Venture partners have the option to cancel their equity commitment up to 18 months after the initial commitment date. |
|---|
See the Cash Flow Summary below for more information about our investment activity in the unconsolidated co-investment ventures.
Unconsolidated Co-Investment Venture Debt
We had investments in and advances to our unconsolidated co-investment ventures, at December 31, 2020, of $6.7 billion. The ventures listed below had total third-party debt of $11.8 billion at December 31, 2020. Certain of our ventures do not have third-party debt and are therefore excluded. This debt is non-recourse to Prologis and other investors in the co-investment ventures and matures and bears interest as follows at December 31, 2020 (dollars in millions):
| Total (1) | Weighted Average Interest Rate | Gross Book Value (1) | Ownership % | |||||||||||||
|---|---|---|---|---|---|---|---|---|---|---|---|---|---|---|---|---|
| Prologis Targeted U.S. Logistics Fund | $ | 3,129 | 3.2% | $ | 11,395 | 25.6% | ||||||||||
| FIBRA Prologis | 854 | 3.4% | 2,573 | 46.8% | ||||||||||||
| Prologis European Logistics Fund | 3,389 | 2.1% | 12,941 | 24.3% | ||||||||||||
| Prologis UK Logistics Venture | 613 | 3.1% | 990 | 15.0% | ||||||||||||
| Nippon Prologis REIT | 2,504 | 0.7% | 6,831 | 15.1% | ||||||||||||
| Prologis China Core Logistics Fund | 721 | 5.6% | 2,128 | 15.8% | ||||||||||||
| Prologis China Logistics Venture | 606 | 2.9% | 1,208 | 15.0% | ||||||||||||
| Total | $ | 11,816 | $ | 38,066 |
| (1) | The weighted average loan-to-value ratio for all unconsolidated co-investment ventures was 27.4% at December 31, 2020. Loan-to-value, a non-GAAP measure, was calculated as the percentage of total third-party debt to the gross book value of real estate for each venture and weighted based on the cumulative gross book value of all unconsolidated co-investment ventures. |
|---|
At December 31, 2020, we did not guarantee any third-party debt of the unconsolidated co-investment ventures. In our role as the manager or sponsor, we work with the co-investment ventures to maintain sufficient liquidity and refinance their maturing debt. There can be no assurance that the co-investment ventures will be able to refinance any maturing indebtedness on terms as favorable as the maturing debt, or at all. If the ventures are unable to refinance the maturing indebtedness with newly issued debt, they may be able to obtain funds by voluntary capital contributions from us and our partners or by selling assets. Certain of our ventures also have credit facilities, or unencumbered properties, both of which may be used to obtain funds.
Cash Flow Summary
The following table summarizes our cash flow activity (in millions):
| 2020 | 2019 | |||||||
|---|---|---|---|---|---|---|---|---|
| Net cash provided by operating activities | $ | 2,937 | $ | 2,264 | ||||
| Net cash used in investing activities | $ | (3,074 | ) | $ | (685 | ) | ||
| Net cash used in financing activities | $ | (372 | ) | $ | (840 | ) | ||
| Net increase (decrease) in cash and cash equivalents, including the effect of foreign currency exchange rates | $ | (491 | ) | $ | 745 |
Operating Activities
Cash provided by operating activities, exclusive of changes in receivables and payables, was impacted by the following significant activities:
| • | Real estate operations. We receive the majority of our operating cash through the net revenues of our Real Estate Operations segment. See the Results of Operations section above for further explanation on our Real Estate Operations segment. The revenues from this segment include noncash adjustments for straight-lined rents and amortization of above and below market leases of $126 million and $98 million for 2020 and 2019, respectively. |
|---|
| • | Strategic capital. We also generate operating cash through our Strategic Capital segment by providing asset and property management and other services to our unconsolidated co-investment ventures. See the Results of Operations section above for the key drivers of the net revenues from our Strategic Capital segment. Included in Strategic Capital Revenues is the third-party investors’ share that is owed for promotes, which is recognized in operating activities in the period the cash is received. |
|---|
| • | G&A expenses and equity-based compensation awards. We incurred $275 million and $266 million of G&A costs in 2020 and 2019, respectively. We recognized equity-based, noncash compensation expenses of $110 million and $98 million in 2020 and 2019, respectively, which were recorded to Rental Expenses in the Real Estate Operations segment, Strategic Capital Expenses in the Strategic Capital segment and G&A Expenses. |
|---|
| • | Operating distributions from unconsolidated entities. We received $451 million and $347 million of distributions as a return on our investment from the cash flows generated from the operations of our unconsolidated entities in 2020 and 2019, respectively. |
|---|
| • | Cash paid for interest, net of amounts capitalized. We paid interest, net of amounts capitalized, of $309 million and $214 million in 2020 and 2019, respectively. See Note 8 to the Consolidated Financial Statements for further information on this activity. |
|---|
| • | Cash paid for income taxes, net of refunds. We paid income taxes, net of refunds, of $101 million and $62 million in 2020 and 2019, respectively. See Note 13 to the Consolidated Financial Statements for further information on this activity. |
|---|
Investing Activities
Cash provided by investing activities is driven by proceeds from contributions and dispositions of real estate properties. Cash used in investing activities is primarily driven by our capital deployment activities of investing in real estate development, acquisitions and capital expenditures. See Note 4 to the Consolidated Financial Statements for further information on these activities. In addition, the following significant transactions also impacted our cash provided by or used in investing activities:
| • | Liberty Transaction, net of cash acquired. We paid net cash of $29 million to complete the Liberty Transaction in 2020, primarily due to transaction costs. The acquisition was financed through the issuance of equity and the assumption of debt. A portion of this debt was paid down subsequent to the acquisition, as noted in the Financing Activities section below. See Note 3 to the Consolidated Financial Statements for more information on this transaction. |
|---|
| • | IPT Transaction, net of cash acquired. Our consolidated co-investment venture, USLV, acquired real estate assets from IPT for a cash purchase price of $1.7 billion. Our partner in USLV contributed their share of the purchase price, $917 million, which is presented in Noncontrolling Interests Contributions in financing activities. All of the debt assumed was paid down subsequent to the acquisition, as noted in the Financing Activities section below. See Notes 4 and 11 to the Consolidated Financial Statements for more information on this transaction. |
|---|
| • | Investments in and advances to our unconsolidated entities. We invested cash in our unconsolidated entities that represented our proportionate share, of $386 million and $276 million in 2020 and 2019, respectively. The ventures used the funds for the acquisition of properties, development and repayment of debt. See Note 5 to the Consolidated Financial Statements for more detail on our unconsolidated co-investment ventures. |
|---|
| • | Return of investment. We received distributions from unconsolidated entities as a return of investment of $257 million and $389 million during 2020 and 2019, respectively. Included in these amounts were distributions from venture activities including proceeds from property sales, debt refinancing and the redemption of our investment in certain unconsolidated entities. |
|---|
| • | Settlement of net investment hedges. We paid net cash of $7 million for the settlement of net investment hedges in each of 2020 and 2019. See Note 15 to the Consolidated Financial Statements for further information on our derivative transactions. |
|---|
Financing Activities
Cash provided by and used in financing activities is principally driven by proceeds from and payments on credit facilities and other debt, along with dividends paid on common and preferred stock and noncontrolling interest contributions and distributions. In addition, the following significant transactions also impacted our cash provided by or used in financing activities:
| • | Repurchase of common and preferred stock. We paid $35 million and $7 million to repurchase common shares and shares of Series Q preferred stock, respectively, during 2020. |
|---|
Our repurchase of and payments on debt and proceeds from the issuance of debt consisted of the following activity (in millions):
| 2020 (1) | 2019 | |||||||
|---|---|---|---|---|---|---|---|---|
| Repurchase of and payments on debt (including extinguishment costs) | ||||||||
| Regularly scheduled debt principal payments and payments at maturity | $ | 10 | $ | 29 | ||||
| Secured mortgage debt | 565 | 433 | ||||||
| Senior notes | 4,856 | 669 | ||||||
| Term loans | 1,351 | 2,171 | ||||||
| Total | $ | 6,782 | $ | 3,302 | ||||
| Proceeds from the issuance of debt | ||||||||
| Secured mortgage debt | $ | 155 | $ | 250 | ||||
| Senior notes | 6,170 | 2,053 | ||||||
| Term loans | 1,500 | 1,674 | ||||||
| Total | $ | 7,825 | $ | 3,977 |
| (1) | We completed the Liberty Transaction in 2020 and assumed $2.8 billion of debt, of which $1.8 billion was paid off with the proceeds from the issuance of senior notes. USLV assumed $342 million of debt in the IPT Transaction, all of which was paid off at closing. The assumption of debt was excluded from the table above. See Note 8 to the Consolidated Financial Statements for more information. |
|---|
Distribution and Dividend Requirements
Our dividend policy on our common stock is to distribute a percentage of our cash flow to ensure that we will meet the dividend requirements of the IRC, relative to maintaining our REIT status, while still allowing us to retain cash to fund capital improvements and other investment activities.
Under the IRC, REITs may be subject to certain federal income and excise taxes on undistributed taxable income.
We paid quarterly cash dividends of $0.58 and $0.53 per common share in 2020 and 2019, respectively. Our future common stock dividends, if and as declared, may vary and will be determined by the Board based upon the circumstances prevailing at the time, including our financial condition, operating results and REIT distribution requirements, and may be adjusted at the discretion of the Board during the year.
We make distributions on the common limited partnership units outstanding at the same per unit amount as our common stock dividend. The Class A Units in the OP are entitled to a quarterly distribution equal to $0.64665 per unit so long as the common units receive a quarterly distribution of at least $0.40 per unit. We paid a quarterly cash distribution of $0.64665 per Class A Unit in 2020 and 2019.
At December 31, 2020, we had 1.3 million shares of Series Q preferred stock outstanding with a liquidation preference of $50 per share. The annual dividend rate is 8.54% per share and dividends are payable quarterly in arrears. Pursuant to the terms of our preferred stock, we are restricted from declaring or paying any dividend with respect to our common stock unless and until all cumulative dividends with respect to the preferred stock have been paid and sufficient funds have been set aside for dividends that have been declared for the relevant dividend period with respect to the preferred stock.
Other Commitments
On an ongoing basis, we are engaged in various stages of negotiations for the acquisition or disposition of individual properties or portfolios of properties.
CRITICAL ACCOUNTING POLICIES
A critical accounting policy is one that involves an estimate or assumption that is subjective and requires management judgment about the effect of a matter that is inherently uncertain and material to an entity’s financial condition and results of operations. Management’s judgment considers historical and current economic conditions and expectations for the future. Changes in estimates could affect our financial position and specific items in our results of operations that are used by stockholders, potential investors, industry analysts and lenders in their evaluation of our performance. Of the significant accounting policies discussed in Note 2 to the Consolidated Financial
Statements, those presented below have been identified by us as meeting the criteria to be considered critical accounting policies. Refer to Note 2 for more information on these critical accounting policies.
Asset Acquisitions
We generally account for an acquisition of a single property or portfolio of properties as an asset acquisition. We measure the real estate assets acquired through an asset acquisition based on their cost or total consideration exchanged and any excess consideration or bargain purchase amount is allocated to the real estate properties and related lease intangibles on a relative fair value basis. Assets we do not intend to hold long-term are recorded at fair value. At a property-level, we allocate the fair value to the components which include building, land, improvements, and intangible assets or liabilities related to acquired leases. The most significant portion of the allocation is to building and land and requires the use of market based estimates and assumptions.
The purchase price allocation is based on the expected future cash flows of the property and various characteristics of the markets where the property is located utilizing an income approach methodology, which may be a discounted cash flow analysis or applying a capitalization rate to the estimated NOI of a property. Key assumptions include market rents, growth rates, and discount and capitalization rates. Estimates of future cash flows are based on a number of factors including historical operating results, known trends and market and economic conditions. We determine discount and capitalization rates by market based on recent transactions and other market data and adjust if necessary, based on the property characteristics. The fair value of land is generally based on relevant market data, such as a comparison of the subject site to similar parcels that have recently been sold or are currently being offered on the market for sale. The use of different assumptions to value the acquired properties and allocate the most significant portion of the property value between the building and land could affect the expenses we recognize over the estimated remaining useful life.
Recoverability of Real Estate Assets
We assess the carrying values of our respective long-lived assets whenever events or changes in circumstances indicate that the carrying amounts of these assets may not be fully recoverable. This assessment is primarily triggered based on the shortening of the expected hold period due to our change in intent to sell a property in the near term. We have processes to monitor our intent with regard to our investments and the estimated disposition value in comparison to the current carrying value. If our assessment of potential triggering events indicates that the carrying value of a property that we expect to sell in the near term is not recoverable, we recognize an impairment charge for the amount by which the carrying value exceeds the current estimated fair value of the property. We determine the fair value of the property based on the proceeds from disposition that are estimated based on quoted market values, third-party appraisals or discounted cash flow models that utilize the future net rental income of the property and expected market capitalization rates. The use of projected future cash flows is based on assumptions that are consistent with our estimates of future expectations and the strategic plan we use to manage our underlying business. Changes in economic and operating conditions could impact our intent and the assumptions used in determining the fair value that could result in future impairment.
NEW ACCOUNTING PRONOUNCEMENTS
See Note 2 to the Consolidated Financial Statements.
FUNDS FROM OPERATIONS ATTRIBUTABLE TO COMMON STOCKHOLDERS/UNITHOLDERS (“FFO”)
FFO is a non-GAAP financial measure that is commonly used in the real estate industry. The most directly comparable GAAP measure to FFO is net earnings.
The National Association of Real Estate Investment Trusts (“NAREIT”) defines FFO as earnings computed under GAAP to exclude historical cost depreciation and gains and losses from the sales, along with impairment charges, of previously depreciated properties. We also exclude the gains on revaluation of equity investments upon acquisition of a controlling interest and the gain recognized from a partial sale of our investment, as these are similar to gains from the sales of previously depreciated properties. We exclude similar adjustments from our unconsolidated entities and the third parties’ share of our consolidated co-investment ventures.
Our FFO Measures
Our FFO measures begin with NAREIT’s definition and we make certain adjustments to reflect our business and the way that management plans and executes our business strategy. While not infrequent or unusual, the additional items we adjust for in calculating FFO, as modified by Prologis and Core FFO, both as defined below, are subject to significant fluctuations from period to period. Although these items may have a material impact on our operations and are reflected in our financial statements, the removal of the effects of these items allows us to better understand the core operating performance of our properties over the long term. These items have both positive and negative short-term effects on our results of operations in inconsistent and unpredictable directions that are not relevant to our long-term outlook.
We calculate our FFO measures, as defined below, based on our proportionate ownership share of both our unconsolidated and consolidated ventures. We reflect our share of our FFO measures for unconsolidated ventures by applying our average ownership percentage for the period to the applicable reconciling items on an entity by entity basis. We reflect our share for consolidated ventures in which we do not own 100% of the equity by adjusting our FFO measures to remove the noncontrolling interests share of the applicable reconciling items based on our average ownership percentage for the applicable periods.
These FFO measures are used by management as supplemental financial measures of operating performance and we believe that it is important that stockholders, potential investors and financial analysts understand the measures management uses. We do not use our FFO measures as, nor should they be considered to be, alternatives to net earnings computed under GAAP, as indicators of our operating performance, as alternatives to cash from operating activities computed under GAAP or as indicators of our ability to fund our cash needs.
We analyze our operating performance principally by the rental revenue of our real estate and the revenues from our strategic capital business, net of operating, administrative and financing expenses. This income stream is not directly impacted by fluctuations in the market value of our investments in real estate or debt securities.
FFO, as modified by Prologis attributable to common stockholders/unitholders (“FFO, as modified by Prologis”)
To arrive at FFO, as modified by Prologis, we adjust the NAREIT defined FFO measure to exclude the impact of foreign currency related items and deferred tax, specifically:
| • | deferred income tax benefits and deferred income tax expenses recognized by our subsidiaries; |
|---|
| • | current income tax expense related to acquired tax liabilities that were recorded as deferred tax liabilities in an acquisition, to the extent the expense is offset with a deferred income tax benefit in earnings that is excluded from our defined FFO measure; and |
|---|
| • | foreign currency exchange gains and losses resulting from (i) debt transactions between us and our foreign entities, (ii) third-party debt that is used to hedge our investment in foreign entities, (iii) derivative financial instruments related to any such debt transactions, and (iv) mark-to-market adjustments associated with other derivative financial instruments. |
|---|
We use FFO, as modified by Prologis, so that management, analysts and investors are able to evaluate our performance against other REITs that do not have similar operations or operations in jurisdictions outside the U.S.
Core FFO attributable to common stockholders/unitholders (“Core FFO”)
In addition to FFO, as modified by Prologis, we also use Core FFO. To arrive at Core FFO, we adjust FFO, as modified by Prologis, to exclude the following recurring and nonrecurring items that we recognized directly in FFO, as modified by Prologis:
| • | gains or losses from the disposition of land and development properties that were developed with the intent to contribute or sell; |
|---|
| • | income tax expense related to the sale of investments in real estate; |
|---|
| • | impairment charges recognized related to our investments in real estate generally as a result of our change in intent to contribute or sell these properties; |
|---|
| • | gains or losses from the early extinguishment of debt and redemption and repurchase of preferred stock; and |
|---|
| • | expenses related to natural disasters. |
|---|
We use Core FFO, including by segment and geographies, to: (i) assess our operating performance as compared to other real estate companies; (ii) evaluate our performance and the performance of our properties in comparison with expected results and results of previous periods; (iii) evaluate the performance of our management; (iv) budget and forecast future results to assist in the allocation of resources; (v) provide guidance to the financial markets to understand our expected operating performance; and (vi) evaluate how a specific potential investment will impact our future results.
Limitations on the use of our FFO measures
While we believe our modified FFO measures are important supplemental measures, neither NAREIT’s nor our measures of FFO should be used alone because they exclude significant economic components of net earnings computed under GAAP and are, therefore, limited as an analytical tool. Accordingly, these are only a few of the many measures we use when analyzing our business. Some of the limitations are:
| • | The current income tax expenses that are excluded from our modified FFO measures represent the taxes that are payable. |
|---|
| • | Depreciation and amortization of real estate assets are economic costs that are excluded from FFO. FFO is limited, as it does not reflect the cash requirements that may be necessary for future replacements of the real estate assets. Furthermore, the amortization of capital expenditures and leasing costs necessary to maintain the operating performance of logistics facilities are not reflected in FFO. |
|---|
| • | Gains or losses from property dispositions and impairment charges related to expected dispositions represent changes in value of the properties. By excluding these gains and losses, FFO does not capture realized changes in the value of disposed properties arising from changes in market conditions. |
|---|
| • | The deferred income tax benefits and expenses that are excluded from our modified FFO measures result from the creation of a deferred income tax asset or liability that may have to be settled at some future point. Our modified FFO measures do not currently reflect any income or expense that may result from such settlement. |
|---|
| • | The foreign currency exchange gains and losses that are excluded from our modified FFO measures are generally recognized based on movements in foreign currency exchange rates through a specific point in time. The ultimate settlement of our foreign currency-denominated net assets is indefinite as to timing and amount. Our FFO measures are limited in that they do not reflect the current period changes in these net assets that result from periodic foreign currency exchange rate movements. |
|---|
| • | The gains and losses on extinguishment of debt or preferred stock that we exclude from our Core FFO, may provide a benefit or cost to us as we may be settling our obligation at less or more than our future obligation. |
|---|
| • | The natural disaster expenses that we exclude from Core FFO are costs that we have incurred. |
|---|
We compensate for these limitations by using our FFO measures only in conjunction with net earnings computed under GAAP when making our decisions. This information should be read with our complete Consolidated Financial Statements prepared under GAAP. To assist investors in compensating for these limitations, we reconcile our modified FFO measures to our net earnings computed under GAAP as follows (in millions):
| 2020 | 2019 | |||||||
|---|---|---|---|---|---|---|---|---|
| Reconciliation of net earnings attributable to common stockholders to FFO measures: | ||||||||
| Net earnings attributable to common stockholders | $ | 1,473 | $ | 1,567 | ||||
| Add (deduct) NAREIT defined adjustments: | ||||||||
| Real estate related depreciation and amortization | 1,523 | 1,102 | ||||||
| Gains on other dispositions of investments in real estate, net | (252 | ) | (390 | ) | ||||
| Reconciling items related to noncontrolling interests | (57 | ) | (8 | ) | ||||
| Our share of reconciling items included in earnings related to unconsolidated entities | 268 | 246 | ||||||
| NAREIT defined FFO attributable to common stockholders/unitholders | 2,955 | 2,517 | ||||||
| Add (deduct) our defined adjustments: | ||||||||
| Unrealized foreign currency and derivative losses, net | 161 | 69 | ||||||
| Deferred income tax expense | - | 12 | ||||||
| Current income tax expense on dispositions related to acquired tax liabilities | 6 | - | ||||||
| Reconciling items related to noncontrolling interests | (2 | ) | - | |||||
| Our share of reconciling items included in earnings related to unconsolidated entities | - | (7 | ) | |||||
| FFO, as modified by Prologis attributable to common stockholders/unitholders | 3,120 | 2,591 | ||||||
| Adjustments to arrive at Core FFO: | ||||||||
| Gains on dispositions of development properties and land, net | (465 | ) | (468 | ) | ||||
| Current income tax expense on dispositions | 41 | 15 | ||||||
| Losses on early extinguishment of debt, preferred stock repurchase and other, net | 199 | 16 | ||||||
| Reconciling items related to noncontrolling interests | (3 | ) | - | |||||
| Our share of reconciling items included in earnings related to unconsolidated entities | (28 | ) | 10 | |||||
| Core FFO attributable to common stockholders/unitholders | $ | 2,864 | $ | 2,164 |
Previous: Item 6. Selected Financial Data · Next: Item 7A. Quantitative and Qualitative Disclosures About Market Risk