 filings.tools
Item 1. Business
42K characters. Original on sec.gov · Markdown
Item 1. Business
Prologis, Inc. is a self-administered and self-managed REIT and is the sole general partner of Prologis, L.P. through which it holds substantially all of its assets. We operate Prologis, Inc. and Prologis, L.P. as one enterprise and, therefore, our discussion and analysis refers to Prologis, Inc. and its consolidated subsidiaries, including Prologis, L.P. We invest in real estate through wholly owned subsidiaries and other entities through which we co-invest with partners and investors. We have a significant ownership interest in the co-investment ventures, which are either consolidated or unconsolidated based on our level of control of the entity.
Prologis, Inc. began operating as a fully integrated real estate company in 1997 and elected to be taxed as a REIT under the Internal Revenue Code of 1986, as amended (“Internal Revenue Code” or “IRC”). We believe the current organization and method of operation enable Prologis, Inc. to maintain its status as a REIT. Prologis, L.P. was also formed in 1997.
We operate, manage and measure the operating performance of our properties on an owned and managed (“O&M”) basis. Our O&M portfolio includes our consolidated properties as well as properties owned by our unconsolidated co-investment ventures. We make operating decisions based on our total O&M portfolio as we manage the properties without regard to their ownership. We also evaluate our results based on our proportionate economic ownership of each property included in the O&M portfolio (“our share”) to reflect our share of the financial results of the O&M portfolio.
Included in our discussion below are references to funds from operations (“FFO”) and net operating income (“NOI”), neither of which are United States (“U.S.”) generally accepted accounting principles (“GAAP”). See Item 7. Management’s Discussion and Analysis of Financial Condition and Results of Operations for a reconciliation of Net Earnings Attributable to Common Stockholders/Unitholders in the Consolidated Statements of Income to our FFO measures and a reconciliation of NOI to Operating Income, the most directly comparable GAAP measures.
Our corporate headquarters is located at Pier 1, Bay 1, San Francisco, California 94111, and our other principal office locations are in Amsterdam, Denver, Mexico City, Shanghai, Singapore and Tokyo.
Our Internet address is www.prologis.com. All reports required to be filed with the Securities and Exchange Commission (“SEC”) are available and can be accessed free of charge through the Investor Relations section of our website. The common stock of Prologis, Inc. is listed on the New York Stock Exchange (“NYSE”) under the ticker “PLD” and is a component of the Standard & Poor’s (“S&P”) 500.
THE COMPANY
Prologis is the global leader in logistics real estate with a focus on high-barrier, high-growth markets. We own, manage and develop well-located, high-quality logistics facilities in 19 countries across four continents. Our portfolio focuses on the world’s most vibrant centers of commerce and our scale across these locations allows us to better serve our customers’ diverse logistics requirements. Our teams actively manage our portfolio and provide comprehensive real estate services, including leasing, property management, development, acquisitions and dispositions. We invest significant capital into new logistics properties principally through our
development activity and third-party acquisitions. The contribution of newly developed properties to our co-investment ventures and the sale of non-strategic properties to third parties allows us to recycle capital into our development and acquisition activities.
While the majority of our properties in the U.S. are wholly owned, we hold a significant ownership interest in properties internationally and in the U.S. through our investments in the co-investment ventures. Partnering with the world’s largest institutional investors through co-investment ventures allows us to enhance and diversify our real estate returns as well as mitigate our exposure to foreign currency movements.
Logistics supply chains have increased dramatically in importance to our customers and the global economy. The long-term trends of e-commerce adoption and supply chain resiliency continue to drive the need for increased warehouse space to store and distribute goods. This demand has translated into meaningful increases in rents and low vacancy. We believe this demand is driven by three primary factors: (i) customer supply chains re-positioning to address the significant shift to e-commerce and heightened service expectations; (ii) overall consumption and household growth; and (iii) our customers’ desire for more supply chain resiliency. We believe these forces will keep demand strong for the long-term.
The nature of the services we are providing to our customers is expanding. The scale of our 1.2 billion square foot portfolio allows us to provide a platform of solutions to address challenges that companies face in global fulfillment today. Through Prologis Essentials, we focus on innovative ways to meet our customers’ operations, energy and sustainability, mobility and workforce needs. Our customer experience teams, proprietary technology and strategic partnerships are foundational to Prologis Essentials and allow us to provide our customers with unique and actionable insights to drive greater efficiency in their operations.
Our long-standing dedication to Environmental, Social and Governance (“ESG”) practices strengthens our relationships with our customers, investors, employees and the communities in which we do business. The principles of ESG are an important aspect of our business strategy that we believe delivers a strategic business advantage while positively impacting the environment.
2022 Significant Acquisition
On October 3, 2022, we acquired Duke Realty Corporation and Duke Realty Limited Partnership (collectively “Duke”) through a merger transaction that we refer to as the “Duke Transaction” and is detailed in Note 3 to the Consolidated Financial Statements in Item 8. Financial Statements and Supplementary Data. Our financial condition and operating results include the Duke properties subsequent to the acquisition date. The Duke portfolio was primarily comprised of logistics real estate assets, including 494 industrial operating properties, aggregating 144 million square feet and was highly complementary to our U.S. portfolio in terms of product quality, location and growth potential. There was approximately 15 million square feet of non-strategic industrial operating properties that we do not intend to hold long-term and are classified as other real estate investments. The portfolio also included properties under development, land for future development and investments in other ventures. The acquisition expanded our presence in target markets such as Chicago, Dallas, Atlanta, South Florida and Southern California. The total acquisition price, including transaction costs, was $23.2 billion and was funded through the issuance of equity based on the value of the Prologis, Inc. common stock issued using the closing price on September 30, 2022 and the assumption of debt. As a result of the closely aligned portfolios and similar business strategy and our ability to scale, we integrated the Duke portfolio while adding minimal property management and general and administrative expenses (“G&A”).
Overview
At December 31, 2022, we owned or had investments in, on a wholly-owned basis or through co-investment ventures, properties and development projects expected to total approximately 1.2 billion square feet across the following geographies:
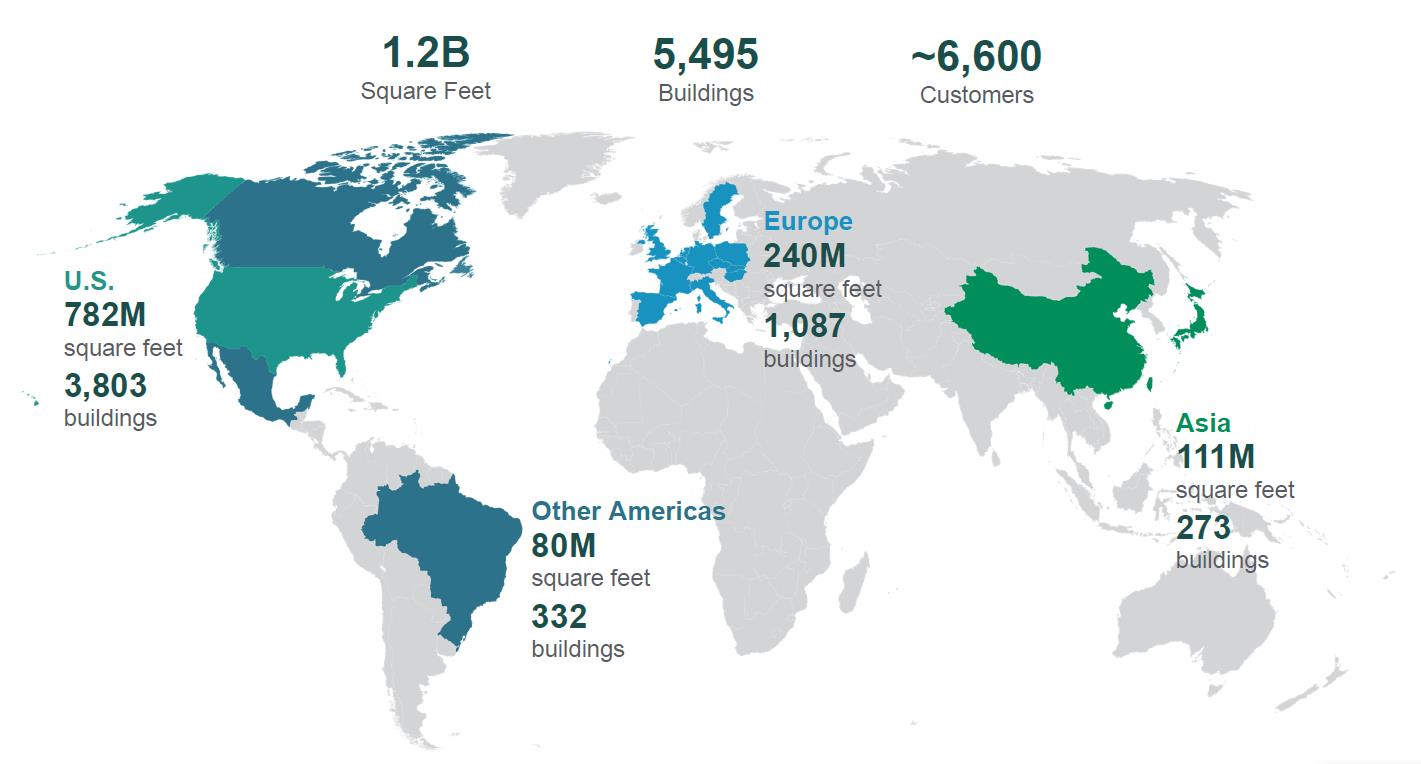
Throughout this discussion, we reflect amounts in the U.S. dollar, our reporting currency. Included in these amounts are consolidated and unconsolidated investments denominated in foreign currencies, principally the British pound sterling, Canadian dollar, euro and Japanese yen that are impacted by fluctuations in exchange rates when translated to U.S. dollars. We mitigate our exposure to foreign currency fluctuations by investing outside the U.S. through co-investment ventures, borrowing in the functional currency of our subsidiaries and utilizing derivative financial instruments.
OPERATING SEGMENTS
Our business comprises two operating segments: Real Estate (Rental Operations and Development) and Strategic Capital.
Below is information summarizing consolidated activity within our segments over the last three years (in millions):
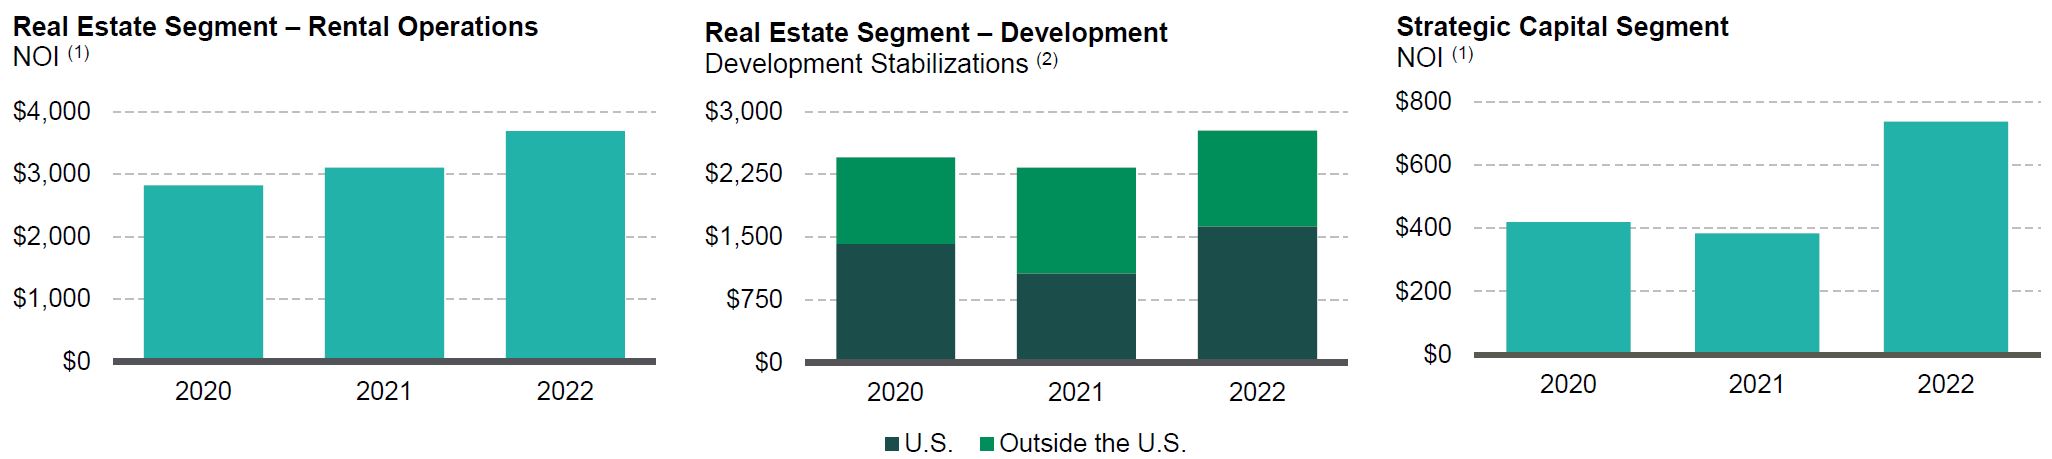
| (1) | NOI from the Real Estate Segment is calculated directly from our Consolidated Financial Statements as Rental Revenues and Development Management and Other Revenues less Rental Expenses and Other Expenses. NOI from the Strategic Capital Segment is calculated directly from our Consolidated Financial Statements as Strategic Capital Revenues less Strategic Capital Expenses. |
|---|
| (2) | A developed property moves into the operating portfolio when it meets our definition of stabilization, which is the earlier of when a property that was developed has been completed for one year, is contributed to a co-investment venture following completion or is 90% occupied. Amounts represent our total expected investment (“TEI”) upon stabilization, which includes the estimated cost of development or expansion, including land, construction and leasing costs. |
|---|
Real Estate Segment
Rental Operations. Rental operations comprise the largest component of our operating segments and generally contribute 85% to 90% of our consolidated revenues, earnings and FFO. We collect rent from our customers through operating leases, including reimbursements for the majority of our property operating costs. For leases that commenced during 2022 within the consolidated operating portfolio, the weighted average lease term was 69 months. We expect to generate internal growth by increasing rents, maintaining high occupancy rates and controlling expenses. The primary driver of our revenue growth, outside of the Duke Transaction, will be rolling in-place leases to current market rents when leases expire, as discussed further below. We believe our active portfolio management, combined with the skills of our property, leasing, maintenance, capital, energy, sustainability and risk management teams allow us to maximize NOI across our portfolio. Substantially all of our consolidated rental revenue, NOI and cash flows from rental operations are generated in the U.S.
Development. Given the scarcity of modern logistics facilities in our target markets, our development business provides the opportunity to build to the requirements of our current and future customers while deepening our market presence. We believe we have a competitive advantage due to (i) the strategic locations of our global land bank and redevelopment sites; (ii) the development expertise of our local teams; (iii) the depth of our customer relationships; (iv) our ability to integrate sustainable design features that result in cost-savings and operational efficiencies for our customers; and (v) our procurement capabilities that allow us to secure high-demand construction materials at lower cost. Successful development and redevelopment efforts provide significant earnings growth as projects are leased, generate income and increase the value of our Real Estate Segment. Generally, we develop properties in the U.S. for long-term hold and outside the U.S. for contribution to our unconsolidated co-investment ventures.
Strategic Capital Segment
Our Strategic Capital Segment allows us to partner with many of the world’s largest institutional investors. The business is capitalized principally through private and public equity of which 95% is either in perpetual open-ended or long-term ventures, and two publicly traded vehicles (Nippon Prologis REIT, Inc. in Japan and FIBRA Prologis in Mexico). We align our interests with our partners by holding significant ownership interests in all of our eight unconsolidated co-investment ventures (ranging from 15% to 50%). This structure allows us to reduce our exposure to foreign currency movements for investments outside the U.S.
This segment produces durable, long-term cash flows and generally contributes 10% to 15% of our recurring consolidated revenues, earnings and FFO, all while requiring minimal capital other than our investment in the venture. We generate strategic capital revenues from our unconsolidated co-investment ventures, principally through asset management and property management services. Asset management fees are primarily driven by the quarterly valuation of the real estate properties owned by the respective ventures. We earn additional revenues by providing leasing, acquisition, construction management, development and disposition services. In certain ventures, we also have the ability to earn revenues through incentive fees (“promotes” or “promote revenues”) periodically during the life of a venture, upon liquidation of a venture or upon stabilization of individual venture assets based primarily on the total return of the investments over certain financial hurdles. We plan to grow this business and increase revenues by increasing our assets under management in existing or new ventures. The majority of strategic capital revenues are generated outside the U.S.
FUTURE GROWTH
We believe that the quality and scale of our portfolio, our ability to build out our land bank, our strategic capital business, the expertise of our team, the depth of our customer relationships and the strength of our balance sheet are differentiators that allow us to drive growth in revenues, NOI, earnings, FFO and cash flows.
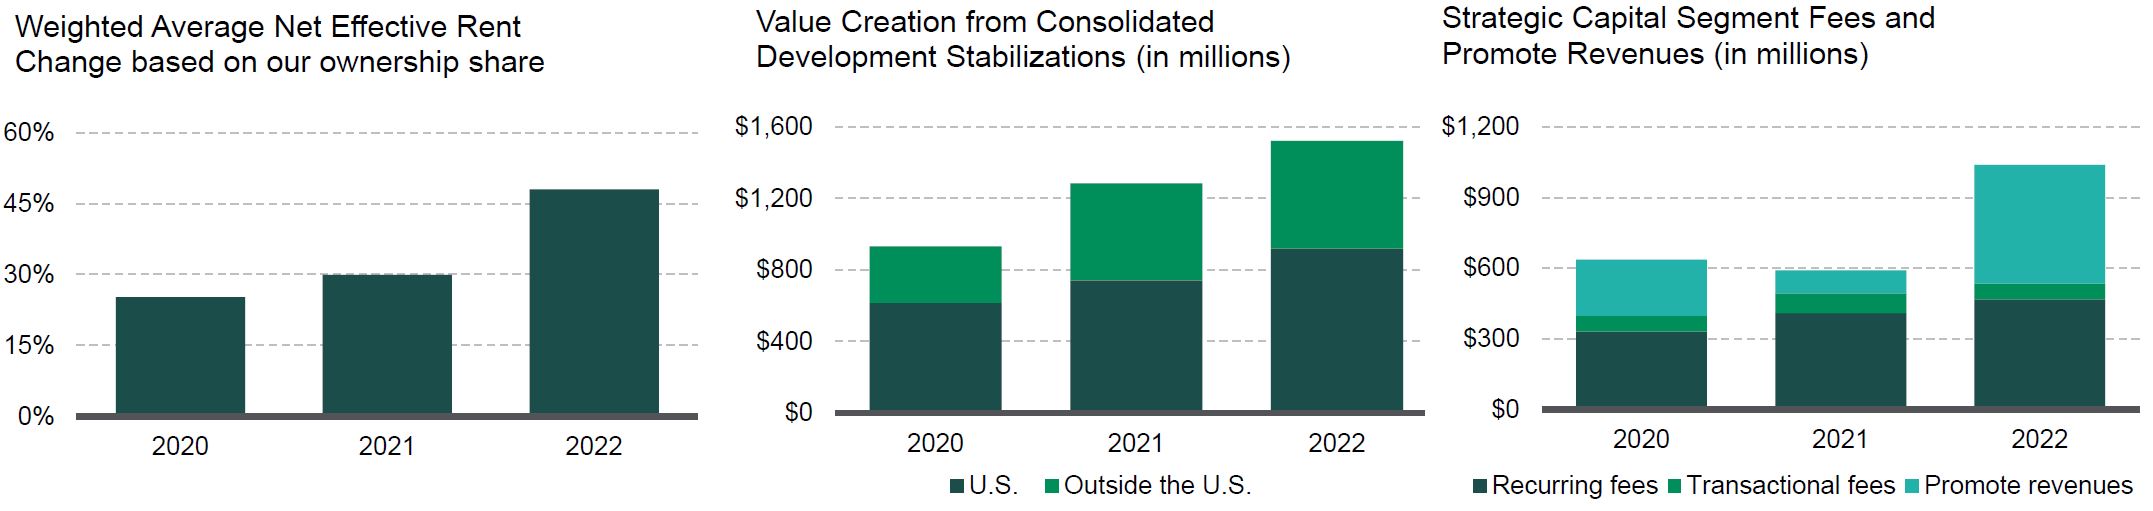
| • | Rent Growth. We expect rents in our markets to continue to increase due to healthy demand combined with low vacancy. Due to strong market rent growth over the last several years, our in-place leases have considerable upside potential to drive future organic NOI growth. We estimate that our lease mark-to-market is approximately 67% (on a net effective basis), which represents the growth rate from in-place rents to current market rents based on our share of the O&M portfolio at December 31, 2022. Therefore, even if there was no additional market rent growth in the future, we expect our lease renewals to translate into significant increases in future income. We have experienced positive rent change on rollover (comparing the net effective rent (“NER”) of the new lease to the prior lease for the same space) in every quarter since 2013. |
|---|
| • | Value Creation from Development. A successful development and redevelopment program requires sourcing well-located land and redevelopment sites through acquisition opportunities, including our innovative approach with Covered Land Plays, which are income producing assets acquired with the intention to redevelop for higher and better use as industrial properties. Our investment in the development portfolio was $4.2 billion at December 31, 2022. We believe that the carrying value of our land bank is below its current fair value. Based on our current estimates, our consolidated land, including options and Covered Land Plays, has the potential to support the development of $34.2 billion ($39.0 billion on an O&M basis) of TEI of new logistics space. The global nature of our development program provides a wide landscape of opportunities to pursue based on our judgement of market conditions, opportunities and risks. |
|---|
We expect to create value as we build new properties. We measure the estimated value creation of a development project as the stabilized value above our TEI. As properties are completed and leased, we expect to realize the value creation principally through gains realized through contributions of these properties to unconsolidated co-investment ventures and increases in the NOI of the consolidated portfolio.
| • | Strategic Capital Advantages. We raise capital to support the long-term growth of the co-investment ventures while maintaining our own substantial investments in these vehicles. At December 31, 2022, the gross book value of the operating portfolio held by our eight unconsolidated co-investment ventures was $49.3 billion across 488 million square feet. |
|---|
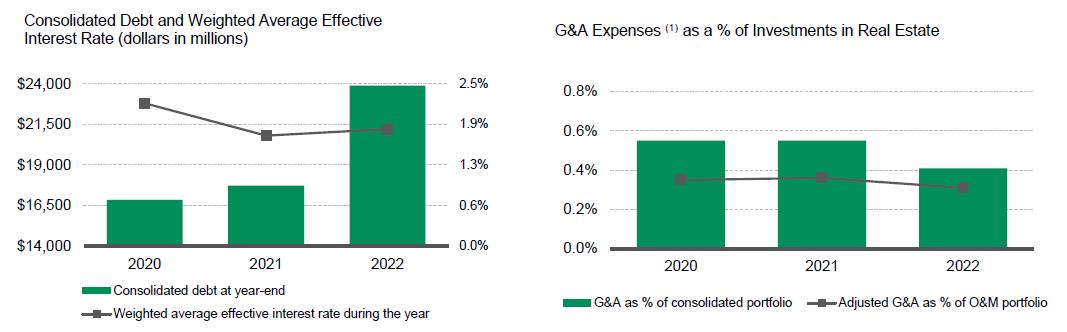
| (1) | G&A Expenses is a line item in the Consolidated Financial Statements. Adjusted G&A expenses is calculated from our Consolidated Financial Statements as G&A Expenses and Strategic Capital Expenses, less expenses under the Prologis Promote Plan (“PPP”) and property-level management expenses for the properties owned by the ventures. |
|---|
| • | Balance Sheet Strength. The Duke Transaction increased the strength and size of our balance sheet while allowing us to maintain our low leverage. At December 31, 2022, the weighted average remaining maturity of our consolidated debt was 9 years and the weighted average interest rate was 2.5%, primarily as a result of our refinancing activities over the last several years. Through our refinancing activities we have substantially addressed all our debt maturities until 2026 and have taken advantage of previously low interest rates. At December 31, 2022, we had total available liquidity of $4.1 billion. We continue to maintain low leverage as a percentage of our real estate investments and our market capitalization. As a result of our low leverage, available liquidity and investment capacity in the co-investment ventures, we have significant capacity to capitalize on opportunistic value-added investments as they arise. |
|---|
| • | Economies of Scale from Growth. We have scalable systems and infrastructure in place to grow both our consolidated and O&M portfolios with limited incremental G&A expense. We use adjusted G&A expenses as a percentage of the O&M portfolio (based on gross book value) to measure and evaluate our overhead costs. We believe we can continue to grow NOI and strategic capital revenues organically and through accretive development and acquisition activity while further reducing G&A as a percentage of our investments in real estate. The acquisition of the Duke portfolio in 2022 is a key example of this, where we increased our O&M portfolio by over 20% in the fourth quarter of 2022 and had minimal increases to G&A expenses, resulting in lower G&A expenses as a percentage of investments in real estate. While we plan to make future investments in our new lines of business through Prologis Essentials, we expect to maintain our operational efficiency. |
|---|
| • | Staying “Ahead of What’s Next™”. We are focused on creating value beyond real estate by enhancing our customers’ experience, leveraging our scale to obtain procurement savings and innovating through data analytics and digitization efforts. This includes investments in early and growth-stage companies that are focused on emerging technology. Through Prologis Essentials we support our customers through service and product offerings, including innovative solutions to operations, energy and sustainability, mobility and workforce that can make our customers’ decision process easier and their enterprise more efficient. |
|---|
Competition
Real estate ownership is highly fragmented, and we face competition from many owners and operators. Competitively priced logistics space could impact our occupancy rates and have an adverse effect on how much rent we can charge, which in turn could affect our operating results. We face competition regarding our capital deployment activities, including regional, national and global operators and developers. We also face competition from investment managers for institutional capital within our strategic capital business.
Despite the competition, our global reach and local market knowledge over the years has given us distinct competitive advantages, including the following:
| • | a portfolio of properties strategically located in markets characterized by large population densities, growing consumption and high barriers to entry, typically near large labor pools and extensive transportation infrastructure, including our Last Touch® facilities; |
|---|
| • | the ability to leverage the organizational scale and structure of our 1.2 billion square foot O&M portfolio to provide a single point of contact for our multi-market customers to address their needs through our in-house global Customer Led Solutions Team; |
|---|
| • | services and solutions offered through Prologis Essentials to assist our customers with their operations, energy and sustainability, mobility and workforce needs; |
|---|
| • | a strategically located, global land bank and redevelopment sites that have the potential to support the development of $39.0 billion of TEI of new logistics space on an O&M basis; |
|---|
| • | local teams with the expertise, experience and relationships to lease our properties and deploy capital advantageously; |
|---|
| • | development of logistics facilities with sustainable design features that meet customer needs for high-quality buildings while enabling them to make progress on their own sustainability objectives; |
|---|
| • | relationships and successful track record with current and prospective investors in our strategic capital business that is comprised of 95% perpetual open-ended or long-term ventures and two publicly traded vehicles; |
|---|
| • | a market intelligence team that allows us to track business conditions in real time, proactively pursue market opportunities and disruptions alike, and develop revenue-generating capabilities to strengthen our operational excellence; |
|---|
| • | an investment in technology and talent to support our sustainability objectives, including expanding our efforts around renewable energy; |
|---|
| • | Prologis Ventures, our corporate venture capital group, and Prologis Labs, our initiative for testing new technologies alongside our customers, together track the leading edge of innovation and technologies within real estate and the supply chain, creating important capabilities that connect Prologis with the C-suites of our customers; and |
|---|
| • | a strong balance sheet and credit ratings, coupled with significant liquidity, borrowing capacity and long-term fixed debt with low rates. |
|---|
Customers
At December 31, 2022, in our Real Estate Segment representing our consolidated properties, we had more than 4,000 customers occupying 601 million square feet of logistics operating properties (6,600 customers occupying 1.2 billion square feet for our O&M portfolio). Our broad customer base represents a spectrum of international, national, regional and local logistics users who operate in various industries, providing diverse goods to consumers throughout the globe.
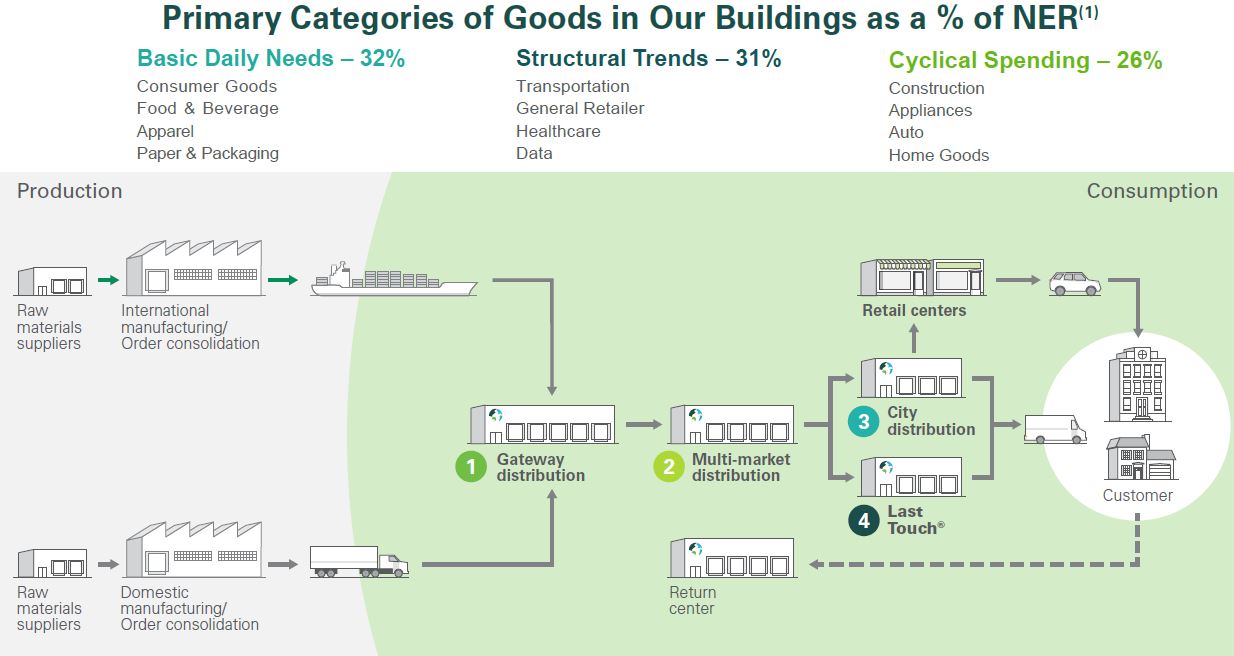
The location of our global portfolio gives us the unique ability to provide our customers with the right real estate solutions for their supply chains that, in turn, allows them to meet end-consumer delivery expectations. We have invested in properties located within infill and urban areas in our largest global markets with same day access (defined as Last Touch®) and next day access (defined as city distribution), to the consumer population. We have also invested in facilities located at key transportation hubs on the edge of these major infill and urban areas and gateway distribution facilities that incorporate access to major sea and intermodal ports.
Below are the primary categories of goods in our consolidated real estate properties at December 31, 2022.
| (1) | NER is calculated using the estimated total cash to be received over the term of the lease divided by the lease term to determine the average amount of cash rent payments received per year. Amounts derived in a currency other than the U.S. dollar have been translated using the average rate from the previous twelve months. |
|---|
Primary categories do not sum to 100% as the difference is attributable to customers that do not clearly fall into a single category.
The following table details our top 25 customers for our consolidated and O&M real estate properties at December 31, 2022 (square feet in millions):
| Consolidated - Real Estate Segment | Owned and Managed | |||||||||||||||
|---|---|---|---|---|---|---|---|---|---|---|---|---|---|---|---|---|
| Top Customers | % of NER | Total Occupied Square Feet | Top Customers | % of NER | Total Occupied Square Feet | |||||||||||
| 1. Amazon | 7.0 | 34 | 1. Amazon | 5.3 | 43 | |||||||||||
| 2. Home Depot | 2.6 | 15 | 2. Home Depot | 1.7 | 17 | |||||||||||
| 3. FedEx | 1.9 | 8 | 3. FedEx | 1.3 | 10 | |||||||||||
| 4. UPS | 1.0 | 6 | 4. Geodis | 1.3 | 17 | |||||||||||
| 5. Geodis | 0.9 | 6 | 5. DHL | 1.1 | 12 | |||||||||||
| 6. Wal-Mart | 0.7 | 4 | 6. CEVA Logistics | 0.9 | 12 | |||||||||||
| 7. NFI Industries | 0.6 | 3 | 7. UPS | 0.8 | 8 | |||||||||||
| 8. U.S. Government | 0.6 | 2 | 8. GXO | 0.7 | 9 | |||||||||||
| 9. Wayfair | 0.6 | 5 | 9. DSV Panalpina | 0.7 | 7 | |||||||||||
| 10. Pepsi | 0.5 | 3 | 10. Maersk | 0.6 | 6 | |||||||||||
| Top 10 Customers | 16.4 | 86 | Top 10 Customers | 14.4 | 141 | |||||||||||
| 11. DHL | 0.5 | 3 | 11. Kuehne + Nagel | 0.6 | 7 | |||||||||||
| 12. GXO | 0.5 | 4 | 12. Wal-Mart | 0.5 | 6 | |||||||||||
| 13. Sycamore Partners (Staples) | 0.4 | 3 | 13. U.S. Government | 0.5 | 4 | |||||||||||
| 14. DSV Panalpina | 0.4 | 2 | 14. Cainiao (Alibaba) | 0.5 | 5 | |||||||||||
| 15. Ryder System | 0.4 | 2 | 15. DB Schenker | 0.4 | 5 | |||||||||||
| 16. CEVA Logistics | 0.4 | 3 | 16. NFI Industries | 0.4 | 3 | |||||||||||
| 17. Uline | 0.4 | 1 | 17. Hitachi | 0.4 | 4 | |||||||||||
| 18. Berkshire Hathaway | 0.4 | 3 | 18. XPO Logistics | 0.4 | 4 | |||||||||||
| 19. Target | 0.4 | 2 | 19. Nippon Express | 0.4 | 3 | |||||||||||
| 20. Office Depot | 0.4 | 3 | 20. ZOZO | 0.4 | 4 | |||||||||||
| 21. Kellogg | 0.4 | 3 | 21. Mercado Libre | 0.4 | 4 | |||||||||||
| 22. Toyo Tires | 0.4 | 1 | 22. Pepsi | 0.3 | 3 | |||||||||||
| 23. Kuehne + Nagel | 0.3 | 2 | 23. Wayfair | 0.3 | 5 | |||||||||||
| 24. Iron Mountain | 0.3 | 2 | 24. Nippon Kabushika Kaisha (Yusen Logistics) | 0.3 | 2 | |||||||||||
| 25. Best Buy | 0.3 | 2 | 25. Uline | 0.3 | 2 | |||||||||||
| Top 25 Customers | 22.3 | 122 | Top 25 Customers | 20.5 | 202 |
In our Strategic Capital Segment, we view our partners and investors as our customers. At December 31, 2022, we had 162 investors in our private equity ventures, several of which invest in multiple ventures.
Our People
Our people are the foundation of our business. They implement our strategy and create value for our customers and shareholders. We actively seek to recruit and retain talented employees with varied experiences and viewpoints. The intent is to create an inclusive and diverse culture where each employee can do their best work and drive our collective success.
We are committed to our diversity, equity, inclusion and belonging (“DEIB”) hiring practices. We also conduct annual pay equity analyses that cover women and people of color and aim to address differences in compensation not explained by relevant job factors accordingly.
The following charts display diversity by levels of seniority of our workforce at December 31, 2022:

| (1) | Managers include employees with manager, director or vice president titles. Senior leaders include employees with senior vice president or higher titles. |
|---|
We focus on learning and development at every level of the organization. We align employees’ goals with our overall strategic direction to create a clear link between individual efforts and the long-term success of the company. We then provide feedback on their performance towards those goals to ensure their growth. Providing our employees learning and development through training, educational opportunities and mentorship is critical to our ability to continue to innovate. In 2022, more than 2,000 employees completed more than 7,400 hours of company-provided or company-sponsored learning and development training.
We provide opportunities for our employees to share their perspectives and feedback on our company and their work experience. Our most recent employee engagement pulse survey, completed in November 2022 with a participation rate of 92%, indicated that 87% of Prologis employees are engaged based on their positive response to the questions that comprise our engagement driver index.
We strive to create a healthy and safe working environment for our employees. We provide workplace flexibility with accountability as determined by role. For example, for those employees who work on-site, we have protocols in place to help ensure a safe working environment. We continue to attract and retain talent in the industry through a robust benefit package, career growth opportunities, talent recognition and individual development planning.
The following table summarizes our total number of employees at December 31, 2022:
| Geographies | ||||
|---|---|---|---|---|
| U.S. (1) | 1,481 | |||
| Other Americas | 162 | |||
| Europe | 575 | |||
| Asia | 248 | |||
| Total | 2,466 |
| (1) | This includes employees who were based in the U.S. but also support other geographies. |
|---|
Prologis employees are not organized under collective bargaining agreements, other than in Brazil, France and Spain, and there is a works council in France.
CODE OF ETHICS AND BUSINESS CONDUCT
We maintain a Code of Ethics and Business Conduct applicable to our board of directors (the “Board”) and all of our officers and employees, including the principal executive officer, the principal financial officer and the principal accounting officer, and other people performing similar functions. A copy of our Code of Ethics and Business Conduct is available on our website, www.prologis.com. In addition to being accessible through our website, copies of our Code of Ethics and Business Conduct can be obtained, free of charge, upon written request to Investor Relations, Pier 1, Bay 1, San Francisco, California 94111. Any amendments to or waivers of our Code of Ethics and Business Conduct that apply to the principal executive officer, the principal financial officer, the principal accounting officer, or other people performing similar functions, and that relate to any matter enumerated in Item 406(b) of Regulation S-K, will be disclosed on our website.
ENVIRONMENTAL, SOCIAL AND GOVERNANCE (“ESG”)
Environmental
We develop modern and efficient buildings with state-of-the-art technology to stay ahead of our customers’ needs, advance structural, transportation and energy requirements, and make progress on our own sustainability goals and objectives. This includes new development and redevelopment of buildings to specifications that align with leading sustainable building standards and the implementation of energy solutions such as onsite solar generation, cool roofs, LED lighting, EV charging stations, waste diversion, recycling and xeriscaping. We regularly ask customers how Prologis can work with them to enhance the sustainability of their operations. We believe these services and solutions can deliver cost-savings and operational efficiencies, reduce energy and water consumption and decrease greenhouse gas emissions within our customers’ operations and across our own portfolio.
We have committed to: (i) installing 100% LED lighting within our logistics facilities across our O&M operating properties by 2025; (ii) installing 1 gigawatt of solar generation capacity, supported by storage, by 2025, and (iii) obtaining green building certifications for 100% of our eligible new development and redevelopment. We believe our Prologis Essentials LED and SolarSmart solutions create energy savings, help reduce the environmental footprint of our customers and accelerate our progress in these areas. At December 31, 2022, we had installed LED lighting across more than 70% of our logistics facilities within our O&M operating properties. During 2022, approximately 100 megawatts of solar generation capacity was installed on the roofs within our O&M portfolio. Both of these metrics exclude the operating properties acquired in the Duke Transaction and by Prologis European Logistics Fund (“PELF”) in September 2022.
To fund our sustainable development activities, we have utilized the proceeds from senior notes issuances to finance green projects eligible under our green bond framework. For development properties in our O&M portfolio that were approved by our Investment Committee after June 2021 and that reached stabilization during 2022, we certified 15% of our eligible developed and redeveloped buildings with green building certifications and the remaining 85% were scheduled for green building certification.
In 2022, we announced a new commitment to achieve net zero emissions across our entire value chain by 2040, including scope 1, 2 and 3 emissions. Our commitment is aligned with the Science Based Target initiative’s Net Zero Standard and includes the following interim milestones: (i) 1 gigawatt of solar generation capacity, supported by storage, by 2025, as discussed above; (ii) carbon neutral construction by 2025; and (iii) net zero operations for scope 1 and 2 emissions by 2030. We believe we can improve our scope 1 and scope 2 emissions through energy efficiency, electrification and sourcing renewable energy for our offices. Scope 3 emissions comprise a significant portion of our total emissions. To decrease scope 3 emissions, we believe we can reduce building and tenant energy consumption, and expand our generation and use of renewable energy. In support of carbon neutral construction, we will pursue sustainable design, new construction practices and innovation in building materials, as well as purchase high-quality carbon offsets for emissions that cannot yet be eliminated.
Social
We are committed to social responsibility and strengthening relationships important to our business through customer partnerships, investor outreach, community involvement, labor solutions, and DEIB initiatives. We work in partnership with local leaders and
organizations to create jobs and job training programs; promote health and safety; and enhance recreational and transit infrastructure. We believe these efforts help create a more stable and predictable business environment for Prologis and our customers and support social wellness and well-being in the communities we serve.
For our customers, where recruitment and retention of logistics talent is a key challenge, we are helping build a talent pipeline through our Community Workforce Initiative (“CWI”), founded in 2018. The CWI is a talent development program that advances the skills and capabilities of logistics talent, with an emphasis on revitalizing career pathways and creating economic opportunities in the communities where we operate. In 2018, we set a goal to train 25,000 individuals by 2025 by partnering with leading public sector organizations and leveraging digital learning technologies to develop innovative training solutions. At December 31, 2022, under the program, we have trained approximately 21,000 individuals towards this goal.
Beginning in 2019, we committed to spending 75,000 hours supporting our local communities by 2025. To achieve this goal, we enable our employees to spend 40 working hours a year to volunteer, including at our company-sponsored day of volunteering, where employees around the globe volunteer on projects to help in their local communities. At December 31, 2022, we have contributed in excess of 38,000 hours towards our goal. In addition, we encourage our employees to support our local communities outside of working hours with our Dollars for Doers and other matching gifts programs, through which Prologis donates to eligible charities and non-profit organizations based on employees’ personal volunteer hours or dollar donations.
Governance
We strive to promote a culture of uncompromising integrity, including through our governance practices and corporate oversight. Our Board independence and diversity, open communication with our stockholders and a risk management framework that supports our investment and process decisions all serve to mitigate risk and preserve value for our company. Over the past eight years we have onboarded six new directors, increasing the ethnic, gender and geographical diversity of the Board, as well as its breadth of experience. The charters of our Board Governance and Nomination Committee and Talent and Compensation Committee provide that such committees have specific oversight over ESG matters and DEIB matters, respectively. The strength of our balance sheet and credit ratings, dedication to proactive risk mitigation and engagement with our employees through ethics and anti-corruption training protects the financial, operational and reputational resilience of our company. Our global risk management team works with our Board to do regular enterprise-wide risk assessments to ensure proper oversight over real estate, financial and emerging risks across our global organization. We are committed to ensuring that 100% of our employees complete ethics training each year and continued to achieve this commitment in 2022. Along with this commitment, our employees completed more than 1,800 hours of information technology security, compliance and other ethics training. Our approach is reinforced by our Code of Ethics and Business Conduct, as described above.
ENVIRONMENTAL MATTERS
We are exposed to various environmental risks that may result in unanticipated losses and affect our operating results and financial condition. Either the previous owners or we have conducted environmental reviews on a majority of the properties we have acquired, including land. While some of these assessments have led to further investigation and sampling, none of the environmental assessments have revealed an environmental liability that we believe would have a material adverse effect beyond amounts recorded at December 31, 2022. See further discussion in Item 1A. Risk Factors and Note 16 to the Consolidated Financial Statements in Item 8. Financial Statements and Supplementary Data.
GOVERNMENTAL MATTERS
We are exposed to various regulatory requirements, taxes, tariffs, trade wars and laws within the countries in which we operate and unexpected changes in these items may result in unanticipated losses, adverse tax consequences and affect our operating results and
financial condition. In addition, we may be impacted by the ability of our non-U.S. subsidiaries to distribute or otherwise transfer cash among our subsidiaries due to currency exchange control regulations and transfer pricing regulations. The impact of regional or country-specific economic instability, including government shutdowns or other internal trade alliances or agreements could also have a material adverse effect on our business, financial condition or results of operations. See further discussion in Item 1A. Risk Factors.
INSURANCE COVERAGE
We carry insurance coverage on our properties. We determine the type of coverage and the policy specifications and limits based on what we deem to be the risks associated with our ownership of properties and our business operations in specific markets. Such coverage typically includes property damage and rental loss insurance resulting from such perils as fire, windstorm, flood, earthquake and terrorism; commercial general liability insurance; and environmental insurance. Insurance is maintained through a combination of commercial insurance, self-insurance and a wholly-owned captive insurance entity. Additionally, in 2021 we sponsored a catastrophe bond issuance that provides further insurance coverage through 2024 for potential losses resulting from earthquake risks in the U.S. The costs to insure our properties are primarily covered through expense reimbursements from our customers. We believe our insurance coverage contains policy specifications and insured limits that are customary for similar properties, business activities and markets and we believe our properties are adequately insured. See further discussion in Item 1A. Risk Factors.
Previous: Cover and table of contents · Next: Item 1A. Risk Factors