 filings.tools
Philip Morris International 10-K 2017-12-31
Filed 2018-02-13. 21 sections, 494K characters. Original on sec.gov · Markdown · JSON
Cover and table of contents
10-K 1 pm123117form10kwrapinclfsm.htm 10-K
UNITED STATES
SECURITIES AND EXCHANGE COMMISSION
Washington, D.C. 20549
FORM 10-K
| ý | ANNUAL REPORT PURSUANT TO SECTION 13 OR 15(d) OF THE SECURITIES EXCHANGE ACT OF 1934 |
For the fiscal year ended December 31, 2017
OR
| ¨ | TRANSITION REPORT PURSUANT TO SECTION 13 OR 15(d) OF THE SECURITIES EXCHANGE ACT OF 1934 |
For the transition period from to
Commission File Number: 001-33708
PHILIP MORRIS INTERNATIONAL INC.
(Exact name of registrant as specified in its charter)
| Virginia | 13-3435103 | |
| (State or other jurisdiction of incorporation or organization) | (I.R.S. Employer Identification No.) | |
| 120 Park Avenue, New York, New York | 10017 | |
| (Address of principal executive offices) | (Zip Code) |
917-663-2000
(Registrant’s telephone number, including area code)
Securities registered pursuant to Section 12(b) of the Act:
| Title of each class | Name of each exchange on which registered | |
| Common Stock, no par value | New York Stock Exchange | |
| 5.650% Notes due 2018 | New York Stock Exchange | |
| 1.875% Notes due 2019 | New York Stock Exchange | |
| 1.625% Notes due 2019 | New York Stock Exchange | |
| 1.375% Notes due 2019 | New York Stock Exchange | |
| 1.875% Notes due 2019 | New York Stock Exchange | |
| 2.125% Notes due 2019 | New York Stock Exchange | |
| 2.000% Notes due 2020 | New York Stock Exchange | |
| Floating Notes due 2020 | New York Stock Exchange | |
| 1.750% Notes due 2020 | New York Stock Exchange | |
| 4.500% Notes due 2020 | New York Stock Exchange | |
| 1.875% Notes due 2021 | New York Stock Exchange | |
| 1.875% Notes due 2021 | New York Stock Exchange | |
| 4.125% Notes due 2021 | New York Stock Exchange | |
| 2.900% Notes due 2021 | New York Stock Exchange | |
| 2.625% Notes due 2022 | New York Stock Exchange | |
| 2.375% Notes due 2022 | New York Stock Exchange | |
| 2.500% Notes due 2022 | New York Stock Exchange | |
| 2.500% Notes due 2022 | New York Stock Exchange | |
| 2.625% Notes due 2023 | New York Stock Exchange | |
| 2.125% Notes due 2023 | New York Stock Exchange | |
| 3.600% Notes due 2023 | New York Stock Exchange |
| Title of each class | Name of each exchange on which registered | |
| 2.875% Notes due 2024 | New York Stock Exchange | |
| 0.625% Notes due 2024 | New York Stock Exchange | |
| 3.250% Notes due 2024 | New York Stock Exchange | |
| 2.750% Notes due 2025 | New York Stock Exchange | |
| 3.375% Notes due 2025 | New York Stock Exchange | |
| 2.750% Notes due 2026 | New York Stock Exchange | |
| 2.875% Notes due 2026 | New York Stock Exchange | |
| 3.125% Notes due 2027 | New York Stock Exchange | |
| 3.125% Notes due 2028 | New York Stock Exchange | |
| 2.875% Notes due 2029 | New York Stock Exchange | |
| 3.125% Notes due 2033 | New York Stock Exchange | |
| 2.000% Notes due 2036 | New York Stock Exchange | |
| 1.875% Notes due 2037 | New York Stock Exchange | |
| 6.375% Notes due 2038 | New York Stock Exchange | |
| 4.375% Notes due 2041 | New York Stock Exchange | |
| 4.500% Notes due 2042 | New York Stock Exchange | |
| 3.875% Notes due 2042 | New York Stock Exchange | |
| 4.125% Notes due 2043 | New York Stock Exchange | |
| 4.875% Notes due 2043 | New York Stock Exchange | |
| 4.250% Notes due 2044 | New York Stock Exchange |
Securities registered pursuant to Section 12(g) of the Act: None
Indicate by check mark if the registrant is a well-known seasoned issuer, as defined in Rule 405 of the Securities Act. Yes þ No ¨
Indicate by check mark if the registrant is not required to file reports pursuant to Section 13 or Section 15(d) of the Act. Yes ¨ No þ
Indicate by check mark whether the registrant (1) has filed all reports required to be filed by Section 13 or 15(d) of the Securities Exchange Act of 1934 during the preceding 12 months (or for such shorter period that the registrant was required to file such reports), and (2) has been subject to such filing requirements for the past 90 days. Yes þ No ¨
Indicate by check mark whether the registrant has submitted electronically and posted on its corporate website, if any, every Interactive Data File required to be submitted and posted pursuant to Rule 405 of Regulation S-T during the preceding 12 months (or for such shorter period that the registrant was required to submit and post such files). Yes þ No ¨
Indicate by check mark if disclosure of delinquent filers pursuant to Item 405 of Regulation S-K is not contained herein, and will not be contained, to the best of registrant’s knowledge, in definitive proxy or information statements incorporated by reference in Part III of this Form 10-K or any amendment to this Form 10-K. þ
Indicate by check mark whether the registrant is a large accelerated filer, an accelerated filer, a non-accelerated filer, a smaller reporting company, or emerging growth company. See the definitions of “large accelerated filer,” “accelerated filer,” “smaller reporting company,” and “emerging growth company” in Rule 12b-2 of the Exchange Act.
| Large accelerated filer þ | Accelerated filer ¨ | |
| Non-accelerated filer ¨ | (Do not check if a smaller reporting company) | Smaller reporting company ¨ |
| Emerging growth company ¨ |
If an emerging growth company, indicate by check mark if the registrant has elected not to use the extended transition period for complying with any new or revised financial accounting standards provided pursuant to Section 13(a) of the Exchange Act. ¨
Indicate by check mark whether the registrant is a shell company (as defined in Rule 12b-2 of the Act). Yes ¨ No þ
As of June 30, 2017, the aggregate market value of the registrant’s common stock held by non-affiliates of the registrant was approximately $182 billion based on the closing sale price of the common stock as reported on the New York Stock Exchange.
| Class | Outstanding at | January 31, 2018 | ||
| Common Stock, no par value | 1,553,229,898 | shares |
DOCUMENTS INCORPORATED BY REFERENCE
| Document | Parts Into Which Incorporated |
| Portions of the registrant’s definitive proxy statement for use in connection with its annual meeting of shareholders to be held on May 9, 2018, to be filed with the Securities and Exchange Commission (“SEC”) on or about March 29, 2018. | Part III |
TABLE OF CONTENTS
In this report, “PMI,” “we,” “us” and “our” refers to Philip Morris International Inc. and its subsidiaries.
PART I
Item 1. Business.
(a) General Development of Business
General
Philip Morris International Inc. is a Virginia holding company incorporated in 1987. Our subsidiaries and affiliates and their licensees are engaged in the manufacture and sale of cigarettes and other nicotine-containing products in markets outside of the United States of America. We are building our future on smoke-free products that are a much better consumer choice than continuing to smoke cigarettes. Through multidisciplinary capabilities in product development, state-of-the-art facilities and scientific substantiation, we aim to ensure that our smoke-free products meet adult consumer preferences and rigorous regulatory requirements. Our vision is that these products ultimately replace cigarettes to the benefit of adult smokers, society, our company and our shareholders.
Our cigarettes are sold in more than 180 markets, and in many of these markets they hold the number one or number two market share position. We have a wide range of premium, mid-price and low-price brands. Our portfolio comprises both international and local brands and is led by Marlboro, the world’s best-selling international cigarette, which accounted for approximately 35% of our total 2017 cigarette shipment volume. Marlboro is complemented in the premium-price category by Parliament. Our other leading international cigarette brands are Bond Street, Chesterfield, L&M, Lark and Philip Morris. These seven international cigarette brands contributed approximately 75% of our cigarette shipment volume in 2017. We also own a number of important local cigarette brands, such as Dji Sam Soe, Sampoerna A and Sampoerna U in Indonesia; Fortune and Jackpot in the Philippines; Belmont and Canadian Classics in Canada; and Delicados in Mexico. While there are a number of markets where local brands remain important, international brands are expanding their share in numerous markets.
In addition to our leading cigarette brand portfolio, we are engaged in the development and commercialization of smoke-free alternatives to cigarettes. Reduced-risk products ("RRPs") is the term we use to refer to products that present, are likely to present, or have the potential to present less risk of harm to smokers who switch to these products versus continued smoking. We have a range of RRPs in various stages of development, scientific assessment and commercialization. Because our RRPs do not burn tobacco, they produce an aerosol that contains far lower quantities of harmful and potentially harmful constituents than found in cigarette smoke.
Our leading RRP brand, IQOS, is a precisely controlled device into which a specially designed heated tobacco unit is inserted and heated to generate an aerosol. We market our heated tobacco units under the brand names HEETS, HEETS Marlboro and HEETS FROM MARLBORO, defined collectively as HEETS, as well as Marlboro HeatSticks and Parliament HeatSticks. IQOS was first introduced in Nagoya, Japan in 2014. To date, IQOS is available for sale in key cities in 37 markets and nationwide in Japan.
Source of Funds — Dividends
We are a legal entity separate and distinct from our direct and indirect subsidiaries. Accordingly, our right, and thus the right of our creditors and stockholders, to participate in any distribution of the assets or earnings of any subsidiary is subject to the prior rights of creditors of such subsidiary, except to the extent that claims of our company itself as a creditor may be recognized. As a holding company, our principal sources of funds, including funds to make payment on our debt securities, are from the receipt of dividends and repayment of debt from our subsidiaries. Our principal wholly-owned and majority-owned subsidiaries currently are not limited by long-term debt or other agreements in their ability to pay cash dividends or to make other distributions with respect to their common stock.
(b) Financial Information About Segments
For all periods presented in this report, we divided our markets into four geographic regions, which constitute our segments for financial reporting purposes:
| • | The European Union (“EU”) Region is headquartered in Lausanne, Switzerland, and covers all the EU countries and also comprises Switzerland, Norway and Iceland, which are linked to the EU through trade agreements; |
| • | The Eastern Europe, Middle East & Africa (“EEMA”) Region is also headquartered in Lausanne and includes Eastern Europe, certain Balkan countries, Turkey, the Middle East and Africa and our international duty free business; |
| • | The Asia Region is headquartered in Hong Kong and covers all other Asian markets as well as Australia, New Zealand and the Pacific Islands; and |
| • | The Latin America & Canada Region is headquartered in New York and covers the South American continent, Central America, Mexico, the Caribbean and Canada. |
Net revenues and operating companies income* (together with a reconciliation to operating income) attributable to each segment for each of the last three years are set forth in Item 8. Financial Statements and Supplementary Data of this Annual Report on Form 10-K ("Item 8") in Note 12. Segment Reporting to the consolidated financial statements. See Item 7 of this Annual Report on Form 10-K for a discussion of our operating results by business segment.
The relative percentages of operating companies income attributable to each reportable segment were as follows:
| 2017 | 2016 | 2015 | ||||||
| European Union | 32.0 | % | 35.8 | % | 32.6 | % | ||
| Eastern Europe, Middle East & Africa | 24.4 | 27.1 | 31.2 | |||||
| Asia | 35.1 | 28.7 | 26.3 | |||||
| Latin America & Canada | 8.5 | 8.4 | 9.9 | |||||
| 100.0 | % | 100.0 | % | 100.0 | % |
| * | For all periods presented in this report, our management evaluated segment performance and allocated resources based on operating companies income, which we define as operating income, excluding general corporate expenses and amortization of intangibles, plus equity (income)/loss in unconsolidated subsidiaries, net. The accounting policies of the segments are the same as those described in Note 2. Summary of Significant Accounting Policies to the consolidated financial statements in Item 8. |
We use the term net revenues to refer to our operating revenues from the sale of our products, net of sales and promotion incentives. Our net revenues and operating income are affected by various factors, including the volume of products we sell, the price of our products, changes in currency exchange rates and the mix of products we sell. Mix is a term used to refer to the proportionate value of premium-price brands to mid-price or low-price brands in any given market (product mix). Mix can also refer to the proportion of shipment volume in more profitable markets versus shipment volume in less profitable markets (geographic mix). We often collect excise taxes from our customers and then remit them to local governments, and, in those circumstances, we include excise taxes in our net revenues and excise taxes on products. Our cost of sales consists principally of tobacco leaf, non-tobacco raw materials, labor and manufacturing costs, as well as the cost of the IQOS devices produced by third-party electronics manufacturing service providers.
Our marketing, administration and research costs include the costs of marketing and selling our products, other costs generally not related to the manufacture of our products (including general corporate expenses), and costs incurred to develop new products. The most significant components of our marketing, administration and research costs are marketing and sales expenses and general and administrative expenses.
To provide a greater focus on both parts of our business -- combustible and reduced-risk products -- and to support our transformation toward a smoke-free future, effective January 1, 2018, we began managing our business in six reportable segments as follows:
| • | The European Union Region is headquartered in Lausanne, Switzerland and covers all the European Union countries and also Switzerland, Norway and Iceland, which are linked to the European Union through trade agreements; |
| • | The Eastern Europe Region is also headquartered in Lausanne and includes Southeast Europe, Central Asia, Ukraine, Israel and Russia; |
| • | The Middle East & Africa Region is also headquartered in Lausanne and covers the African continent, the Middle East, Turkey and our international duty free business; |
| • | The South & Southeast Asia Region is headquartered in Hong Kong and includes Indonesia, the Philippines and other markets in this region; |
| • | The East Asia & Australia Region is also headquartered in Hong Kong and includes Australia, Japan, South Korea, the People's Republic of China and other markets in this region, as well as Malaysia and Singapore; and |
| • | The Latin America & Canada Region is headquartered in New York and covers the South American continent, Central America, Mexico, the Caribbean and Canada. |
(c) Narrative Description of Business
Our total shipments, including cigarettes and heated tobacco units, decreased by 2.7% in 2017 to 798.2 billion units. We estimate that international industry volumes, including cigarettes and heated tobacco units, were approximately 5.2 trillion units in 2017, a 1.3% decrease over 2016. Excluding the People’s Republic of China (“PRC”), we estimate that the international cigarette and heated tobacco unit volume was 2.8 trillion units in 2017, a 2.8% decrease over 2016. We estimate that our reported share of the international market (which is defined as worldwide cigarette and heated tobacco unit volume, excluding the United States of America) was approximately 15.2% in 2017, 15.5% in 2016 and 15.6% in 2015. Excluding the PRC, we estimate that our reported share of the international market was approximately 28.0%, 28.1%, and 28.6% in 2017, 2016 and 2015, respectively.
Shipments of our principal cigarette brand, Marlboro, decreased by 4.0% in 2017 and represented approximately 9.7% of the international cigarette market, excluding the PRC, in 2017, 9.6% in 2016 and 9.6% in 2015.
We have a market share of at least 15% and, in a number of instances, substantially more than 15%, in approximately 100 markets, including Algeria, Argentina, Australia, Austria, Belgium, Brazil, Canada, the Czech Republic, Egypt, France, Germany, Hong Kong, Indonesia, Israel, Italy, Japan, Korea, Kuwait, Mexico, the Netherlands, Norway, the Philippines, Poland, Portugal, Russia, Saudi Arabia, Spain, Singapore, Switzerland, Turkey and Ukraine.
Heated tobacco units is the term we use to refer to heated tobacco consumables, which include our HEETS, HEETS Marlboro and HEETS FROM MARLBORO, defined collectively as HEETS, as well as Marlboro HeatSticks and Parliament HeatSticks. Total shipment volume of heated tobacco units reached 36.2 billion units in 2017, up from 7.4 billion units in 2016.
References to total international market, defined as worldwide cigarette and heated tobacco unit volume excluding the United States, total industry, total market and market shares in this Form 10-K are our estimates for tax-paid products based on the latest available data from a number of internal and external sources.
Distribution & Sales
Our main types of distribution are tailored to the characteristics of each market and are often used simultaneously:
| • | Direct sales and distribution, where we have set up our own distribution selling directly to the retailers (including gas stations and other key accounts); |
| • | Distribution through independent distributors that often distribute other fast-moving consumer goods and are responsible for distribution in a particular market; |
| • | Exclusive zonified distribution, where the distributors are dedicated to us in tobacco products distribution and assigned to exclusive territories within a market; |
| • | Distribution through national or regional wholesalers that then supply the retail trade; and |
| • | Our own brand retail and e-commerce infrastructures for our RRP products and accessories. |
Competition
We are subject to highly competitive conditions in all aspects of our business. We compete primarily on the basis of product quality, brand recognition, brand loyalty, taste, R&D, innovation, packaging, customer service, marketing, advertising and retail price and, increasingly, adult smoker willingness to convert to our RRPs. Our competitors include three large international tobacco companies and several regional and local tobacco companies and, in some instances, state-owned tobacco enterprises, principally in Algeria, Egypt, the PRC, Taiwan, Thailand and Vietnam. Industry consolidation and privatizations of state-owned enterprises have led to an overall increase in competitive pressures. Some competitors have different profit and volume objectives, and some international competitors are susceptible to changes in currency exchange rates. In the combustible product category, we predominantly sell American blend cigarette brands, such as Marlboro, L&M, Parliament, Philip Morris and Chesterfield, which are the most popular across many of our markets. In the RRP product category, we predominantly sell IQOS devices and heated tobacco units. We seek to compete in all profitable retail price categories, although our brand portfolio is weighted towards the premium-price category.
Procurement and Raw Materials
We purchase tobacco leaf of various types, grades and styles throughout the world, mostly through independent tobacco suppliers. We also contract directly with farmers in several countries, including Argentina, Brazil, Colombia, Ecuador, Italy, Kazakhstan, Pakistan, the Philippines and Poland. In 2017, direct sourcing from farmers represented approximately 22% of PMI’s global leaf requirements. The largest supplies of tobacco leaf are sourced from Argentina, Brazil, China, India, Indonesia (mostly for domestic use in kretek products), Malawi, Mozambique, Philippines, Turkey and the United States.
We believe that there is an adequate supply of tobacco leaf in the world markets to satisfy our current and anticipated production requirements.
In addition to tobacco leaf, we purchase a wide variety of direct materials from a total of approximately 450 suppliers. In 2017, our top ten suppliers of direct materials combined represented approximately 50% of our total direct materials purchases. The three most significant direct materials that we purchase are printed paper board used in packaging, acetate tow used in filter making and fine paper used in the manufacturing of cigarettes and heated tobacco units. In addition, the adequate supply and procurement of cloves are of particular importance to our Indonesian business.
The adequate supply chain for our RRP portfolio, including the supply of electronic devices, is important to our business. We work with two electronics manufacturing service providers for the supply of our IQOS devices and a small number of other providers for other products in our RRP portfolio and related accessories. Although we work closely with these service providers on monitoring their production capability and financial health, the commercialization of our RRPs could be adversely affected if they are unable to meet their commitments. The production of our RRP portfolio requires various metals, and we believe that there is an adequate supply of such metals in the world markets to satisfy our current and anticipated production requirements. However, some components and materials necessary for the production of our RRPs are obtained from single or limited sources, and can be subject to industry-wide shortages and price fluctuations. Our inability to secure an adequate supply of such components and materials could negatively impact the commercialization of our RRPs.
Our IQOS devices are subject to product warranties, which are described in more detail in Item 8. Note 5. Product Warranty to our consolidated financial statements. We discuss our RRP products in more detail in Item 7. Business Environment—Reduced Risk Products.
Business Environment
Information called for by this Item is hereby incorporated by reference to the paragraphs in Item 7, Business Environment.
Other Matters
Customers
None of our business segments is dependent upon a single customer or a few customers, the loss of which would have a material adverse effect on our consolidated results of operations.
Employees
At December 31, 2017, we employed approximately 80,600 people worldwide, including full time, temporary and part-time staff. Our businesses are subject to a number of laws and regulations relating to our relationship with our employees. Generally, these laws and regulations are specific to the location of each business. In addition, in accordance with European Union requirements, we have established a European Works Council composed of management and elected members of our workforce. We believe that our relations with our employees and their representative organizations are excellent.
Executive Officers of the Registrant
The disclosure regarding executive officers is set forth under the heading “Executive Officers as of February 9, 2018” in Item 10. Directors, Executive Officers and Corporate Governance of this Annual Report on Form 10-K ("Item 10").
Research and Development
Our product development is based on the elimination of combustion via tobacco heating and other innovative systems for aerosol generation, which we believe is the most promising path to providing a better consumer choice for those who would otherwise continue to smoke. We recognize that no single product will appeal to all adult smokers. Therefore, we are developing a portfolio of products intended to appeal to a variety of distinct preferences. Four RRP platforms are in various stages of development and commercialization readiness. We describe each of them in more detail in Item 7, Business Environment—Reduced-Risk Products.
The research and development expense for our RRP portfolio accounted for 74%, 72% and 70% of our total research and development expense for the years ended December 31, 2017, 2016 and 2015, respectively.
The research and development expense for the years ended December 31, 2017, 2016 and 2015, is set forth in Item 8, Note 14. Additional Information to the consolidated financial statements.
Intellectual Property
Our trademarks are valuable assets, and their protection and reputation are essential to us. We own the trademark rights to all of our principal brands, including Marlboro, or have the right to use them in all countries where we use them.
In addition, we have more than 7,800 granted patents worldwide and approximately 7,700 pending patent applications. Our patent portfolio, as a whole, is material to our business. However, no one patent, or group of related patents, is material to us. We also have registered industrial designs, as well as unregistered proprietary trade secrets, technology, know-how, processes and other unregistered intellectual property rights.
Effective January 1, 2008, PMI entered into an Intellectual Property Agreement with Philip Morris USA Inc. (“PM USA”). The Intellectual Property Agreement governs the ownership of intellectual property between PMI and PM USA. Ownership of the jointly funded intellectual property has been allocated as follows:
| • | PMI owns all rights to the jointly funded intellectual property outside the United States, its territories and possessions; and |
| • | PM USA owns all rights to the jointly funded intellectual property in the United States, its territories and possessions. |
Ownership of intellectual property related to patent applications and resulting patents based solely on the jointly funded intellectual property, regardless of when filed or issued, will be exclusive to PM USA in the United States, its territories and possessions and exclusive to PMI everywhere else.
The Intellectual Property Agreement contains provisions concerning intellectual property that is independently developed by us or PM USA following March 28, 2008, the date of the spin-off from Altria Group, Inc. For ten years following that date, independently developed intellectual property may be subject to rights under certain circumstances that would allow either us or PM USA a priority position to obtain the rights to the new intellectual property from the other party, with the price and other commercial terms to be negotiated.
In the event of a dispute between us and PM USA under the Intellectual Property Agreement, we have agreed with PM USA to submit the dispute first to negotiation between our and PM USA’s senior executives and then to binding arbitration.
Seasonality
Our business segments are not significantly affected by seasonality, although in certain markets cigarette consumption trends rise during the summer months due to longer daylight time and tourism.
Environmental Regulation
We are subject to international, national and local environmental laws and regulations in the countries in which we do business. We have specific programs across our business units designed to meet applicable environmental compliance requirements and reduce our carbon footprint and wastage as well as water and energy consumption. We report externally about our climate change mitigation strategy, together with associated targets and results in reducing our carbon footprint, through CDP (formerly, the Carbon Disclosure Project), the leading international non-governmental organization assessing the work of thousands of companies worldwide in the area of climate change. We have developed and implemented a consistent environmental and occupational health, safety and security management system ("EHSS"), which involves policies, standard practices and procedures at all our manufacturing centers. We also conduct regular safety assessments at our offices, warehouses and car fleet organizations. Furthermore, we have engaged an external certification body to validate the effectiveness of our EHSS management system at our manufacturing centers around the world, in accordance with internationally recognized standards for safety and environmental management. The environmental performance data we report externally is also verified by a qualified third party. Our subsidiaries expect to continue to make investments in order to drive improved performance and maintain compliance with environmental laws and regulations. We assess and report the compliance status of all our legal entities on a regular basis. Based on the management and controls we have in place and our review of climate change risks (both physical and regulatory), environmental expenditures have not had, and are not expected to have, a material adverse effect on our consolidated results of operations, capital expenditures, financial position, earnings or competitive position.
(d) Financial Information About Geographic Areas
The amounts of net revenues and long-lived assets attributable to each of our geographic segments for each of the last three fiscal years are set forth in Item 8, Note 12. Segment Reporting to the consolidated financial statements.
(e) Available Information
We are required to file with the SEC annual, quarterly and current reports, proxy statements and other information required by the Securities Exchange Act of 1934, as amended (the “Exchange Act”). Investors may read and copy any document that we file, including this Annual Report on Form 10-K, at the SEC’s Public Reference Room at 100 F Street, NE, Washington, D.C. 20549. Investors may obtain information on the operation of the Public Reference Room by calling the SEC at 1-800-SEC-0330. In addition, the SEC maintains an Internet website at http://www.sec.gov that contains reports, proxy and information statements, and other information regarding issuers that file electronically with the SEC, from which investors can electronically access our SEC filings.
We make available free of charge on, or through, our website at www.pmi.com our Annual Report on Form 10-K, Quarterly Reports on Form 10-Q, Current Reports on Form 8-K and amendments to those reports filed or furnished pursuant to Section 13(a) or 15(d) of the Exchange Act as soon as reasonably practicable after we electronically file such material with, or furnish it to, the SEC. Investors can access our filings with the SEC by visiting www.pmi.com.
The information on our website is not, and shall not be deemed to be, a part of this report or incorporated into any other filings we make with the SEC.
Item 1A. Risk Factors.
The following risk factors should be read carefully in connection with evaluating our business and the forward-looking statements contained in this Annual Report on Form 10-K. Any of the following risks could materially adversely affect our business, our operating results, our financial condition and the actual outcome of matters as to which forward-looking statements are made in this Annual Report on Form 10-K.
Forward-Looking and Cautionary Statements
We may from time to time make written or oral forward-looking statements, including statements contained in this Annual Report on Form 10-K and other filings with the SEC, in reports to stockholders and in press releases and investor webcasts. You can identify these forward-looking statements by use of words such as "strategy," "expects," "continues," "plans," "anticipates," "believes," "will," "estimates," "intends," "projects," "goals," "targets" and other words of similar meaning. You can also identify them by the fact that they do not relate strictly to historical or current facts.
We cannot guarantee that any forward-looking statement will be realized, although we believe we have been prudent in our plans and assumptions. Achievement of future results is subject to risks, uncertainties and inaccurate assumptions. Should known or unknown risks or uncertainties materialize, or should underlying assumptions prove inaccurate, actual results could vary materially from those anticipated,
estimated or projected. Investors should bear this in mind as they consider forward-looking statements and whether to invest in or remain invested in our securities. In connection with the “safe harbor” provisions of the Private Securities Litigation Reform Act of 1995, we are identifying important factors that, individually or in the aggregate, could cause actual results and outcomes to differ materially from those contained in any forward-looking statements made by us; any such statement is qualified by reference to the following cautionary statements. We elaborate on these and other risks we face throughout this document, particularly in Item 7, Business Environment. You should understand that it is not possible to predict or identify all risk factors. Consequently, you should not consider the following to be a complete discussion of all potential risks or uncertainties. We do not undertake to update any forward-looking statement that we may make from time to time, except in the normal course of our public disclosure obligations.
Risks Related to Our Business and Industry
| • | Consumption of tax-paid cigarettes continues to decline in many of our markets. |
This decline is due to multiple factors, including increased taxes and pricing, governmental actions, the diminishing social acceptance of smoking, continuing economic and geopolitical uncertainty, and the continuing prevalence of illicit products. These factors and their potential consequences are discussed more fully below and in Item 7, Business Environment.
| • | Cigarettes are subject to substantial taxes. Significant increases in cigarette-related taxes have been proposed or enacted and are likely to continue to be proposed or enacted in numerous jurisdictions. These tax increases may disproportionately affect our profitability and make us less competitive versus certain of our competitors. |
Tax regimes, including excise taxes, sales taxes and import duties, can disproportionately affect the retail price of cigarettes versus other combustible tobacco products, or disproportionately affect the relative retail price of our cigarette brands versus cigarette brands manufactured by certain of our competitors. Because our portfolio is weighted toward the premium-price cigarette category, tax regimes based on sales price can place us at a competitive disadvantage in certain markets. As a result, our volume and profitability may be adversely affected in these markets.
Increases in cigarette taxes are expected to continue to have an adverse impact on our sales of cigarettes, due to resulting lower consumption levels, a shift in sales from manufactured cigarettes to other combustible tobacco products and from the premium-price to the mid-price or low-price cigarette categories, where we may be under-represented, from local sales to legal cross-border purchases of lower price products, or to illicit products such as contraband, counterfeit and "illicit whites."
| • | Our business faces significant governmental action aimed at increasing regulatory requirements with the goal of reducing or preventing the use of tobacco products. |
Governmental actions, combined with the diminishing social acceptance of smoking and private actions to restrict smoking, have resulted in reduced industry volume in many of our markets, and we expect that such factors will continue to reduce consumption levels and will increase down-trading and the risk of counterfeiting, contraband, "illicit whites" and legal cross-border purchases. Significant regulatory developments will take place over the next few years in most of our markets, driven principally by the World Health Organization's Framework Convention on Tobacco Control (“FCTC”). The FCTC is the first international public health treaty on tobacco, and its objective is to establish a global agenda for tobacco regulation. The FCTC has led to increased efforts by tobacco control advocates and public health organizations to promote increasingly restrictive regulatory measures on the marketing and sale of tobacco products to adult smokers. Regulatory initiatives that have been proposed, introduced or enacted include:
| • | restrictions on or licensing of outlets permitted to sell cigarettes; |
| • | the levying of substantial and increasing tax and duty charges; |
| • | restrictions or bans on advertising, marketing and sponsorship; |
| • | the display of larger health warnings, graphic health warnings and other labeling requirements; |
| • | restrictions on packaging design, including the use of colors, and plain packaging; |
| • | restrictions on packaging and cigarette formats and dimensions; |
| • | restrictions or bans on the display of tobacco product packaging at the point of sale and restrictions or bans on cigarette vending machines; |
| • | requirements regarding testing, disclosure and performance standards for tar, nicotine, carbon monoxide and other smoke constituents; |
| • | disclosure, restrictions, or bans of tobacco product ingredients; |
| • | increased restrictions on smoking in public and work places and, in some instances, in private places and outdoors; |
| • | restrictions on the sale of novel tobacco or nicotine-containing products; |
| • | elimination of duty free sales and duty free allowances for travelers; and |
| • | encouraging litigation against tobacco companies. |
Our operating income could be significantly affected by regulatory initiatives resulting in a significant decrease in demand for our brands, in particular requirements that lead to a commoditization of tobacco products, as well as any significant increase in the cost of complying with new regulatory requirements.
| • | Litigation related to tobacco use and exposure to environmental tobacco smoke could substantially reduce our profitability and could severely impair our liquidity. |
There is litigation related to tobacco products pending in certain jurisdictions. Damages claimed in some tobacco-related litigation are significant and, in certain cases in Brazil, Canada and Nigeria, range into the billions of U.S. dollars. We anticipate that new cases will continue to be filed. The FCTC encourages litigation against tobacco product manufacturers. It is possible that our consolidated results of operations, cash flows or financial position could be materially affected in a particular fiscal quarter or fiscal year by an unfavorable outcome or settlement of certain pending litigation. See Item 8, Note 18. Contingencies (“Note 18. Contingencies”) for a discussion of pending litigation.
| • | We face intense competition, and our failure to compete effectively could have a material adverse effect on our profitability and results of operations. |
We compete primarily on the basis of product quality, brand recognition, brand loyalty, taste, R&D, innovation, packaging, customer service, marketing, advertising and retail price and, increasingly, adult smoker willingness to convert to our RRPs. We are subject to highly competitive conditions in all aspects of our business. The competitive environment and our competitive position can be significantly influenced by weak economic conditions, erosion of consumer confidence, competitors' introduction of lower-price products or innovative products, higher tobacco product taxes, higher absolute prices and larger gaps between retail price categories, and product regulation that diminishes the ability to differentiate tobacco products. Competitors include three large international tobacco companies and several regional and local tobacco companies and, in some instances, state-owned tobacco enterprises, principally in Algeria, Egypt, the PRC, Taiwan, Thailand and Vietnam. Industry consolidation and privatizations of state-owned enterprises have led to an overall increase in competitive pressures. Some competitors have different profit and volume objectives, and some international competitors are susceptible to changes in different currency exchange rates.
| • | Because we have operations in numerous countries, our results may be influenced by economic, regulatory and political developments, natural disasters or conflicts. |
Some of the countries in which we operate face the threat of civil unrest and can be subject to regime changes. In others, nationalization, terrorism, conflict and the threat of war may have a significant impact on the business environment. Economic, political, regulatory or other developments or natural disasters could disrupt our supply chain, manufacturing capabilities or distribution capabilities. In addition, such developments could lead to loss of property or equipment that are critical to our business in certain markets and difficulty in staffing and managing our operations, which could reduce our volumes, revenues and net earnings.
In certain markets, we are dependent on governmental approvals of various actions such as price changes, and failure to obtain such approvals could impair growth of our profitability.
In addition, despite our high ethical standards and rigorous control and compliance procedures aimed at preventing and detecting unlawful conduct, given the breadth and scope of our international operations, we may not be able to detect all potential improper or unlawful conduct by our employees and partners.
| • | We may be unable to anticipate changes in consumer preferences or to respond to consumer behavior influenced by economic downturns. |
Our business is subject to changes in adult consumer preferences, which may be influenced by local economic conditions. To be successful, we must:
| • | promote brand equity successfully; |
| • | anticipate and respond to new adult consumer trends; |
| • | develop new products and markets and broaden brand portfolios; |
| • | improve productivity; |
| • | convince adult smokers to convert to our RRPs; |
| • | ensure adequate production capacity to meet demand for our products; and |
| • | be able to protect or enhance margins through price increases. |
In periods of economic uncertainty, adult consumers may tend to purchase lower-price brands, and the volume of our premium-price and mid-price brands and our profitability could suffer accordingly. Such down-trading trends may be reinforced by regulation that limits branding, communication and product differentiation.
| • | We lose revenues as a result of counterfeiting, contraband, cross-border purchases, “illicit whites” and non-tax-paid volume produced by local manufacturers. |
Large quantities of counterfeit cigarettes are sold in the international market. We believe that Marlboro is the most heavily counterfeited international cigarette brand, although we cannot quantify the revenues we lose as a result of this activity. In addition, our revenues are reduced by contraband, legal cross-border purchases, “illicit whites” and non-tax-paid volume produced by local manufacturers.
| • | From time to time, we are subject to governmental investigations on a range of matters. |
Investigations include allegations of contraband shipments of cigarettes, allegations of unlawful pricing activities within certain markets, allegations of underpayment of customs duties and/or excise taxes, allegations of false and misleading usage of descriptors and allegations of unlawful advertising. We cannot predict the outcome of those investigations or whether additional investigations may be commenced, and it is possible that our business could be materially affected by an unfavorable outcome of pending or future investigations. See Note 18. Contingencies—Other Litigation and Item 7, Business Environment-Governmental Investigations for a description of certain governmental investigations to which we are subject.
| • | We may be unsuccessful in our attempts to introduce reduced-risk products, and regulators may not permit the commercialization of these products or the communication of scientifically substantiated risk-reduction claims. |
Our key strategic priorities are: to develop and commercialize products that present less risk of harm to adult smokers who switch to those products versus continued smoking; and to convince current adult smokers who would otherwise continue to smoke to switch to those RRPs. For our efforts to be successful, we must: develop RRPs that such adult smokers find acceptable alternatives to smoking; conduct rigorous scientific studies to substantiate that they reduce exposure to harmful and potentially harmful constituents in smoke and, ultimately, that these products present, are likely to present, or have the potential to present less risk of harm to adult smokers who switch to them versus continued smoking; and effectively advocate for the development of science-based regulatory frameworks for the development and commercialization of RRPs, including communication of scientifically substantiated information to enable adult smokers to make better consumer choices. We might not succeed in our efforts. If we do not succeed, but others do, we may be at a competitive disadvantage. Furthermore, we cannot predict whether regulators will permit the sale and/or marketing of RRPs with scientifically substantiated risk-reduction claims. Such restrictions could limit the success of our RRPs.
| • | We may be unsuccessful in our efforts to differentiate reduced-risk products and cigarettes with respect to taxation. |
To date, we have been largely successful in demonstrating to regulators that our RRPs are not cigarettes, and as such they are generally taxed either as a separate category or as other tobacco products, which typically yields more favorable tax rates than cigarettes. If we cease to be successful in these efforts, RRP unit margins may be adversely affected.
| • | Our reported results could be adversely affected by unfavorable currency exchange rates, and currency devaluations could impair our competitiveness. |
We conduct our business primarily in local currency and, for purposes of financial reporting, the local currency results are translated into U.S. dollars based on average exchange rates prevailing during a reporting period. During times of a strengthening U.S. dollar, our reported net revenues and operating income will be reduced because the local currency translates into fewer U.S. dollars. During periods of local economic crises, foreign currencies may be devalued significantly against the U.S. dollar, reducing our margins. Actions to recover margins may result in lower volume and a weaker competitive position.
| • | Changes in the earnings mix and changes in tax laws may result in significant variability in our effective tax rates. Our ability to receive payments from foreign subsidiaries or to repatriate royalties and dividends could be restricted by local country currency exchange controls. |
The Tax Cuts and Jobs Act that was signed into law in December 2017 constitutes a major change to the U.S. tax system. Our estimated impact of the Tax Cuts and Jobs Act is based on management’s current interpretations, and our analysis is ongoing. Our final tax liability may be materially different from current estimates due to developments such as implementing regulations and clarifications. In future periods, our effective tax rate and our ability to recover deferred tax assets could be subject to additional uncertainty as a result of such developments. Furthermore, changes in the earnings mix or applicable foreign tax laws may result in significant variability in our effective tax rates. Because we are a U.S. holding company, our most significant source of funds is distributions from our non-U.S. subsidiaries. Certain countries in which we operate have adopted or could institute currency exchange controls that limit or prohibit our local subsidiaries' ability to convert local currency into U.S. dollars or to make payments outside the country. This could subject us to the risks of local currency devaluation and business disruption.
| • | Our ability to grow profitability may be limited by our inability to introduce new products, enter new markets or improve our margins through higher pricing and improvements in our brand and geographic mix. |
Our profit growth may suffer if we are unable to introduce new products or enter new markets successfully, to raise prices or to improve the proportion of our sales of higher margin products and in higher margin geographies.
| • | We may be unable to expand our brand portfolio through successful acquisitions or the development of strategic business relationships. |
One element of our growth strategy is to strengthen our brand portfolio and market positions through selective acquisitions and the development of strategic business relationships. Acquisition and strategic business development opportunities are limited and present risks of failing to achieve efficient and effective integration, strategic objectives and anticipated revenue improvements and cost savings. There is no assurance that we will be able to acquire attractive businesses on favorable terms, or that future acquisitions or strategic business developments will be accretive to earnings.
| • | Government mandated prices, production control programs, shifts in crops driven by economic conditions and the impact of climate change may increase the cost or reduce the quality of the tobacco and other agricultural products used to manufacture our products. |
As with other agricultural commodities, the price of tobacco leaf and cloves can be influenced by imbalances in supply and demand, and crop quality can be influenced by variations in weather patterns, including those caused by climate change. Tobacco production in certain countries is subject to a variety of controls, including government mandated prices and production control programs. Changes in the patterns of demand for agricultural products could cause farmers to produce less tobacco or cloves. Any significant change in tobacco leaf and clove prices, quality and quantity could affect our profitability and our business.
| • | Our ability to implement our strategy of attracting and retaining the best global talent may be impaired by the decreasing social acceptance of cigarette smoking. |
The tobacco industry competes for talent with consumer products and other companies that enjoy greater societal acceptance. As a result, we may be unable to attract and retain the best global talent.
| • | The failure of our information systems to function as intended or their penetration by outside parties with the intent to corrupt them or our failure to comply with privacy laws and regulations could result in business disruption, litigation and regulatory action, and loss of revenue, assets or personal or other confidential data. |
We use information systems to help manage business processes, collect and interpret business data and communicate internally and externally with employees, suppliers, customers and others. Some of these information systems are managed by third-party service providers. We have backup systems and business continuity plans in place, and we take care to protect our systems and data from unauthorized access. Nevertheless, failure of our systems to function as intended, or penetration of our systems by outside parties intent on extracting or corrupting information or otherwise disrupting business processes, could place us at a competitive disadvantage, result in a loss of revenue, assets or personal or other sensitive data, litigation and regulatory action, cause damage to our reputation and that of our brands and result in significant remediation and other costs. Failure to protect personal data and respect the rights of data subjects could subject us to substantial fines under regulations such as the EU General Data Protection Regulation.
| • | We may be required to replace third-party contract manufacturers or service providers with our own resources. |
In certain instances, we contract with third parties to manufacture some of our products or product parts or to provide other services. We may be unable to renew these agreements on satisfactory terms for numerous reasons, including government regulations. Accordingly, our costs may increase significantly if we must replace such third parties with our own resources.
Item 1B. Unresolved Staff Comments.
None.
Item 2. Properties.
At December 31, 2017, we operated and owned 46 manufacturing facilities and maintained contract manufacturing relationships with 25 third-party manufacturers across 23 markets. In addition, we work with 38 third-party operators in Indonesia who manufacture our hand-rolled cigarettes.
PMI-Owned Manufacturing Facilities
| EU (1) | EEMA | Asia | Latin America & Canada | TOTAL | ||||||||||
| Fully integrated | 7 | 8 | 9 | 7 | 31 | |||||||||
| Make-pack | 3 | — | 1 | 2 | 6 | |||||||||
| Other | 3 | 1 | 3 | 2 | 9 | |||||||||
| Total | 13 | 9 | 13 | 11 | 46 |
(1) Includes facilities that produced heated tobacco units in 2017.
In 2017, 23 of our facilities each manufactured over 10 billion cigarettes, of which eight facilities each produced over 30 billion units. Our largest factories are in Karawang and Sukorejo (Indonesia), Izmir (Turkey), Krakow (Poland), St. Petersburg and Krasnodar (Russia), Batangas and Marikina (Philippines), Berlin (Germany), Kharkiv (Ukraine), and Kutna Hora (Czech Republic). Our smallest factories are mostly in Latin America and Asia, where due to tariff and other constraints we have established small manufacturing units in individual markets. We will continue to optimize our manufacturing base, taking into consideration the evolution of trade blocks.
The plants and properties owned or leased and operated by our subsidiaries are maintained in good condition and are believed to be suitable and adequate for our present needs.
We are integrating the production of heated tobacco units into a number of our existing manufacturing facilities and progressing with our plans to build manufacturing capacity for our other RRP platforms.
Item 3. Legal Proceedings.
The information called for by this Item is incorporated herein by reference to Item 8. Note 18. Contingencies.
Item 4. Mine Safety Disclosures.
Not applicable.
PART II
Item 5. Market for Registrant’s Common Equity, Related Stockholder Matters and Issuer Purchases of Equity Securities.
The principal stock exchange on which our common stock (no par value) is listed is the New York Stock Exchange. At January 31, 2018, there were approximately 57,300 holders of record of our common stock.
Performance Graph
The graph below compares the cumulative total shareholder return on PMI's common stock with the cumulative total return for the same period of PMI's Peer Group and the S&P 500 Index. The graph assumes the investment of $100 as of December 31, 2012, in PMI common stock (at prices quoted on the New York Stock Exchange) and each of the indices as of the market close and reinvestment of dividends on a quarterly basis.
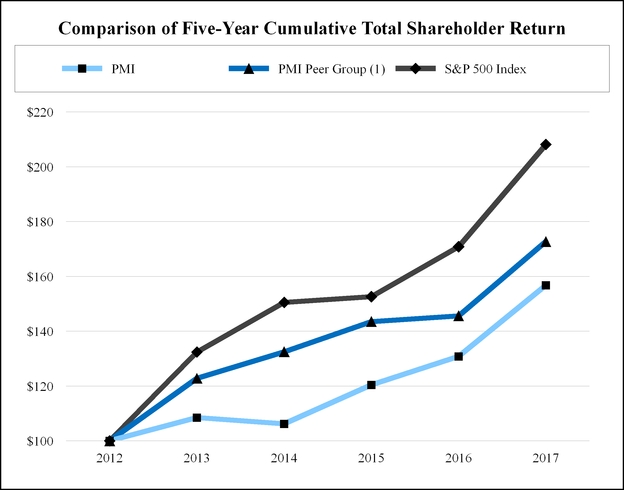
| Date | PMI | PMI Peer Group (1) | S&P 500 Index | ||||
| December 31, 2012 | $100.00 | $100.00 | $100.00 | ||||
| December 31, 2013 | $108.50 | $122.80 | $132.40 | ||||
| December 31, 2014 | $106.20 | $132.50 | $150.50 | ||||
| December 31, 2015 | $120.40 | $143.50 | $152.60 | ||||
| December 31, 2016 | $130.80 | $145.60 | $170.80 | ||||
| December 31, 2017 | $156.80 | $172.70 | $208.10 |
(1) The PMI Peer Group presented in this graph is the same as that used in the prior year, except Reynolds American Inc. was removed following the completion of its acquisition by British American Tobacco p.l.c. on July 25, 2017. The PMI Peer Group was established based on a review of four characteristics: global presence; a focus on consumer products; and net revenues and a market capitalization of a similar size to those of PMI. The review also considered the primary international tobacco companies. As a result of this review, the following companies constitute the PMI Peer Group: Altria Group, Inc., Anheuser-Busch InBev SA/NV, British American Tobacco p.l.c., The Coca-Cola Company, Colgate-Palmolive Co., Diageo plc, Heineken N.V., Imperial Brands PLC, Japan Tobacco Inc., Johnson & Johnson, Kimberly-Clark Corporation, The Kraft-Heinz Company, McDonald's Corp., Mondelēz International, Inc., Nestlé S.A., PepsiCo, Inc., The Procter & Gamble Company, Roche Holding AG, and Unilever NV and PLC.
Note: Figures are rounded to the nearest $0.10.
Issuer Purchases of Equity Securities During the Quarter Ended December 31, 2017
Our share repurchase activity for each of the three months in the quarter ended December 31, 2017, was as follows:
| Period | Total Number of Shares Repurchased | Average Price Paid per Share | Total Number of Shares Purchased as Part of Publicly Announced Plans or Programs | Approximate Dollar Value of Shares that May Yet be Purchased Under the Plans or Programs | ||||||||||
| October 1, 2017 – October 31, 2017 (1) | — | $ | — | — | $ | — | ||||||||
| November 1, 2017 – November 30, 2017 (1) | — | $ | — | — | $ | — | ||||||||
| December 1, 2017 – December 31, 2017 (1) | — | $ | — | — | $ | — | ||||||||
| Pursuant to Publicly Announced Plans or Programs | — | $ | — | |||||||||||
| October 1, 2017 – October 31, 2017 (2) | 672 | $ | 112.68 | |||||||||||
| November 1, 2017 – November 30, 2017 (2) | 271 | $ | 104.73 | |||||||||||
| December 1, 2017 – December 31, 2017 (2) | 497 | $ | 102.99 | |||||||||||
| For the Quarter Ended December 31, 2017 | 1,440 | $ | 107.84 |
| (1) | During this reporting period, we did not have an authorized share repurchase program. |
| (2) | Shares repurchased represent shares tendered to us by employees who vested in restricted share unit awards and used shares to pay all, or a portion of, the related taxes. |
The other information called for by this Item is included in Item 8, Note 22. Quarterly Financial Data (Unaudited) to the consolidated financial statements.
Item 6. Selected Financial Data
(in millions of dollars, except per share data)
| 2017 | 2016 | 2015 | 2014 | 2013 | |||||||||||||||
| Summary of Operations: | |||||||||||||||||||
| Net revenues | $ | 78,098 | $ | 74,953 | $ | 73,908 | $ | 80,106 | $ | 80,029 | |||||||||
| Cost of sales | 10,432 | 9,391 | 9,365 | 10,436 | 10,410 | ||||||||||||||
| Excise taxes on products | 49,350 | 48,268 | 47,114 | 50,339 | 48,812 | ||||||||||||||
| Gross profit | 18,316 | 17,294 | 17,429 | 19,331 | 20,807 | ||||||||||||||
| Operating income | 11,503 | 10,815 | 10,623 | 11,702 | 13,515 | ||||||||||||||
| Interest expense, net | 914 | 891 | 1,008 | 1,052 | 973 | ||||||||||||||
| Earnings before income taxes | 10,589 | 9,924 | 9,615 | 10,650 | 12,542 | ||||||||||||||
| Pre-tax profit margin | 13.6 | % | 13.2 | % | 13.0 | % | 13.3 | % | 15.7 | % | |||||||||
| Provision for income taxes | 4,307 | 2,768 | 2,688 | 3,097 | 3,670 | ||||||||||||||
| Net earnings | 6,341 | 7,250 | 7,032 | 7,658 | 8,850 | ||||||||||||||
| Net earnings attributable to noncontrolling interests | 306 | 283 | 159 | 165 | 274 | ||||||||||||||
| Net earnings attributable to PMI | 6,035 | 6,967 | 6,873 | 7,493 | 8,576 | ||||||||||||||
| Basic earnings per share | 3.88 | 4.48 | 4.42 | 4.76 | 5.26 | ||||||||||||||
| Diluted earnings per share | 3.88 | 4.48 | 4.42 | 4.76 | 5.26 | ||||||||||||||
| Dividends declared per share | 4.22 | 4.12 | 4.04 | 3.88 | 3.58 | ||||||||||||||
| Capital expenditures | 1,548 | 1,172 | 960 | 1,153 | 1,200 | ||||||||||||||
| Depreciation and amortization | 875 | 743 | 754 | 889 | 882 | ||||||||||||||
| Property, plant and equipment, net | 7,271 | 6,064 | 5,721 | 6,071 | 6,755 | ||||||||||||||
| Inventories | 8,806 | 9,017 | 8,473 | 8,592 | 9,846 | ||||||||||||||
| Total assets | 42,968 | 36,851 | 33,956 | 35,187 | 38,168 | ||||||||||||||
| Long-term debt | 31,334 | 25,851 | 25,250 | 26,929 | 24,023 | ||||||||||||||
| Total debt | 34,339 | 29,067 | 28,480 | 29,455 | 27,678 | ||||||||||||||
| Stockholders' deficit | (10,230 | ) | (10,900 | ) | (11,476 | ) | (11,203 | ) | (6,274 | ) | |||||||||
| Common dividends declared as a % of Diluted EPS | 108.8 | % | 92.0 | % | 91.4 | % | 81.5 | % | 68.1 | % | |||||||||
| Market price per common share — high/low | 123.55-89.97 | 104.20-84.46 | 90.27-75.27 | 91.63-75.28 | 96.73-82.86 | ||||||||||||||
| Closing price of common share at year end | 105.65 | 91.49 | 87.91 | 81.45 | 87.13 | ||||||||||||||
| Price/earnings ratio at year end — Diluted | 27 | 20 | 20 | 17 | 17 | ||||||||||||||
| Number of common shares outstanding at year end (millions) | 1,553 | 1,551 | 1,549 | 1,547 | 1,589 | ||||||||||||||
| Number of employees | 80,600 | 79,500 | 80,200 | 82,500 | 91,100 |
This Selected Financial Data should be read in conjunction with Item 7 and Item 8.
Item 7. Management’s Discussion and Analysis of Financial Condition and Results of Operations.
The following discussion should be read in conjunction with the other sections of this Annual Report on Form 10-K, including the consolidated financial statements and related notes contained in Item 8, and the discussion of risks and cautionary factors that may affect future results in Item 1A. Risk Factors.
Description of Our Company
We are a leading international tobacco company engaged in the manufacture and sale of cigarettes and other nicotine-containing products in markets outside the United States of America. We are building our future on smoke-free products that are a much better consumer choice than continuing to smoke cigarettes. Through multidisciplinary capabilities in product development, state-of-the-art facilities and scientific substantiation, we aim to ensure that our smoke-free products meet adult consumer preferences and rigorous regulatory requirements. Our vision is that these products ultimately replace cigarettes to the benefit of adult smokers, society, our company and our shareholders.
Our cigarettes are sold in more than 180 markets, and in many of these markets they hold the number one or number two market share position. We have a wide range of premium, mid-price and low-price brands. Our portfolio comprises both international and local brands. In addition to the manufacture and sale of cigarettes, we are engaged in the development and commercialization of reduced-risk products ("RRPs"). RRPs is the term we use to refer to products that present, are likely to present, or have the potential to present less risk of harm to smokers who switch to these products versus continued smoking. We have a range of RRPs in various stages of development, scientific assessment and commercialization. Because our RRPs do not burn tobacco, they produce an aerosol that contains far lower quantities of harmful and potentially harmful constituents than found in cigarette smoke.
For all periods presented in this report, we managed our business in four segments:
| • | European Union; |
| • | Eastern Europe, Middle East & Africa (“EEMA”); |
| • | Asia; and |
| • | Latin America & Canada. |
To provide a greater focus on both parts of our business -- combustible and reduced-risk products -- and to support our transformation toward a smoke-free future, effective January 1, 2018, we are managing our business in six reportable segments as follows:
| • | European Union - Covers all the European Union countries and also Switzerland, Norway and Iceland, which are linked to the European Union through trade agreements; |
| • | Eastern Europe - Includes Southeast Europe, Central Asia, Ukraine, Israel and Russia; |
| • | Middle East & Africa - Covers the African continent, the Middle East, Turkey and PMI Duty Free; |
| • | South & Southeast Asia - Includes Indonesia, the Philippines and other markets in this region; |
| • | East Asia & Australia - Includes Australia, Japan, South Korea, the People's Republic of China and other markets in this region, as well as Malaysia and Singapore; and |
| • | Latin America & Canada - Covers the South American continent, Central America, Mexico, the Caribbean and Canada. |
We use the term net revenues to refer to our operating revenues from the sale of our products, net of sales and promotion incentives. Our net revenues and operating income are affected by various factors, including the volume of products we sell, the price of our products, changes in currency exchange rates and the mix of products we sell. Mix is a term used to refer to the proportionate value of premium-price brands to mid-price or low-price brands in any given market (product mix). Mix can also refer to the proportion of shipment volume in more profitable markets versus shipment volume in less profitable markets (geographic mix). We often collect excise taxes from our customers and then remit them to governments, and, in those circumstances, we include the excise taxes in our net revenues and in excise taxes on products. Our cost of sales consists principally of tobacco leaf, non-tobacco raw materials, labor and manufacturing costs, as well as the cost of the IQOS devices produced by third-party electronics manufacturing service providers.
Our marketing, administration and research costs include the costs of marketing and selling our products, other costs generally not related to the manufacture of our products (including general corporate expenses), and costs incurred to develop new products. The most
significant components of our marketing, administration and research costs are marketing and sales expenses and general and administrative expenses.
Philip Morris International Inc. is a legal entity separate and distinct from its direct and indirect subsidiaries. Accordingly, our right, and thus the right of our creditors and stockholders, to participate in any distribution of the assets or earnings of any subsidiary is subject to the prior rights of creditors of such subsidiary, except to the extent that claims of our company itself as a creditor may be recognized. As a holding company, our principal sources of funds, including funds to make payment on our debt securities, are from the receipt of dividends and repayment of debt from our subsidiaries. Our principal wholly-owned and majority-owned subsidiaries currently are not limited by long-term debt or other agreements in their ability to pay cash dividends or to make other distributions with respect to their common stock.
Executive Summary
The following executive summary provides significant highlights from the Discussion and Analysis that follows.
Consolidated Operating Results
| • | Net Revenues and Net Revenues, Excluding Excise Taxes on Products – The changes in our net revenues, and net revenues, excluding excise taxes, for the year ended December 31, 2017, from the comparable 2016 amounts, were as follows: |
| For the Years Ended December 31, | Variance | Variance due to | ||||||||||||||||||||
| (in millions) | 2017 | 2016 | $ | % | Currency | Volume/Mix | Pricing | |||||||||||||||
| Net revenues | $ | 78,098 | $ | 74,953 | $ | 3,145 | 4.2 | % | $ | (2,355 | ) | $ | (439 | ) | $ | 5,939 | ||||||
| Excise taxes on products | (49,350 | ) | (48,268 | ) | (1,082 | ) | (2.2 | )% | 1,918 | 1,553 | (4,553 | ) | ||||||||||
| Net revenues, excluding excise taxes on products | $ | 28,748 | $ | 26,685 | $ | 2,063 | 7.7 | % | $ | (437 | ) | $ | 1,114 | $ | 1,386 |
Net revenues include $3.8 billion in 2017 and $739 million in 2016 related to the sale of RRPs, mainly driven by Japan. These net revenue amounts include excise taxes billed to customers, where we collect and remit the excise tax. Excluding excise taxes, net revenues for RRPs were $3.6 billion in 2017 and $733 million in 2016. In some jurisdictions, including Japan, we are not responsible for collecting excise taxes.
| • | Diluted Earnings Per Share – The changes in our reported diluted earnings per share (“diluted EPS”) for the year ended December 31, 2017, from the comparable 2016 amounts, were as follows: |
| Diluted EPS | % Growth | ||||
| For the year ended December 31, 2016 | $ | 4.48 | |||
| 2016 Asset impairment and exit costs | — | ||||
| 20 |
Showing the first 8K of 187K characters. Open the full section
Item 7A. Quantitative and Qualitative Disclosures About Market Risk.
The information called for by this Item is included in Item 7, Market Risk.
Item 8. Financial Statements and Supplementary Data.
Consolidated Balance Sheets
(in millions of dollars, except share data)
| at December 31, | 2017 | 2016 | |||||
| Assets | |||||||
| Cash and cash equivalents | $ | 8,447 | $ | 4,239 | |||
| Receivables (less allowances of $30 in 2017 and $42 in 2016) | 3,738 | 3,499 | |||||
| Inventories: | |||||||
| Leaf tobacco | 2,606 | 2,498 | |||||
| Other raw materials | 1,563 | 1,569 | |||||
| Finished product | 4,637 | 4,950 | |||||
| 8,806 | 9,017 | ||||||
| Other current assets | 603 | 853 | |||||
| Total current assets | 21,594 | 17,608 | |||||
| Property, plant and equipment, at cost: | |||||||
| Land and land improvements | 639 | 590 | |||||
| Buildings and building equipment | 3,989 | 3,474 | |||||
| Machinery and equipment | 8,976 | 7,366 | |||||
| Construction in progress | 962 | 930 | |||||
| 14,566 | 12,360 | ||||||
| Less: accumulated depreciation | 7,295 | 6,296 | |||||
| 7,271 | 6,064 | ||||||
| Goodwill (Note 3) | 7,666 | 7,324 | |||||
| Other intangible assets, net (Note 3) | 2,432 | 2,470 | |||||
| Investments in unconsolidated subsidiaries (Note 4) | 1,074 | 1,011 | |||||
| Deferred income taxes | 1,007 | 859 | |||||
| Other assets | 1,924 | 1,515 | |||||
| Total Assets | $ | 42,968 | $ | 36,851 |
See notes to consolidated financial statements.
| at December 31, | 2017 | 2016 | |||||
| Liabilities | |||||||
| Short-term borrowings (Note 7) | $ | 499 | $ | 643 | |||
| Current portion of long-term debt (Note 7) | 2,506 | 2,573 | |||||
| Accounts payable | 2,242 | 1,666 | |||||
| Accrued liabilities: | |||||||
| Marketing and selling | 708 | 575 | |||||
| Taxes, except income taxes | 5,324 | 6,204 | |||||
| Employment costs | 856 | 800 | |||||
| Dividends payable | 1,669 | 1,621 | |||||
| Other | 1,346 | 1,553 | |||||
| Income taxes (Note 11) | 812 | 832 | |||||
| Total current liabilities | 15,962 | 16,467 | |||||
| Long-term debt (Note 7) | 31,334 | 25,851 | |||||
| Deferred income taxes | 799 | 1,897 | |||||
| Employment costs | 2,271 | 2,800 | |||||
| Income taxes and other liabilities (Note 11) | 2,832 | 736 | |||||
| Total liabilities | 53,198 | 47,751 | |||||
| Contingencies (Note 18) | |||||||
| Stockholders’ (Deficit) Equity | |||||||
| Common stock, no par value (2,109,316,331 shares issued in 2017 and 2016) | — | — | |||||
| Additional paid-in capital | 1,972 | 1,964 | |||||
| Earnings reinvested in the business | 29,859 | 30,397 | |||||
| Accumulated other comprehensive losses | (8,535 | ) | (9,559 | ) | |||
| 23,296 | 22,802 | ||||||
| Less: cost of repurchased stock (556,098,569 and 557,930,784 shares in 2017 and 2016, respectively) | 35,382 | 35,490 | |||||
| Total PMI stockholders’ deficit | (12,086 | ) | (12,688 | ) | |||
| Noncontrolling interests | 1,856 | 1,788 | |||||
| Total stockholders’ deficit | (10,230 | ) | (10,900 | ) | |||
| Total Liabilities and Stockholders’ (Deficit) Equity | $ | 42,968 | $ | 36,851 |
See notes to consolidated financial statements.
Consolidated Statements of Earnings
(in millions of dollars, except per share data)
| for the years ended December 31, | 2017 | 2016 | 2015 | ||||||||
| Net revenues | $ | 78,098 | $ | 74,953 | $ | 73,908 | |||||
| Cost of sales | 10,432 | 9,391 | 9,365 | ||||||||
| Excise taxes on products | 49,350 | 48,268 | 47,114 | ||||||||
| Gross profit | 18,316 | 17,294 | 17,429 | ||||||||
| Marketing, administration and research costs | 6,725 | 6,405 | 6,656 | ||||||||
| Asset impairment and exit costs | — | — | 68 | ||||||||
| Amortization of intangibles | 88 | 74 | 82 | ||||||||
| Operating income | 11,503 | 10,815 | 10,623 | ||||||||
| Interest expense, net (Note 14) | 914 | 891 | 1,008 | ||||||||
| Earnings before income taxes | 10,589 | 9,924 | 9,615 | ||||||||
| Provision for income taxes (Note 11) | 4,307 | 2,768 | 2,688 | ||||||||
| Equity (income)/loss in unconsolidated subsidiaries, net | (59 | ) | (94 | ) | (105 | ) | |||||
| Net earnings | 6,341 | 7,250 | 7,032 | ||||||||
| Net earnings attributable to noncontrolling interests | 306 | 283 | 159 | ||||||||
| Net earnings attributable to PMI | $ | 6,035 | $ | 6,967 | $ | 6,873 | |||||
| Per share data (Note 10): | |||||||||||
| Basic earnings per share | $ | 3.88 | $ | 4.48 | $ | 4.42 | |||||
| Diluted earnings per share | $ | 3.88 | $ | 4.48 | $ | 4.42 |
See notes to consolidated financial statements.
Consolidated Statements of Comprehensive Earnings
(in millions of dollars)
| for the years ended December 31, | 2017 | 2016 | 2015 | ||||||||
| Net earnings | $ | 6,341 | $ | 7,250 | $ | 7,032 | |||||
| Other comprehensive earnings (losses), net of income taxes: | |||||||||||
| Change in currency translation adjustments: | |||||||||||
| Unrealized gains (losses), net of income taxes of $620 in 2017, ($101) in 2016 and ($143) in 2015 | 330 | (14 | ) | (2,248 | ) | ||||||
| (Gains)/losses transferred to earnings, net of income taxes of $- in 2017, 2016 and 2015 | (2 | ) | 5 | (1 | ) | ||||||
| Change in net loss and prior service cost: | |||||||||||
| Net gains (losses) and prior service costs, net of income taxes of ($17) in 2017, $78 in 2016 and $17 in 2015 | 523 | (460 | ) | (536 | ) | ||||||
| Amortization of net losses, prior service costs and net transition costs, net of income taxes of ($31) in 2017, ($43) in 2016 and ($48) in 2015 | 228 | 224 | 227 | ||||||||
| Change in fair value of derivatives accounted for as hedges: | |||||||||||
| Gains (losses) recognized, net of income taxes of $8 in 2017, ($4) in 2016 and ($5) in 2015 | (44 | ) | 8 | 38 | |||||||
| (Gains) losses transferred to earnings, net of income taxes of $2 in 2017, ($3) in 2016 and $14 in 2015 | (11 | ) | 30 | (102 | ) | ||||||
| Total other comprehensive earnings (losses) | 1,024 | (207 | ) | (2,622 | ) | ||||||
| Total comprehensive earnings | 7,365 | 7,043 | 4,410 | ||||||||
| Less comprehensive earnings attributable to: | |||||||||||
| Noncontrolling interests | 306 | 233 | 113 | ||||||||
| Comprehensive earnings attributable to PMI | $ | 7,059 | $ | 6,810 | $ | 4,297 |
See notes to consolidated financial statements.
Consolidated Statements of Stockholders' (Deficit) Equity
(in millions of dollars, except per share data)
Showing the first 8K of 203K characters. Open the full section
Item 9. Changes in and Disagreements with Accountants on Accounting and Financial Disclosure.
None.
Item 9A. Controls and Procedures.
PMI carried out an evaluation, with the participation of PMI’s management, including PMI’s Chief Executive Officer and Chief Financial Officer, of the effectiveness of PMI’s disclosure controls and procedures (as defined in Rule 13a-15(e) under the Securities Exchange Act of 1934, as amended) as of the end of the period covered by this report. Based upon that evaluation, PMI’s Chief Executive Officer and Chief Financial Officer concluded that PMI’s disclosure controls and procedures are effective. There have been no changes in PMI’s internal control over financial reporting during the most recent fiscal quarter that have materially affected, or are reasonably likely to materially affect, PMI’s internal control over financial reporting.
The Report of Management on Internal Control over Financial Reporting and the Report of Independent Registered Public Accounting Firm are included in Item 8.
Item 9B. Other Information.
None.
PART III
Except for the information relating to the executive officers set forth in Item 10 and the information relating to equity compensation plans set forth in Item 12, the information called for by Items 10-14 is hereby incorporated by reference to PMI’s definitive proxy statement for use in connection with its annual meeting of stockholders to be held on May 9, 2018, that will be filed with the SEC on or about March 29, 2018 (the “proxy statement”), and, except as indicated therein, made a part hereof.
Item 10. Directors, Executive Officers and Corporate Governance.
Executive Officers as of February 9, 2018:
| Name | Office | Age | ||||
| André Calantzopoulos | Chief Executive Officer | 60 | ||||
| Massimo Andolina | Senior Vice President, Operations | 49 | ||||
| Drago Azinovic | President, Middle East & Africa Region and PMI Duty Free | 55 | ||||
| Werner Barth | Senior Vice President, Commercial | 53 | ||||
| Charles Bendotti | Senior Vice President, People and Culture | 45 | ||||
| Patrick Brunel | Chief Information Officer | 52 | ||||
| Frank de Rooij | Vice President, Treasury and Corporate Finance | 52 | ||||
| Frederic de Wilde | President, European Union Region | 50 | ||||
| Marc S. Firestone | President, External Affairs and General Counsel | 58 | ||||
| Paul Janelle | Vice President, Corporate Planning and Business Development | 52 | ||||
| Stacey Kennedy | President, South and Southeast Asia Region | 45 | ||||
| Martin G. King | Chief Financial Officer | 53 | ||||
| Andreas Kurali | Vice President and Controller | 52 | ||||
| Marco Mariotti | President, Eastern Europe Region | 53 | ||||
| Jacek Olczak | Chief Operating Officer | 53 | ||||
| Jeanne Pollès | President, Latin America & Canada Region | 52 | ||||
| Paul Riley | President, East Asia and Australia Region | 52 | ||||
| Jaime Suarez | Chief Digital Officer | 44 | ||||
| Jerry E. Whitson | Deputy General Counsel and Corporate Secretary | 62 | ||||
| Miroslaw Zielinski | President, Science and Innovation | 56 |
All of the above-mentioned officers have been employed by us in various capacities during the past five years.
Codes of Conduct and Corporate Governance
We have adopted the Philip Morris International Code of Conduct, which complies with requirements set forth in Item 406 of Regulation S-K. This Code of Conduct applies to all of our employees, including our principal executive officer, principal financial officer, principal accounting officer or controller, and persons performing similar functions. We have also adopted a code of business conduct and ethics that applies to the members of our Board of Directors. These documents are available free of charge on our website at www.pmi.com.
In addition, we have adopted corporate governance guidelines and charters for our Audit, Finance, Compensation and Leadership Development, Product Innovation and Regulatory Affairs and Nominating and Corporate Governance committees of the Board of Directors. All of these documents are available free of charge on our website at www.pmi.com. Any waiver granted by Philip Morris International Inc. to its principal executive officer, principal financial officer or controller or any person performing similar functions under the Code of Conduct, or certain amendments to the Code of Conduct, will be disclosed on our website at www.pmi.com.
The information on our website is not, and shall not be deemed to be, a part of this Report or incorporated into any other filings made with the SEC.
Also refer to Board Operations and Governance - Committees of the Board, Election of Directors - Process for Nominating Directors and Election of Directors - Director Nominees and Section 16(a) Beneficial Ownership Reporting Compliance sections of the proxy statement.
Item 11. Executive Compensation.
Refer to Compensation Discussion and Analysis and Compensation of Directors sections of the proxy statement.
Item 12. Security Ownership of Certain Beneficial Owners and Management and Related Stockholder Matters.
The number of shares to be issued upon exercise or vesting and the number of shares remaining available for future issuance under PMI’s equity compensation plans at December 31, 2017, were as follows:
| Number of Securities to be Issued upon Exercise of Outstanding Options and Vesting of RSUs and PSUs (a) | Weighted Average Exercise Price of Outstanding Options (b) | Number of Securities Remaining Available for Future Issuance Under Equity Compensation Plans (excluding Securities reflected in column (a)) (c) | |||||||
| Equity compensation plans approved by stockholders | 5,254,460(1) | $ | — | 25,991,850 |
(1) Represents 3,612,400 shares of common stock that may be issued upon vesting of the restricted share units and 1,642,060 shares that may be issued upon vesting of the performance share units if maximum performance targets are achieved for each performance cycle. PMI has not granted options since the spin-off from Altria on March 28, 2008.
Item 13. Certain Relationships and Related Transactions, and Director Independence.
Refer to Related Person Transactions and Code of Conduct and Election of Directors - Independence of Nominees sections of the proxy statement.
Item 14. Principal Accounting Fees and Services.
Refer to Audit Committee Matters section of the proxy statement.
PART IV
Item 15. Exhibits and Financial Statement Schedules.
(a) Index to Consolidated Financial Statements and Schedules
| Page | |
| Consolidated Balance Sheets at December 31, 2017 and 2016 | 69 - 70 |
| Consolidated Statements of Earnings for the years ended December 31, 2017, 2016 and 2015 | 71 |
| Consolidated Statements of Comprehensive Earnings for the years ended December 31, 2017, 2016 and 2015 | 72 |
| Consolidated Statements of Stockholders’ (Deficit) Equity for the years ended December 31, 2017, 2016 and 2015 | 73 |
| Consolidated Statements of Cash Flows for the years ended December 31, 2017, 2016 and 2015 | 74 - 75 |
| Notes to Consolidated Financial Statements | 76 - 118 |
| Report of Independent Registered Public Accounting Firm | 119 - 120 |
| Report of Management on Internal Control Over Financial Reporting | 121 |
Schedules have been omitted either because such schedules are not required or are not applicable.
(b) The following exhibits are filed as part of this Report:
| 101.CAL | — | XBRL Taxonomy Extension Calculation Linkbase. | ||
| 101.DEF | — | XBRL Taxonomy Extension Definition Linkbase. | ||
| 101.LAB | — | XBRL Taxonomy Extension Label Linkbase. | ||
| 101.PRE | — | XBRL Taxonomy Extension Presentation Linkbase. |
| * | Denotes management contract or compensatory plan or arrangement in which directors or executive officers are eligible to participate. |
SIGNATURES
Pursuant to the requirements of Section 13 or 15(d) of the Securities Exchange Act of 1934, the registrant has duly caused this report to be signed on its behalf by the undersigned, thereunto duly authorized.
| PHILIP MORRIS INTERNATIONAL INC. | |
| By: | /s/ ANDRÉ CALANTZOPOULOS |
| (André Calantzopoulos Chief Executive Officer) |
Date: February 13, 2018
Pursuant to the requirements of the Securities Exchange Act of 1934, this report has been signed below by the following persons on behalf of the registrant and in the capacities and on the date indicated:
| Signature | Title | Date |
| /s/ ANDRÉ CALANTZOPOULOS | Chief Executive Officer | February 13, 2018 |
| (André Calantzopoulos) | ||
| /s/ MARTIN G. KING | Chief Financial Officer | February 13, 2018 |
| (Martin G. King) | ||
| /s/ ANDREAS KURALI | Vice President and Controller | February 13, 2018 |
| (Andreas Kurali) | ||
| *HAROLD BROWN, LOUIS C. CAMILLERI, MASSIMO FERRAGAMO, WERNER GEISSLER, JENNIFER LI, JUN MAKIHARA, SERGIO MARCHIONNE, KALPANA MORPARIA, LUCIO A. NOTO, FREDERIK PAULSEN, ROBERT B. POLET, STEPHEN M. WOLF | Directors |
| *By: | /s/ ANDRÉ CALANTZOPOULOS | February 13, 2018 | |
| (André Calantzopoulos Attorney-in-fact) |