 filings.tools
Item 7. Management’s Discussion and Analysis of Financial Condition and Results of Operations
144K characters. Original on sec.gov · Markdown
Item 7. Management’s Discussion and Analysis of Financial Condition and Results of Operations
Forward-Looking Statements
Statements in this Annual Report about anticipated financial results and growth, as well as about the development of our products and markets, are forward-looking statements that are based on our current plans and assumptions. Important information about the bases for these plans and assumptions and factors that may cause our actual results to differ materially from these statements is contained below and in Item 1A. “Risk Factors” of this Annual Report.
Unless otherwise indicated, all references to a year reflect our fiscal year that ends on September 30.
Operating and Non-GAAP Financial Measures
Our discussion of results includes discussion of our operating measures (including “license and subscription bookings” and other subscription-related measures) and non-GAAP financial measures. Our operating measures and non-GAAP financial measures, including the reasons we use those measures, are described below in Results of Operations - Operating Measures and Results of Operations - Non-GAAP Financial Measures, respectively. You should read those sections to understand those operating and non-GAAP financial measures.
Revenue Sources and Recognition
We sell subscription and perpetual licenses to our software, support for perpetual licenses, cloud services and professional services.
Subscription revenue is comprised of time-based licenses whereby customers use our software and receive related support for a specified term, and for which through 2018 revenue is recognized ratably over the term of the contract. Perpetual licenses are a perpetual right to use the software, for which revenue is generally recognized up front upon shipment to the customer. Support revenue is comprised
of contracts to maintain new and/or previously purchased perpetual licenses, for which revenue is recognized ratably over the term of the contract. Our subscription revenue includes an immaterial amount of Software as a Service (SaaS) and cloud services for which revenue is generally recognized ratably over the term of the contract. Consulting and training professional services engagements typically result from sales of new licenses, and for which revenue is recognized over the term of the engagement. Our revenue recognition practices are described below in “Critical Accounting Policies and Estimates” and in Note B. Summary of Significant Accounting Policies in the Notes to Consolidated Financial Statements in this Annual Report.
Beginning with 2019, we will recognize revenue under the Accounting Standards Update No. 2014-09, Revenue from Contracts with Customers: Topic 606 (ASC 606) revenue recognition standard, which differs significantly from the previous accounting rules. Under ASC 606, all performance obligations under the product that can be separately identified are, and revenue is recognized for each performance obligation. Accordingly, our on-premise subscription contracts will be unbundled into multiple performance obligations (i.e., license, cloud and support). The license portion of such subscription contracts (approximately 50% to 55%) will be recognized upfront and the cloud and support portions (approximately 45% to 50%) of such subscription contracts will be recognized ratably over the term. The effects of our adoption of ASC 606, including expected adjustments to retained earnings related to billed and unbilled deferred revenue, are described below in “Recent Accounting Pronouncements” and in Note B. Summary of Significant Accounting Policies in the Notes to Consolidated Financial Statements in this Annual Report.
Executive Overview
Our revenue results for the year reflect the adoption of subscription licensing by our customers and the compounding effect of the subscription business model as subscription revenue recurs and new subscription revenue is added in the year. Subscription revenue, software revenue and total revenue were all up over fiscal 2017, despite an 800 basis point increase in subscription mix year over year. Recurring software revenue represented approximately 90% of our software revenue in 2018, up from 86% a year ago. Our revenue results also drove our operating margin improvements for the year. Despite increases in sales and marketing and research and development expenses, operating margins and EPS were up over the prior year.
Our CAD and PLM businesses performed well in the year, our IoT business continued to grow as we added new customers and existing customers expanded their implementations, and interest in our augmented reality solutions increased. We made important strides in extending our market reach and further differentiating our technology with strategic relationships we entered into in 2018, including those with Rockwell Automation, Microsoft and ANSYS.
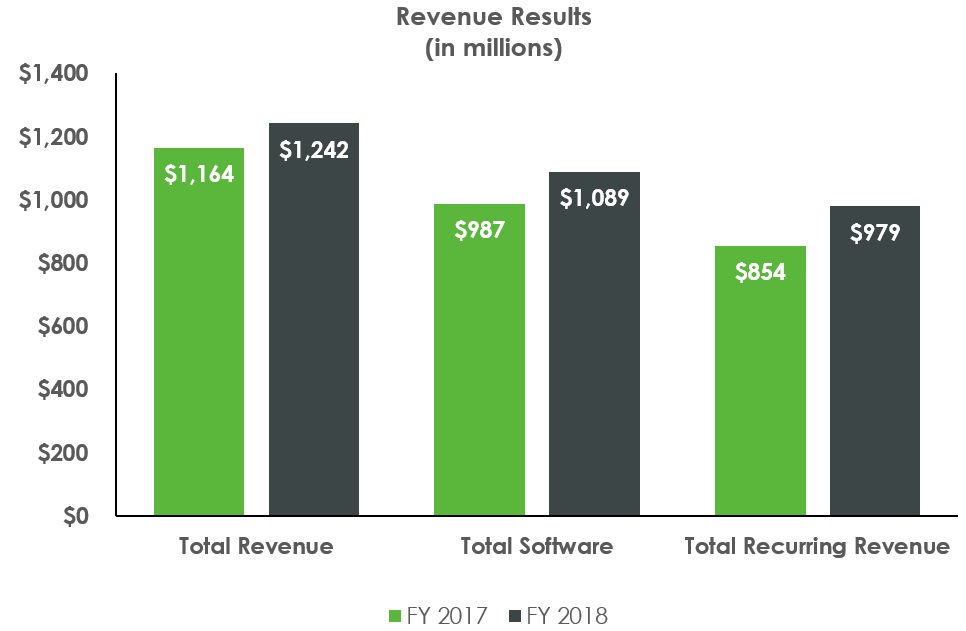
| Constant Currency Change | |||||||||||||||
| Year Ended September 30, | |||||||||||||||
| Revenue | 2018 | 2017 | Change | ||||||||||||
| (in millions) | |||||||||||||||
| Subscription | $ | 482.0 | $ | 279.2 | 73 | % | 69 | % | |||||||
| Support | 496.8 | 574.7 | (14 | )% | (16 | )% | |||||||||
| Total recurring revenue | 978.9 | 853.9 | 15 | % | 12 | % | |||||||||
| Perpetual license | 109.6 | 133.4 | (18 | )% | (20 | )% | |||||||||
| Total subscription, support and license revenue | 1,088.5 | 987.3 | 10 | % | 8 | % | |||||||||
| Professional services | 153.3 | 176.7 | (13 | )% | (16 | )% | |||||||||
| Total revenue | $ | 1,241.8 | $ | 1,164.0 | 7 | % | 4 | % |
The increase in total revenue, subscription revenue and EPS reflects our transformation into a subscription software company. As our mix of subscription sales relative to perpetual license sales has increased, perpetual license revenue and support revenue have declined.
Our 2018 revenue results include the impact of a settlement of a customer dispute concerning a professional services receivable. The settlement, reached in September 2018, included partial payment of the receivable and new software purchases. The net revenue write-down recorded in the fourth quarter of 2018 was $9.3 million, comprised of a $14.5 million services revenue write-down, partially offset by subscription revenue of $5.2 million. Additionally, professional services revenue has declined in accordance with our strategy to migrate more services engagements to our partners and to deliver products that require less consulting and training services.
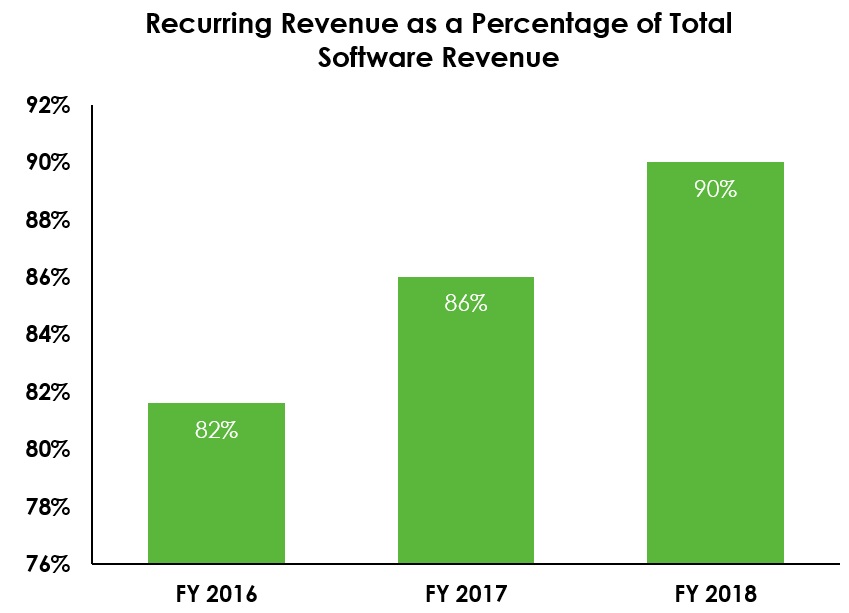
The increase in subscription revenue relative to perpetual license revenue has resulted in an increase in our recurring software revenue, with approximately 90% of our software revenue and 79% of our total revenue in 2018 from recurring software revenue streams, compared to 86% and 73% in 2017 and 82% and 68% in 2016.
| Year Ended September 30, | ||||||||||||
| Earnings Measures | 2018 | 2017 | Change | |||||||||
| Operating Margin | 5.9 | % | 3.5 | % | 68 | % | ||||||
| Earnings Per Share | $ | 0.44 | $ | 0.05 | 780 | % | ||||||
| Non-GAAP Operating Margin(1) | 18.4 | % | 16.1 | % | 14 | % | ||||||
| Non-GAAP EPS(1) | $ | 1.45 | $ | 1.17 | 24 | % | ||||||
| (1) Non-GAAP measures are reconciled to GAAP results under Results of Operations - Non-GAAP Measures below. |
GAAP and non-GAAP operating income in 2018 reflect maturity of our subscription program. An increase in gross margin is associated with higher subscription revenue and a lower mix of professional services revenue, which has lower margins than our software revenue. The increase in gross margins was partially offset by higher sales and marketing and research and development costs.
Our GAAP and non-GAAP earnings reflect a combination of revenue growth due to the strength of our subscription model and strong new bookings, as well as continued cost and expense discipline.
We ended 2018 with cash, cash equivalents and marketable securities of $316 million, down from $330 million at the end of 2017. We generated $248 million of cash from operations in 2018 compared to $135 million in 2017. In the fourth quarter of 2018, Rockwell Automation made a $1 billion equity investment in PTC as part of a strategic partnership. Using the cash proceeds from this investment, PTC entered into a $1,000 million accelerated share repurchase. We also used cash from operations to repurchase another $100 million of common stock and to repay a net $70 million of borrowings under our credit facility in 2018. At September 30, 2018, the balance outstanding under our credit facility was $148 million and total debt outstanding was $648 million.
Operating Measures
We provide these measures to help investors understand the progress of our subscription transition. These measures are not necessarily indicative of revenue for the period or any future period.
License and Subscription Bookings
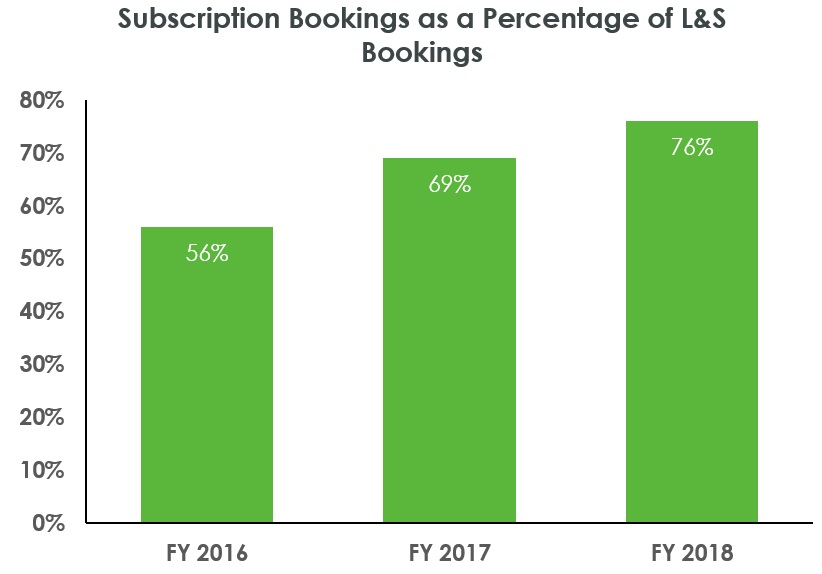
License and subscription bookings for 2018 were $466 million, up 11% over 2017 (up 9% on a constant currency basis) and up 16% over 2016. Over the past two years, CAD, core PLM and IoT have delivered bookings CAGRs at the high end of market growth rates, as CAD and PLM customers have converted existing license contracts to subscriptions and customers have adopted and expanded IoT implementations.
Subscription ACV
Subscription ACV increased 24% over 2017 to $177 million due to continued adoption of our subscription offerings around the globe.
Annualized Recurring Revenue (ARR)
ARR was approximately $1,012 million as of the fourth quarter of 2018, an increase of 12% compared to the fourth quarter of 2017 and the seventh consecutive quarter of double-digit year-over-year growth.
Deferred Revenue and Backlog (Unbilled Deferred Revenue)
Deferred revenue primarily relates to software agreements invoiced to customers for which the revenue has not yet been recognized. Unbilled deferred revenue (backlog) is the aggregate of booked orders for license, support and subscription (including multi-year subscription contracts with start dates after October 1, 2018 that are subject to a limited annual cancellation right, of which approximately $50 million was cancellable at September 30, 2018) for which the associated revenue has not been recognized and the customer has not yet been invoiced. We do not record unbilled deferred revenue on our Consolidated Balance Sheets; such amounts are recorded as Deferred Revenue when we invoice the customer. We provide this view of Deferred Revenue and Backlog to enable investors to understand the significant contractual commitments we have to customers, and to provide a view of future revenue that we expect will be recognized, even if those commitments are not reflected on our balance sheet.
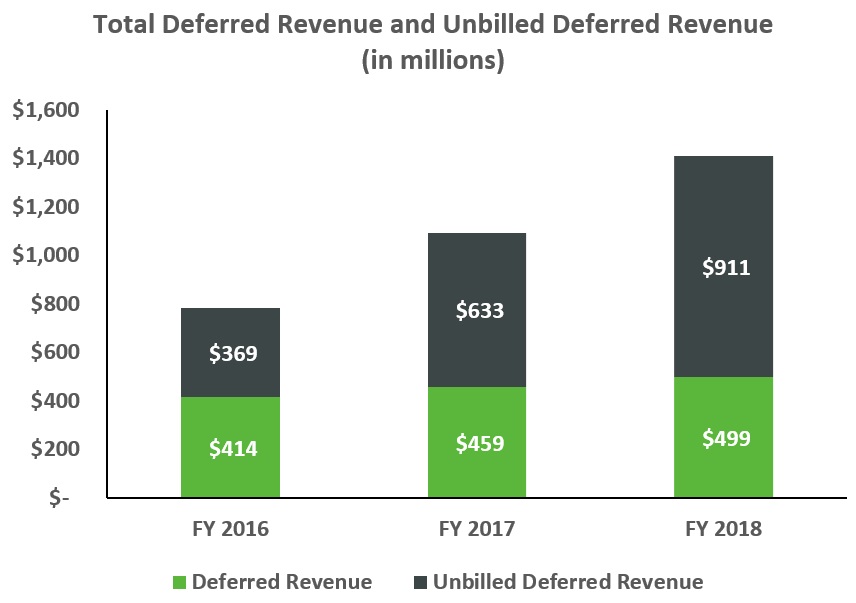
| September 30, | |||||||||||
| 2018 | 2017 | 2016 | |||||||||
| (Dollar amounts in millions) | |||||||||||
| Deferred revenue | $ | 499 | $ | 459 | $ | 414 | |||||
| Unbilled deferred revenue | 911 | 633 | 369 | ||||||||
| Total | $ | 1,410 | $ | 1,092 | $ | 783 |
Of the unbilled deferred revenue balance at September 30, 2018, we expect to invoice customers approximately $560 million within the next twelve months. Unbilled deferred revenue grew 44% year over year due to the high volume of new subscription bookings. Many of our subscription bookings are for multiple years and are typically billed annually at the start of each annual subscription period. The average contract duration was approximately 2 years for new subscription contracts in 2018 and 2017.
We expect that the amount of deferred revenue and unbilled deferred revenue will fluctuate from quarter to quarter due to the specific timing, duration and size of customer subscription and support agreements, varying billing cycles of such agreements, the specific timing of customer renewals, foreign currency fluctuations, the timing of when deferred revenue is recognized as revenue and the timing of our fiscal quarter ends.
The effects of our adoption of ASC 606, including expected adjustments to retained earnings related to billed and unbilled deferred revenue, are described below in “Recent Accounting Pronouncements” and in Note B. Summary of Significant Accounting Policies in the Notes to Consolidated Financial Statements.
Future Expectations, Strategies and Risks
Our transition to a subscription model has been a headwind for revenue and earnings in 2018 with an increase in our subscription mix of 800 basis points as compared to fiscal 2017. We expect a further increase in our subscription mix of 1100 to 1300 basis points, which will result in a further headwind for revenue and earnings in fiscal 2019. We expect the effect of the transition to moderate in fiscal 2020. A higher mix of subscription bookings is expected to benefit us over the long term, but results in lower revenue and lower earnings in the near term. We expect that IoT and AR adoption rates will continue to expand and will be the most significant driver to growth.
With the growth opportunity in Industrial Internet of Things and Augmented Reality, and other strategic initiatives we’ve undertaken, as well as our continued commitment to operating margin improvement, we are realigning our workforce in the beginning of 2019 to shift investment to support these strategic, high growth opportunities. This realignment will result in a restructuring charge of approximately $18 million in 2019, which consists principally of termination benefits, substantially all of which we expect will be paid in 2019. As this is a realignment of resources rather than a cost-savings initiative, we don’t expect this realignment will result in significant cost savings, and the effect of the realignment is reflected in our 2019 guidance.
In 2019, we will be moving into a new worldwide headquarters in the Boston Seaport District and we will be vacating our current headquarters space. Because our current headquarters lease will not expire until November 2022, we are seeking to sublease that space, but have not yet done so. If we are unable to sublease our current headquarters space for an amount at least equal to our rent obligations under the current headquarters lease, we will bear overlapping rent obligations for those premises and will be required to record a charge related to such rent shortfall. We currently pay approximately $12 million in annual base rent and operating expenses for our current headquarters. We expect to record a charge for any such shortfall in the earlier of the period that we cease using the space (which will likely occur in the second quarter of our fiscal 2019) or the period we sign sublease contracts. Additionally, we will incur other costs associated with the move which will be recorded as incurred.
We are adopting the new revenue recognition standard, ASC 606, effective October 1, 2018. ASC 606 will, among other things, materially impact the timing of our revenue recognition. Refer to Note B. Summary of Significant Accounting Policies in the Notes to Consolidated Financial Statements in this Form 10-K for additional information about the impact of adopting this guidance.
Our results have been impacted, and we expect will continue to be impacted, by our ability to close large transactions. The amount of bookings and revenue, particularly license and subscriptions, attributable to large transactions, and the number of such transactions, may vary significantly from quarter to quarter based on customer purchasing decisions and macroeconomic conditions. Such transactions may have long lead times as they often follow a lengthy product selection and evaluation process and, for existing customers, are influenced by contract expiration cycles. This may cause volatility in our results.
As we move into 2019, our three overriding goals continue to be:
 | Sustainable Growth | Our goals are predicated on continuing to drive bookings growth both in the high-growth IoT market and in our core CAD and PLM markets. |
 | Expand Subscription Licensing | Our goal is to increase the percentage of licenses sold as subscriptions to increase our recurring revenue. Effective January 1, 2018, new software licenses for our core solutions and ThingWorx solutions were available only by subscription in the Americas and Western Europe, and, effective January 1, 2019, new software licenses for those solutions will be available only by subscription worldwide. Kepware will continue to be available under perpetual licensing. |
 | Cost Controls and Margin Expansion | Our goal is to drive continued margin expansion over the long term. We continue to proactively manage our cost structure and invest in what we believe are high return opportunities in our business. We expect to deliver continued operating margin expansion in 2019 and beyond, as we realize the compounding benefit of our maturing subscription business. |
Results of Operations
The following table shows the financial measures that we consider the most significant indicators of the performance of our business. In addition to providing operating income, operating margin, and diluted earnings per share as calculated under generally accepted accounting principles (“GAAP”), it shows non-GAAP operating income, non-GAAP operating margin, and non-GAAP diluted earnings per share for the reported periods. These non-GAAP financial measures exclude the effect of a professional services revenue write-down and subscription revenue associated with the settlement of a previously disclosed disputed customer receivable, fair value adjustments related to acquired deferred revenue, acquired deferred costs, stock-based compensation expense, amortization of acquired intangible assets expense, acquisition-related and pension plan termination costs, restructuring charges, certain identified gains or charges included in non-operating other income (expense) and the related tax effects of the preceding items, as well as the tax items identified. These non-GAAP financial measures provide investors another view of our operating results that is aligned with management budgets and with performance criteria in our incentive compensation plans. Management uses, and investors should use, non-GAAP financial measures only in conjunction with our GAAP results.
| Year ended September 30, | |||||||||||||||||||||||
| 2018 | 2017 | Percent change 2017 to 2018 | 2016 | Percent change 2016 to 2017 | |||||||||||||||||||
| Actual | Constant Currency | Actual | Constant Currency | ||||||||||||||||||||
| (Dollar amounts in millions, except per share data) | |||||||||||||||||||||||
| Subscription | $ | 482.0 | $ | 279.2 | 73 | % | 69 | % | $ | 118.3 | 136 | % | 135 | % | |||||||||
| Support | 496.8 | 574.7 | (14 | )% | (16 | )% | 651.8 | (12 | )% | (12 | )% | ||||||||||||
| Total recurring revenue | 978.9 | 853.9 | 15 | % | 12 | % | 770.1 | 11 | % | 11 | % | ||||||||||||
| Perpetual license | 109.6 | 133.4 | (18 | )% | (20 | )% | 173.5 | (23 | )% | (23 | )% | ||||||||||||
| Total subscription, support and license revenue | 1,088.5 | 987.3 | 10 | % | 8 | % | 943.6 | 5 | % | 5 | % | ||||||||||||
| Professional services | 153.3 | 176.7 | (13 | )% | (16 | )% | 196.9 | (10 | )% | (11 | )% | ||||||||||||
| Total revenue | 1,241.8 | 1,164.0 | 7 | % | 4 | % | 1,140.5 | 2 | % | 2 | % | ||||||||||||
| Total cost of revenue | 326.2 | 329.0 | (1 | )% | 325.7 | 1 | % | ||||||||||||||||
| Gross margin | 915.6 | 835.0 | 10 | % | 814.9 | 2 | % | ||||||||||||||||
| Operating expenses | 842.4 | 794.1 | 6 | % | 851.9 | (7 | )% | ||||||||||||||||
| Total costs and expenses | 1,168.6 | 1,123.1 | 4 | % | 2 | % | 1,177.5 | (5 | )% | (4 | )% | ||||||||||||
| Operating income (loss) | $ | 73.2 | $ | 40.9 | 79 | % | 57 | % | $ | (37.0 | ) | 211 | % | 214 | % | ||||||||
| Non-GAAP operating income (1) | $ | 230.0 | $ | 188.4 | 22 | % | 16 | % | $ | 172.7 | 9 | % | 7 | % | |||||||||
| Operating margin | 5.9 | % | 3.5 | % | (3.2 | )% | |||||||||||||||||
| Non-GAAP operating margin (1) | 18.4 | % | 16.1 | % | 15.1 | % | |||||||||||||||||
| Diluted earnings (loss) per share (2) | $ | 0.44 | $ | 0.05 | $ | (0.48 | ) | ||||||||||||||||
| Non-GAAP diluted earnings per share (2) | $ | 1.45 | $ | 1.17 | $ | 1.19 | |||||||||||||||||
| Cash flow from operations (3) | $ | 247.8 | $ | 135.2 | $ | 183.3 |
| (1) | See Non-GAAP Financial Measures below for a reconciliation of our GAAP results to our non-GAAP measures. |
| (2) | We have a full valuation allowance against our U.S. net deferred tax assets and a valuation allowance against net deferred tax assets in certain foreign jurisdictions. As we are profitable on a non-GAAP basis, the 2018 and 2017 non-GAAP tax provisions are calculated assuming there is no valuation allowance. Income tax adjustments reflect the tax effects of non-GAAP adjustments which are calculated by applying the applicable tax rate by jurisdiction to the non-GAAP adjustments listed above. We recorded the impact of the Tax Cuts and Jobs Act in our 2018 GAAP earnings, resulting in a non-cash benefit of approximately $12 million. We have excluded this benefit from our non-GAAP results. |
| (3) | Cash flow from operations for 2018 includes $3 million of restructuring payments. Cash flow from operations for 2017 includes $37 million of restructuring payments, a $12 million payment related to a Korea tax audit and $3 million of legal settlement payments. Cash flow from operations for 2016 includes $55 million of restructuring payments and a $28 million payment of a legal accrual recorded in 2015 related to the settlement of an investigation in China. |
Impact of Foreign Currency Exchange on Results of Operations
Approximately two thirds of our revenue and half of our expenses are transacted in currencies other than the U.S. dollar. Currency translation affects our reported results, which are in U.S. Dollars. If actual reported results were converted into U.S. dollars based on the corresponding prior year’s foreign currency exchange rates, 2018 and 2017 revenue would have been lower by $32 million and higher by $1 million, respectively, and expenses would have been lower by $20 million and higher by $3 million, respectively. The net impact on year-over-year results would have been a decrease in operating income of $12 million in 2018 and a decrease in operating income of $2 million in 2017. The results of operations, revenue by line of business and revenue by geographic region in the tables that follow present both actual percentage changes year over year and percentage changes on a constant currency basis.
Revenue
Revenue is reported below by line of business (subscription, support, perpetual license and professional services), by product area (Solutions and IoT) and by geographic region (Americas, Europe, Asia Pacific). Results include combined revenue from direct sales and our channel.
Revenue by Line of Business
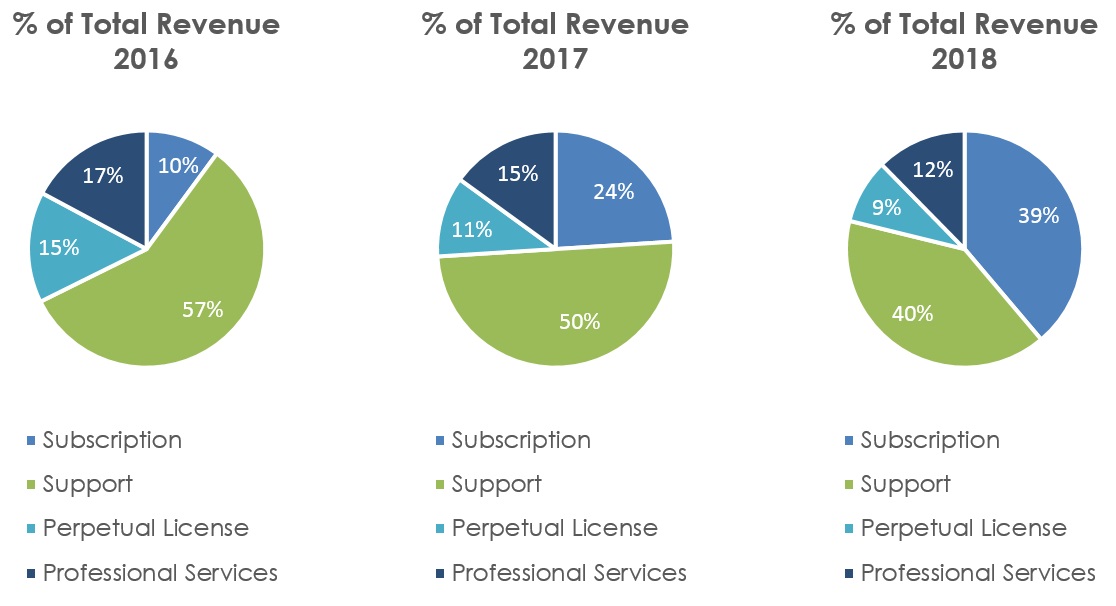
Software
As our mix of subscription sales relative to perpetual license sales has increased, perpetual license revenue and support revenue have declined and are expected to continue to decline as customers purchase our solutions as subscriptions and convert existing perpetual licenses with support contracts to subscriptions. As our subscription business matures, recurring software revenue growth is expected to continue due to the compounding benefit of a subscription business model.
Professional Services
Professional services revenue was down 13% (16% constant currency) in 2018 compared to 2017. Professional services revenue in 2018 reflects a $14.5 million write-down related to a settlement of a customer dispute concerning a receivable. These results are in line with our expectation that professional services revenue will trend flat-to-down over time due to our strategy to expand margins by migrating
more services engagements to our partners and delivering products that require less consulting and training services.
Revenue by Product
| Year ended September 30, | |||||||||||||||||||||||
| Percent Change | Percent Change | ||||||||||||||||||||||
| 2018 | Actual | Constant Currency | 2017 | Actual | Constant Currency | 2016 | |||||||||||||||||
| (Dollar amounts in millions) | |||||||||||||||||||||||
| Solutions Products | |||||||||||||||||||||||
| Software revenue | $ | 964.6 | 8 | % | 5 | % | $ | 893.7 | 3 | % | 3 | % | $ | 871.2 | |||||||||
| Professional services | 137.9 | (17 | )% | (20 | )% | 167.1 | (12 | )% | (12 | )% | 189.0 | ||||||||||||
| Total revenue | $ | 1,102.5 | 4 | % | 1 | % | $ | 1,060.7 | — | % | — | % | $ | 1,060.2 | |||||||||
| IoT Products | |||||||||||||||||||||||
| Software revenue | $ | 123.9 | 32 | % | 31 | % | $ | 93.7 | 29 | % | 29 | % | $ | 72.4 | |||||||||
| Professional services | 15.4 | 60 | % | 57 | % | 9.6 | 22 | % | 21 | % | 7.9 | ||||||||||||
| Total revenue | $ | 139.3 | 35 | % | 33 | % | $ | 103.3 | 28 | % | 28 | % | $ | 80.3 |
Solutions
Software revenue grew 8% in 2018 compared to 2017 as a result of strong CAD, PLM and global channel license and subscription bookings over the past several years, offset by a significant increase in the subscription mix in the current period. Subscription sales have increased in part due to our support conversion programs that we have been offering over the past few years whereby customers may convert existing perpetual licenses and support to a new subscription. Recurring software revenue grew 12% in 2018 over 2017, and has grown double-digits for seven consecutive quarters. As our transition matures, recurring software revenue growth is expected to continue due to the compounding benefit of a subscription business model.
Professional services revenue in 2018 includes a $14.5 million write-down related to a settlement of a previously disclosed customer dispute concerning a receivable. In addition, professional services revenue in 2018 declined compared to 2017 due to our strategy to limit the amount of professional services we provide.
IoT
Software revenue in 2018 increased by 32% compared to 2017 due to increases in license and subscription bookings over the past several years, offset by an 800 basis points increase in the subscription mix. Recurring software revenue grew 42% in 2018 over 2017 due to strong IoT bookings growth over the past several years. Software revenue includes $5.2 million of new subscription revenue related to the settlement of a customer dispute concerning a professional services receivable, which settlement included new subscription purchases.
Professional services revenue increased in 2018 compared to 2017 in part due to implementation and adoption services we provide to our IoT customers as part of our efforts to help their IoT initiatives be successful.
Revenue by Geographic Region
Total revenue grew in all regions for 2018 compared to 2017.
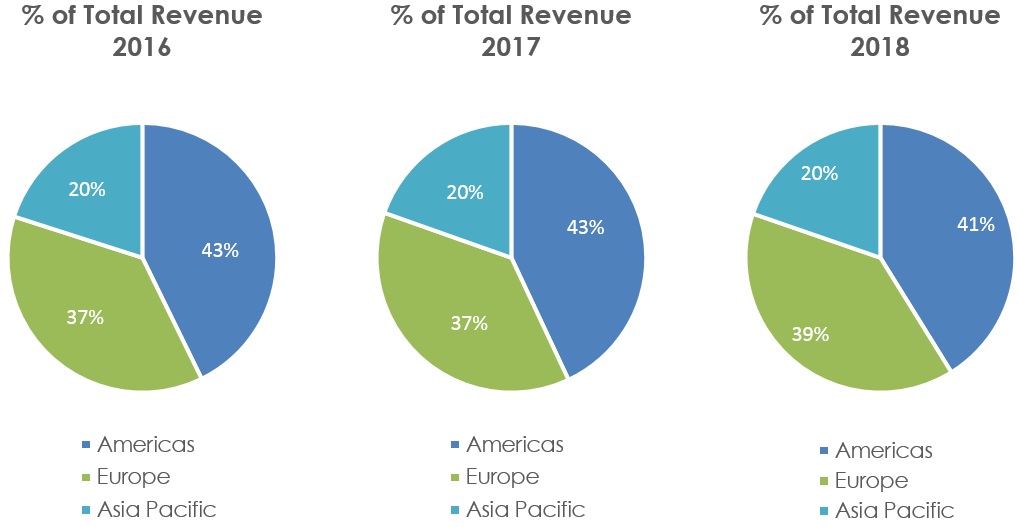
| Year ended September 30, | |||||||||||||||||||||||
| 2018 | Percent Change | 2017 | Percent Change | 2016 | |||||||||||||||||||
| Actual | Constant Currency | Actual | Constant Currency | ||||||||||||||||||||
| (Dollar amounts in millions) | |||||||||||||||||||||||
| Americas | |||||||||||||||||||||||
| Software revenue | $ | 468.3 | 8 | % | 8 | % | $ | 433.7 | 5 | % | 4 | % | $ | 414.7 | |||||||||
| Professional services revenue | 42.9 | (36 | )% | (36 | )% | 67.2 | (8 | )% | (9 | )% | 72.9 | ||||||||||||
| Total Revenue | $ | 511.2 | 2 | % | 2 | % | $ | 500.9 | 3 | % | 2 | % | $ | 487.6 | |||||||||
| Europe | |||||||||||||||||||||||
| Software revenue | $ | 402.9 | 13 | % | 7 | % | $ | 356.5 | 6 | % | 7 | % | $ | 335.6 | |||||||||
| Professional services revenue | 83.0 | 5 | % | (1 | )% | 78.7 | (11 | )% | (11 | )% | 88.7 | ||||||||||||
| Total Revenue | $ | 485.9 | 12 | % | 5 | % | $ | 435.2 | 3 | % | 4 | % | $ | 424.3 | |||||||||
| Asia Pacific | |||||||||||||||||||||||
| Software revenue | $ | 217.3 | 10 | % | 8 | % | $ | 197.1 | 2 | % | — | % | $ | 193.3 | |||||||||
| Professional services revenue | 27.4 | (11 | )% | (13 | )% | 30.9 | (13 | )% | (13 | )% | 35.4 | ||||||||||||
| Total Revenue | $ | 244.7 | 7 | % | 5 | % | $ | 228.0 | — | % | (2 | )% | $ | 228.7 |
Americas
Americas software revenue has benefited from strong license and subscription bookings growth over the past two years (10% CAGR). New license and subscriptions bookings were up 20% in 2018 compared to 2017, despite an 800 basis point increase in the subscription mix.
Europe
Europe constant currency year-over-year revenue growth reflects solid bookings growth over the past two years (8% CAGR). The increase in revenue in Europe in 2018 compared to 2017 was due to the strong bookings in 2017, when this region delivered 28% constant currency growth in bookings. Bookings in Europe declined 10% in 2018 compared to 2017 and were adversely affected in 2018 due to a $7 million deal which closed early in the fourth quarter of 2017 instead of the first quarter of 2018.
Year-over-year changes in foreign currency exchange rates, particularly the Euro, impacted European revenue favorably in 2018 by $28.2 million and unfavorably by $3.9 million in 2017.
Asia Pacific
Asia Pacific software revenue growth in the mid-teens reflects solid bookings performance in the broader region over the past two years (5% CAGR), despite the headwinds experienced in Japan in 2017.
Year-over-year changes in foreign currency exchange rates favorably impacted revenue by $4.2 million and $1.6 million in 2018 and 2017, respectively.
Gross Margin
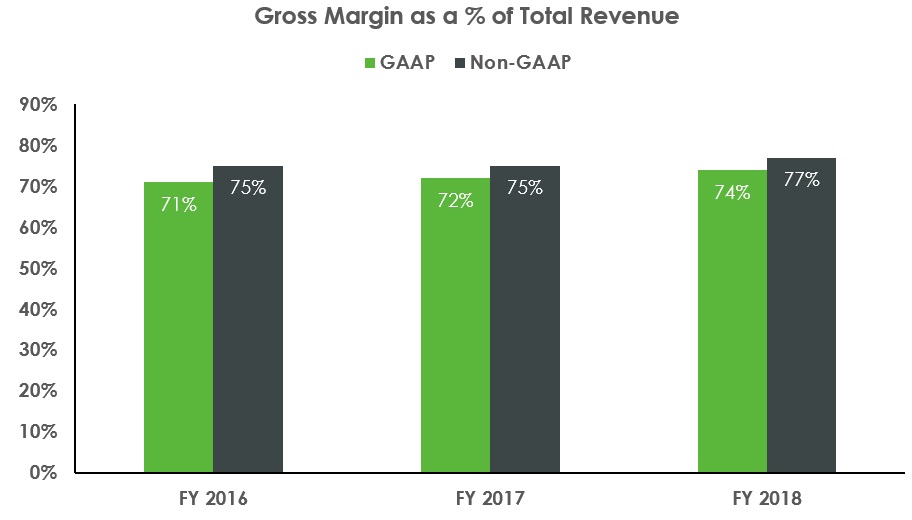
| Year ended September 30, | |||||||||||||||||
| 2018 | Percent Change | 2017 | Percent Change | 2016 | |||||||||||||
| (Dollar amounts in millions) | |||||||||||||||||
| Gross margin | $ | 915.6 | 10 | % | $ | 835.0 | 2 | % | $ | 814.9 | |||||||
| Non-GAAP gross margin | 964.0 | 10 | % | 876.5 | 3 | % | 853.2 | ||||||||||
| Gross margin as a % of revenue: | |||||||||||||||||
| License and subscription gross margin | 84 | % | 79 | % | 76 | % | |||||||||||
| Support gross margin | 82 | % | 84 | % | 87 | % | |||||||||||
| Professional Services | 6 | % | 15 | % | 14 | % | |||||||||||
| Gross margin as a % of total revenue | 74 | % | 72 | % | 71 | % | |||||||||||
| Non-GAAP gross margin as a % of total non-GAAP revenue | 77 | % | 75 | % | 75 | % |
The increase in total gross margin in 2018 compared to 2017 is due to total revenue growth and lower costs of professional services. Total revenue in 2018 grew 7% over 2017. Margins for license and subscription are beginning to expand as the subscription model matures and revenue that has been deferred begins to contribute to current periods. Support gross margins are down for 2018 compared to 2017 primarily due to the 14% decrease in support revenue associated with an increase in our subscription mix and the conversion of existing customers from support contracts to subscription. Support revenue comprised 40% of our total revenue in 2018 compared to 50% in 2017 and 57% in 2016. Professional services gross margin is down due to the $14.5 million revenue write-down related to a settlement of a customer dispute concerning a receivable. Without this revenue write-down, professional services gross margin would have been 15%.
Costs and Expenses
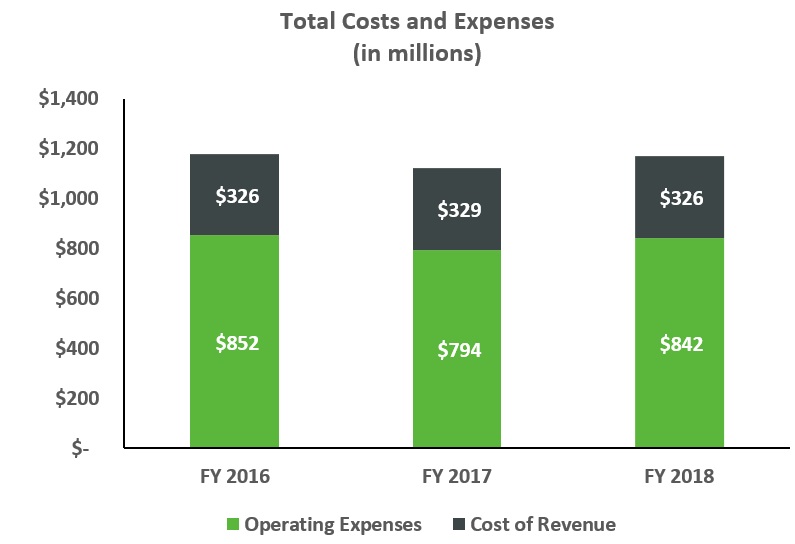
| Year ended September 30, | |||||||||||||||||
| 2018 | Percent Change | 2017 | Percent Change | 2016 | |||||||||||||
| Cost of license and subscription revenue | $ | 94.1 | 9 | % | $ | 86.0 | 23 | % | $ | 69.7 | |||||||
| Cost of support revenue | 88.6 | (4 | )% | 92.2 | 8 | % | 85.7 | ||||||||||
| Cost of professional services revenue | 143.5 | (5 | )% | 150.8 | (11 | )% | 170.2 | ||||||||||
| Sales and marketing | 414.5 | 11 | % | 372.9 | 1 | % | 367.5 | ||||||||||
| Research and development | 249.8 | 6 | % | 236.1 | 3 | % | 229.3 | ||||||||||
| General and administrative | 143.0 | (1 | )% | 145.1 | — | % | 145.6 | ||||||||||
| Amortization of acquired intangible assets | 31.4 | (2 | )% | 32.1 | (3 | )% | 33.2 | ||||||||||
| Restructuring charges | 3.8 | (53 | )% | 7.9 | (90 | )% | 76.3 | ||||||||||
| Total costs and expenses | $ | 1,168.6 | 4 | % | (1) | $ | 1,123.1 | (5 | )% | (1) | $ | 1,177.5 | |||||
| Total headcount at end of period | 6,110 | 1 | % | 6,041 | 4 | % | 5,800 |
| (1) | On a constant currency basis from the prior period, total costs and expenses increased 2% from 2017 to 2018 and decreased 4% from 2016 to 2017. |
2018 compared to 2017
Costs and expenses in 2018 compared to 2017 increased primarily as a result of the following:
| • | an increase of approximately $45 million in compensation and related costs primarily due to annual salary merit and headcount increases, an increase in commissions expense and an increase in stock-based compensation expense due to over-achievement of certain operating performance targets; and |
| • | an increase of $8.6 million in cloud services hosting costs; of which $3.7 million is included in cost of license and subscription revenue. |
The increases above were partially offset by:
| • | a decrease of $8.9 million in restructuring charges. |
2017 compared to 2016
Costs and expenses in 2017 compared to 2016 decreased primarily as a result of the following:
| • | substantial completion of restructuring activities in 2016, for which restructuring charges totaled $76.3 million in 2016 compared to $7.9 million in 2017; and |
| • | a decrease in professional services costs primarily due to a decrease in headcount as we migrated more service engagements to our partners and we delivered products that required less consulting and training services. |
The decreases above were partially offset by increases due to:
| • | an increase of $18.1 million in total cost of license, subscription and support compensation costs primarily driven by increased headcount; |
| • | an increase of $8.7 million in cloud services hosting costs due to an increase in SaaS revenue and related expenses and an increase in applications hosted in the cloud that support our IT infrastructure. |
| • | an increase of $5.0 million in total research and development compensation costs primarily driven by increased headcount; and |
| • | annual merit salary increases. |
Cost of License and Subscription Revenue
| Year ended September 30, | |||||||||||||||||
| 2018 | Percent Change | 2017 | Percent Change | 2016 | |||||||||||||
| (Dollar amounts in millions) | |||||||||||||||||
| Cost of license and subscription revenue | $ | 94.1 | 9 | % | $ | 86.0 | 23 | % | $ | 69.7 | |||||||
| % of total revenue | 8 | % | 7 | % | 6 | % | |||||||||||
| % of total license and subscription revenue | 16 | % | 21 | % | 24 | % |
Our cost of license and subscription includes cost of license, which consists of fixed and variable costs associated with reproducing and distributing software and documentation, as well as royalties paid to third parties for technology embedded in or licensed with our software products, and amortization of intangible assets associated with acquired products, and cost of subscription, which includes our cost of cloud services and software as a service revenue, including hosting fees. Costs associated with providing post-contract support such as providing software updates and technical support for both our subscription offerings and our perpetual licenses are included in cost of support revenue. Cost of license and subscription revenue as a percent of license and subscription revenue can vary depending on the subscription mix percentage, the product mix sold, the effect of fixed and variable royalties, headcount and the level of amortization of acquired software intangible assets.
Costs in 2018 compared to 2017 increased primarily as a result of a $3.7 million increase in cloud services hosting costs and a $2.5 million increase in total compensation, benefit and travel expense due to increases in salaries.
Costs in 2017 compared to 2016 increased primarily as a result of a $15.0 million increase in total compensation, benefit and travel expense due to increased headcount, primarily associated with supporting our Cloud products, and a $3.4 million increase in cloud services hosting costs.
Cost of Support Revenue
| Year ended September 30, | |||||||||||||||||
| 2018 | Percent Change | 2017 | Percent Change | 2016 | |||||||||||||
| (Dollar amounts in millions) | |||||||||||||||||
| Cost of support | $ | 88.6 | (4 | )% | $ | 92.2 | 8 | % | $ | 85.7 | |||||||
| % of total revenue | 7 | % | 8 | % | 8 | % | |||||||||||
| % of total support revenue | 18 | % | 16 | % | 13 | % |
Cost of support revenue consists of costs such as salaries, benefits, and computer equipment and facilities associated with customer support and the release of support updates (including related royalty costs) associated with providing support for both our perpetual licenses and subscription licenses.
Costs and expense in 2018 compared to 2017 decreased primarily due to a decrease in headcount resulting in 3% ($1.9 million) lower total compensation, benefit and travel costs.
Costs and expense in 2017 compared to 2016 increased primarily due to a 5% ($3.1 million) increase in total compensation, benefit and travel costs.
Cost of Professional Services Revenue
| Year ended September 30, | |||||||||||||||||
| 2018 | Percent Change | 2017 | Percent Change | 2016 | |||||||||||||
| (Dollar amounts in millions) | |||||||||||||||||
| Cost of professional services revenue | $ | 143.5 | (5 | )% | $ | 150.8 | (11 | )% | $ | 170.2 | |||||||
| % of total revenue | 12 | % | 13 | % | 15 | % | |||||||||||
| % of total professional services revenue | 94 | % | 85 | % | 86 | % |
Our cost of professional services revenue includes costs such as salaries, benefits, information technology costs and facilities expenses for our training and consulting personnel, and third-party subcontractor fees.
In 2018 compared to 2017, total compensation, benefit and travel expenses were decreased by $6.8 million primarily due to an 8% decrease in headcount.
In 2017 compared to 2016, total compensation, benefit costs and travel expenses decreased by $18.8 million. The cost of third-party consulting services was $4.7 million lower in 2017 compared to 2016.
As a result of decreases in professional services revenue in 2018, 2017 and 2016, we have reduced headcount, resulting in lower compensation-related costs. This is in line with our strategy to have our strategic services partners perform services for customers directly, which has decreased revenue and costs and improved services margins.
Sales and Marketing
| Year ended September 30, | |||||||||||||||||
| 2018 | Percent Change | 2017 | Percent Change | 2016 | |||||||||||||
| (Dollar amounts in millions) | |||||||||||||||||
| Sales and marketing expenses | $ | 414.5 | 11 | % | $ | 372.9 | 1 | % | $ | 367.5 | |||||||
| % of total revenue | 33 | % | 32 | % | 32 | % |
Our sales and marketing expenses primarily include salaries and benefits, sales commissions, advertising and marketing programs, travel, information technology costs and facility expenses.
Costs and expense in 2018 compared to 2017 increased primarily due to a $38.6 million increase in total compensation, benefit costs and travel expenses as a result of increases in headcount, salary increases, higher commissions costs and higher stock-based compensation.
In 2017 compared to 2016, event costs increased $3.1 million due to our LiveWorx event held in May 2017. Our compensation, benefits and travel costs were $3.5 million lower in 2017 compared to 2016 primarily due to lower commissions, which were higher in 2016 as a result of significantly higher than planned subscription bookings.
Research and Development
| Year ended September 30, | |||||||||||||||||
| 2018 | Percent Change | 2017 | Percent Change | 2016 | |||||||||||||
| (Dollar amounts in millions) | |||||||||||||||||
| Research and development expenses | $ | 249.8 | 6 | % | $ | 236.1 | 3 | % | $ | 229.3 | |||||||
| % of total revenue | 20 | % | 20 | % | 20 | % |
Our research and development expenses consist principally of salaries and benefits, information technology costs and facility expenses. Major research and development activities include developing new releases and updates of our software that enhance functionality and add features.
In 2018 compared to 2017, total compensation, benefit and travel expenses were higher by 6% ($12.0 million) due to an increase in headcount and salary increases.
In 2017 compared to 2016, total compensation, benefit and travel expenses were higher by 3% ($5.0 million) due to an increase in headcount and a $1.6 million increase in cloud services hosting costs as some product testing has moved to a cloud environment.
General and Administrative (G&A)
| Year ended September 30, | |||||||||||||||||
| 2018 | Percent Change | 2017 | Percent Change | 2016 | |||||||||||||
| (Dollar amounts in millions) | |||||||||||||||||
| General and administrative | $ | 143.0 | (1 | )% | $ | 145.1 | — | % | $ | 145.6 | |||||||
| % of total revenue | 12 | % | 12 | % | 13 | % |
Our G&A expenses include the costs of our corporate, finance, information technology, human resources, legal and administrative functions, as well as acquisition-related and other transactional charges, bad debt expense and outside professional services, including accounting and legal fees. Acquisition-related costs include direct costs of acquisitions and expenses related to acquisition integration activities, including transaction fees, due diligence costs, retention bonuses and severance, and professional fees, including legal and accounting costs, related to the acquisition. In addition, subsequent adjustments to our initial estimated amount of contingent consideration associated with specific acquisitions are included in acquisition-related charges. Other transactional charges include third-party costs related to structuring unusual transactions.
In 2018 compared to 2017, the cost of professional fees decreased $3.3 million, offset by an increase of $2.1 million in compensation due to headcount and merit increases.
In 2017 compared to 2016, total compensation, benefit and travel costs increased by $7.0 million primarily because of merit increases and increased severance costs, as well as higher stock-based compensation due to a higher attainment of performance-based awards, an award modification, and the launch of the employee stock purchase plan (ESPP) in the fourth quarter of 2016. Offsetting the increases, acquisition-related charges decreased $4.9 million because there were no significant acquisitions in the year, and tax and audit fees decreased $1.8 million during the year.
Amortization of Acquired Intangible Assets
| Year ended September 30, | |||||||||||||||||
| 2018 | Percent Change | 2017 | Percent Change | 2016 | |||||||||||||
| (Dollar amounts in millions) | |||||||||||||||||
| Amortization of acquired intangible assets | $ | 31.4 | (2 | )% | $ | 32.1 | (3 | )% | $ | 33.2 | |||||||
| % of total revenue | 3 | % | 3 | % | 3 | % |
Amortization of acquired intangible assets reflects the amortization of acquired non-product related intangible assets, primarily customer and trademark-related intangible assets, recorded in connection
with completed acquisitions. Amortization of intangible assets typically follows the economic benefit pattern of the acquired intangible assets.
The decrease in amortization of acquired intangible assets from 2016 to 2017 and from 2017 to 2018 is due to certain intangibles becoming fully amortized as well as the impact of foreign currency exchanges.
Restructuring and Other Charges, net
| Year ended September 30, | |||||||||||
| 2018 | 2017 | 2016 | |||||||||
| (Dollar amounts in millions) | |||||||||||
| Restructuring charges (credits), net | $ | (1.0 | ) | $ | 7.9 | $ | 76.3 | ||||
| Headquarters relocation charges | 4.8 | — | — | ||||||||
| Restructuring and Other Charges, Net | $ | 3.8 | $ | 7.9 | $ | 76.3 | |||||
| % of total revenue | — | % | 1 | % | 7 | % |
In fiscal 2016, we committed to a plan to restructure our global workforce and consolidate select facilities to reduce our cost structure and to realign our investments with our identified growth opportunities. The restructuring was substantially completed in 2017 and resulted in a total restructuring charge of $84.5 million.
In 2018, we recorded restructuring credits of $1.0 million related to prior year restructuring actions and made cash payments related to restructuring charges of $2.8 million. At September 30, 2018, accrued restructuring totaled $2.4 million, of which we expect to pay $1.5 million within the next twelve months.
Restructuring charges for 2017 were $7.9 million, including $5.6 million of facility related charges and $2.4 million of employee termination-related costs. In 2017 we made cash payments related to restructuring charges of $37.1 million.
Headquarters relocation charges represent accelerated depreciation expense recorded in anticipation of our relocation to a new worldwide headquarters in the Boston Seaport district in 2019 and exiting our current headquarters facility. Because our current headquarters lease will not expire until November 2022, we are seeking to sublease that space but have not yet done so. If we are unable to sublease our current headquarters space for an amount at least equal to our rent obligations under the current headquarters lease (approximately $12 million per year), we will bear overlapping rent obligations for those premises and will be required to record additional headquarters relocation charges related to any rent shortfall. A charge for such shortfall will be recorded in the earlier of the period that we cease using the existing space (which will likely occur in the second quarter of our fiscal 2019) or the period we sign sublease contracts. Additionally, we will incur other costs associated with the move which will be recorded as incurred.
Interest Expense
| Year ended September 30, | |||||||||
| 2018 | 2017 | 2016 | |||||||
| (Dollar amounts in millions) | |||||||||
| Interest expense | $ | (41.7 | ) | (42.4 | ) | (29.9 | ) |
The decrease in interest expense in 2018 compared to 2017 is primarily due to the write-off deferred financing fees of $1.2 million in March 2017 when we modified our credit facility and reduced the loan commitment to $600 million from $900 million, offset by an increase in interest expense of $0.4 million.
The increase in interest expense in 2017 compared to 2016 was due to a full year of interest being incurred on the $500 million 6% senior notes (the 2024 6% Notes) which were issued in the third quarter of 2016, and higher average interest rates on our revolving credit facility in 2017 compared to 2016.
The average interest rate on our total borrowings was 5.2% in 2018, 4.9% in 2017 and 3.0% in 2016.
Interest Income and Other Expense, net
| Year ended September 30, | |||||||||||
| 2018 | 2017 | 2016 | |||||||||
| (Dollar amounts in millions) | |||||||||||
| Foreign currency losses, net | $ | (7.0 | ) | $ | (5.7 | ) | $ | (1.9 | ) | ||
| Interest income | 3.8 | 3.2 | 3.4 | ||||||||
| Other income (expense), net | 0.3 | 2.5 | (1.8 | ) | |||||||
| $ | (2.9 | ) | $ | 0.1 | $ | (0.3 | ) |
Foreign currency net losses include costs of hedging contracts, certain realized and unrealized foreign currency transaction gains or losses, and foreign exchange gains or losses resulting from the required period-end currency re-measurement of the assets and liabilities of our subsidiaries that use the U.S. dollar as their functional currency. Because a large portion of our revenue and expenses is transacted in foreign currencies, we engage in hedging transactions involving the use of foreign currency forward contracts to reduce our exposure to fluctuations in foreign exchange rates. Changes in the balance year over year are due to required period-end currency re-measurement of the assets and liabilities of our subsidiaries that use the U.S. Dollar as their functional currency. Hedging costs increased $2.0 million in 2018 compared to 2017 and $1.3 million in 2017 compared to 2016.
Interest income represents earnings on the investment of our available cash balances.
Other income (expense), net is primarily made up other non-operating gains and losses. In January 2017, we sold a cost method investment for a gain of $3.7 million.
Income Taxes
Tax Provision and Effective Income Tax Rate
| Year ended September 30, | |||||||||||
| 2018 | 2017 | 2016 | |||||||||
| (Dollar amounts in millions) | |||||||||||
| Pre-tax income (loss) | $ | 28.7 | $ | (1.4 | ) | $ | (67.2 | ) | |||
| Tax benefit | (23.3 | ) | (7.6 | ) | (12.7 | ) | |||||
| Effective income tax rate | (81 | )% | 544 | % | 19 | % |
On December 22, 2017, the United States enacted tax reform legislation through the Tax Cuts and Jobs Act, (the "Tax Act"), which significantly changed existing U.S. tax laws by a reduction of the corporate tax rate, the implementation of a new system of taxation for non-U.S. earnings, the imposition of a one-time tax on the deemed repatriation of undistributed earnings of non-U.S. subsidiaries, and by the expansion of the limitations on the deductibility of executive compensation and interest expense. As we have a September 30 fiscal year-end, a blended U.S. statutory federal rate of approximately 24.5% applies for our fiscal year ending September 30, 2018 and 21% for subsequent fiscal years. The Tax Act also provides that net operating losses generated in years ending after December 31, 2017 (our fiscal 2018) will be carried forward indefinitely and can no longer be carried back, and that net operating losses generated in years beginning after December 31, 2017 can only reduce taxable income by up to 80% when utilized in a future period.
We have provided no federal income taxes payable as a result of the deemed repatriation of undistributed earnings as the tax will be offset by a combination of current year losses and existing attributes which had a full valuation allowance recorded against the related deferred tax assets. We recorded a state income taxes payable on the deemed repatriation of $2.1 million. We also recorded a deferred tax benefit of $14.1 million for the impact of the Tax Act on our net U.S. deferred income tax balances. This was primarily attributable to the reduction of the federal tax rate on the net deferred tax liability in the U.S., and the ability to realize net operating losses from the reversal of existing deferred tax assets which can now be carried forward indefinitely and can therefore be netted against deferred tax liabilities for indefinite lived intangible assets.
The changes included in the Tax Act are broad and complex. The Securities Exchange Commission has issued rules that allow for a measurement period of up to one year after the enactment date of the
Tax Act to finalize the recording of the related tax impacts. We have finalized our accounting for the effects of the legislation with the exception of any additional guidance that may impact our provisional amounts recorded for the transition tax. We are not able to make reasonable estimates at this time of the effects of certain provisions of the Tax Act that will apply to us beginning in our fiscal year ending September 30, 2019, including the Global Intangible Low Tax Income tax (the "GILTI" tax) and any associated impact on our U.S. valuation allowance. We currently anticipate finalizing and recording any resulting adjustments in the quarter ending December 29, 2018.
In 2018 our effective tax rate was lower than the statutory federal income tax rate due to U.S. tax reform, as described above. In 2018, 2017 and 2016, our effective tax rate was materially impacted by our corporate structure in which our foreign taxes are at an effective tax rate lower than the U.S. A significant amount of our foreign earnings is generated by our subsidiaries organized in Ireland. In 2018, 2017 and 2016, the foreign rate differential predominantly relates to these Irish earnings. Additionally, we have a full valuation allowance against deferred tax assets in the U.S., primarily related to net operating loss, tax credit carryforwards, capitalized research and development expense and deferred revenue. As a result, we have not recorded a benefit related to ongoing U.S. losses. Our foreign rate differential in 2018 ,2017 and 2016 includes the continuing rate benefit from a business realignment completed on September 30, 2014 in which intellectual property was transferred between two wholly-owned foreign subsidiaries. The realignment allows us to more efficiently manage the distribution of our products to European customers. In 2018, this realignment resulted in a tax benefit of approximately $24 million and in 2017 and 2016, a benefit of approximately $28 million in each year. In 2017 and 2016, the change in valuation allowance primarily relates to U.S. losses not benefited, partially offset by the release of valuation allowances in foreign subsidiaries of $9.0 million and $3.1 million, respectively. We recorded foreign withholding taxes, an obligation of the U.S. parent of $2.7 million in 2018 and $2.0 million in 2017 and 2016, respectively.
Valuation Allowance
We have concluded, based on the weight of available evidence, that a full valuation allowance continues to be required against our U.S. net deferred tax assets as they are not more likely than not to be realized in the future. We will continue to reassess our valuation allowance requirements each financial reporting period.
Tax Audits and Examinations
In the normal course of business, PTC and its subsidiaries are examined by various taxing authorities, including the Internal Revenue Service (IRS) in the U. S. We regularly assess the likelihood of additional assessments by tax authorities and provide for these matters as appropriate. We are currently under audit by tax authorities in several jurisdictions. Audits by tax authorities typically involve examination of the deductibility of certain permanent items, transfer pricing, limitations on net operating losses and tax credits. Although we believe our tax estimates are appropriate, the final determination of tax audits and any related litigation could result in material changes in our estimates.
In the fourth quarter of 2016, we received an assessment of approximately $12 million from the tax authorities in Korea. The assessment relates to various tax issues, primarily foreign withholding taxes. We have appealed and intend to vigorously defend our positions. We believe that upon completion of a multi-level appeal process it is more likely than not that our positions will be sustained. Accordingly, we have not recorded a tax reserve for this matter. We paid this assessment in the first quarter of 2017, pending resolution of the appeal process.
Our Future Effective Income Tax Rate
Our future effective income tax rate may be materially impacted by the amount of income taxes associated with our foreign earnings, which are taxed at rates different from the U.S. federal statutory income tax rate, as well as the timing and extent of the realization of deferred tax assets and changes in the tax law. Further, our tax rate may fluctuate within a fiscal year, including from quarter to quarter, due to items arising from discrete events, including settlements of tax audits and assessments, the resolution or identification of tax position uncertainties, and acquisitions of other companies.
Operating Measures
Subscription Bookings and Subscription ACV
Given the difference in revenue recognition between the sale of a perpetual software license (revenue is recognized at the time of sale) and a subscription (revenue is recognized ratably over the subscription term), we use bookings for internal planning, forecasting and reporting of new license and subscription sales and cloud services transactions.
In order to normalize between perpetual and subscription licenses, we define subscription bookings as the subscription annualized contract value (subscription ACV) of new subscription bookings multiplied by a conversion factor of 2. We arrived at the conversion factor of 2 by considering many variables, including pricing, support, length of term, and renewal rates. In 2018 and 2017, the average subscription contract term was approximately two years.
We define subscription ACV as the total value of a new subscription booking divided by the term of the contract (in days), multiplied by 365. If the term of the subscription contract is less than a year, and is not associated with an existing contract, the ACV is equal to the total contract value. Beginning in the third quarter of 2018, minimum ACV commitments under our Strategic Alliance Agreement with Rockwell Automation are included in subscription ACV if the period-to-date minimum ACV commitment exceeds actual ACV sold under the Agreement.
We define license and subscription bookings as subscription bookings plus perpetual license bookings plus any monthly software rental bookings during the period.
Because subscription bookings is a metric we use to approximate the value of subscription sales if sold as perpetual licenses, it does not represent the actual revenue that will be recognized with respect to subscription sales or that would be recognized if the sales had been perpetual licenses.
Annualized Recurring Revenue (ARR)
Annualized Recurring Revenue (ARR) for a given quarter is calculated by dividing the non-GAAP subscription and support software revenue for the quarter by the number of days in the quarter and multiplying by 365. ARR should be viewed independently of revenue and deferred revenue as it is an operating measure and is not intended to be combined with or to replace either of those items. ARR is not a forecast and does not include perpetual license or professional services revenues.
Non-GAAP Financial Measures
The non-GAAP financial measures presented in the discussion of our results of operations and the respective most directly comparable GAAP measures are:
| • | non-GAAP revenue—GAAP revenue |
| • | non-GAAP gross margin—GAAP gross margin |
| • | non-GAAP operating income—GAAP operating income |
| • | non-GAAP operating margin—GAAP operating margin |
| • | non-GAAP net income—GAAP net income |
| • | non-GAAP diluted earnings per share—GAAP diluted earnings per share |
The non-GAAP financial measures exclude fair value adjustments related to acquired deferred revenue and deferred costs, stock-based compensation expense, amortization of acquired intangible assets expense, acquisition-related charges, pension plan termination-related costs, a legal accrual, restructuring charges, non-operating credit facility refinancing costs, identified discrete charges included in non-operating other expense, net and the related tax effects of the preceding items, and any other identified tax items.
These items are normally included in the comparable measures calculated and presented in accordance with GAAP. Our management excludes these items when evaluating our ongoing performance and/or predicting our earnings trends, and therefore excludes them when presenting non-GAAP financial measures. Management uses non-GAAP financial measures in conjunction with our GAAP results, as should investors.
Settlement Revenue Exclusions. In Q4'18, we settled a previously disclosed dispute with respect to a customer receivable. The settlement included partial payment of the receivable and new software purchases. The net revenue write-down recorded in Q4'18 was $9.3 million, comprised of a $14.5 million professional services revenue write-down, partially offset by new subscription revenue of $5.2 million. We
excluded the professional services revenue write-down because the write-down related to revenue that was recorded in periods prior to fiscal 2017 and is not reflective of current operating performance and excluded the new subscription revenue because it mitigated the impact of the professional services revenue write-down.
Fair value of acquired deferred revenue is a purchase accounting adjustment recorded to reduce acquired deferred revenue to the fair value of the remaining obligation, so our GAAP revenue after an acquisition does not reflect the full amount of revenue that would have been reported if the acquired deferred revenue was not written down to fair value. We believe excluding these adjustments to revenue from these contracts (and associated costs in fair value adjustment to deferred services cost) is useful to investors as an additional means to assess revenue trends of our business.
Stock-based compensation is a non-cash expense relating to stock-based awards issued to executive officers, employees and outside directors, consisting of restricted stock, stock options and restricted stock units. We exclude this expense as it is a non-cash expense and we assess our internal operations excluding this expense and believe it facilitates comparisons to the performance of other companies in our industry.
Amortization of acquired intangible assets is a non-cash expense that is impacted by the timing and magnitude of our acquisitions. We believe the assessment of our operations excluding these costs is relevant to our assessment of internal operations and comparisons to the performance of other companies in our industry.
Acquisition-related and other transactional charges included in general and administrative costs are
direct costs of potential and completed acquisitions and expenses related to acquisition integration
activities, including transaction fees, due diligence costs, severance and professional fees. Subsequent
adjustments to our initial estimated amount of contingent consideration associated with specific
acquisitions are also included within acquisition-related charges. Other transactional charges include
third-party costs related to structuring unusual transactions. We do not include these costs when
reviewing our operating results internally. The occurrence and amount of these costs will vary depending
on the timing and size of acquisitions.
U.S. pension plan termination-related costs include charges related to our plan that we began terminating in the second quarter of 2014. Costs associated with termination of the plan are not considered part of our regular operations.
Legal accrual includes amounts accrued to settle regulatory and other matters related to our SEC and DOJ FCPA investigation in China. We view these matters as non-ordinary course events and exclude the amounts when reviewing our operating performance.
Restructuring charges include severance costs and excess facility restructuring charges resulting from reductions of personnel driven by modifications to our business strategy. These costs may vary in size based on our restructuring plan.
Headquarters relocation charges include non-cash accelerated depreciation expense recorded in anticipation of exiting our current headquarters facility due to changes in the estimated useful lives of fixed assets. We do not include these costs when reviewing our operating results internally.
Non-operating credit facility refinancing costs are non-operating charges we record as a result of the refinancing of our credit facility. We assess our internal operations excluding these costs and believe it facilitates comparisons to the performance of other companies in our industry.
Income tax adjustments include the tax impact of the items above and assumes that we are profitable on a non-GAAP basis in the U.S. and one foreign jurisdiction, and eliminates the effect of the valuation allowance recorded against our net deferred tax assets in those jurisdictions. Additionally, we exclude other material tax items that we view as non-ordinary course.
We use these non-GAAP financial measures, and we believe that they assist our investors, to make period-to-period comparisons of our operational performance because they provide a view of our operating results without items that are not, in our view, indicative of our core operating results. We believe that these non-GAAP financial measures help illustrate underlying trends in our business, and we use the measures to establish budgets and operational goals (communicated internally and externally) for managing our business and evaluating our performance. We believe that providing non-GAAP financial measures affords investors a view of our operating results that may be more easily compared to the results of peer companies.
The items excluded from the non-GAAP financial measures often have a material impact on our financial results and such items often recur. Accordingly, the non-GAAP financial measures included in this Annual Report should be considered in addition to, and not as a substitute for or superior to, the comparable measures prepared in accordance with GAAP. The following tables reconcile each of these non-GAAP financial measures to its most closely comparable GAAP measure on our financial statements.
| Year ended September 30, | |||||||||||
| 2018 | 2017 | 2016 | |||||||||
| (in millions, except per share amounts) | |||||||||||
| GAAP revenue | $ | 1,241.8 | $ | 1,164.0 | $ | 1,140.5 | |||||
| Settlement revenue exclusion | 9.3 | — | — | ||||||||
| Fair value of acquired deferred revenue | 1.3 | 2.7 | 3.5 | ||||||||
| Non-GAAP revenue | $ | 1,252.4 | $ | 1,166.8 | $ | 1,144.0 | |||||
| GAAP gross margin | $ | 915.6 | $ | 835.0 | $ | 814.9 | |||||
| Settlement revenue exclusion | 9.3 | — | — | ||||||||
| Fair value of acquired deferred revenue | 1.3 | 2.7 | 3.5 | ||||||||
| Fair value to acquired deferred costs | (0.4 | ) | (0.4 | ) | (0.5 | ) | |||||
| Stock-based compensation | 11.5 | 12.6 | 10.8 | ||||||||
| Amortization of acquired intangible assets included in cost of revenue | 26.7 | 26.6 | 24.6 | ||||||||
| Non-GAAP gross margin | $ | 964.0 | $ | 876.5 | $ | 853.2 | |||||
| GAAP operating income (loss) | $ | 73.2 | $ | 40.9 | $ | (37.0 | ) | ||||
| Settlement revenue exclusion | 9.3 | — | — | ||||||||
| Fair value of acquired deferred revenue | 1.3 | 2.7 | 3.5 | ||||||||
| Fair value to acquired deferred costs | (0.4 | ) | (0.4 | ) | (0.5 | ) | |||||
| Stock-based compensation | 82.9 | 76.7 | 66.0 | ||||||||
| Amortization of acquired intangible assets included in cost of revenue | 26.7 | 26.6 | 24.6 | ||||||||
| Amortization of acquired intangible assets | 31.4 | 32.1 | 33.2 | ||||||||
| Acquisition-related and other transactional charges included in general and administrative expenses | 1.9 | 1.6 | 3.5 | ||||||||
| U.S. pension plan termination-related costs | — | 0.3 | — | ||||||||
| Legal accrual | — | — | 3.2 | ||||||||
| Restructuring charges (credits), net | (1.0 | ) | 7.9 | 76.3 | |||||||
| Headquarters relocation charge | 4.8 | — | — | ||||||||
| Non-GAAP operating income | $ | 230.0 | $ | 188.4 | $ | 172.7 | |||||
| GAAP net income (loss) | $ | 52.0 | $ | 6.2 | $ | (54.5 | ) | ||||
| Settlement revenue exclusion | 9.3 | — | — | ||||||||
| Fair value of acquired deferred revenue | 1.3 | 2.7 | 3.5 | ||||||||
| Fair value to acquired deferred costs | (0.4 | ) | (0.4 | ) | (0.5 | ) | |||||
| Stock-based compensation | 82.9 | 76.7 | 66.0 | ||||||||
| Amortization of acquired intangible assets included in cost of revenue | 26.7 | 26.6 | 24.6 | ||||||||
| Amortization of acquired intangible assets | 31.4 | 32.1 | 33.2 | ||||||||
| Acquisition-related and other transactional charges included in general and administrative expenses | 1.9 | 1.6 | 3.5 | ||||||||
| U.S. pension plan termination-related costs | — | 0.3 | — | ||||||||
| Legal accrual | — | — | 3.2 | ||||||||
| Restructuring charges (credits), net | (1.0 | ) | 7.9 | 76.3 | |||||||
| Headquarters relocation charge | 4.8 | — | — | ||||||||
| Non-operating credit facility refinancing costs | — | 1.2 | 2.4 | ||||||||
| Income tax adjustments (1) | (37.6 | ) | (17.4 | ) | (19.8 | ) | |||||
| Non-GAAP net income | $ | 171.2 | $ | 137.6 | $ | 137.8 | |||||
| GAAP diluted earnings (loss) per share | $ | 0.44 | $ | 0.05 | $ | (0.48 | ) | ||||
| Settlement revenue exclusion | 0.08 | — | — |
| Fair value of acquired deferred revenue | 0.01 | 0.02 | 0.03 | ||||||||
| Stock-based compensation | 0.70 | 0.65 | 0.57 | ||||||||
| Total amortization of acquired intangible assets | 0.49 | 0.50 | 0.50 | ||||||||
| Acquisition-related and other transactional charges included in general and administrative expenses | 0.02 | 0.01 | 0.03 | ||||||||
| Legal accrual | — | — | 0.03 | ||||||||
| Headquarters relocation charge | 0.04 | — | — | ||||||||
| Restructuring charges (credits), net | (0.01 | ) | 0.07 | 0.66 | |||||||
| Non-operating credit facility refinancing costs | — | 0.01 | 0.02 | ||||||||
| Income tax adjustments (1) | (0.32 | ) | (0.15 | ) | (0.17 | ) | |||||
| Non-GAAP diluted earnings per share (2) | $ | 1.45 | $ | 1.17 | $ | 1.19 | |||||
| Year ended September 30, | |||||||||||
| Operating margin impact of non-GAAP adjustments: | 2018 | 2017 | 2016 | ||||||||
| GAAP operating margin | 5.9 | % | 3.5 | % | (3.2 | )% | |||||
| Settlement revenue exclusion | 0.6 | % | — | % | — | % | |||||
| Fair value of acquired deferred revenue | 0.1 | % | 0.2 | % | 0.3 | % | |||||
| Stock-based compensation | 6.7 | % | 6.6 | % | 5.8 | % | |||||
| Total amortization of acquired intangible assets | 4.7 | % | 5.0 | % | 5.1 | % | |||||
| Acquisition-related and other transactional charges included in general and administrative expenses | 0.1 | % | 0.1 | % | 0.3 | % | |||||
| Legal accrual | — | % | — | % | 0.3 | % | |||||
| Headquarters relocation charge | 0.4 | % | — | % | — | % | |||||
| Restructuring charges (credits), net | (0.1 | )% | 0.7 | % | 6.7 | % | |||||
| Non-GAAP operating margin | 18.4 | % | 16.1 | % | 15.1 | % |
| (1) | We have a full valuation allowance against our U.S. net deferred tax assets and a valuation allowance against net deferred tax assets in certain foreign jurisdictions. As we are profitable on a non-GAAP basis, the 2018, 2017 and 2016 non-GAAP tax provisions are being calculated assuming there is no valuation allowance. Income tax adjustments reflect the tax effects of non-GAAP adjustments which are calculated by applying the applicable tax rate by jurisdiction to the non-GAAP adjustments listed above. We recorded the impact of the Tax Cuts and Jobs Act in 2018 GAAP earnings, resulting in a non-cash benefit of approximately $12 million. We have excluded these benefits from our non-GAAP results. Additionally, we recorded a tax benefit in 2016 for the write-off of a deferred tax liability that resulted from the change in tax status of a foreign subsidiary. This tax benefit has been excluded from non-GAAP tax expense. |
| (2) | Diluted earnings per share impact of non-GAAP adjustments is calculated by dividing the dollar amount of the non-GAAP adjustment by the diluted weighted average shares outstanding for the respective year. |
Critical Accounting Policies and Estimates
We have prepared our consolidated financial statements in accordance with accounting principles generally accepted in the United States of America. In preparing our financial statements, we make estimates, assumptions and judgments that can have a significant impact on our reported revenues, results of operations, and net income, as well as on the value of certain assets and liabilities on our balance sheet. These estimates, assumptions and judgments are made based on our historical experience and on other assumptions that we believe to be reasonable under the circumstances. These estimates may change as new events occur or additional information is obtained, and we may periodically be faced with uncertainties, the outcomes of which are not within our control and may not be known for a prolonged period of time.
The accounting policies, methods and estimates used to prepare our financial statements are described generally in Note B. Summary of Significant Accounting Policies of Notes to Consolidated Financial Statements in this Annual Report. The most important accounting judgments and estimates that we made in preparing the financial statements involved:
| • | revenue recognition; |
| • | accounting for income taxes; |
| • | valuation of assets and liabilities acquired in business combinations; |
| • | valuation of goodwill; |
| • | accounting for pensions; and |
| • | legal contingencies. |
A critical accounting policy is one that is both material to the presentation of our financial statements and requires us to make subjective or complex judgments that could have a material effect on our financial condition and results of operations. Critical accounting policies require us to make assumptions about matters that are uncertain at the time of the estimate, and different estimates that we could have used, or changes in the estimates that are reasonably likely to occur, may have a material impact on our financial condition or results of operations. Because the use of estimates is inherent in the financial reporting process, actual results could differ from those estimates.
Accounting policies, guidelines and interpretations related to our critical accounting policies and estimates are generally subject to numerous sources of authoritative guidance and are often reexamined by accounting standards rule makers and regulators. These rule makers and/or regulators may promulgate interpretations, guidance or regulations that may result in changes to our accounting policies, which could have a material impact on our financial position and results of operations.
Revenue Recognition
Our sources of revenue include: (1) subscription, (2) support, (3) perpetual license and (4) professional services. Through 2018, we recorded revenues for software related deliverables in accordance with the guidance provided by ASC 985-605, Software-Revenue Recognition and revenues for non-software deliverables in accordance with ASC 605-25, Revenue Recognition, Multiple-Element Arrangements. Under those standards, revenue is recorded when the following criteria are met: (1) persuasive evidence of an arrangement exists, (2) delivery has occurred (generally, FOB shipping point or electronic distribution), (3) the fee is fixed or determinable, and (4) collection is probable. We exercise judgment and use estimates in connection with determining the amounts of software license and services revenues to be recognized in each accounting period. Our primary judgments involve the following:
| • | determining whether collection is probable; |
| • | assessing whether the fee is fixed or determinable; |
| • | determining whether service arrangements, including modifications and customization of the underlying software, are not essential to the functionality of the licensed software and thus would result in the revenue for license and service elements of an agreement being recorded separately; and |
| • | determining the fair value of services and support elements included in multiple-element arrangements, which is the basis for allocating and deferring revenue for such services and support. |
Our software is distributed primarily through our direct sales force. In addition, we have an indirect distribution channel through alliances with resellers. Revenue arrangements with resellers are generally recognized on a sell-through basis; that is, when we deliver the product to the end-user customer. We record consideration given to a reseller as a reduction of revenue to the extent we have recorded revenue from the reseller. We do not offer contractual rights of return, stock balancing, or price protection to our resellers, and actual product returns from them have been insignificant to date. As a result, we do not maintain reserves for reseller product returns.
At the time of each sale transaction, we must make an assessment of the collectability of the amount due from the customer. Revenue is only recognized at that time if management deems that collection is probable. In making this assessment, we consider customer credit-worthiness and historical payment experience. At that same time, we assess whether fees are fixed or determinable and free of contingencies or significant uncertainties. In assessing whether the fee is fixed or determinable, we consider the payment terms of the transaction, including transactions with payment terms that extend beyond our customary payment terms, and our collection experience in similar transactions without making concessions, among other factors. We have periodically provided financing to credit-worthy customers with payment terms up to 24 months. If the fee is determined not to be fixed or determinable, revenue is recognized only as payments become due from the customer, provided that all other revenue
recognition criteria are met. Our software license arrangements generally do not include customer acceptance provisions. However, if an arrangement includes an acceptance provision, we record revenue only upon the earlier of (1) receipt of written acceptance from the customer or (2) expiration of the acceptance period.
Generally, our contracts are accounted for individually. However, when contracts are closely interrelated and dependent on each other, it may be necessary to account for two or more contracts as one to reflect the substance of the group of contracts.
Subscription
Subscription revenue includes revenue from two primary sources: (1) subscription-based licenses, and (2) cloud services.
Subscription-based licenses include the right for a customer to use our on-premise licenses and receive related support for a specified term and revenue is recognized ratably over the term of the arrangement since we do not have vendor-specific objective evidence (“VSOE”) of fair value for our coterminous support. When sold in arrangements with other elements, VSOE of fair value is established for the subscription-based licenses through the use of a substantive renewal clause within the customer contract for a combined annual fee that includes the term-based license and related support.
Cloud services revenue (which in 2018, 2017 and 2016 represented less than 5% of our total revenue) includes fees for hosting and application management of customers’ perpetual or subscription-based licenses (hosting services) and fees for Software as a Service (SaaS) arrangements. When hosting services are sold as part of a multi-element transaction, revenue is allocated to hosting services based on VSOE, and recognized ratably over the contractual term beginning on the commencement dates of each contract, which is the date the services are made available to the customer. VSOE is established for hosting services either through a substantive stated renewal option or stated contractual overage rates, as these rates represent the value the customer is willing to pay on a standalone basis. We also offer cloud services under SaaS arrangements whereby customers access our software in the cloud. Under SaaS arrangements, customers cannot take possession of the software. Cloud services include set-up fees, which are recognized ratably over the contract term or the expected customer life, whichever is longer.
Support
Support contracts generally include rights to unspecified upgrades (when and if available), telephone and internet-based support, updates and bug fixes. Support revenue is recognized ratably over the term of the support contract on a straight-line basis.
Perpetual License
Under perpetual license arrangements, we generally recognize license revenue up front upon shipment to the customer. We use the residual method to recognize revenue from perpetual license software arrangements that include one or more elements to be delivered at a future date when evidence of the fair value of all undelivered elements exists, and the elements of the arrangement qualify for separate accounting as described below. Under the residual method, the fair value of the undelivered elements (i.e., support and services) based on our VSOE of fair value is deferred and the remaining portion of the total arrangement fee is allocated to the delivered elements (i.e., perpetual software license). If evidence of the fair value of one or more of the undelivered elements does not exist, all revenues are deferred and recognized when delivery of all of those elements has occurred or when fair values can be established. We determine VSOE of the fair value of services and support revenue based upon our recent pricing for those elements when sold separately. For certain transactions, VSOE is determined based on a substantive renewal clause within a customer contract. Our current pricing practices are influenced primarily by product type, purchase volume, sales channel and customer location. We review services and support sold separately on a periodic basis and update, when appropriate, our VSOE of fair value for such elements to ensure that it reflects our recent pricing experience.
Professional Services
Our software arrangements often include implementation, consulting and training services that are sold under consulting engagement contracts or as part of the software license arrangement. When we determine that such services are not essential to the functionality of the licensed software, we record revenue separately for the license and service elements of these arrangements, provided that
appropriate evidence of fair value exists for the undelivered services (i.e. VSOE of fair value). We consider various factors in assessing whether a service is not essential to the functionality of the software, including if the services may be provided by independent third parties experienced in providing such services (i.e. consulting and implementation) in coordination with dedicated customer personnel, and whether the services result in significant modification or customization of the software’s functionality. When professional services qualify for separate accounting, professional services revenues under time and materials billing arrangements are recognized as the services are performed. Professional services revenues under fixed-priced contracts are generally recognized as the services are performed using a proportionate performance model with hours or costs as the input method of attribution.
When we provide professional services that are considered essential to the functionality of the software, the arrangement does not qualify for separate accounting of the license and service elements, and the license revenue is recognized together with the consulting services using the percentage-of-completion method of contract accounting. Under such arrangements, consideration is recognized as the services are performed as measured by an observable input. In these circumstances, we separate license revenue from service revenue for income statement presentation by allocating VSOE of fair value of the consulting services as service revenue, and the residual portion as license revenue. Under the percentage-of-completion method, we estimate the stage of completion of contracts with fixed or “not to exceed” fees based on hours or costs incurred to date as compared with estimated total project hours or costs at completion. Adjustments to estimates to complete are made in the periods in which facts resulting in a change become known. When total cost estimates exceed revenues, we accrue for the estimated losses when identified. The use of the proportionate performance and percentage-of-completion methods of accounting require significant judgment relative to estimating total contract costs or hours (hours being a proxy for costs), including assumptions relative to the length of time to complete the project, the nature and complexity of the work to be performed and anticipated changes in salaries and other costs.
Reimbursements of out-of-pocket expenditures incurred in connection with providing consulting services are included in professional services revenue, with the offsetting expense recorded in cost of professional services revenue.
Training services include on-site and classroom training. Training revenues are recognized as the related training services are provided.
Accounting for Income Taxes
As part of the process of preparing our consolidated financial statements, we are required to calculate our income tax expense based on taxable income by jurisdiction. There are many transactions and calculations about which the ultimate tax outcome is uncertain; as a result, our calculations involve estimates by management. Some of these uncertainties arise as a consequence of revenue-sharing, cost-reimbursement and transfer pricing arrangements among related entities and the differing tax treatment of revenue and cost items across various jurisdictions. If we were compelled to revise or to account differently for our arrangements, that revision could affect our tax liability.
The income tax accounting process also involves estimating our actual current tax liability, together with assessing temporary differences resulting from differing treatment of items for tax and accounting purposes. These differences result in deferred tax assets and liabilities, which are included within our consolidated balance sheets. We must then assess the likelihood that our deferred tax assets will be recovered from future taxable income and, to the extent we believe that it is more likely than not that all or a portion of our deferred tax assets will not be realized, we must establish a valuation allowance as a charge to income tax expense.
As of September 30, 2018, we have a valuation allowance of $108.6 million against net deferred tax assets in the U.S. and a valuation allowance of $33.3 million against net deferred tax assets in certain foreign jurisdictions. We have concluded, based on the weight of available evidence, that a full valuation allowance continues to be required against our U.S. net deferred tax assets as they are not more likely than not to be realized in the future. We will continue to reassess our valuation allowance requirements each financial reporting period.
The valuation allowance recorded against net deferred tax assets of certain foreign jurisdictions is established primarily for our net operating loss carryforwards, the majority of which do not expire. There
are limitations imposed on the utilization of such net operating losses that could further restrict the recognition of any tax benefits.
Prior to the passage of the U.S. Tax Act, the Company asserted that substantially all of the undistributed earnings of its foreign subsidiaries were considered indefinitely invested and accordingly, no deferred taxes were provided. Pursuant to the provisions of the U.S. Tax Act, these earnings were subjected to a one-time transition tax. We maintain our assertion to permanently reinvest these earnings outside the U.S. unless repatriation can be done with no significant tax cost, with the exception of a foreign holding company formed in 2018 and our Taiwan subsidiary. If we decide to repatriate any additional non-U.S. earnings in the future, we may be required to establish a deferred tax liability on such earnings. The amount of unrecognized deferred tax liability on the undistributed earnings would not be material.
In the normal course of business, PTC and its subsidiaries are examined by various taxing authorities, including the Internal Revenue Service (IRS) in the U.S. We regularly assess the likelihood of additional assessments by tax authorities and provide for these matters as appropriate. We are currently under audit by tax authorities in several jurisdictions. Audits by tax authorities typically involve examination of the deductibility of certain permanent items, transfer pricing, limitations on net operating losses and tax credits. Although we believe our tax estimates are appropriate, the final determination of tax audits and any related litigation could result in material changes in our estimates.
Valuation of Assets and Liabilities Acquired in Business Combinations
In accordance with business combination accounting, we allocate the purchase price of acquired companies to the tangible and intangible assets acquired and liabilities assumed based on their estimated fair values. Determining these fair values requires management to make significant estimates and assumptions, especially with respect to intangible assets.
Our identifiable intangible assets acquired consist of developed technology, core technology, tradenames, customer lists and contracts, and software support agreements and related relationships. Developed technology consists of products that have reached technological feasibility. Core technology represents a combination of processes, inventions and trade secrets related to the design and development of acquired products. Customer lists and contracts and software support agreements and related relationships represent the underlying relationships and agreements with customers of the acquired company’s installed base. We have generally valued intangible assets using a discounted cash flow model. Critical estimates in valuing certain of the intangible assets include but are not limited to:
| • | future expected cash flows from software license sales, customer support agreements, customer contracts and related customer relationships and acquired developed technologies and trademarks and trade names; |
| • | expected costs to develop the in-process research and development into commercially viable products and estimating cash flows from the projects when completed; |
| • | the acquired company’s brand awareness and market position, as well as assumptions about the period of time the acquired brand will continue to be used by the combined company; and |
| • | discount rates used to determine the present value of estimated future cash flows. |
In addition, we estimate the useful lives of our intangible assets based upon the expected period over which we anticipate generating economic benefits from the related intangible asset.
Net tangible assets consist of the fair values of tangible assets less the fair values of assumed liabilities and obligations. Except for deferred revenues, net tangible assets were generally valued by us at the respective carrying amounts recorded by the acquired company, if we believed that their carrying values approximated their fair values at the acquisition date. The values assigned to deferred revenue reflect an amount equivalent to the estimated cost plus an appropriate profit margin to perform the services related to the acquired company’s software support contracts.
In addition, uncertain tax positions and tax related valuation allowances assumed in connection with a business combination are initially estimated as of the acquisition date and we reevaluate these items quarterly with any adjustments to our preliminary estimates being recorded to goodwill provided that we are within the measurement period (up to one year from the acquisition date) and we continue
to collect information in order to determine their estimated values. Subsequent to the measurement period or our final determination of the estimated value of uncertain tax positions or tax related valuation allowances, whichever comes first, changes to these uncertain tax positions and tax related valuation allowances will affect our provision for income taxes in our Consolidated Statements of Operations.
Our estimates of fair value are based upon assumptions believed to be reasonable at that time, but which are inherently uncertain and unpredictable. Assumptions may be incomplete or inaccurate, and unanticipated events and circumstances may occur, which may affect the accuracy or validity of such assumptions, estimates or actual results.
When events or changes in circumstances indicate that the carrying value of a finite-lived intangible asset may not be recoverable, we perform an assessment of the asset for potential impairment. This assessment is based on projected undiscounted future cash flows over the asset’s remaining life. If the carrying value of the asset exceeds its undiscounted cash flows, we record an impairment loss equal to the excess of the carrying value over the fair value of the asset, determined using projected discounted future cash flows of the asset.
Valuation of Goodwill
Our goodwill totaled $1,182.5 million and $1,182.8 million as of September 30, 2018 and 2017, respectively. We assess goodwill for impairment at the reporting unit level. Our reporting units are determined based on the components of our operating segments that constitute a business for which discrete financial information is available and for which operating results are regularly reviewed by segment management. We have two operating and reportable segments: (1) Software Products and (2) Professional Services.
As of September 30, 2018, goodwill and acquired intangible assets in the aggregate attributable to our Software Products and Professional Services segment was $1,352.4 million and $30.2 million, respectively. As of September 30, 2017, goodwill and acquired intangible assets in the aggregate attributable to our Software Products and Professional Services segment was $1,410.0 million and $30.6 million, respectively. We test goodwill for impairment in the third quarter of our fiscal year, or on an interim basis if an event occurs or circumstances change that would, more likely than not, reduce the fair value of a reporting segment below its carrying value. Factors we consider important (on an overall company basis and reportable segment basis, as applicable) that could trigger an impairment review include significant underperformance relative to historical or projected future operating results, significant changes in our use of the acquired assets or a significant change in the strategy for our business, significant negative industry or economic trends, a significant decline in our stock price for a sustained period, or a reduction of our market capitalization relative to net book value.
We completed our annual goodwill impairment review as of June 30, 2018 based on a qualitative assessment. Our qualitative assessment included company specific (financial performance and long-range plans), industry, and macroeconomic factors, and consideration of the fair value of each reporting unit, which was approximately double its carrying value or higher at July 2, 2016, the last valuation date. Based on our qualitative assessment, we believe it is more likely than not that the fair values of our reporting units exceed their carrying values and no further impairment testing is required.
Accounting for Pensions
We sponsor several international pension plans. We make assumptions that are used in calculating the expense and liability of these plans. These key assumptions include the expected long-term rate of return on plan assets and the discount rate used to determine the present value of benefit obligations. In selecting the expected long-term rate of return on assets, we consider the average future rate of earnings expected on the funds invested to provide for the benefits under the pension plan. This includes considering the plans' asset allocations and the expected returns likely to be earned over the life of the plans. The discount rate reflects the estimated rate at which an amount that is invested in a portfolio of high-quality debt instruments would provide the future cash flows necessary to pay benefits when they come due. The actuarial assumptions used by us may differ materially from actual results due to changing market and economic conditions or longer or shorter life spans of the participants. Our actual results could differ materially from those we estimated, which could require us to record a greater amount of pension expense in future years and/or require higher than expected cash contributions.
Accounting and reporting for these plans requires the use of country-specific assumptions for discount rates and expected rates of return on assets. We apply a consistent methodology in determining the key assumptions that, in addition to future experience assumptions such as mortality rates, are used by our actuaries to determine our liability and expense for each of these plans. The discount rate for Germany was selected with reference to a spot-rate yield curve based on the yields of AA-rated Euro-denominated corporate bonds. In addition, our actuarial consultants determine the expense and liabilities of the plan using other assumptions for future experience, such as mortality rates. In determining our pension cost for 2018, 2017, and 2016, we used weighted average discount rates of 1.8%, 1.3% and 2.2%, respectively, and weighted average expected returns on plan assets of 5.4%, 5.4% and 5.7%, respectively. In 2018, 2017 and 2016, our actual return (loss) on plan assets was $1.0 million, $6.3 million and $1.7 million, respectively. If actual returns are below our expected rates of return, it will impact the amount and timing of future contributions and expense for these plans.
As of September 30, 2018 and 2017, our plans in total were underfunded, representing the difference between our projected benefit obligation and fair value of plan assets, by $17.7 million and $16.7 million, respectively. The projected benefit obligation as of September 30, 2018 was determined using a weighted average discount rate of 1.9%. The most sensitive assumptions used in calculating the expense and liability of our pension plans are the discount rate and the expected return on plan assets. Total GAAP net periodic pension cost was $0.9 million in 2018 and we expect it to be approximately $1.2 million in 2019. A 50 basis point change to our discount rate and expected return on plan assets assumptions would have changed our pension expense for the year ended September 30, 2018 by approximately $1 million. A 50 basis point decrease in our discount rate assumptions would increase our projected benefit obligation as of September 30, 2018 by approximately $7 million.
Legal Contingencies
We are periodically subject to various legal claims and involved in various legal proceedings. We routinely review the status of each significant matter and assess our potential financial exposure. If the potential loss from any matter is considered probable and the amount can be reasonably estimated, we record a liability for the estimated loss. Significant judgment is required in both the determination of probability and the determination as to whether the amount of an exposure is reasonably estimable. Because of inherent uncertainties related to these legal matters, we base our loss accruals on the best information available at the time. Further, estimates of this nature are highly subjective, and the final outcome of these matters could vary significantly from the amounts that have been included in the accompanying Consolidated Financial Statements. As additional information becomes available, we reassess our potential liability and may revise our estimates. Such revisions could have a material impact on future quarterly or annual results of operations.
Liquidity and Capital Resources
| September 30, | |||||||||||
| 2018 | 2017 | 2016 | |||||||||
| (in thousands) | |||||||||||
| Cash and cash equivalents | $ | 259,946 | $ | 280,003 | $ | 277,935 | |||||
| Marketable securities | 55,951 | 50,315 | 49,616 | ||||||||
| Total | $ | 315,897 | $ | 330,318 | $ | 327,551 | |||||
| Activity for the year included the following: | |||||||||||
| Cash provided by operating activities | $ | 247,811 | $ | 135,234 | $ | 183,261 | |||||
| Cash used by investing activities | (49,212 | ) | (16,127 | ) | (237,156 | ) | |||||
| Cash provided (used) by financing activities | (210,846 | ) | (118,105 | ) | 51,606 |
Cash and cash equivalents
We invest our cash with highly rated financial institutions and in diversified domestic and international money market mutual funds. Cash and cash equivalents include highly liquid investments with original
maturities of three months or less. In addition, we hold investments in marketable securities totaling approximately $56.0 million with an average maturity of 14 months. At September 30, 2018, cash and cash equivalents totaled $259.9 million, compared to $280.0 million at September 30, 2017, reflecting $247.8 million in operating cash flow, $1,015.7 million of proceeds from issuance of common stock, of which $1 billion was related to an investment in PTC by Rockwell Automation and the remainder of which relates to common stock issued under our employee stock purchase plan. The proceeds from the Rockwell Automation investment were used in part for repurchases of $1,100.0 million in common stock. In addition, we made $70.0 million of net repayments under our credit facility, $45.4 million was used to pay withholding taxes on stock-based awards that vested in the period, $36.0 million was used for capital expenditures, $8.9 million was used for the payment of contingent consideration, $6.0 million was used to purchase business and intangible assets, and $6.2 million was used to purchase marketable securities, net of proceeds from maturities.
Cash provided by operating activities
Cash provided by operating activities was $247.8 million in 2018 compared to $135.2 million in 2017 and $183.3 million in 2016. The increase in 2018 is primarily due to higher cash collection of accounts receivable of $129.0 million, an increase in net income of $45.7 million, lower restructuring payments ($34.3 million year over year) and a $12 million payment related to a Korean tax audit made in 2017.
The decrease in 2017 compared to 2016 was primarily due to an increase in bonus and commission payments of approximately $33 million, lower cash collections from accounts receivable of $27 million (due to higher 2016 collections of receivables with extended payment terms and a higher subscription mix in 2017), higher interest payments of approximately $26 million, and a $12 million payment related to a Korean tax audit, partially offset by a $35 million increase in cash flows from accounts payable and accrued expenses due to renegotiations with vendors and more effective utilization of available payment terms, $18 million of lower restructuring payments and $28 million paid in 2016 to resolve the regulatory investigation with respect to our China business.
Restructuring payments totaled $2.8 million in 2018, compared to $37.1 million in 2017 and $55.0 million in 2016. Cash paid for income taxes was $22.6 million, $35.4 million, and $25.5 million in 2018, 2017, and 2016, respectively.
Cash used by investing activities
| Year ended September 30, | |||||||||||
| 2018 | 2017 | 2016 | |||||||||
| (in thousands) | |||||||||||
| Acquisitions of businesses, net of cash acquired | $ | (3,000 | ) | $ | (4,960 | ) | $ | (165,802 | ) | ||
| Additions to property and equipment | (36,041 | ) | (25,444 | ) | (26,189 | ) | |||||
| Purchases of short- and long-term marketable securities | (24,311 | ) | (19,726 | ) | (44,605 | ) | |||||
| Proceeds from maturities of short- and long-term marketable securities | 18,140 | 18,785 | — | ||||||||
| Proceeds from sales of investments | — | 15,218 | — | ||||||||
| Purchase on intangible asset | (3,000 | ) | — | — | |||||||
| Purchases of investments | (1,000 | ) | — | (560 | ) | ||||||
| $ | (49,212 | ) | $ | (16,127 | ) | $ | (237,156 | ) |
The 2018 increase in property, plant and equipment payments is primarily attributable to expenditures made for construction of our new worldwide headquarters in the Boston Seaport District. We also used net $6 million to purchase additional marketable securities, $3 million to acquire developed software, $3 million for a small business acquisition and $1 million for a small investment in a technology company.
In 2017, we spent approximately $5 million on acquisitions and sold a minority investment in preferred stock for approximately $15 million.
In 2016, we acquired Kepware for $99.4 million, net of cash acquired, and Vuforia for $64.8 million, net of cash acquired. In 2016, we initiated an ongoing investment strategy whereby a portion of
available cash balances were used to purchase investment grade securities with maturities up to three years.
Our expenditures for property and equipment consist primarily of computer equipment, software, office equipment and facility improvements.
Cash provided (used) by financing activities
| Year ended September 30, | |||||||||||
| 2018 | 2017 | 2016 | |||||||||
| (in thousands) | |||||||||||
| Borrowings under debt agreements | $ | 250,000 | $ | 150,000 | $ | 670,000 | |||||
| Repayments of borrowings under credit facility | (320,000 | ) | (190,000 | ) | (580,000 | ) | |||||
| Repurchases of common stock | (1,100,000 | ) | (50,991 | ) | — | ||||||
| Proceeds from issuance of common stock | 1,015,654 | 10,778 | 21 | ||||||||
| Payments of withholding taxes in connection with vesting of stock-based awards | (45,374 | ) | (26,654 | ) | (20,939 | ) | |||||
| Excess tax benefits from stock-based awards | |||||||||||
| Credit facility origination costs | (2,851 | ) | (184 | ) | (6,855 | ) | |||||
| Contingent consideration | (8,275 | ) | (11,054 | ) | (10,621 | ) | |||||
| $ | (210,846 | ) | $ | (118,105 | ) | $ | 51,606 |
In 2018, we resumed our stock repurchase program and used $1,100.0 million to repurchase our common stock. For the repurchases made in 2018, we used $1 billion from an equity investment in PTC made by Rockwell Automation and $100 million in cash provided by operating activities. Proceeds from issuance of common stock of $1,015.7 million includes $1 billion from the Rockwell Automation investment in PTC and $15.7 million of proceeds from our employee stock purchase plan. In 2018, we repaid $70.0 million under our credit facility. In 2018, credit facility origination costs included costs associated with the modification of our credit facility.
Credit Agreement
In September 2018, we amended and restated our existing credit facility to increase the revolving loan commitment from $600 million to $700 million and amend other provisions. The credit facility is a multi-currency credit facility with a syndicate of sixteen banks for which JPMorgan Chase Bank, N.A. acts as Administrative Agent. Outstanding revolving loan amounts may be repaid in whole or in part, without penalty or premium, prior to the September 13, 2023 maturity date, when all remaining amounts outstanding will be due and payable in full.
We use the credit facility for general corporate purposes, including acquisitions of businesses, share repurchases and working capital requirements. As of September 30, 2018, we had $148.1 million in revolving loans outstanding under the credit facility, the fair value of which approximated its book value. As of September 30, 2018, we have approximately $552 million undrawn, of which $535 million would be available to borrow, the availability of which is reduced by letters of credit and certain other long-term liabilities.
Any borrowings by PTC Inc. or certain of our foreign subsidiaries under the credit facility would be guaranteed, respectively, by our material domestic subsidiaries that become parties to the subsidiary guaranty, if any, and/or by PTC Inc. Borrowings are also secured by first priority liens on property of PTC and certain of our material domestic subsidiaries, including 100% of the voting equity interests of certain of our domestic subsidiaries and 65% of our material first-tier foreign subsidiaries. Loans under the credit facility bear interest at variable rates that reset every 30 to 180 days depending on the rate and period selected by us and based upon our total leverage ratio. During 2018, the weighted average annual interest rate for all borrowings outstanding was 5.17% and, as of September 30, 2018, the rate on the credit facility was 3.8%. We also pay a quarterly commitment fee on the undrawn portion of the credit facility ranging from 0.175% to 0.30% per year based on our total leverage ratio.
The credit facility imposes customary covenants that limit our ability to incur liens or guarantee obligations, pay dividends and make other distributions, make investments and engage in certain other transactions. In addition, we and our material domestic subsidiaries may not invest in, or loan to, our
foreign subsidiaries in aggregate amounts exceeding $100 million for any purpose and an additional $200 million for acquisitions of businesses. We also must maintain the following financial ratios:
| Ratio as of September 30, 2018 | |||
| Total Leverage Ratio Ratio of consolidated total indebtedness to the consolidated trailing four quarters EBITDA, not to exceed 4.50 to 1.00 as of the last day of any fiscal quarter. | 2.36 | to | 1.00 |
| Interest Coverage Ratio Ratio of consolidated trailing four quarters EBITDA to consolidated trailing four quarters cash basis interest expense, to be not less than 3.00 to 1.00. | 6.18 | to | 1.00 |
| Senior Secured Leverage Ratio Ratio of senior consolidated total indebtedness (which excludes unsecured indebtedness) to consolidated trailing four quarters EBITDA as of the last day of any fiscal quarter, not to exceed 3.00 to 1.00. | 0.58 | to | 1.00 |
Any failure to comply with such covenants would prevent us from being able to borrow additional funds, and would constitute a default, permitting the lenders to, among other things, accelerate the amounts outstanding and terminate the credit facility. As of September 30, 2018, we were in compliance with all financial and operating covenants of the credit facility.
Outstanding Notes
On May 12, 2016, we issued $500 million of 6.00% Senior Notes due 2024 (the “2024 6% Notes”) in a registered offering and used the net proceeds to repay indebtedness under our senior credit facility. As of September 30, 2018, unamortized deferred financing fees associated with the offering and presented as a direct reduction from the carrying amount of the 2024 6% Notes were $4.9 million.
The 2024 6% Notes are unsecured, mature on May 15, 2024, and bear interest at a rate of 6.00% per annum, payable semi-annually (November and May). At any time before May 15, 2019, (i) we may redeem up to 40% of the aggregate principal amount of the 2024 6% Notes with the net cash proceeds of certain public equity offerings at a price equal to 106.00% of the aggregate principal amount redeemed plus accrued and unpaid interest, provided that at least 60% of the 2024 6% Notes that were originally issued remain outstanding immediately thereafter, and (ii) we may redeem some or all of the 2024 6% Notes at a price equal to 100% of the aggregate principal amount plus accrued and unpaid interest and a make-whole premium. On or after May 15, 2019, we may redeem some or all of the 2024 6% Notes at redemption prices specified in the 2024 6% Notes plus accrued and unpaid interest. In addition, if we undergo a change of control, we will be required to make an offer to purchase all the 2024 6% Notes at a price equal to 101% of the principal amount of the 2024 6% Notes plus accrued and unpaid interest.
The notes were issued under an indenture that contains customary covenants. Subject to certain exceptions, our ability to incur certain additional debt is limited unless, after giving pro forma effect to such incurrence and the application of the proceeds thereof, the ratio of our EBITDA to our Consolidated Fixed Charges (as both terms are defined in the indenture) is not greater than 2.00 to 1.00. The indenture also restricts our ability to incur liens, pay dividends or make certain other distributions, sell assets or engage in sale/leaseback transactions. Any failure to comply with these and other covenants included in the indenture could constitute an event of default that could result in the acceleration of the payment of the aggregate principal amount of 2024 6% Notes then outstanding and accrued interest. As of September 30, 2018, we were in compliance with all such covenants.
Share Repurchase Authorization
Our Articles of Organization authorize us to issue up to 500 million shares of our common stock. Our Board of Directors has authorized us to repurchase up to $1,500 million of our common stock for the October 1, 2017 through September 30, 2020 period. We intend to use cash from operations and borrowings under our credit facility to make such repurchases. All shares of our common stock repurchased are automatically restored to the status of authorized and unissued.
In 2018, we repurchased 9.4 million shares. The repurchases were made under two accelerated repurchase (ASR) agreements. We completed the $100 million ASR repurchase in the third quarter of 2018. We entered into a $1,000 million ASR in July 2018. Shares valued at $800 million in the aggregate were delivered to us upon entry into the ASR. The remaining $200 million represents the amount held back by the bank counterparty pending final settlement of the ASR, which is expected to occur in the second or third quarter of 2019. Upon settlement of the ASR, the total shares repurchased by us will equal $1,000 million divided by the average daily volume weighted-average price of our common stock during the term of the ASR program less a fixed per share discount. We used the $1 billion in proceeds from the Rockwell Automation equity investment in PTC and $100 million of cash from operations to make the repurchases.
In 2017, we repurchased 0.9 million shares at cost of $51.0 million. In 2016, we did not repurchase any shares due to our transition to a subscription business model and the near-term impact on free cash flow and EBITDA.
Expectations for Fiscal 2019
Our transition to a subscription licensing model has had, and will continue to have, an adverse impact on revenue, operating margin and EPS relative to periods in which we primarily sold perpetual licenses until the expected transition of our customer base to subscription is completed. This also affects consolidated EBITDA as calculated under our credit facility and, as a result of the Total Leverage Ratio under the facility, limits the amount we can borrow under the facility. Notwithstanding the effect of the subscription transition and those limitations, we believe that existing cash and cash equivalents, together with cash generated from operations and amounts available under the credit facility, will be sufficient to meet our working capital and capital expenditure requirements (which we expect to be $40 million in 2019) through at least the next twelve months and to meet our known long-term capital requirements.
Our expected uses of cash could change, our cash position could be reduced and we could incur additional debt obligations if we purchase our outstanding shares or retire debt or engage in strategic transactions, any of which could be commenced, suspended or completed at any time. Any such purchases or retirement of debt will depend on prevailing market conditions, our liquidity requirements, contractual restrictions and other factors. We also evaluate possible strategic transactions on an ongoing basis and at any given time may be engaged in discussions or negotiations with respect to possible strategic transactions. The amounts involved in any share or debt repurchases or strategic transactions may be material.
We ended 2018 with a cash balance of $260 million and marketable securities of $56 million. A significant portion of our cash is generated and held outside of the United States. At September 30, 2018, we had cash and cash equivalents of $29.6 million in the United States, $88.5 million in Europe, $95.6 million in the Pacific Rim (including India), $14.8 million in Japan and $31.4 million in other non-U.S. countries. All of the marketable securities are held in Europe. We have substantial cash requirements in the United States, but we believe that the combination of our existing U.S. cash and cash equivalents, marketable securities, and future U.S. operating cash flows and cash available under our credit facility, will be sufficient to meet our ongoing U.S. operating expenses and known capital requirements.
Contractual Obligations
At September 30, 2018, our contractual obligations were as follows:
| Payments due by period | |||||||||||||||||||
| Contractual Obligations | Total | Less than 1 year | 1-3 years | 3-5 years | More than 5 years | ||||||||||||||
| (in millions) | |||||||||||||||||||
| Debt (1) | $ | 863.2 | $ | 37.1 | $ | 74.2 | $ | 222.0 | $ | 530.0 | |||||||||
| Operating leases (2) | 352.7 | 38.7 | 66.9 | 46.6 | 200.5 | ||||||||||||||
| Purchase obligations (3) | 115.5 | 88.5 | 26.7 | 0.2 | — | ||||||||||||||
| Pension liabilities (4) | 17.7 | 2.6 | 5.6 | 6.4 | 3.2 | ||||||||||||||
| Unrecognized tax benefits (5) | 9.8 | ||||||||||||||||||
| Total | $ | 1,358.9 | $ | 166.9 | $ | 173.4 | $ | 275.2 | $ | 733.7 |
| (1) | Includes required principal repayments and interest and commitment fees on our 2024 6% Notes and our revolving credit facility based on the balance outstanding as of September 30, 2017 and the interest rates in effect as of September 30, 2018, 6.0% for our 2024 6% Notes and 3.8% for our revolving credit facility. The credit facility matures on September 13, 2023, when all remaining amounts outstanding will be due and payable in full. Principal and interest on any additional borrowing that may be required to refinance the credit facility upon its maturity are not included in the contractual obligations above. |
| (2) | The future minimum lease payments above include minimum future lease payments for excess facilities under non-cancelable operating leases. These leases qualify for operating lease accounting treatment and, as such, are not included on our balance sheet. See Note I. Commitments and Contingencies of Notes to Consolidated Financial Statements in this Annual Report for additional information regarding our operating leases. On September 7, 2017, we entered into a lease for approximately 250,000 square feet located at 121 Seaport Boulevard, Boston, Massachusetts. The term of the lease is expected to run from January 1, 2019 through June 30, 2037, subject to adjustment based on the initial occupancy date. Base rent for the first year of the lease is $11.0 million and will increase by $1 per square foot leased per year thereafter ($0.3 million per year). Base rent which first becomes payable on July 1, 2020, subject to adjustment based on the lease commencement date, is included in the operating lease obligations above. In addition to the base rent, PTC must pay its pro rata portions of building operating costs and real estate taxes (together, “Additional Rent”). Additional rent, equal to approximately 63% of total building operating costs and real estate taxes, is estimated to be approximately $5.9 million for the first year we begin paying rent and is not included in the operating lease payments above. |
| (3) | Purchase obligations represent minimum commitments due to third parties, including royalty contracts, research and development contracts, telecommunication contracts, information technology maintenance contracts in support of internal-use software and hardware and other marketing and consulting contracts. Contracts for which our commitment is variable, based on volumes, with no fixed minimum quantities, and contracts that can be canceled without payment penalties have been excluded. The purchase obligations included above are in addition to amounts included in current liabilities and prepaid expenses recorded on our September 30, 2018 consolidated balance sheet. |
| (4) | These obligations relate to our international pension plans and are not subject to fixed payment terms. Payments have been estimated based on the plans’ current funded status, planned employer contributions and actuarial assumptions. In addition, we may, at our discretion, make additional voluntary contributions to the plans. See Note M. Pension Plans of Notes to Consolidated Financial Statements in this Annual Report for further discussion. |
| (5) | As of September 30, 2018, we had recorded total unrecognized tax benefits of $9.8 million. This liability is not subject to fixed payment terms and the amount and timing of payments, if any, which we will make related to this liability, are not known. See Note G. Income Taxes of Notes to Consolidated Financial Statements in this Annual Report for additional information. |
As of September 30, 2018, we had letters of credit and bank guarantees outstanding of approximately $15.5 million (of which $1.1 million was collateralized), primarily related to our corporate headquarters lease in Needham, Massachusetts.
Off-Balance Sheet Arrangements
We have not created, and are not party to, any special-purpose or off-balance sheet entities for the purpose of raising capital, incurring debt or operating parts of our business that are not consolidated (to the extent of our ownership interest therein) into our financial statements. We have not entered into any transactions with unconsolidated entities whereby we have subordinated retained interests, derivative instruments or other contingent arrangements that expose us to material continuing risks, contingent liabilities, or any other obligation under a variable interest in an unconsolidated entity that provides financing, liquidity, market risk or credit risk support to us.
Recent Accounting Pronouncements
In accordance with recently issued accounting pronouncements, we will be required to comply with certain changes in accounting rules and regulations. Refer to Note B. Summary of Significant Accounting Policies to the Condensed Consolidated Financial Statements in this Form 10-K for all recently issued accounting pronouncements. We are currently evaluating the impact of the new guidance on our consolidated financial statements. Outlined below are the recent accounting pronouncements that we believe will have the most significant impact on us.
Income Taxes
In October 2016, the FASB issued ASU 2016-16, Income Taxes (Topic 740): Intra-Entity Transfers of Assets Other Than Inventory (“ASU 2016-16”). The purpose of ASU 2016-16 is to simplify the income tax accounting of an intra-entity transfer of an asset other than inventory and to record its effect when the transfer occurs. The guidance is effective for annual reporting periods beginning after December 15, 2017 (our fiscal 2019) including interim reporting periods within those annual reporting periods and early adoption is permitted. We are currently evaluating the impact of the new guidance on our consolidated financial statements. We expect to record a net deferred tax asset of approximately $72 million upon adoption, primarily relating to deductible amortization of intangible assets in Ireland. Post adoption, our effective tax rate will no longer include the benefit of this amortization, which is reflected in our effective tax rate reconciliation under the current guidance.
Leases
In February 2016, the FASB issued ASU No. 2016-02, Leases (Topic 842), which will replace the existing guidance in ASC 840, Leases. The updated standard aims to increase transparency and comparability among organizations by requiring lessees to recognize lease assets and lease liabilities on the balance sheet and to disclose important information about leasing arrangements. ASU 2016-02 is effective for annual periods beginning after December 15, 2018 (our fiscal 2020) and interim periods within those annual periods. Early adoption is permitted and modified retrospective application is required. We are currently evaluating the impact of the new guidance on our consolidated financial statements.
Revenue Recognition
In May 2014, the FASB issued ASU No. 2014-09, Revenue from Contracts with Customers: Topic 606 (ASC 606). ASC 606 supersedes nearly all existing revenue recognition guidance under U.S. GAAP. The FASB has also issued additional standards to provide clarification and implementation guidance on ASC 606.
The core principle of ASC 606 is to recognize revenue when promised goods or services are transferred to a customer in an amount that reflects the consideration that is expected to be received for those goods or services. Under the new guidance, an entity is required to evaluate revenue recognition through a five-step process: (1) identifying a contract with a customer; (2) identifying the performance obligations in the contract; (3) determining the transaction price; (4) allocating the transaction price to the performance obligations in the contract; and (5) recognizing revenue when (or as) the entity satisfies a performance obligation. The standard also requires disclosure of the nature, amount, timing and uncertainty of revenue and cash flows arising from contracts with customers. In applying the principles of ASC 606, it is possible more judgment and estimates may be required within the revenue recognition process than is required under existing U.S. GAAP, including identifying performance obligations, estimating the amount of variable consideration to include in the transaction price, and estimating the value of each performance obligation to allocate the total transaction price to each separate performance obligation.
ASC 606 is effective for us in the first quarter of our fiscal 2019. Companies may adopt ASC 606 using either the retrospective method, under which each prior reporting period is presented under ASC 606,
with the option to elect certain permitted practical expedients, or the modified retrospective method, under which a company adopts ASC 606 from the beginning of the year of initial application with no restatement of comparative periods, with the cumulative effect of initially applying ASC 606 recognized at the date of initial application, and with certain additional required disclosures. We are adopting ASC 606 using the modified retrospective method.
While we are continuing to assess the impact of the new standard, we currently believe the most significant impact relates to accounting for our subscription arrangements that include term-based on-premise software licenses bundled with support and/or cloud services. Under current GAAP, the revenue attributable to these subscription licenses bundled with support is recognized ratably over the term of the arrangement because VSOE does not exist for the undelivered support element as it is not sold separately. Under the new standard, the requirement to have VSOE for undelivered elements to enable the separation of revenue for the delivered software licenses is eliminated. Accordingly, under the new standard we will be required to recognize as revenue a portion of the subscription fee upon delivery of the software license. For subscriptions arrangements that also include cloud services, the company assessed whether the cloud component was highly interrelated with the on-premise term software license. Other than a limited population of subscriptions, the cloud component is currently not deemed to be interrelated with the on-premise term software and as a result, cloud services will be accounted for as a separate distinct performance obligation. We do have a limited number of subscriptions that incorporate substantial cloud services where cloud services are not distinct from the on-premise term license in the context of the contracts as they are considered highly interrelated and represent a single performance obligation, for which the revenue will continue to be recognized over time. We currently expect revenue related to our perpetual license revenue and related support contracts, professional services and cloud offerings to remain substantially unchanged. Due to the complexity of certain of our contracts, the actual revenue recognition treatment required under the new standard may be dependent on contract-specific terms and, therefore, may vary in some instances.
Upon implementation of the new standard in fiscal 2019, we expect to make revisions to contract terms with our customers for new orders that will result in shortening the initial, non-cancellable term of our multi-year subscriptions to one year. This change will result in annual contractual periods for the majority of our software subscriptions, the license portion of which will be recognized at the beginning of each annual contract period upon delivery of the licenses and the support portion of which will be recognized ratably over the one year contractual period. As a result, we anticipate one year of subscription revenue will be recognized for each contract each year; however, more of the revenue will be recognized in the quarter that the contract period begins and less will be recognized in the subsequent three quarters of the contract than under the current accounting rules.
Under the modified retrospective method, we will evaluate each contract that is ongoing on the adoption date as if that contract had been accounted for under ASC 606 from contract inception. Some license revenue related to subscription arrangements that would have been recognized in future periods under current GAAP will be recast under ASC 606 as if the revenue had been recognized in prior periods. Under this transition method, we will not adjust historical reported revenue amounts. Instead, the revenue that would have been recognized under this method prior to the adoption date will be an adjustment to retained earnings and will not be recognized as revenue in future periods as previously planned. Because we expect that license revenue associated with subscription contracts will be recognized up front instead of over time under ASC 606, we expect approximately $350 million to $380 million will be adjusted to retained earnings upon adoption related to billed and unbilled deferred revenue. During the first year of adoption, we will disclose the amount of this retained earnings adjustment and intend to provide supplemental disclosure of how this revenue would have been recognized under the current rules.
Another significant provision under ASC 606 includes the capitalization and amortization of costs associated with obtaining and fulfilling a contract. Currently, substantially all of these costs are expensed in the period incurred. Under ASC 606, direct and incremental costs to acquire a contract are capitalized and amortized using a systematic basis over the pattern of transfer of the goods and services to which the asset relates. Under ASC 606, we estimate approximately $70 million of commission costs will be capitalized and amortized over the period the capitalized assets are expected to contribute to future cash flows.
Furthermore, we have made and will continue to make investments in systems and processes to enable timely and accurate reporting under the new standard. We are implementing operational and internal control structural changes.
Previous: Item 6. Selected Financial Data · Next: Item 7A. Quantitative and Qualitative Disclosures about Market Risk