 filings.tools
PTC 10-K 2021-09-30
Filed 2021-11-22. 23 sections, 348K characters. Original on sec.gov · Markdown · JSON
Cover and table of contents
UNITED STATES
SECURITIES AND EXCHANGE COMMISSION
Washington, D.C. 20549
FORM 10-K
| ☑ | ANNUAL REPORT PURSUANT TO SECTIONS 13 OR 15(d) OF THE SECURITIES EXCHANGE ACT OF 1934 |
For the Fiscal Year Ended: September 30, 2021
OR
| ☐ | TRANSITION REPORT PURSUANT TO SECTION 13 OR 15(d) OF THE SECURITIES EXCHANGE ACT OF 1934 |
For the transition period from_ to_
Commission File Number: 0-18059
PTC Inc.
(Exact name of registrant as specified in its charter)
| Massachusetts | 04-2866152 | |
| (State or other jurisdiction of incorporation or organization) | (I.R.S. Employer Identification Number) |
121 Seaport Boulevard, Boston, MA 02210
(Address of principal executive offices, including zip code)
(781) 370-5000
(Registrant’s telephone number, including area code)
Securities registered pursuant to Section 12(b) of the Act:
| Title of each class | Trading Symbol | Name of each exchange on which registered |
| Common Stock, $.01 par value per share | PTC | NASDAQ Global Select Market |
Securities registered pursuant
to Section 12(g) of the Act: None
Indicate by check mark whether the registrant is a well-known seasoned issuer, as defined in Rule 405 of the Securities Act. Yes ☑ No ☐
Indicate by check mark whether the registrant is not required to file reports pursuant to Section 13 or 15(d) of the Act. Yes ☐ No ☑
Indicate by check mark whether the registrant: (1) has filed all reports required to be filed by Section 13 or 15(d) of the Securities Exchange Act of 1934 during the preceding 12 months (or for such shorter period that the registrant was required to file such reports) and (2) has been subject to such filing requirements for the past 90 days. Yes ☑ No ☐
Indicate by check mark whether the registrant has submitted electronically every Interactive Data File required to be submitted pursuant to Rule 405 of Regulation S-T during the preceding 12 months (or for such shorter period that the registrant was required to submit such files). Yes ☑ No ☐
Indicate by check mark whether the registrant is a large accelerated filer, an accelerated filer, a non-accelerated filer or a smaller reporting company. See the definitions of “large accelerated filer,” “accelerated filer” and “smaller reporting company” in Rule 12b-2 of the Exchange Act.
| Large Accelerated Filer | ☑ | Accelerated Filer | ☐ | Non-accelerated Filer | ☐ | Smaller Reporting Company | ☐ |
| Emerging growth company | ☐ |
If an emerging growth company, indicate by check mark if the registrant has elected not to use the extended transition period for complying with any new or revised financial accounting standards provided pursuant to Section 13(a) of the Exchange Act. ☐
Indicate by check mark whether the registrant has filed a report on and attestation to its management’s assessment of the effectiveness of its internal control over financial reporting under Section 404(b) of the Sarbanes-Oxley Act (15 U.S.C. 7262(b)) by the registered public accounting firm that prepared or issued its audit report. ☑
Indicate by check mark whether the registrant is a shell company (as defined in Rule 12b-2 of the Act). Yes ☐ No ☑
The aggregate market value of our voting stock held by non-affiliates was approximately $14,486,748,642 on March 31, 2021 based on the last reported sale price of our common stock on the Nasdaq Global Select Market on that date. There were 116,854,806 shares of our common stock outstanding on that day and 117,871,872 shares of our common stock outstanding on November 17, 2021.
DOCUMENTS INCORPORATED BY REFERENCE
Portions of the definitive Proxy Statement in connection with the 2022 Annual Meeting of Stockholders (2022 Proxy Statement) are incorporated by reference into Part III.
PTC Inc.
ANNUAL REPORT ON FORM 10-K FOR FISCAL YEAR 2021
Table of Contents
Forward-Looking Statements
Statements in this Annual Report about our anticipated financial results, capital development and growth, as well as about the development of our products, markets and workforce, are forward-looking statements that are based on our current plans and assumptions. Important information about factors that may cause our actual results to differ materially from these statements is discussed in Item 1A. “Risk Factors” and generally throughout this Annual Report.
Unless otherwise indicated, all references to a year reflect our fiscal year that ends on September 30.
PART I
Item 1. Business
| --- | --- |
PTC is a global software and services company that enables industrial companies to improve growth and profitability with a portfolio of innovative digital solutions that work together to transform how physical products are engineered, manufactured, and serviced. Our award-winning technology portfolio spans the computer-aided design (CAD), product lifecycle management (PLM), Industrial Internet of Things (IIoT), and Augmented Reality (AR) markets. Our technology can be delivered on premises, in the cloud, or in a hybrid model.
Our customer base includes some of the world’s most innovative manufacturers in the aerospace and defense, automotive, electronics and high tech, industrial machinery and equipment, life sciences, oil and gas, retail and consumer products industries. Our solutions enable industrial companies to create a closed loop of information shared across their organization’s entire value chain. This “digital thread” can drive excellence in engineering, efficiency in manufacturing operations and service delivery, and innovation across product offerings and business models. With our solutions, digital transforms physical.
As a purpose-driven company, we don’t just imagine a better world, we help create it. Our purpose statement - Power To Create – is a commitment to our customers to help them solve difficult challenges; a commitment to our employees to build a culture that supports diversity, equity, and inclusion so they can achieve their greatest potential; and a commitment to support the communities our employees live and work in globally.
We generate revenue through the sale of software subscriptions, which include license access and support (technical support and software updates); support for existing perpetual licenses; professional services (consulting, implementation, and training); and cloud services (hosting for our software and SaaS).
Our Strategy
There are three key elements to our strategy to deliver long-term shareholder value.
Align with market demand to deliver technology solutions aligned with secular market trends, including digital transformation, SaaS, remote collaboration and AI. We believe demand for solutions such as ours that enable work from home and/or office, global team and supply chain collaboration, remote asset management, and remote frontline worker training and support is strong. In addition, there is growing customer demand for SaaS offerings; we intend to increase our investment in SaaS initiatives, while better aligning with SaaS best practices in order to meet the needs of the market.
Drive sustainable top line ARR growth by expanding our footprint with existing customers, cross-selling complementary solutions in our customer base, adding new customers and by maintaining strong customer retention rates through our global field organization and partner ecosystem. FY’21 marked the fourth consecutive year of double-digit ARR growth, despite the manufacturing and macroeconomic environments over that period. In FY’22, we are evolving our organizational structure to align better with a traditional SaaS model and create a much-improved customer experience.
Grow operating cash flow through continued operating discipline within a recurring business model. Our organizational changes are designed to grow ARR, increase customer retention, and improve operating efficiency, we expect to grow our operating cash flow.
Our Principal Products and Services
In order to drive clear focus, we have divided our business into two key product groups: Digital Thread and Velocity. The Digital Thread business is focused on customers that are embracing digital transformation and the Velocity business is focused on customers that prioritize agile product development.
Digital Thread – Core
| Our Creo® 3D CAD technology enables the digital design, testing, and modification of product models. With its design simulation, additive manufacturing, and generative design innovations, we enable our customers to be first to market with differentiated products. From initial concept to design, simulation, and analysis, Creo provides designers with innovative tools to efficiently create better products, faster. | Our Windchill® PLM application suite manages all aspects of the product development lifecycle - from concept through service and retirement - by enabling a digital thread of product parts, materials, and configuration information. Windchill provides real-time information sharing, dynamic data visualization, and the ability to collaborate across geographically-distributed teams, enabling manufacturers to elevate their product development process. With its open architecture that integrates with other enterprise systems, Windchill provides a solid foundation for a product-driven digital thread. |
|---|
Digital Thread – Growth
| Flexible and purpose-built for Industrial IoT, our ThingWorx® platform offers a rich set of capabilities that enable enterprises to digitally transform every aspect of their business with innovative solutions that are simple to create, easy to implement, scalable to meet future needs, and designed to enable customers to accelerate time to value. | Our Vuforia® augmented reality technology enables the visualization of digital information in a physical context and the creation of AR experiences to deliver workforce productivity and business results in manufacturing, service, engineering, and operations. Vuforia enables augmented reality and mixed reality experiences for the industrial enterprise. Vuforia solutions equip frontline workers with focused and effective step-by-step instructions, procedural guidance, skill development and remote assistance that enable enterprises to reduce errors, increase asset utilization and drive higher profitability. |
|---|
Digital Thread – Focused Solutions Group (FSG)
Our IntegrityTM application lifecycle management (ALM) and model-based systems engineering capabilities enable users to manage system models, software configurations, and test plans and defects.
Our Servigistics® service parts management solution enables customers to effectively manage service parts, improve their products and services, and increase customer satisfaction.
Velocity
| Our Onshape® Software-as-a-Service (SaaS) product development platform unites computer-aided design with data management, collaboration tools, and real-time analytics. A cloud-native multi-tenant solution that can be instantly deployed on virtually any computer or mobile device, Onshape enables teams to work together from just about anywhere. Real-time design reviews, commenting, and simultaneous editing enable a collaborative workflow where multiple design iterations can be completed in parallel and merged into the final design. | Our Arena® SaaS PLM solution enables product teams to collaborate virtually anytime and anywhere, making it easier to share the latest product and quality information with internal teams and supply chain partners and help deliver innovative products to customers faster. Our Arena quality management system software connects quality and product designs into a single system to simplify regulatory compliance. |
|---|
Our Markets and How We Address Them
We compete in the CAD, PLM, IIoT and AR markets. The markets we serve present different growth opportunities for us. We see greater opportunity for market growth for our IIoT and AR solutions for the enterprise and our SaaS solutions, followed by more moderate market growth for our on-premise CAD and PLM solutions, both of which have been growing faster than their respective market growth rates.
We derive most of our sales from products and services sold directly by our sales force to end-user customers. Approximately 30% to 35% of our sales of products and services are through third-party resellers. Our sales force focuses on large accounts, while our reseller channel provides a cost-effective means of covering the small- and medium-size business market. Our strategic alliance partners enable us to increase our market reach, offer broader solutions, and add compelling technology to our offerings. Our strategic services partners provide service offerings to help customers implement our product offerings.
Additional financial information about our segments and international and domestic operations may be found in Note 18. Segment and Geographic Information of Notes to Consolidated Financial Statements in this Form 10-K, which information is incorporated herein by reference.
Competition
We compete with a number of companies whose offerings address one or more specific functional areas covered by our solutions. In our IIoT business, we compete with large established companies such as Amazon, IBM, Oracle, SAP, Siemens AG, and Software AG as well as customers’ homegrown solutions. There are also a number of smaller companies that compete in the market for IIoT products. For enterprise CAD and PLM solutions, we compete with large established companies including Autodesk, Dassault Systèmes SA, and Siemens AG. For our PLM solutions, we also compete with Oracle and SAP, but we believe our products are more specifically targeted toward the business process challenges of manufacturing companies and offer broader and deeper functionality for those processes than ERP-based solutions. For our AR products, our primary competitors include TeamViewer, ScopeAR and Re’Flekt. Although Microsoft is a partner (especially in IoT), it is a competitor in AR; the competing products are Microsoft Dynamics 365 Remote Assist and Dynamics 365 Guides.
Proprietary Rights
Our software products and related technical know-how, along with our trademarks, including our company names, product names and logos, are proprietary. We protect our intellectual property rights in these items by relying on copyrights, trademarks, patents and common law safeguards, including trade secret protection. The nature and extent of such legal protection depends in part on the type of intellectual property right and the relevant jurisdiction. In the U.S., we are generally able to maintain our trademark registrations for as long as the trademarks are in use and to maintain our patents for up to 20 years from the earliest effective filing date. We also use license management and other anti-piracy
technology measures, as well as contractual restrictions, to curtail the unauthorized use and distribution of our products.
Our proprietary rights are subject to risks and uncertainties described under Item 1A. “Risk Factors” below, which is incorporated into this section by reference.
People and Culture
PTC’s commitment to building a diverse, equitable, and inclusive culture is fundamental to our purpose – the Power to Create, and critical to every aspect of our talent strategy. Our approach is focused on sustainable talent practices and core values that promote an agile culture, an increased sense of belonging, engaged work environments, and high-performing teams.

PTC at-a-Glance
As of September 30, 2021, PTC had 6,709 employees. Our population is geographically diverse and serves a geographically diverse customer and partner network.
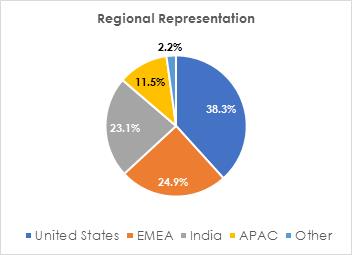
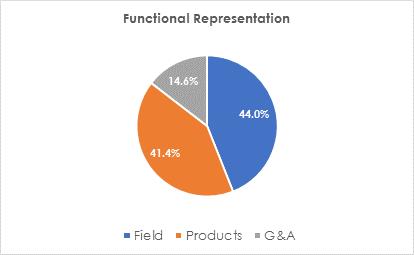
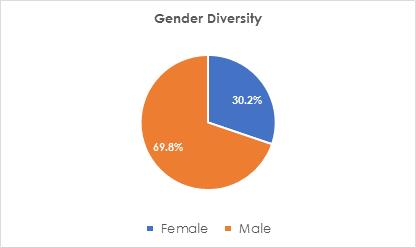
Commitment to Diversity and Inclusion
We have been improving our systems and processes to enable us to better track, manage and develop our employees. With these improvements, we aim to better understand our demographic population and to develop demographic goals we can share.
Commitment to our values and diversity in our workforce has inspired our top-line company goals. They include a focus on increasing under-represented minority and gender representation in global leadership as a first and essential step to diversifying our employee population. In addition to hiring our first Chief Diversity & CSR Officer in 2020, we are building an extended team to support our diversity and inclusion initiatives. Key milestones include establishing a global employee DEI Champion network, launching leadership development experiences for our underrepresented minority and underrepresented group populations, designing training programs in psychological safety, inclusive leadership, and conscious inclusion, and enhancing our Employee Resource Group program.
Employee Health & Safety | COVID-19 Response
Throughout the COVID-19 crisis, PTC focused on protecting the safety and well-being of our employees and supported our local communities. PTC moved to fully remote work in March 2020. Employees may continue to work remotely until 2022. PTC will then move to a hybrid flex model with a blend of in-office and remote work.
Workforce Planning & Long-Range Plan
We believe that the transition of industrial software to SaaS is inevitable and is accelerating. To better position us to be a leader in this SaaS evolution by aligning our internal processes and resources with SaaS operating best practices, in November 2021, we committed to a plan to reorganize our workforce and consolidate select facilities. While this restructuring will result in a number of employee reductions to create operating efficiencies, it will enable us to invest in roles that will further our journey to SaaS. We expect we will continue to recruit and hire many new employees in FY’22, particularly in SaaS sales and engineering roles. For those employees adversely impacted by this realignment, we are providing separation packages and outplacement support to help make the transition as smooth as possible. It is never easy to reduce employee resources and we’re focused on supporting and treating all impacted employees with dignity and respect.
Website Access to Reports and Code of Business Conduct and Ethics
We make available free of charge on our website at www.ptc.com the following reports as soon as reasonably practicable after electronically filing them with, or furnishing them to, the SEC: our Annual Reports on Form 10-K; our Quarterly Reports on Form 10-Q; our Current Reports on Form 8-K; and amendments to those reports filed or furnished pursuant to Sections 13(a) or 15(d) of the Securities Exchange Act of 1934. Our Proxy Statements for our Annual Meetings and Section 16 trading reports on SEC Forms 3, 4 and 5 also are available on our website. The reference to our website is not intended to incorporate information on our website into this Annual Report by reference.
Our Code of Ethics for Senior Executive Officers is embedded in our Code of Business Conduct and Ethics, which is also available on our website. Additional information about this code and amendments and waivers thereto can be found below in Part III, Item 10 of this Annual Report.
Executive Officers
Information about our executive officers is incorporated by reference from our 2022 Proxy Statement.
Corporate Information
PTC was incorporated in Massachusetts in 1985 and is headquartered in Boston, Massachusetts.
Item 1A. Risk Factors
| --- | --- |
The following are important factors we have identified that could affect our future results and your investment in our securities. You should consider them carefully when evaluating an investment in PTC securities or any forward-looking statements made by us, including those contained in this Annual Report, because these factors could cause actual results to differ materially from historical results or the performance projected in forward-looking statements. The risks described below are not the only risks we face. Additional risks and uncertainties not currently known to us or that we currently deem to be immaterial may also materially adversely affect our business, financial condition and/or operating results.
I.Risks Related to Our Business Operations and Industry
We face significant competition, which may reduce our profitability and limit or reduce our market share.
The markets for our products and solutions are rapidly changing and characterized by intense competition, disruptive technology developments, evolving distribution models and increasingly lower barriers to entry. If we are unable to provide products and solutions that address customers’ needs as well as our competitors’ products and solutions do, or to align our pricing, licensing and delivery models with customer preferences, we could lose customers and/or fail to attract new customers, which could cause us to lose revenue and market share.
For example, the COVID-19 pandemic has caused companies worldwide to close their offices and their employees to have to work remotely from their homes, which has focused companies on the need for solutions that empower and support remote work by employees. We believe customers and potential customers will increasingly seek software solutions that support remote work by employees. Although many of our solutions support remote work, others are less efficient at doing so. We have embarked on an effort to make our solutions available on a SaaS platform; however, this will require significant effort and investment and we cannot be sure that we will be able to make our solutions available as SaaS solutions as quickly as we expect or that customers will adopt them as we expect. If we are unable to compete successfully with competitors offering SaaS solutions, we could lose customers and/or fail to attract new customers, which could cause us to lose revenue and market share, which would adversely affect our business and financial results.
In addition, competitive pressures could cause us to reduce our prices, which could reduce our revenue and margins.
Finally, our current and potential competitors range from large and well-established companies to emerging start-ups. Some of our competitors and potential competitors have greater name recognition in the markets we serve and greater financial, technical, sales and marketing, and other resources, which could limit our ability to gain customer recognition and confidence in our products and solutions and successfully sell our products and solutions, which could adversely affect our ability to grow our business.
A breach of security in our products or computer systems, or those of our third-party service providers, could compromise the integrity of our products, cause loss of data, harm our reputation, create additional liability and adversely impact our financial results.
We have implemented and continue to implement measures intended to maintain the security and integrity of our products, source code and IT systems. The potential for a security breach or system disruption has significantly increased over time as the scope, number, intensity and sophistication of attempted cyberattacks and cyber intrusions have increased. We face cyberattacks and intrusions designed to access and exfiltrate information and to disrupt and lock-up access to systems for the purpose of demanding a ransom payment. Despite efforts to create security barriers to such threats, it is impossible for us to eliminate the risk of a successful cyberattack or intrusion, and, in fact, we deal with security issues on a regular basis and have experienced security incidents from time to time. Accordingly, there is a risk that a cyberattack or intrusion will be successful and that such event will be material.
In addition, we offer cloud services to our customers and some of our products, including our SaaS products, are hosted by third-party service providers, which expose us to additional risks as those repositories of our customers’ proprietary data may be targeted and a cyberattack or intrusion may be
successful and material. Interception of data transmission, misappropriation or modification of data, corruption of data and attacks against our service providers may adversely affect our products or product and service delivery. Malicious code, viruses or vulnerabilities that are undetected by our service providers may disrupt our business operations generally and may have a disproportionate effect on those of our products that are developed and delivered in the cloud environment.
While we devote resources to maintaining the security and integrity of our products and systems, as well as performing due diligence of our third-party service providers, a significant breach of the security and/or integrity of our products or systems, or those of our third-party service providers, could prevent our products from functioning properly, could enable access to sensitive, proprietary or confidential information, including that of our customers, or could disrupt our business operations or those of our customers. This could require us to incur significant costs of investigation, remediation and/or payment of a ransom; harm our reputation; cause customers to stop buying our products; and cause us to face lawsuits and potential liability, which could have a material adverse effect on our financial condition and results of operations.
We increasingly rely on third-party providers of cloud infrastructure services to deliver our offerings to users on our platform, and any disruption of or interference with our use of these services could adversely affect our business.
Our continued growth depends in part on the ability of our existing and potential customers to use and access our cloud services or our website in order to download our software or encrypted access keys for our software within an acceptable amount of time. We use a number of third-party service providers, which we do not control, for key components of our infrastructure, particularly with respect to development and delivery of our cloud-based products. The use of these service providers gives us greater flexibility in efficiently delivering a more tailored, scalable customer experience, but also exposes us to additional risks and vulnerabilities. Third-party service providers operate their own platforms that we access, and we are, therefore, vulnerable to their service interruptions. We may experience interruptions, delays and outages in service and availability from time to time as a result of problems with our third-party service providers’ infrastructure. Lack of availability of this infrastructure could be due to a number of potential causes including technical failures, natural disasters, fraud or security attacks that we cannot predict or prevent. Such outages could lead to the triggering of our service level agreements and the issuance of credits to our cloud-based product customers, which may impact our business and consolidated financial statements.
If we are unable to renew our agreements with our cloud service providers on commercially reasonable terms, or our agreement is prematurely terminated, or we need to add new cloud services providers to increase capacity and uptime, we could experience interruptions, downtime, delays, and additional expenses related to transferring to and providing support for these new platforms. Any of the above circumstances or events may harm our reputation and brand, reduce the availability or usage of our platforms and impair our ability to attract new users, any of which could adversely affect our business, financial condition and results of operations.
We may be unable to hire or retain personnel with the necessary skills to operate and grow our business, which could adversely affect our ability to compete.
Our success depends upon our ability to attract and retain highly skilled managerial, sales and marketing, technical, financial and administrative personnel to operate and grow our business. Competition for such personnel in our industry is intense, particularly in the Boston, Massachusetts area where our global headquarters is located.
The technical personnel required to develop our products and solutions are in high demand, particularly technical personnel with augmented and virtual reality and analytics expertise as there are comparatively fewer persons with those skills. If we are unable to attract and retain technical personnel with the requisite skills, our product and solution development efforts could be delayed, which could adversely affect our ability to compete and thereby adversely affect our revenues and profitability.
The managerial, sales and marketing, financial and administrative personnel necessary to guide our operations, market and sell our solutions and support our business operations are also in high demand due to the intense competition in our industry.
If we are unable to attract and retain the personnel we need to develop compelling products and solutions, and guide, operate and support our business, we may be unable to successfully compete in the marketplace, which would adversely affect our revenues and profitability.
The extent to which the COVID-19 pandemic may impact our business is uncertain and it could materially adversely affect our financial condition and results of operations.
The COVID-19 pandemic continues to impact global economic activity and create macroeconomic uncertainty. Public and private sector policies and initiatives to reduce the transmission of COVID-19, such as the imposition of travel restrictions, temporary closures of businesses, and the adoption of remote working, have significantly changed the way we and our customers work. The effects and duration of this disruption remain uncertain.
While PTC was able to transition to remote working without significant disruption to our day-to-day operations, disruption to our customers’ and our prospects’ operations and the way we work with them have adversely affected our business.
Demand for our solutions declined and could decline further due to challenges associated with conducting in-person sales meetings and project scoping and implementation activities while social distancing measures are in place, which has deterred or prevented, and could further deter or prevent, customers from proceeding with new software purchases and deployments. Likewise, temporary plant closures, layoffs and furloughs at our customers and the challenges they face forecasting business needs in this time of global economic uncertainty have caused, and could continue to cause, our customers to delay or reduce new license purchases.
Longer term plant closures and layoffs among our customer base could cause existing subscription customers to renew fewer existing licenses when their subscriptions come up for renewal and could cause existing support customers to discontinue support at the time of renewal. If churn increases in the future, our ARR and financial results and condition could be negatively impacted.
Reductions in new subscription sales and/or renewals and in professional services delivered could reduce our ARR growth or cause our ARR to decline, and would reduce our professional services revenue, all of which would adversely affect our revenue, earnings and cash flow. Further prolonged disruption could continue to negatively impact the businesses of our customers and prospective customers and, therefore, our business and financial condition.
If our business declines due to the factors above, we could be required to reduce our expenses, which could result in material restructuring charges and/or reduce or delay investments in our business, including hiring. Reductions in our workforce and/or investments in our business could hamper our ability to recover and compete successfully, which could adversely affect our business and results of operations.
We depend on sales within the discrete manufacturing sector and our business could be adversely affected if manufacturing activity does not grow, or if it contracts, or if manufacturers are adversely affected by other economic factors.
A large amount of our sales are to customers in the discrete manufacturing sector. Manufacturers worldwide are facing increasing uncertainty about the global economic climate due to, among other factors, the COVID-19 pandemic and the geopolitical environment. In addition, within the technology industry the U.S. Administration’s focus on technology transactions with non-U.S. entities and potential expanded prohibitions has created additional uncertainty. In light of these concerns, customers may delay, reduce or forego purchases of our solutions, which would adversely affect our business and financial results.
If we fail to successfully manage our transition to a SaaS company, our business and financial results could be adversely affected.
Becoming a SaaS company requires considerable additional investment in our organization. Whether our transition will be successful and will accomplish our business and financial objectives is subject to uncertainties, including but not limited to: customer demand, attach and renewal rates, channel adoption, our ability to further develop and scale infrastructure, our ability to include functionality and usability in such offerings that address customer requirements, and our costs. If we are unable to successfully establish these new offerings and navigate our business transition due to these risks and uncertainties, our business and financial results could be adversely impacted.
Because our sales and operations are globally dispersed, we face additional compliance risks and any compliance failure could adversely affect our business and financial results.
We sell and deliver software and services, and maintain support operations, in many countries whose laws and practices differ from one another and are subject to unexpected changes. Managing these geographically dispersed operations requires significant attention and resources to ensure compliance with laws of those countries and those of the U.S. governing our activities in non-U.S. countries.
Those laws include, but are not limited to, anti-corruption laws and regulations (including the U.S. Foreign Corrupt Practices Act (FCPA) and the U.K. Bribery Act 2010), data privacy laws and regulations (including the European Union's General Data Privacy Regulation), and trade and economic sanctions laws and regulations (including laws administered by the U.S. Department of the Treasury’s Office of Foreign Assets Control, the U.S. State Department, the U.S. Department of Commerce, the United Nations Security Council and other relevant sanctions authorities). Our compliance risks are heightened due to the go-to-market approach for our business that relies heavily on a partner ecosystem, the fact that we operate in, and are expanding into, countries with a higher incidence of corruption and fraudulent business practices than others, the fact that we deal with governments and state-owned business enterprises, and the fact that global enforcement of laws has significantly increased.
Accordingly, while we strive to maintain a comprehensive compliance program, we cannot guarantee that an employee, agent or business partner will not act in violation of our policies or U.S. or other applicable laws or that we may inadvertently violate such laws. Investigations of alleged violations of those laws can be expensive and disruptive. Violations of such laws can lead to civil and/or criminal prosecutions, substantial fines and other sanctions, including the revocation of our rights to continue certain operations, and also cause business and reputation loss, which could adversely affect our financial results and/or stock price.
II.Risks Related to Acquisitions and Strategic Relationships
Businesses we acquire may not generate the revenue and earnings we anticipate and may otherwise adversely affect our business.
We have acquired, and intend to continue to acquire, new businesses and technologies. If we fail to successfully integrate and manage the businesses and technologies we acquire, if an acquisition does not further our business strategy as we expect, or if a business we acquire has unexpected legal or financial liabilities, our operating results will be adversely affected.
The types of issues that we may face in integrating and operating the acquired business include:
| • | difficulties managing an acquired company’s technologies or lines of business or entering new markets where we have limited or no prior experience or where competitors may have stronger market positions; |
|---|
| • | unanticipated operating difficulties in connection with the acquired entities, including potential declines in revenue of the acquired entity; |
|---|
| • | diversion of management and employee attention; |
|---|
| • | loss of key personnel; and |
|---|
| • | potential incompatibility of business cultures. |
|---|
Further, if we do not achieve the expected return on our investments it could impair the intangible assets and goodwill that we recorded as part of an acquisition, which could require us to record a reduction to the value of those assets.
We may incur significant debt or issue a material amount of debt or equity securities to finance an acquisition, which could adversely affect our operating flexibility and financial statements.
If we were to incur a significant amount of debt—whether by borrowing funds or issuing new debt securities—to finance an acquisition, our interest expense, debt service requirements and leverage would increase significantly. The increases in these expenses and in our leverage could adversely impact our ability to operate the company as we might otherwise and to borrow additional amounts.
If we were to issue a significant amount of equity securities in connection with an acquisition, existing stockholders would be diluted and earnings per share could decrease.
Our inability to maintain or develop our strategic and technology relationships could adversely affect our business.
We have many strategic and technology relationships with other companies with which we work to offer complementary solutions and services, that market and sell our solutions, and that provide technologies that we embed in our solutions. We may not realize the expected benefits from these relationships and such relationships may be terminated by the other party. If these companies fail to perform or if a company terminates or substantially alters the terms of the relationship, we could suffer delays in product development, reduced sales or other operational difficulties and our business, results of operations and financial condition could be materially adversely affected.
III.Risks Related to Our Intellectual Property
We may be unable to adequately protect our proprietary rights, which could adversely affect our business and our ability to compete effectively.
Our software products are proprietary. We protect our intellectual property rights in these items by relying on copyrights, trademarks, patents and common law safeguards, including trade secret protection, as well as restrictions on disclosures and transferability contained in our agreements with other parties. Despite these measures, the laws of all relevant jurisdictions may not afford adequate protection to our products and other intellectual property. In addition, we frequently encounter attempts by individuals and companies to pirate our software. If our measures to protect our intellectual property rights fail, others may be able to use those rights, which could reduce our competitiveness and revenues.
In addition, any legal action to protect our intellectual property rights that we may bring or be engaged in could be costly, may distract management from day-to-day operations and may lead to additional claims against us, and we may not succeed, all of which would materially adversely affect our operating results.
Intellectual property infringement claims could be asserted against us, which could be expensive to defend and could result in limitations on our use of the claimed intellectual property.
The software industry is characterized by frequent litigation regarding copyright, patent and other intellectual property rights. If a lawsuit of this type is filed, it could result in significant expense to us and divert the efforts of our technical and management personnel. We cannot be sure that we would prevail against any such asserted claims. If we did not prevail, we could be prevented from using the claimed intellectual property or be required to enter into royalty or licensing agreements, which might not be available on terms acceptable to us. In addition to possible claims with respect to our proprietary products, some of our products contain technology developed by and licensed from third parties and we may likewise be susceptible to infringement claims with respect to these third-party technologies.
**IV.**Risks Related to Our Indebtedness
Our substantial indebtedness could adversely affect our business, financial condition and results of operations, as well as our ability to meet our payment obligations under our debt.
We have a significant amount of indebtedness. As of November 19, 2021, our total debt outstanding was approximately $1,450 billion, $1 billion of which was associated with the 3.625% Senior Notes and 4.000% Senior Notes (together, “Senior Notes”) issued February 2020, which mature in February 2025 and 2028, respectively, and are unsecured, and $450 million of which was borrowed under our credit facility, which matures in February 2025. All amounts outstanding under the credit facility and the Senior Notes will be due and payable in full on their respective maturity dates. As of November 19, 2021, we had unused commitments under our credit facility of $550 million. PTC Inc. and one of our foreign subsidiaries are eligible borrowers under the credit facility and certain other foreign subsidiaries may become borrowers under our credit facility in the future, subject to certain conditions.
Specifically, our level of debt could:
| • | make it more difficult for us to satisfy our debt obligations and other ongoing business obligations, which may result in defaults; |
|---|
| • | result in an event of default if we fail to comply with the financial and other covenants contained in the agreements governing our debt instruments, which could result in all of our debt becoming immediately due and payable or require us to negotiate an amendment to financial or other covenants that could cause us to incur additional fees and expenses; |
|---|
| • | limit our ability to obtain additional financing to fund future working capital, capital expenditures, acquisitions or other general corporate requirements; |
|---|
| • | reduce the availability of our cash to fund working capital, capital expenditures, acquisitions and other general corporate purposes and limit our ability to obtain additional financing for these purposes; |
|---|
| • | increase our vulnerability to the impact of adverse economic and industry conditions; |
|---|
| • | expose us to the risk of increased interest rates as certain of our borrowings, including borrowings under the credit facility, are at variable rates of interest; |
|---|
| • | limit our flexibility in planning for, or reacting to, and increasing our vulnerability to, changes in our business, the industries in which we operate, and the overall economy; |
|---|
| • | place us at a competitive disadvantage compared to other, less leveraged competitors; and |
|---|
| • | increase our cost of borrowing. |
|---|
Any of the above-listed factors could have an adverse effect on our business, financial condition and results of operations and our ability to meet our payment obligations under our debt agreements.
Despite our current level of indebtedness, we and our subsidiaries may still be able to incur substantially more debt and other obligations. This could further exacerbate the risks to our financial condition described above.
We and our subsidiaries may be able to incur significant additional indebtedness and other obligations in the future, including secured debt. Although the credit agreement governing our credit facility contains restrictions on the incurrence of additional indebtedness, these restrictions are subject to a number of qualifications and exceptions. The additional indebtedness incurred in compliance with these restrictions could be substantial. In addition, the credit agreement and the indenture governing the Senior Notes will not prevent us from incurring obligations that do not constitute indebtedness. If new debt is added to our current debt levels, or we incur other obligations, the related risks that we now face could intensify.
We may not be able to generate enough cash to service all our indebtedness and may be forced to take other actions to satisfy our obligations under our indebtedness, which may not be successful.
Our ability to make scheduled payments on or refinance our debt obligations depends on our financial condition and operating performance, which are subject to prevailing economic and competitive conditions and to certain financial, business, legislative, regulatory and other factors, some of which are beyond our control. We may be unable to maintain a level of cash flows from operating activities sufficient to permit us to pay the principal, premium, if any, and interest on our indebtedness.
If our cash flows and capital resources are insufficient to fund our debt service obligations, we could face substantial liquidity problems and could be forced to reduce or delay investments and capital expenditures or to dispose of material assets or operations, seek additional debt or equity capital or restructure or refinance our indebtedness. We may not be able to effect any such alternative measures, if necessary, on commercially reasonable terms or at all and, even if successful, those alternative actions may not allow us to meet our scheduled debt service obligations. Our debt agreements restrict our ability to dispose of assets and use the proceeds from those dispositions and may also restrict our ability to raise debt or equity capital to be used to repay other indebtedness when it becomes due. We may not be able to consummate those dispositions or to obtain proceeds in an amount sufficient to meet any debt service obligations then due.
Our inability to generate sufficient cash flows to satisfy our debt obligations, or to refinance our indebtedness on commercially reasonable terms or at all, would materially and adversely affect our financial position and results of operations and our ability to satisfy our debt obligations.
If we cannot make scheduled payments on our debt, we will be in default and the lenders under our credit facility could terminate their commitments to loan money, the lenders could foreclose against the assets securing their borrowings, the holders of our Senior Notes could declare all outstanding principal, premium, if any, and interest to be due and payable, and we could be forced into bankruptcy or liquidation. These events could result in a loss of your investment.
We are required to comply with certain financial and operating covenants under our debt agreements. Any failure to comply with those covenants could cause amounts borrowed to become immediately due and payable and/or prevent us from borrowing under the credit facility.
We are required to comply with specified financial and operating covenants under our debt agreements and to make payments under our debt, which limit our ability to operate our business as we otherwise might operate it. Our failure to comply with any of these covenants or to meet any debt payment obligations could result in an event of default which, if not cured or waived, would result in any amounts outstanding, including any accrued interest and/or unpaid fees, becoming immediately due and payable. We might not have enough working capital or liquidity to satisfy any repayment obligations if those obligations were accelerated. In addition, if we are not in compliance with the financial and operating covenants under the credit facility when we wish to borrow funds, we will be unable to borrow funds.
In addition, the financial and operating covenants under the credit facility may limit our ability to borrow funds, including for strategic acquisitions and share repurchases.
Our credit facility has variable interest tied to LIBOR and we could become subject to higher interest rates if the replacement rate we agree on with our banks is higher.
Borrowings under our revolving credit facility use the London Interbank Offering Rate (LIBOR) as a benchmark for establishing the interest rate. On March 5, 2021, the Intercontinental Exchange Benchmark Administration, the U.K. Financial Conduct Authority (FCA) regulated and authorized administrator of LIBOR, announced, and the FCA confirmed, that one week and two-month USD LIBOR settings will cease on December 31, 2021, and that the USD LIBOR panel for all other tenors will cease on June 30, 2023.
The credit facility provides a mechanism pursuant to which we and the administrative agent may agree, under certain circumstances, to transition to an alternate base rate borrowing or amend the
credit facility to establish an alternate interest rate to LIBOR that includes consideration of the then-prevailing market convention for determining interest rates for syndicated loans in the United States at that time.
Although we believe the alternative rates will not materially increase the rates on our credit facility, the final agreed rate may increase the cost of our variable rate indebtedness.
V.Risks Related to Our Common Stock and Common Stock of Public Companies We Own
Our operating results fluctuate from quarter to quarter, making future operating results difficult to predict; failure to meet market expectations could cause the price of our securities to decline.
Our quarterly operating results historically have fluctuated and are likely to continue to fluctuate depending on many factors, including:
| • | variability in our contracts, including timing of start dates, length of contracts, and mix of on-premises and cloud-based purchases, which would impact our revenue and earnings; |
|---|
| • | a high percentage of our orders historically have been generated in the third month of each fiscal quarter and any failure to receive, complete or process orders at the end of any quarter could cause us to fall short of our financial targets; |
|---|
| • | our adoption of Accounting Standards Update 2014-09, Revenue from Contracts with Customers: Topic 606 in 2019 creates significant revenue volatility; |
|---|
| • | a significant percentage of our orders comes from transactions with large customers, which tend to have long lead times that are less predictable; |
|---|
| • | because our operating expenses are largely fixed in the short term and are based on expected revenues, any failure to achieve our revenue targets could cause us to miss our earnings targets; |
|---|
| • | because a significant portion of our revenue and expenses are generated from outside the U.S., shifts in foreign currency exchange rates could adversely affect our reported results; and |
|---|
| • | we may incur significant expenses in a quarter in connection with corporate development initiatives, restructuring efforts or the investigation, defense or settlement of legal actions that would increase our operating expenses and reduce our earnings for the quarter in which those expenses are incurred. |
|---|
Accordingly, our quarterly results are difficult to predict prior to the end of the quarter and we may be unable to confirm or adjust expectations with respect to our operating results for a quarter until that quarter has closed. Any failure to meet our quarterly revenue or earnings expectations could adversely impact the market price of our securities.
Our stock price has been volatile, which may make it harder to resell shares at a favorable time and price.
Market prices for securities of software companies are generally volatile and are subject to significant fluctuations that may be unrelated or disproportionate to the operating performance of these companies. Further, our stock price has been more volatile than that of other software companies. Accordingly, the trading prices and valuations of software companies’ stocks, and of ours, may not be predictable. Negative changes in the public’s perception of the prospects of software companies, or of PTC or the markets we serve, could depress our stock price regardless of our operating results.
Also, a large percentage of our common stock is held by institutional investors and by Rockwell Automation. Purchases and sales of our common stock by these investors could have a significant impact on the market price of the stock. For more information about those investors, please see our proxy statement with respect to our most recent annual meeting of stockholders and Schedules 13D and 13G filed with the SEC with respect to our common stock.
From time to time, we may acquire common stock in publicly traded companies as strategic investments. Owning such stock exposes us to the volatility, liquidity and other risks inherent in holding that stock.
From time to time, we may own common stock of publicly traded companies. We are required to present the value of such stock on our Consolidated Balance Sheet at their fair value at the end of each reporting period. The fair value of those shares may fluctuate due to the volatility of the stock market, changes in general economic conditions, and the performance of these publicly traded companies. We recognize all changes in the fair value of the owned shares (whether realized or unrealized) as gains or losses in our Consolidated Statement of Operations. Accordingly, changes in the fair value of the owned shares can materially impact the earnings we report, which introduces volatility in our earnings that is not associated with the results of our business operations. In particular, significant declines in the fair value of the owned shares would produce significant declines in our reported earnings.
The reported value of the owned shares does not necessarily reflect their lowest current market price. If we were forced to sell some or all of the owned shares in the market, there can be no assurance that we would be able to sell them at prices equivalent to the value that we have reported on our Consolidated Balance Sheet, and we may be forced to sell them at significantly lower prices.
VI.Risks Related to Our Senior Notes
Our Senior Notes are unsecured and do not limit our ability to incur indebtedness, which could reduce any payments to holders of the Senior Notes in connection with any insolvency, liquidation, reorganization, dissolution or other winding up of PTC.
Unlike the credit facility, which is secured, the Senior Notes are not secured. Although the indenture governing the Senior Notes limits our ability to incur secured debt, the covenant is subject to significant exceptions, and we may incur additional secured debt in the future. The effect of this subordination is that upon a default in payment on, or the acceleration of, any of our secured indebtedness, or in the event of bankruptcy, insolvency, liquidation, dissolution or reorganization of our company (collectively, “Adverse Events”), the proceeds from the sale of assets securing our secured indebtedness will be available to pay obligations on the Senior Notes only after all indebtedness under the credit facility and any other secured debt has been paid in full. As a result, the holders of the Senior Notes may receive less, ratably, than the holders of secured debt if an Adverse Event occurs.
In addition, the indenture governing the Senior Notes does not limit our ability to incur unsecured indebtedness. If we incur any additional indebtedness that ranks equally with the Senior Notes, subject to collateral arrangements, the holders of that debt will be entitled to share ratably with holders of the Senior Notes in any proceeds distributed in connection with any of the Adverse Events described above. This may reduce the amount of proceeds to holders of the Senior Notes.
Our Senior Notes are not guaranteed by any of our subsidiaries, which could adversely affect our ability to pay interest on or redeem the Senior Notes when due.
We conduct a substantial portion of our operations through our subsidiaries, none of which currently guarantees the Senior Notes. Accordingly, payment of interest on the Senior Notes and redemption of the Senior Notes is dependent on the generation of cash flow by our subsidiaries and their ability to make such cash available to us, by dividend, debt repayment or otherwise. Unless they become guarantors of the Senior Notes, our subsidiaries do not have any obligation to pay amounts due on the Senior Notes or to make funds available for that purpose. Our subsidiaries may not be able to, or may not be permitted to, make distributions to enable us to make payments in respect of the Senior Notes. Each subsidiary is a distinct legal entity, and, under certain circumstances, legal and contractual restrictions may limit our
ability to obtain cash from our subsidiaries. If we do not receive distributions from our subsidiaries, we may be unable to make required payments of principal, premium, if any, and interest on the Senior Notes.
Our Senior Notes are not listed on any national securities exchange or included in any automated quotation system, which could make it harder to resell the notes at a favorable time and price.
Our Senior Notes are not listed on any national securities exchange or included in any automated quotation system. As a result, an active market for the notes may not exist or be maintained, which would adversely affect the market price and liquidity of the notes. In that case, holders may not be able to sell their notes when they want to or at a favorable price.
The market for non-investment grade debt historically has been subject to severe disruptions that have caused substantial volatility in the prices of securities similar to the notes. The market, if any, for the notes may experience similar disruptions and any such disruptions may adversely affect the liquidity in that market or the prices at which the notes may be sold.
VII.General Risk Factors
Our international businesses present economic and operating risks, which could adversely affect our business and financial results.
We expect that our international operations will continue to expand and to account for a significant portion of our total revenue. Because we transact business in various foreign currencies, the volatility of foreign exchange rates has had and may in the future have a material adverse effect on our revenue, expenses and operating results.
Other risks inherent in our international operations include, but are not limited to, the following:
| • | difficulties in staffing and managing foreign sales and development operations; |
|---|
| • | possible future limitations upon foreign-owned businesses; |
|---|
| • | increased financial accounting and reporting burdens and complexities; |
|---|
| • | inadequate local infrastructure; and |
|---|
| • | greater difficulty in protecting our intellectual property. |
|---|
We may have exposure to additional tax liabilities and our effective tax rate may increase or fluctuate, which could increase our income tax expense and reduce our net income.
As a multinational organization, we are subject to income taxes as well as non-income based taxes in the U.S. and in various foreign jurisdictions. Significant judgment is required in determining our worldwide income tax provision and other tax liabilities. In the ordinary course of a global business, there are many intercompany transactions and calculations where the ultimate tax determination is uncertain. Our tax returns are subject to review by various taxing authorities. Although we believe that our tax estimates are reasonable, the final determination of tax audits or tax disputes could be different from what is reflected in our historical income tax provisions and accruals.
Our effective tax rate can be adversely affected by several factors, many of which are outside of our control, including:
| • | changes in tax laws, regulations, and interpretations in multiple jurisdictions in which we operate; |
|---|
| • | assessments, and any related tax interest or penalties, by taxing authorities; |
|---|
| • | changes in the relative proportions of revenues and income before taxes in the various jurisdictions in which we operate that have differing statutory tax rates; |
|---|
| • | changes to the financial accounting rules for income taxes; |
|---|
| • | unanticipated changes in tax rates; and |
|---|
| • | changes to a valuation allowance on net deferred tax assets, if any. |
|---|
Item 1B. Unresolved Staff Comments
| --- | --- |
None.
Item 2. Properties
| --- | --- |
We currently have 86 office locations used in operations in the United States and internationally, predominately as sales and/or support offices and for research and development work. Of our total of approximately 1,270,000 square feet of leased facilities used in operations, approximately 527,000 square feet are located in the U.S., including 250,000 square feet at our headquarters facility located in Boston, Massachusetts, and approximately 260,000 square feet are located in India, where a significant amount of our research and development is conducted. In addition, approximately 210,000 feet are associated with facilities that have been restructured, primarily our previous headquarters facility in Needham, Massachusetts. We believe that our facilities are adequate for our present and foreseeable needs.
Item 3. Legal Proceedings
| --- | --- |
Information on legal proceedings can be found in Note 10. Commitments and Contingencies of Notes to Consolidated Financial Statements in this Form 10-K, which information is incorporated herein by reference.
Item 4. Mine Safety Disclosures
| --- | --- |
Not applicable.
PART II
Item 5. Market for Registrant’s Common Equity, Related Stockholder Matters and Issuer Purchases of Equity Securities
| --- | --- |
Our common stock is traded on the Nasdaq Global Select Market under the symbol "PTC."
On September 30, 2021, the close of our fiscal year, and on November 17, 2021, our common stock was held by 1,023 and 1,020 shareholders of record, respectively.
The table below shows the shares of our common stock we repurchased in the fourth quarter of 2021.
| Period | Total Number of Shares (or Units) Purchased | Average Price Paid per Share (or Unit) | Total Number of Shares (or Units) Purchased as Part of Publicly Announced Plans or Programs | Approximate Dollar Value of Shares (or Units) that May Yet Be Purchased Under the Plans or Programs(1) | ||||||||||||
|---|---|---|---|---|---|---|---|---|---|---|---|---|---|---|---|---|
| July 2021 | — | $ | — | — | $ | 1,000,000,000 | ||||||||||
| August 2021 | 225,909 | 132.80 | 225,909 | 970,000,047 | ||||||||||||
| September 2021 | — | — | — | 970,000,047 | ||||||||||||
| Total | 225,909 | $ | 132.80 | 225,909 | $ | 970,000,047 |
| (1) | On November 13, 2020, the Board of Directors authorized us to repurchase up to $1 billion of our common stock in the period November 13, 2020 through September 30, 2023. |
|---|
Item 6. [Reserved]
| --- | --- |
Item 7. Management’s Discussion and Analysis of Financial Condition and Results of Operations
| --- | --- |
Forward-Looking Statements
Statements in this Annual Report about anticipated financial results, capital developments and growth, as well as about the development of our products, markets and workforce, are forward-looking statements that are based on our current plans and assumptions. Important information about the bases for these plans and assumptions and factors that may cause our actual results to differ materially from these statements is contained below and in Item 1A. “Risk Factors” of this Annual Report.
Unless otherwise indicated, all references to a year reflect our fiscal year that ends on September 30.
Operating and Non-GAAP Financial Measures
Our discussion of results includes discussion of our ARR (Annual Run Rate) operating measure, non-GAAP financial measures, and disclosure of our results on a constant currency basis. ARR and our non-GAAP financial measures, including the reasons we use those measures, are described below in Results of Operations - Operating Measure and Results of Operations - Non-GAAP Financial Measures, respectively. The methodology used to calculate constant currency disclosures is described in Results of Operations - Impact of Foreign Currency Exchange on Results of Operations. You should read those sections to understand our operating measure, non-GAAP financial measures, and constant currency disclosures.
Executive Overview
ARR increased 16% (actual and constant currency) to $1,475 million in FY’21 compared to the end of FY’20. Excluding the impact of Arena, which was acquired in the second quarter of FY’21, our organic constant currency ARR growth was 12% in FY’21 compared to FY’20. Organic churn improved approximately 130 basis points year over year, primarily driven by strong execution in CAD, PLM, FSG and modest continued improvement in IoT and AR.
FY’21 revenue of $1.81 billion increased 24% over FY’20 (20% in constant currency). Our FY’21 revenue was positively impacted by ASC 606 as longer contract durations and support to subscription conversions increased the amount of upfront subscription license revenue recognized in the year. FY’21 operating margin of 21% increased approximately 700 basis points over FY’20 due to strong revenue performance as strong product differentiation improved sales and renewals, while maintaining good discipline on our operating expense structure. FY’21 diluted EPS more than doubled year over year to $4.03, due in part to a gain of $69 million related to common stock we own in a publicly-traded company, the release of a $137 million valuation allowance related to our deferred tax assets in the U.S., and a non-cash tax benefit of $42 million related to our Arena acquisition.
FY’21 operating cash flow of $369 million grew 58% over FY’20; FY’21 free cash flow of $344 million grew 61% over FY’20. Operating cash flow and free cash flow included an $18 million outflow related to a foreign tax dispute, $15 million of acquisition-related costs, and $15 million of restructuring payments. We ended FY’21 with cash and cash equivalents of $327 million. In addition, we held a $78 million equity investment in Matterport, Inc., currently subject to trading restrictions. We ended FY’21 with gross debt of $1.45 billion, with an aggregate interest rate of 3.2%.
Results of Operations
The following table shows the financial measures that we consider the most significant indicators of our business performance. In addition to providing operating income, operating margin, diluted earnings per share and cash from operations as calculated under GAAP, we provide non-GAAP operating income, non-GAAP operating margin, non-GAAP diluted earnings per share, and free cash flow for the reported periods. We also provide a view of our actual results on a constant currency basis. These non-GAAP financial measures exclude the items described in Non-GAAP Financial Measures below. Investors should use these non-GAAP financial measures only in conjunction with our GAAP results.
For discussion of FY’20 results and comparison with FY’19 results, refer to Management's Discussion and Analysis of Financial Conditions and Results of Operations in our Annual Report on Form 10-K for the fiscal year ended September 30, 2020.
| (Dollar amounts in millions, except per share data) | Year ended September 30, | Percent Change | ||||||||||||||
|---|---|---|---|---|---|---|---|---|---|---|---|---|---|---|---|---|
| 2021 | 2020 | Actual | Constant Currency(1) | |||||||||||||
| ARR | $ | 1,474.7 | $ | 1,270.0 | 16 | % | 16 | % | ||||||||
| Total recurring revenue | $ | 1,616.3 | $ | 1,281.9 | 26 | % | 22 | % | ||||||||
| Perpetual license | 33.0 | 32.7 | 1 | % | (1 | )% | ||||||||||
| Professional services | 157.8 | 143.8 | 10 | % | 5 | % | ||||||||||
| Total revenue | 1,807.2 | 1,458.4 | 24 | % | 20 | % | ||||||||||
| Total cost of revenue | 371.1 | 334.3 | 11 | % | 9 | % | ||||||||||
| Gross margin | 1,436.1 | 1,124.1 | 28 | % | 23 | % | ||||||||||
| Operating expenses | 1,055.3 | 913.2 | 16 | % | 14 | % | ||||||||||
| Operating income | $ | 380.7 | $ | 210.9 | 81 | % | 63 | % | ||||||||
| Non-GAAP operating income(1) | $ | 634.4 | $ | 423.4 | 50 | % | 42 | % | ||||||||
| Operating margin | 21.1 | % | 14.5 | % | ||||||||||||
| Non-GAAP operating margin(1) | 35.1 | % | 29.0 | % | ||||||||||||
| Diluted earnings per share | $ | 4.03 | $ | 1.12 | ||||||||||||
| Non-GAAP diluted earnings per share(1)(2) | $ | 3.97 | $ | 2.57 | ||||||||||||
| Cash flow from operations(3) | $ | 368.8 | $ | 233.8 | ||||||||||||
| Free cash flow(4) | $ | 344.1 | $ | 213.6 |
| (1) | See Non-GAAP Financial Measures below for a reconciliation of our GAAP results to our non-GAAP measures and Impact of Foreign Currency Exchange on Results of Operations below for a description of how we calculate our results on a constant currency basis. |
|---|
| (2) | In FY’21 and FY’20 our GAAP results included tax benefits of $179.7 million and $21.2 million, respectively. The FY’21 results include a $137.4 million benefit related to the release of the valuation allowance on the majority of our U.S. deferred tax assets and a $42.3 million benefit related to the release of a valuation allowance resulting from the Arena acquisition. The FY’20 results include a $21.2 million benefit related to the release of a valuation allowance resulting from the Onshape acquisition. As the non-GAAP tax provision is calculated assuming that there is no valuation allowance, these benefits have been excluded. Income tax adjustments reflect the tax effects of non-GAAP adjustments which are calculated by applying the applicable tax rate by jurisdiction to the non-GAAP adjustments listed above. Additionally, our non-GAAP results for FY'21 exclude tax expense of $34.8 million related to a non-U.S. prior period tax exposure, primarily related to foreign withholding taxes. |
|---|
| (3) | Cash flow from operations for FY’21 and FY’20 includes $14.5 million and $42 million of restructuring payments, respectively. Cash from operations for FY’21 and FY’20 includes $15.0 million and $9.6 million of acquisition-related payments, respectively. Cash from operations for FY’21 includes $17.9 million in un-forecasted payments related to the prior period tax exposure from a non-U.S. tax dispute. |
|---|
| (4) | Free cash flow is cash from operations net of capital expenditures of $24.7 million and $20.2 million in FY’21 and FY’20, respectively. |
|---|
Impact of Foreign Currenc
Showing the first 8K of 63K characters. Open the full section
Item 7A. Quantitative and Qualitative Disclosures about Market Risk
| --- | --- |
We face exposure to financial market risks, including adverse movements in foreign currency exchange rates and changes in interest rates. These exposures may change over time as business practices evolve and could have a material adverse impact on our financial results.
Foreign currency exchange risk
Our earnings and cash flows are subject to fluctuations due to changes in foreign currency exchange rates. Our most significant foreign currency exposures relate to Western European countries, Japan, Israel, China and Canada. We enter into foreign currency forward contracts to manage our exposure to fluctuations in foreign exchange rates that arise from receivables and payables denominated in foreign currencies. We do not enter into or hold foreign currency derivative financial instruments for trading or speculative purposes, nor do we enter into derivative financial instruments to hedge future cash flows or forecast transactions.
Our non-U.S. revenues generally are transacted through our non-U.S. subsidiaries and typically are denominated in their local currency. In addition, expenses that are incurred by our non-U.S. subsidiaries typically are denominated in their local currency. Approximately 60% of our revenue and 40% of our expenses were transacted in currencies other than the U.S. dollar. Currency translation affects our reported results because we report our results of operations in U.S. Dollars. Historically, our most significant currency risk has been changes in the Euro and Japanese Yen relative to the U.S. Dollar. Based on current revenue and expense levels (excluding restructuring charges and stock-based compensation), a $0.10 change in the USD to EUR exchange rate and a 10 Yen change in the Yen to USD exchange rate would impact operating income by approximately $28 million and $10 million, respectively.
Our exposure to foreign currency exchange rate fluctuations arises in part from intercompany transactions, with most intercompany transactions occurring between a U.S. dollar functional currency entity and a foreign currency denominated entity. Intercompany transactions typically are denominated in the local currency of the non-U.S. dollar functional currency subsidiary in order to centralize foreign currency risk. Also, both PTC (the parent company) and our non-U.S. subsidiaries may transact business with our customers and vendors in a currency other than their functional currency (transaction risk). In addition, we are exposed to foreign exchange rate fluctuations as the financial results and balances of our non-U.S. subsidiaries are translated into U.S. dollars (translation risk). If sales to customers outside of the United States increase, our exposure to fluctuations in foreign currency exchange rates will increase.
Our foreign currency risk management strategy is principally designed to mitigate the future potential financial impact of changes in the U.S. dollar value of balances denominated in foreign currency, resulting from changes in foreign currency exchange rates. Our foreign currency hedging program uses forward contracts to manage the foreign currency exposures that exist as part of our ongoing business operations. The contracts are primarily denominated in Japanese Yen and European currencies, and have maturities of less than three months.
Generally, we do not designate foreign currency forward contracts as hedges for accounting purposes, and changes in the fair value of these instruments are recognized immediately in earnings.
Because we enter into forward contracts only as an economic hedge, any gain or loss on the underlying foreign-denominated balance would be offset by the loss or gain on the forward contract. Gains and losses on forward contracts and foreign currency denominated receivables and payables are included in foreign currency net losses.
As of September 30, 2021 and 2020, we had outstanding forward contracts for derivatives not designated as hedging instruments with notional amounts equivalent to the following:
| September 30, | ||||||||
|---|---|---|---|---|---|---|---|---|
| Currency Hedged (in thousands) | 2021 | 2020 | ||||||
| Canadian / U.S. Dollar | $ | 4,894 | $ | 6,847 | ||||
| Euro / U.S. Dollar | 387,466 | 390,673 | ||||||
| British Pound / U.S. Dollar | 23,141 | 6,328 | ||||||
| Israeli Shekel / U.S. Dollar | 10,475 | 9,503 | ||||||
| Japanese Yen / U.S. Dollar | 46,450 | 50,379 | ||||||
| Swiss Franc / U.S. Dollar | 18,039 | 12,874 | ||||||
| Swedish Krona / U.S. Dollar | 34,196 | 18,871 | ||||||
| Singapore Dollar / U.S. Dollar | 3,498 | 3,281 | ||||||
| Chinese Renminbi / U.S. Dollar | 23,297 | 5,415 | ||||||
| New Taiwan Dollar / U.S. Dollar | 3,369 | 1,483 | ||||||
| Russian Ruble/ U.S. Dollar | 2,614 | 309 | ||||||
| All other | 6,482 | 6,499 | ||||||
| Total | $ | 563,921 | $ | 512,462 |
Debt
In addition to the $1 billion due under our 2025 and 2028 Senior Notes, as of September 30, 2021, we had $450 million outstanding under our credit facility. Loans under the credit facility bear interest at variable rates which reset every 30 to 180 days depending on the rate and period selected by us. These loans are subject to interest rate risk as interest rates will be adjusted at each rollover date to the extent such amounts are not repaid. As of September 30, 2021, the annual rate on the credit facility loans was 1.69%. If there were a hypothetical 100 basis point change in interest rates, the annual net impact to earnings and cash flows would be $4.5 million. This hypothetical change in cash flows and earnings has been calculated based on the borrowings outstanding at September 30, 2021 and a 100 basis point per annum change in interest rate applied over a one-year period.
Cash and cash equivalents
As of September 30, 2021, cash equivalents were invested in highly liquid investments with maturities of three months or less when purchased. We invest our cash with highly rated financial institutions in North America, Europe and Asia Pacific and in diversified domestic and international money market mutual funds. At September 30, 2021, we had cash and cash equivalents of $37 million in the United States, $111 million in Europe, $145 million in Asia Pacific (including India), and $34 million in other non-U.S. countries. Given the short maturities and investment grade quality of the portfolio holdings at September 30, 2021, a hypothetical 10% change in interest rates would not materially affect the fair value of our cash and cash equivalents.
Our invested cash is subject to interest rate fluctuations and, for non-U.S. operations, foreign currency risk. In a declining interest rate environment, we would experience a decrease in interest income. The opposite holds true in a rising interest rate environment. Over the past several years, the U.S. Federal Reserve Board, European Central Bank and Bank of England have changed certain benchmark interest rates, which has led to declines and increases in market interest rates. These changes in market interest rates have resulted in fluctuations in interest income earned on our cash and cash equivalents. Interest income will continue to fluctuate based on changes in market interest rates and levels of cash available for investment. Changes in foreign currencies relative to the U.S. dollar had an unfavorable impact of $0.1 million and $2.6 million on our consolidated cash balances in 2021 and 2019, respectively, in particular due to changes in the Euro and the Japanese Yen, and an immaterial impact in 2020.
Item 8. Financial Statements and Supplementary Data
| --- | --- |
The consolidated financial statements and notes to the consolidated financial statements are attached as APPENDIX A.
Item 9. Changes in and Disagreements with Accountants on Accounting and Financial Disclosure
| --- | --- |
None.
Item 9A. Controls and Procedures
| --- | --- |
Evaluation of Disclosure Controls and Procedures
Our management maintains disclosure controls and procedures as defined in Rules 13a-15(e) and 15d-15(e) under the Securities Exchange Act of 1934, as amended (the “Exchange Act”) that are designed to provide reasonable assurance that information required to be disclosed in our reports filed or submitted under the Exchange Act is processed, recorded, summarized and reported within the time periods specified in the SEC’s rules and forms, and that such information is accumulated and communicated to our management, including our Chief Executive Officer and Chief Financial Officer (our principal executive officer and principal financial officer, respectively), as appropriate, to allow for timely decisions regarding required disclosure.
As required by SEC Rule 15d-15(b), we carried out an evaluation, under the supervision and with the participation of management, including our principal executive and principal financial officers, of the effectiveness of the design and operation of our disclosure controls and procedures as of the end of the period covered by this Annual Report. Based on this evaluation, we concluded that our disclosure controls and procedures were effective at the reasonable assurance level as of September 30, 2021.
Management’s Annual Report on Internal Control over Financial Reporting
Our management is responsible for establishing and maintaining adequate internal control over financial reporting. Internal control over financial reporting is defined in Rules 13a-15(f) and 15d-15(f) of the Exchange Act as a process designed by, or under the supervision of, our principal executive and principal financial officers and effected by our board of directors, management and other personnel, to provide reasonable assurance regarding the reliability of financial reporting and the preparation of financial statements for external purposes in accordance with generally accepted accounting principles and includes those policies and procedures that:
| • | Pertain to the maintenance of records that in reasonable detail accurately and fairly reflect the transactions and dispositions of our assets; |
|---|
| • | Provide reasonable assurance that transactions are recorded as necessary to permit preparation of financial statements in accordance with generally accepted accounting principles, and that our receipts and expenditures are being made only in accordance with authorizations of our management and directors; and |
|---|
| • | Provide reasonable assurance regarding prevention or timely detection of unauthorized acquisition, use or disposition of our assets that could have a material effect on the financial statements. |
|---|
Because of its inherent limitations, internal control over financial reporting may not prevent or detect misstatements. Projections of any evaluation of effectiveness to future periods are subject to the risk that controls may become inadequate because of changes in conditions, or that the degree of compliance with the policies or procedures may deteriorate
Our management assessed the effectiveness of our internal control over financial reporting as of September 30, 2021 using the criteria set forth by the Committee of Sponsoring Organizations of the Treadway Commission (COSO) in Internal Control-Integrated Framework (2013). Based on this assessment
and those criteria, our management concluded that, as of September 30, 2021, our internal control over financial reporting was effective.
Management excluded Arena from our assessment of internal control over financial reporting as of September 30, 2021 because the Company acquired it in a business combination in 2021. Arena’s total assets and total revenues represent approximately 1% and 2%, respectively, of the Company’s total assets and total revenues, as of and for the year ended September 30, 2021.
The effectiveness of our internal control over financial reporting as of September 30, 2021 has been audited by PricewaterhouseCoopers LLP, an independent registered public accounting firm, as stated in their report, which appears under Item 8.
Change in Internal Control over Financial Reporting
There was no change in our internal control over financial reporting that occurred during the quarter ended September 30, 2021 that has materially affected, or is reasonably likely to materially affect, our internal control over financial reporting.
Item 9B. Other Information
| --- | --- |
None.
Item 9C. Disclosure Regarding Foreign Jurisdictions that Prevent Inspections
| --- | --- |
Not applicable.
PART III
Item 10. Directors, Executive Officers and Corporate Governance
| --- | --- |
The information required by this item with respect to our directors and executive officers may be found in the sections captioned “Proposal 1: Election of Directors,” “Corporate Governance,” "Our Executive Officers," and “Transactions with Related Persons” appearing in our 2022 Proxy Statement. Such information is incorporated into this Item 10 by reference.
Code of Ethics for Senior Executive Officers
We have adopted a Code of Ethics for Senior Executive Officers that applies to our Chief Executive Officer, President, Chief Financial Officer, and Controller, as well as others. The Code is embedded in our Code of Business Conduct and Ethics applicable to all employees. A copy of the Code of Business Conduct and Ethics is publicly available on our website at www.ptc.com. If we make any substantive amendments to, or grant any waiver from, including any implicit waiver, the Code of Ethics for Senior Executive Officers to or for our Chief Executive Officer, President, Chief Financial Officer or Controller, we will disclose the nature of such amendment or waiver in a current report on Form 8-K.
Item 11. Executive Compensation
| --- | --- |
Information with respect to director and executive compensation may be found under the headings “Director Compensation,” “Compensation Discussion and Analysis,” “Executive Compensation,” and “Compensation Committee Report” appearing in our 2022 Proxy Statement. Such information is incorporated herein by reference.
Item 12. Security Ownership of Certain Beneficial Owners and Management and Related Stockholder Matters
| --- | --- |
Information required by this item may be found under the heading “Information about PTC Common Stock Ownership” in our 2022 Proxy Statement. Such information is incorporated herein by reference.
EQUITY COMPENSATION PLAN INFORMATION
as of September 30, 2021
| Plan Category | Number of securities to be issued upon exercise of outstanding options, warrants and rights | Weighted-average exercise price of outstanding options, warrants and rights | Number of securities remaining available for future issuance under equity compensation plans | ||||||||||
|---|---|---|---|---|---|---|---|---|---|---|---|---|---|
| Equity compensation plans approved by security holders: | |||||||||||||
| 2000 Equity Incentive Plan(1) | 3,215,849 | — | (1) | 4,074,497 | |||||||||
| 2016 Employee Stock Purchase Plan(2) | — | — | 634,855 | (2) | |||||||||
| Total | 3,215,849 | — | 4,709,352 |
| (1) | All of the shares issuable upon vesting are restricted stock units, which have no exercise price. |
|---|
| (2) | This amount represents the total number of shares remaining available under the 2016 Employee Stock Purchase Plan, of which 110,363 shares are subject to purchase during the current offering period. |
|---|
Item 13. Certain Relationships and Related Transactions, and Director Independence
| --- | --- |
Information with respect to this item may be found under the headings “Independence of Our Directors,” “Review of Transactions with Related Persons” and “Transactions with Related Persons” in our 2022 Proxy Statement. Such information is incorporated herein by reference.
Item 14. Principal Accounting Fees and Services
| --- | --- |
Information with respect to this item may be found under the headings “Engagement of Independent Auditor and Approval of Professional Services and Fees” and “PricewaterhouseCoopers LLP Professional Services and Fees” in our 2022 Proxy Statement. Such information is incorporated herein by reference.
PART IV
Item 15. Exhibits and Financial Statement Schedules
| --- | --- |
(a) Documents Filed as Part of Form 10-K
| 1. | Financial Statements | |
| Report of Independent Registered Public Accounting Firm | F-1 | |
| Consolidated Balance Sheets as of September 30, 2021 and 2020 | F-4 | |
| Consolidated Statements of Operations for the years ended September 30, 2021, 2020 and 2019 | F-5 | |
| Consolidated Statements of Comprehensive Income (Loss) for the years ended September 30, 2021, 2020 and 2019 | F-6 | |
| Consolidated Statements of Cash Flows for the years ended September 30, 2021, 2020 and 2019 | F-7 | |
| Consolidated Statements of Stockholders’ Equity for the years ended September 30, 2021, 2020 and 2019 | F-8 | |
| Notes to Consolidated Financial Statements | F-9 | |
| 2. | Financial Statement Schedules | |
| Schedules have been omitted since they are either not required, not applicable, or the information is otherwise included in the Financial Statements per Item 15(a)1 above. | ||
| 3. | Exhibits | |
| The list of exhibits in the Exhibit Index is incorporated herein by reference. |
(b) Exhibits
We hereby file the exhibits listed in the attached Exhibit Index.
(c) Financial Statement Schedules
None.
Item 16. Form 10-K Summary
| --- | --- |
None.
EXHIBIT INDEX
| 10.5* | — | Form of Executive Agreement between the Company and Michael DiTullio (filed as Exhibit 10.1 to PTC’s Quarterly Report on Form 10-Q for the period ended March 28, 2020 (File. No. 0-18059) and incorporated herein by reference). |
|---|---|---|
| 10.6* | — | [Executive Agreement between the Company and Troy Richardson dated November 16, 2020 (filed as Exhibit 10.6 to PTC’s Annual Report on Form 10-K for the |
Showing the first 8K of 199K characters. Open the full section