 filings.tools
PTC 10-K 2023-09-30
Filed 2023-11-20. 23 sections, 318K characters. Original on sec.gov · Markdown · JSON
Cover and table of contents
UNITED STATES
SECURITIES AND EXCHANGE COMMISSION
Washington, D.C. 20549
FORM 10-K
| ☑ | ANNUAL REPORT PURSUANT TO SECTIONS 13 OR 15(d) OF THE SECURITIES EXCHANGE ACT OF 1934 |
For the Fiscal Year Ended: September 30, 2023
OR
| ☐ | TRANSITION REPORT PURSUANT TO SECTION 13 OR 15(d) OF THE SECURITIES EXCHANGE ACT OF 1934 |
For the transition period from_ to_
Commission File Number: 0-18059
PTC Inc.
(Exact name of registrant as specified in its charter)
| Massachusetts | 04-2866152 | |
| (State or other jurisdiction of incorporation or organization) | (I.R.S. Employer Identification Number) |
121 Seaport Boulevard**,** Boston**,** MA 02210
(Address of principal executive offices, including zip code)
(781) 370-5000
(Registrant’s telephone number, including area code)
Securities registered pursuant to Section 12(b) of the Act:
| Title of each class | Trading Symbol | Name of each exchange on which registered |
| Common Stock, $.01 par value per share | PTC | NASDAQ Global Select Market |
Securities registered pursuant
to Section 12(g) of the Act: None
Indicate by check mark whether the registrant is a well-known seasoned issuer, as defined in Rule 405 of the Securities Act. Yes ☑ No ☐
Indicate by check mark whether the registrant is not required to file reports pursuant to Section 13 or 15(d) of the Act. Yes ☐ No ☑
Indicate by check mark whether the registrant: (1) has filed all reports required to be filed by Section 13 or 15(d) of the Securities Exchange Act of 1934 during the preceding 12 months (or for such shorter period that the registrant was required to file such reports) and (2) has been subject to such filing requirements for the past 90 days. Yes ☑ No ☐
Indicate by check mark whether the registrant has submitted electronically every Interactive Data File required to be submitted pursuant to Rule 405 of Regulation S-T during the preceding 12 months (or for such shorter period that the registrant was required to submit such files). Yes ☑ No ☐
Indicate by check mark whether the registrant is a large accelerated filer, an accelerated filer, a non-accelerated filer or a smaller reporting company. See the definitions of “large accelerated filer,” “accelerated filer” and “smaller reporting company” in Rule 12b-2 of the Exchange Act.
| Large Accelerated Filer | ☑ | Accelerated Filer | ☐ | Non-accelerated Filer | ☐ | Smaller Reporting Company | ☐ |
| Emerging growth company | ☐ |
If an emerging growth company, indicate by check mark if the registrant has elected not to use the extended transition period for complying with any new or revised financial accounting standards provided pursuant to Section 13(a) of the Exchange Act. ☐
Indicate by check mark whether the registrant has filed a report on and attestation to its management’s assessment of the effectiveness of its internal control over financial reporting under Section 404(b) of the Sarbanes-Oxley Act (15 U.S.C. 7262(b)) by the registered public accounting firm that prepared or issued its audit report. ☑
If securities are registered pursuant to Section 12(b) of the Act, indicate by check mark whether the financial statements of the registrant included in the filing reflect the correction of an error to previously issued financial statements. ☐
Indicate by check mark whether any of those error corrections are restatements that required a recovery analysis of incentive-based compensation received by any of the registrant’s executive officers during the relevant recovery period pursuant to §240.10D-1(b). ☐
Indicate by check mark whether the registrant is a shell company (as defined in Rule 12b-2 of the Act). Yes ☐ No ☑
The aggregate market value of our voting stock held by non-affiliates was approximately $14,078,377,983 on March 31, 2023 based on the last reported sale price of our common stock on the Nasdaq Global Select Market on that date. There were 118,333,823 shares of our common stock outstanding on that day and 119,244,754 shares of our common stock outstanding on November 16, 2023.
DOCUMENTS INCORPORATED BY REFERENCE
Portions of the definitive Proxy Statement in connection with the 2024 Annual Meeting of Stockholders (2024 Proxy Statement) are incorporated by reference into Part III.
PTC Inc.
ANNUAL REPORT ON FORM 10-K FOR FISCAL YEAR 2023
Table of Contents
Cautionary Note About Forward-Looking Statements
This Annual Report contains forward-looking statements within the meaning of Section 27A of the Securities Act of 1933, as amended, and Section 21E of the Securities Exchange Act of 1934, as amended. We intend such forward-looking statements to be covered by the safe harbor provisions for forward-looking statements contained in the Private Securities Litigation Reform Act of 1995. In particular, statements that are not historical facts, including but not limited to, statements about our anticipated financial results, capital development and growth, as well as about the development of our products, markets and workforce, are forward-looking statements. These forward-looking statements are generally identifiable by use of the words “believe,” “expect,” “intend,” “anticipate,” “estimate,” “project” or similar expressions, whether in the negative or affirmative. Forward-looking statements are based on our current plans, expectations and assumptions and are not guarantees of future performance. Factors that may cause our actual results to differ materially from these statements include, but are not limited to, the risks and uncertainties discussed in Item 1A. “Risk Factors” and elsewhere throughout this Annual Report. Such factors, among others, could have a material adverse effect upon our business, results of operations and financial condition. We caution readers not to place undue reliance on any forward-looking statements, which only speak as of the date made. We undertake no obligation to update any forward-looking statement to reflect events or circumstances after the date on which such statement is made.
Unless otherwise indicated, all references to a year reflect our fiscal year that ends on September 30.
Website References
References to our PTC.com website in this Annual Report and to our 2023 Impact Report are provided for convenience. The content on PTC.com and in our 2023 Impact Report is not incorporated by reference into this Annual Report unless expressly stated.
PART I
Item 1. Business
Our Business
PTC is a global software company that provides a portfolio of innovative digital solutions that work together to transform how physical products are engineered, manufactured, and serviced.
Our software portfolio includes award-winning offerings that enable companies to author product data (our computer-aided design (CAD) portfolio solutions) and to manage product data and orchestrate processes (our product lifecycle management (PLM) portfolio solutions).
Our software can be delivered on premises, in the cloud, or in a hybrid model. Our customers include some of the world's most innovative companies in the aerospace and defense, automotive, electronics and high tech, industrial machinery and equipment, life sciences, retail and consumer products industries.
We generate revenue through the sale of subscriptions, which include term-based on-premises software licenses and related support, Software-as-a-Service (SaaS), and hosting services; perpetual licenses; support for perpetual licenses; and professional services (consulting, implementation, and training).
Recent Developments
We acquired the ServiceMax® cloud-native field service management business in Q2’23, broadening our PLM solution set to encompass the service phase of the product lifecycle. We paid the first purchase payment installment of $835 million, as adjusted for working capital, indebtedness, cash, and transaction expenses, in January 2023, and the second and final installment of $650 million in October 2023. Refer to Note 6. Acquisitions and Disposition of Businesses of Notes to Consolidated Financial Statements in this Annual Report for additional discussion about the ServiceMax transaction.
Our Strategy
We pursue multiple strategic initiatives designed to create value for our customers, increase our Annual Run Rate (ARR) and free cash flow, and deliver long-term value for stockholders.
Subscription Business Model
Our transition from a perpetual and maintenance model to a subscription business model continues to be key to driving growth. Our subscription model offers greater benefits of scale and growth potential, drives higher customer engagement and retention, and provides better business predictability, with over 90% of our annual revenues being recurring in nature. This, in turn, enables us to make steady and sustained investments to pursue mid-to-long-term growth opportunities.
Customer Expansion
Our solutions portfolio encompasses the entire product life cycle, from design to manufacture to service, enabling companies to adopt a “digital thread” strategy to drive innovation and productivity. A digital thread manages product data and makes it accessible and useful to the right people, at the right time, and in the right context. The digital thread is particularly valuable for customers with complex products that tend to have longer life cycles. We seek to drive value for our customers by offering new and enhanced features and products that enable our customers to pursue and expand their digital thread strategies.
Our acquisition strategy targets companies with products that complement ours and that we believe will appeal to our existing customer base, allowing us to pursue cross-selling opportunities. The addition of ServiceMax in 2023 for the SLM part of our PLM portfolio further extends what was already a unique portfolio of interconnected digital thread capabilities across the full product life cycle. The addition of Codebeamer in 2022 for the ALM part of our PLM portfolio strengthened our offerings in the ALM space as software becomes integral to more and more products, especially in regulated industries where traceability is safety-critical.
PLM Expansion
PLM is at the heart of digital transformation and has become essential technology at industrial companies. No longer confined to the Engineering department, PLM data is driving decision-making across organizations, enabling them to improve how products are designed, manufactured, and serviced.
Our goal is to be the category leader in PLM and to provide our customers with best-in-class solutions to drive innovation and productivity.
SaaS Transition
We continue to invest in the transformation of our technology portfolio to include more SaaS offerings. Our acquisitions of Onshape, Arena, and ServiceMax brought cloud-native solutions to our portfolio, and we continue to work towards creating and expanding SaaS offerings for our existing products. We believe that SaaS products represent a strong value proposition for our customers, offering reduced complexity; lower costs to implement, upgrade and administer; better user collaboration and mobility; and scalability. This is a longer-term strategy as we expect that SaaS adoption in the CAD and PLM markets will be gradual at first, then accelerate significantly, given constraints such as the length and cost of conversion projects and budgeting timelines of our customers.
Our Principal Products and Services
Our Principal Product Groups
| PLM Software Products For Product Data Management and Process Orchestration | CAD Software Products For Product Data Authoring |
PLM
Our Windchill**®** PLM application suite manages all aspects of the product development lifecycle—from concept through service and retirement—by enabling a digital thread of product parts, materials, and configuration information. Windchill provides real-time information sharing, dynamic data visualization, and the ability to collaborate across geographically-distributed teams, enabling manufacturers to elevate their product development, manufacturing, and field service processes. With its open architecture that integrates with other enterprise systems, Windchill provides a solid foundation for a product-driven digital thread.
Our ThingWorx**®** platform is flexible and purpose-built for Industrial Internet of Things (IIoT). It offers a rich set of capabilities that enable enterprises to digitally transform every aspect of their business with innovative solutions that are simple to create, easy to implement, scalable to meet future needs, and designed to enable customers to accelerate time to value. Primary use cases include remote asset monitoring, remote maintenance and service, predictive maintenance and asset management, and optimized equipment effectiveness. Our ThingWorx Digital Performance Management solution enables manufacturers to identify, prioritize, and overcome their most significant production bottlenecks.
Our ServiceMax**®** field service management (FSM) solutions enable companies to improve asset uptime with optimized in-person and remote service, boost technician productivity with the latest mobile tools, and deliver metrics for confident decision making.
Our Arena**®** SaaS PLM solution enables product teams to collaborate virtually anytime and anywhere, making it easier to share the latest product and quality information with internal teams and supply chain partners and deliver innovative products to customers faster. Our Arena quality management system software connects quality and product designs into a single system to simplify regulatory compliance.
Our Codebeamer**®** application lifecycle management (ALM) and model-based systems engineering capabilities enable companies to accelerate the development of software-intensive products through system modeling, software configuration, and requirements, risk, and test management.
Our Servigistics**®** service parts management solution enables companies to effectively manage their service parts inventory, enabling them to optimize equipment availability and uptime, and increase customer satisfaction.
Our FlexPLM**®** solution provides retailers with a single platform for merchandising and line planning, materials management, sampling, and more.
Our Kepware**®** portfolio of industrial connectivity solutions helps companies connect diverse automation devices and software applications.
CAD
Our Creo**®** 3D CAD technology enables the digital design, testing, and modification of product models. With its design simulation, additive manufacturing, and generative design innovations, we enable our customers to be first to market with differentiated products. From initial concept to design, simulation, and analysis, Creo provides designers with innovative tools to efficiently create better products, faster.
Our Onshape® SaaS product development platform unites computer-aided design with data management, collaboration tools, and real-time analytics. A cloud-native multi-tenant solution that can be instantly deployed on virtually any computer or mobile device, Onshape enables teams to work together from just about anywhere. Real-time design reviews, commenting, and simultaneous editing enable a collaborative workflow where multiple design iterations can be completed in parallel and merged into the final design.
Our Vuforia**®** augmented reality (AR) technology enables the visualization of digital information in a physical context and the creation of AR and mixed reality experiences, enabling companies to drive results in manufacturing, service, engineering, and operations. Vuforia solutions equip frontline workers with focused and effective step-by-step instructions, procedural guidance, skill development and remote assistance that enable enterprises to improve workforce productivity, reduce errors, increase asset utilization and drive higher profitability.
Our Arbortext**®** dynamic publishing solution streamlines how organizations create, manage, and publish technical documentation.
Our Markets and How We Address Them
The markets we serve present different growth opportunities for us. The PLM market is undergoing expansion as PLM plays a larger role in industrial companies. Within PLM, we've extended our reach in the growing SLM and ALM spaces through our acquisitions of ServiceMax and Codebeamer. Across all our solutions, we see opportunity for further market growth with a new generation of SaaS solutions we are developing to bring to market over the next few years.
We derive most of our sales from products and services sold directly by our sales force to end-user customers. Approximately 25% of our sales of products and services are through third-party resellers. Our sales force focuses on large accounts, while our reseller channel provides a cost-effective means of covering the small- and medium-size business market. Our strategic alliance partners enable us to increase our market reach, offer broader solutions, and add compelling technology to our offerings. Our strategic services partners provide service offerings to help customers implement our product offerings and transition to SaaS.
Additional financial information about our international and domestic operations may be found in Note 3. Revenue from Contracts with Customers of Notes to Consolidated Financial Statements in this Annual Report, which information is incorporated herein by reference.
Competition
We compete with a number of companies whose offerings address one or more specific functional areas covered by our solutions. For enterprise CAD and PLM solutions, we compete with large established companies including Autodesk, Dassault Systèmes SA, and Siemens AG. In our IIoT business, we compete with large established companies such as Amazon, IBM, Oracle, SAP, Siemens AG, and Software AG as well as customers’ homegrown solutions. There are also a number of smaller companies that compete in the market for IIoT products. For our AR products, our primary competitors include Microsoft, TeamViewer SE, and Scope Technologies US Inc. For our ALM products, we compete with IBM, Jama Software, Inc. and Siemens AG. For our SLM products, we compete with enterprise software companies such as Oracle, SAP and IFS AB, and with companies that offer point solutions.
Proprietary Rights
Our software products and related technical know-how, along with our trademarks, including our company names, product names and logos, are proprietary. We protect our intellectual property rights in these items by relying on copyrights, trademarks, patents and common law safeguards, including trade secret protection. The nature and extent of such legal protection depends in part on the type of intellectual property right and the relevant jurisdiction. In the U.S., we are generally able to maintain our trademark registrations for as long as the trademarks are in use and to maintain our patents for up to 20 years from the earliest effective filing date. We also use license management and other anti-piracy technology measures, as well as contractual restrictions, to curtail the unauthorized use and distribution of our products.
Our proprietary rights are subject to the risks and uncertainties described under Item 1A. Risk Factors below, which is incorporated into this section by reference.
Environmental Sustainability
At PTC, we’re motivated to become an impactful contributor to the dematerialization and decarbonization of global manufacturing. While we have a climate action plan committed to reduce our company’s “footprint,” we believe far larger benefits will flow from our “handprint” stemming from our software offerings. Our software solutions enable manufacturers to design, build, and service their products more sustainably.
Footprint
In 2023, we announced our footprint reduction commitment via the Science Based Target initiative (SBTi) and submitted near-term and net-zero targets for validation by SBTi. Our submitted near-term commitment is to reduce combined Scope 1 (direct emissions from owned/controlled operations) and Scope 2 (indirect energy use) emissions by 50% and reduce Scope 3 - Category 1 (Purchased Goods and Services) 25% compared to our 2022 baseline by 2030. Our long-term net-zero commitment is to reach net-zero across all scope emissions by 2050, with absolute reductions of over 90% across Scopes 1-3, with accredited carbon removal offsets for the remaining <10% as needed.
While we await SBTi approval of our near-term and net-zero targets, we have already begun to implement programs and pursue initiatives to reduce our emissions and carbon footprint, including:
prioritizing energy efficiency and accessibility to public transportation when selecting office space;
increasing our subsidy for employee’s public transportation commute costs; and
consolidating our data center operations with providers committed to mid-decade 100% renewable energy and advancing circular outcomes.
Handprint
Environmental sustainability is integral to our product offerings. With our software, manufacturers can drive sustainability improvement, including by designing with less material, enhancing product repairability and circularity, improving factory efficiency, and enabling remote service.
People and Culture
At PTC, we don’t just imagine a better world, we help create it. Within our work environment we seek to create an equitable and inclusive culture in which all employees can thrive. This is a key aspect of our talent strategy. Our approach is focused on promoting an agile culture, an increased sense of belonging, engaged work environments, and high-performing teams.

PTC at-a-Glance
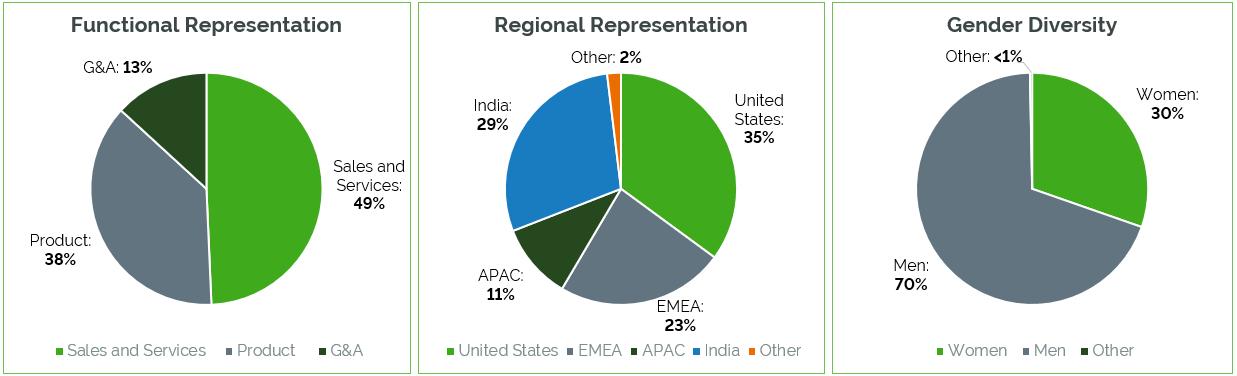
As of September 30, 2023, PTC had 7,231 full-time employees. Our employee population is geographically diverse and serves a geographically diverse customer and partner network.
Worldwide Employee Representation
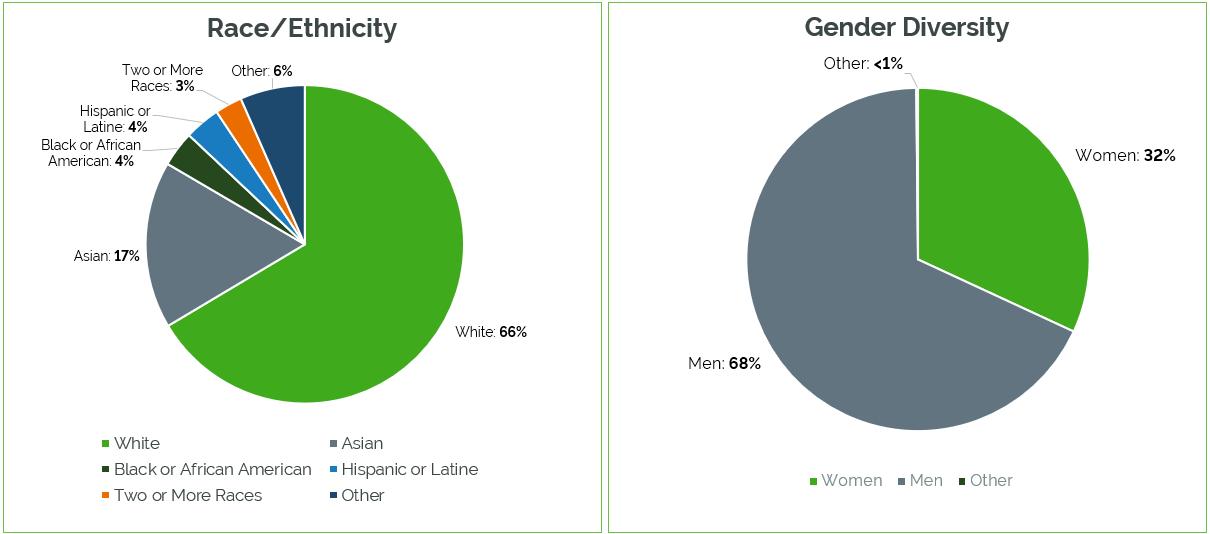
United States Employee Representation
Compensation and Benefits
PTC provides a comprehensive and competitive compensation and benefits package designed to attract, retain, motivate, and engage talent around the world.
We provide employees with competitive compensation packages, including base salaries, and, for eligible roles, incentive and equity compensation. Employees also have the opportunity to purchase PTC stock at a discount through our Employee Stock Purchase Plan.
Our benefits offerings are designed to meet the needs of our employees and their families around the world. Specific offerings differ country by country due to cultural norms, market dynamics, and legal requirements, but we provide a wide variety of core health and financial programs such as healthcare, life and disability insurance, employee assistance plans, retirement savings and pension benefit plans, and generous paid family leave and vacation time.
Talent Development & Employee Engagement
As we focus on enhancing the employee experience, we are increasing our efforts to invest in our people and create meaningful opportunities to learn, grow, develop, and advance their careers. We have specific development programs and coaching programs, as well as numerous other self-led learning paths. The variety of options means that employees have the ability to focus on the development path most meaningful to them.
Diversity, Equity, and Inclusion (DEI)
Commitment to our values and diversity in our workforce is supported by various ongoing efforts. We mitigate bias by coaching managers and leaders in fostering psychologically safe environments. We also review and revise our processes based on feedback and engagement scores from employee pulse surveys. We embed equitable practices into the planning and execution of how we attract, select, develop, and retain talent. Meanwhile, our DEI ambassadors are aligned with functions across the business to amplify and enhance our efforts in these areas. Finally, to cultivate a community of belonging, our 12 Employee Resource Groups foster an inclusive culture and facilitate safe spaces for employees to navigate social issues and challenges.
Additional Information About Our Employee Initiatives
You can find more information about our employee initiatives in our 2023 Impact Report, which we expect to release in December 2023.
Available Information
We make available free of charge on our website at www.ptc.com the following reports as soon as reasonably practicable after electronically filing them with, or furnishing them to, the SEC: our Annual Reports on Form 10-K; our Quarterly Reports on Form 10-Q; our Current Reports on Form 8-K; and amendments to those reports filed or furnished pursuant to Sections 13(a) or 15(d) of the Securities Exchange Act of 1934. Our Proxy Statements for our Annual Meetings and Section 16 trading reports on SEC Forms 3, 4 and 5 also are available on our website.
Corporate Information
PTC was incorporated in Massachusetts in 1985 and is headquartered in Boston, Massachusetts.
Item 1A. Risk Factors
The following are important factors we have identified that could affect an investment in our securities. You should consider them carefully when evaluating an investment in PTC securities, because these factors could cause actual results to differ materially from historical results or any forward-looking statements. The risks described below are not the only risks we face. Additional risks and uncertainties not currently known to us or that we currently deem to be immaterial may also materially adversely affect our business, financial condition, operating results, and prospects.
I. Risks Related to Our Business Operations and Industry
We face significant competition, which could adversely affect our business, financial condition, operating results, and prospects if we are unable to successfully compete.
The markets for our products and solutions are rapidly changing and characterized by intense competition, disruptive technology developments, evolving distribution models and increasingly lower barriers to entry. If we are unable to provide products and solutions that address customers’ needs as well as our competitors’ products and solutions do, or to align our pricing, licensing and delivery models with customer preferences, we could lose customers and/or fail to attract new customers, which could adversely affect our business, financial condition, operating results, and prospects.
For example, customer demand for SaaS solutions is increasing. While our Arena, ServiceMax, and Onshape solutions are cloud-native SaaS solutions, and we have introduced our Windchill+, Creo+, and Kepware+ SaaS solutions, customers may not adopt them as we expect. If we are unable to compete successfully with competitors offering SaaS solutions, we could lose customers and/or fail to attract new customers, which could adversely affect our business, financial condition, operating results, and prospects.
Our current and potential competitors range from large and well-established companies to emerging start-ups. Some of our competitors and potential competitors have greater name recognition in the markets we serve and greater financial, technical, sales and marketing, and other resources, which could limit our ability to gain customer recognition and confidence in our products and solutions and successfully sell our products and solutions, which could adversely affect our ability to grow our business.
A breach of security in our products or computer systems, or those of our third-party service providers, could compromise the integrity of our products, cause loss of data, harm our reputation, create additional liability and adversely affect our business, financial condition, operating results, and prospects.
We have implemented and continue to implement measures intended to maintain the security and integrity of our products, source code and IT systems. The potential for a security breach or system disruption has significantly increased over time as the scope, number, intensity and sophistication of attempted cyberattacks and cyber intrusions have increased – particularly cyberattacks and intrusions designed to access and exfiltrate information and to disrupt and lock up access to systems for the purpose of demanding a ransom payment. It is impossible for us to eliminate the risk of a successful cyberattack or intrusion, and, in fact, we regularly deal with security issues and have experienced security incidents from time to time. Accordingly, there is a risk that a cyberattack or intrusion will be successful and that such event will be material.
In addition, we offer cloud services to our customers and some of our products, including our SaaS products, are hosted by third-party service providers, which expose us to additional risks as those repositories of our customers’ proprietary data may be targeted and a cyberattack or intrusion may be successful and material. Interception of data transmission, misappropriation or modification of data, corruption of data and attacks against our service providers may adversely affect our products or product and service delivery. Malicious code, viruses or vulnerabilities that are undetected by our service providers may disrupt our business operations generally and may have a disproportionate effect on those of our products that are developed and delivered in the cloud environment.
While we devote resources to maintaining the security and integrity of our products and systems, as well as performing due diligence of our third-party service providers, security breaches that have not had a material effect on our business or that of our customers have occurred, and we will continue to face cybersecurity threats and exposure. A significant breach of the security and/or integrity of our products or systems, or those of our third-party service providers, whether intentional or by human error by our employees or others, could disrupt our business operations or those of our customers, could prevent our products from functioning properly, could enable access to sensitive, proprietary or confidential information of our customers, or could enable access to our sensitive, proprietary or confidential information. This could require us to incur significant costs of investigation, remediation and/or payment of a ransom; harm our reputation; cause customers to stop buying our products; and cause us to face lawsuits and potential liability, any of which could have a material adverse effect on our business, financial condition, operating results, and prospects.
We increasingly rely on third-party providers of cloud infrastructure services to deliver our offerings to users on our platform, and any disruption of or interference with our use of these services could adversely affect our business, financial condition, operating results, and prospects.
Our continued growth depends in part on the ability of our existing and potential customers to use and access our cloud services or our website in order to download our software or encrypted access keys for our software within an acceptable amount of time. We use a number of third-party service providers that we do not control for key components of our infrastructure, particularly with respect to development and delivery of our cloud-based products. The use of these service providers gives us greater flexibility in efficiently delivering a more tailored, scalable customer experience, but also exposes us to additional risks and vulnerabilities. Third-party service providers operate their own platforms that we access, and we are, therefore, vulnerable to their service interruptions. We may experience interruptions, delays and outages in service and availability from time to time as a result of problems with our third-party service providers’ infrastructure. Lack of availability of this infrastructure could be due to a number of potential causes including technical failures, natural disasters, fraud or security attacks that we cannot predict or prevent. Such outages could adversely impact our business, financial condition, results of operations, and prospects.
If we are unable to renew our agreements with our cloud service providers on commercially reasonable terms, or any of our agreements are prematurely terminated, or we need to add new cloud services providers to increase capacity and uptime, we could experience interruptions, downtime, delays, and additional expenses related to transferring to and providing support for these new platforms. Any of the above circumstances or events may harm our reputation and brand, reduce the availability or usage of our platforms and impair our ability to attract new users, any of which could adversely affect our business, financial condition, results of operations, and prospects.
We may be unable to hire or retain employees with the necessary skills to operate and grow our business, which could adversely affect our ability to compete and adversely affect our business, financial condition, results of operations, and prospects.
Our success depends upon our ability to attract and retain highly skilled employees to develop our products and solutions and to operate and grow our business. Competition for such employees in our industry is intense worldwide, and particularly in the Boston, Massachusetts area where our global headquarters is located.
If we are unable to attract and retain employees with the requisite skills to develop our products and solutions, or to guide, operate and support our business, we may be unable to compete successfully, which would adversely affect our business, financial condition, results of operations, and prospects.
We depend on sales within the discrete manufacturing sector and our business could be adversely affected if manufacturing activity does not grow or if it contracts, or if manufacturers are adversely affected by other macroeconomic factors.
A large amount of our sales are to customers in the discrete manufacturing sector. Manufacturers worldwide continue to face uncertainty about the global macroeconomic environment due to, among other factors, the effects of earlier and ongoing supply chain disruptions, rising interest rates and inflation, volatile foreign exchange rates and the current relative strength of the U.S. Dollar, and the U.S. government’s focus on technology transactions with non-U.S. entities. Customers may delay, reduce, or forego purchases of our solutions due to these challenges and concerns, which could adversely affect our business, financial condition, results of operations, and prospects.
If we fail to successfully transform our operations to support the sale of SaaS solutions and to develop competitive SaaS solutions, our business and prospects could be adversely affected.
Transforming our business to offer and support SaaS solutions requires considerable additional investment in our organization. Whether we will be successful and will accomplish our business and financial objectives is subject to risks and uncertainties, including but not limited to: customer demand, attach and renewal rates, channel adoption, our ability to further develop and scale infrastructure, our ability to include functionality and usability in such offerings that address customer requirements, our ability and the ability of our partners to transition existing customer implementations and subscriptions to SaaS, and our costs. If we are unable to successfully establish these new offerings and navigate our business transition, our business, financial condition, results of operations, and prospects could be adversely affected.
Because our sales and operations are globally dispersed, we face additional compliance risks, and any compliance failure could adversely affect our business and prospects.
We sell and deliver software and services, and maintain support operations, in many countries whose laws and practices differ from one another and are subject to unexpected changes. Managing these geographically dispersed operations requires significant attention and resources to ensure compliance with laws of those countries and those of the U.S. governing our activities in non-U.S. countries.
Those laws include, but are not limited to, anti-corruption laws and regulations (including the U.S. Foreign Corrupt Practices Act (FCPA) and the U.K. Bribery Act 2010), data privacy laws and regulations (including the European Union's General Data Privacy Regulation), and trade and economic sanctions laws and regulations (including laws administered by the U.S. Department of the Treasury’s Office of Foreign Assets Control, the U.S. State Department, the U.S. Department of Commerce, the United Nations Security Council and other sanctions authorities). Our compliance risks are heightened due to the go-to-market approach for our business that relies heavily on a partner ecosystem, the fact that some of the countries we operate in have a higher incidence of corruption and fraudulent business practices, the fact that we sell to governments and state-owned business enterprises, and the fact that global enforcement of laws has significantly increased.
Accordingly, while we strive to maintain a comprehensive compliance program, an employee, agent or business partner may violate our policies or U.S. or other applicable laws or we may inadvertently violate such laws. Investigations of alleged violations of those laws can be expensive and disruptive. Violations of such laws can lead to civil and/or criminal prosecutions, substantial fines and other sanctions, including the revocation of our rights to continue certain operations, and also cause business loss and reputational harm, which could adversely affect our business, financial condition, results of operations, and prospects.
II. Risks Related to Acquisitions and Strategic Relationships
Businesses we acquire may not generate the sales and earnings we anticipate and may otherwise adversely affect our business and prospects.
We have acquired, and intend to continue to acquire, new businesses and technologies. If we fail to successfully integrate and manage the businesses and technologies we acquire, if an acquisition does not further our business strategy or return a level of sales as we expect, or if a business we acquire has unexpected legal or financial liabilities, our business, financial condition, results of operations, and prospects could be adversely affected.
The types of issues that we may face in integrating and operating the acquired business include:
difficulties managing an acquired company’s technologies or lines of business or entering new markets where we have limited or no prior experience or where competitors may have stronger market positions;
unanticipated operating difficulties in connection with the acquired entities, including potential declines in sales of the acquired entity;
complications relating to the assumption of pre-existing contractual relationships of an acquired company that we would not have otherwise entered into, the termination or modification of which may be costly or disruptive to our business;
litigation arising from the transaction, including potential intellectual property claims or disputes following an acquisition;
diversion of management and employee attention;
challenges with implementing adequate and appropriate controls, procedures and policies in an acquired business;
potential loss of key personnel in connection with an acquisition; and
potential incompatibility of business cultures.
Further, if we do not achieve the expected return on our investments, it could impair the intangible assets and goodwill that we recorded as part of an acquisition, which could require us to record a reduction to the value of those assets.
We may incur significant debt or issue a material amount of debt or equity securities to finance an acquisition, which could adversely affect our operating flexibility, business and prospects.
If we were to incur a significant amount of debt—whether by borrowing funds under our credit facility or otherwise or issuing new debt securities—to finance an acquisition, our interest expense, debt service requirements and leverage would increase significantly. The increases in these expenses and in our leverage could constrain our ability to operate as we might otherwise or to borrow additional amounts and could adversely affect our business, financial condition, results of operations, and prospects.
If we were to issue a significant amount of equity securities in connection with an acquisition, existing stockholders would be diluted and our stock price could decline.
Our inability to maintain or develop our strategic and technology relationships could adversely affect our business and prospects.
We have many strategic and technology relationships with other companies with which we work to offer complementary solutions and services, that market and sell our solutions, and that provide technologies that we embed in our solutions. We may not realize the expected benefits from these
relationships and such relationships may be terminated by the other party. If these companies fail to perform or if a company terminates or substantially alters the terms of the relationship, we could suffer delays in product development, reduced sales or other operational difficulties and our business, financial condition, results of operations, and prospects could be materially adversely affected.
III. Risks Related to Our Intellectual Property
We may be unable to adequately protect our proprietary rights, which could adversely affect our business and our prospects.
Our software products are proprietary. We protect our intellectual property rights in these items by relying on copyrights, trademarks, patents and common law safeguards, including trade secret protection, as well as restrictions on disclosures and transferability contained in our agreements with other parties. Despite these measures, the laws of all relevant jurisdictions may not afford adequate protection to our products and other intellectual property. In addition, we frequently encounter attempts by individuals and companies to pirate our software. If our measures to protect our intellectual property rights fail, others may be able to use those rights, which could reduce our competitiveness and adversely affect our business, financial condition, operating results, and prospects.
In addition, any legal action to protect our intellectual property rights that we may bring or be engaged in could be costly, may distract management from day-to-day operations and may lead to additional claims against us, and we may not succeed, all of which could adversely affect our business, financial condition, operating results, and prospects.
Intellectual property infringement claims could be asserted against us, which could be expensive to defend, could result in limitations on our use of the claimed intellectual property, and could adversely affect our business and prospects.
The software industry is characterized by frequent litigation regarding copyright, patent and other intellectual property rights. We have faced such lawsuits from time to time. Any such claim could result in significant expense to us and divert the efforts of our technical and management personnel. We cannot be sure that we would prevail against any such asserted claims. If we did not prevail, we could be prevented from using the claimed intellectual property or be required to enter into royalty or licensing agreements, which might not be available on terms acceptable to us. In addition to possible claims with respect to our proprietary products, some of our products contain technology developed by and licensed from third parties and we may likewise be susceptible to infringement claims with respect to these third-party technologies.
IV. Risks Related to Our Indebtedness
Our substantial indebtedness could adversely affect our business, financial condition, results of operations, and prospects, as well as our ability to meet our payment obligations under our debt.
We have a substantial amount of indebtedness. As of November 17, 2023, our total debt outstanding was approximately $2,307 million and €85 million, $1 billion of which was associated with the 3.625% Senior Notes and 4.000% Senior Notes (together, “Senior Notes”) issued in February 2020, which mature in February 2025 and 2028, respectively, and are unsecured; $807 million and €85 million of which was borrowed under our credit facility revolving line, which matures in January 2028; and $500 million of which was borrowed under our credit facility term loan, which begins amortizing in March 2024. All amounts outstanding under the credit facility and the Senior Notes will be due and payable in full on their respective maturity dates. As of November 17, 2023, we had unused commitments under our credit facility of approximately $350 million. PTC Inc. and one of our foreign subsidiaries are eligible borrowers under the credit facility and certain other foreign subsidiaries may become borrowers under our credit facility in the future, subject to certain conditions.
Specifically, our level of debt could:
make it more difficult for us to satisfy our debt obligations and other ongoing business obligations, which may result in defaults;
result in an event of default if we fail to comply with the financial and other covenants contained in the agreements governing our debt instruments, which could result in all of our debt becoming immediately due and payable or require us to negotiate an amendment to financial or other covenants that could cause us to incur additional fees and expenses;
limit our ability to obtain additional financing to fund future working capital, capital expenditures, acquisitions or other general corporate requirements;
reduce the availability of our cash to fund working capital, capital expenditures, acquisitions and other general corporate purposes and limit our ability to obtain additional financing for these purposes;
increase our vulnerability to adverse economic and industry conditions;
amplify the risk of increased interest rates as certain of our borrowings, including borrowings under our credit facility, are at variable rates of interest;
limit our flexibility in planning for, or reacting to, and increasing our vulnerability to, changes in our business, the industries in which we operate, and the overall economy; and
place us at a competitive disadvantage compared to other, less leveraged competitors.
Any of the above-listed factors could have an adverse effect on our business, financial condition, results of operations, and prospects, and our ability to meet our payment obligations under our debt agreements.
Despite our current level of indebtedness, we and our subsidiaries may still be able to incur substantially more debt and other obligations. This could further exacerbate the risks to our business, financial condition, and prospects described above.
We and our subsidiaries may be able to incur significant additional indebtedness and other obligations in the future, including secured debt. Although the credit agreement governing our credit facility contains restrictions on the incurrence of additional indebtedness, these restrictions are subject to a number of qualifications and exceptions. The additional indebtedness incurred in compliance with these restrictions could be substantial. In addition, the credit agreement and the indenture governing our Senior Notes due 2025 and 2028, will not prevent us from incurring obligations that do not constitute indebtedness. If new debt is added to our current debt levels, or we incur other obligations, the related risks that we now face could intensify.
We may not be able to generate enough cash to service all our indebtedness and may be forced to take other actions to satisfy our obligations under our indebtedness, which may not be successful, and could harm our business and prospects.
Our ability to make scheduled payments on or refinance our debt obligations depends on our financial condition and operating performance, which are subject to prevailing economic and competitive conditions and to certain financial, business, legislative, regulatory and other factors, some of which are beyond our control. We may be unable to maintain a level of cash flows from operating activities sufficient to permit us to pay the principal, premium, if any, and interest on our indebtedness.
If our cash flows and capital resources are insufficient to fund our debt service obligations, we could face substantial liquidity problems and could be forced to reduce or delay investments and capital expenditures or to dispose of material assets or operations, seek additional debt or equity capital or restructure or refinance our indebtedness. We may not be able to effect any such alternative measures, if necessary, on commercially reasonable terms or at all and, even if successful, those alternative actions may not allow us to meet our scheduled debt service obligations. Our debt agreements restrict our ability to dispose of assets and use the proceeds from those dispositions and may also restrict our ability to raise debt or equity capital to be used to repay other indebtedness when it becomes due. We may not be able to consummate those dispositions or to obtain proceeds in an amount sufficient to meet any debt service obligations then due.
Our inability to generate sufficient cash flows to satisfy our debt obligations, or to refinance our indebtedness on commercially reasonable terms or at all, would materially and adversely affect our ability to satisfy our debt obligations.
If we cannot make scheduled payments on our debt, we will be in default and the lenders under our credit facility could terminate their commitments to loan money, the lenders could foreclose against the assets securing their borrowings, the holders of our Senior Notes could declare all outstanding principal, premium, if any, and interest to be due and payable, and we could be forced into bankruptcy or liquidation. These events could result in a loss of your investment.
We are required to comply with certain financial and operating covenants under our debt agreements. Any failure to comply with those covenants could cause amounts borrowed to become immediately due and payable and/or prevent us from borrowing under the credit facility.
We are required to comply with specified financial and operating covenants under our debt agreements and to make payments under our debt, which limit our ability to operate our business as we otherwise might operate it. Our failure to comply with any of these covenants or to meet any debt payment obligations could result in an event of default which, if not cured or waived, would result in any amounts outstanding, including any accrued interest and/or unpaid fees, becoming immediately due and payable. We might not have enough working capital or liquidity to satisfy any repayment obligations if those obligations were accelerated. In addition, if we are not in compliance with the financial and operating covenants under the credit facility when we wish to borrow funds, we will be unable to borrow funds to pursue certain corporate initiatives, including strategic acquisitions, which could adversely affect our business and prospects.
V. Risks Related to Our Common Stock
Our stock price has been volatile, which may make it harder to resell shares at a favorable time and price.
Market prices for securities of software companies are generally volatile and are subject to significant fluctuations that may be unrelated or disproportionate to the operating performance of these companies. Accordingly, the trading prices and valuations of software companies’ stocks, and of ours, may not be predictable. Negative changes in the public’s perception of the prospects of software companies, or of PTC or the markets we serve, could depress our stock price regardless of our operating results.
Also, a large percentage of our common stock is held by institutional investors. Purchases and sales of our common stock by these investors could have a significant impact on the market price of our stock.
If our results of operations do not meet market or analysts’ expectations, our stock price could decline.
Our quarterly operating results fluctuate depending on many factors, including the effect of ASC 606 on revenue recognition for the on-premises software subscriptions we offer, variability in the timing of start dates for our subscription and SaaS offerings, length of contracts, and renewals, and significant unexpected expenses in a quarter. Accordingly, our quarterly results are difficult to predict and we may
be unable to confirm or adjust expectations with respect to our operating results for a quarter until that quarter has closed. If our quarterly operating results do not meet market or analysts’ expectations, our stock price could decline.
VI. General Risk Factors
Our international businesses present economic and operating risks, which could adversely affect our business and prospects.
We expect that our international operations will continue to expand and to account for a significant portion of our total revenue. Because we transact business in various foreign currencies, the volatility of foreign exchange rates has had and may in the future have a material adverse effect on our revenue, expenses and operating results.
Other risks inherent in our international operations include, but are not limited to, the following:
difficulties in staffing and managing foreign sales and development operations;
exposure of our operations and employees to political instability and armed conflict in the countries and regions in which we operate, including Israel;
increased financial accounting and reporting burdens and complexities;
increased regulatory and compliance risks;
inadequate local infrastructure; and
greater difficulty in protecting our intellectual property.
We may have exposure to additional tax liabilities and our effective tax rate may increase or fluctuate, which could increase our income tax expense, reduce our net income, and increase our tax payment obligations.
As a multinational organization, we are subject to income taxes as well as non-income based taxes in the U.S. and in various foreign jurisdictions. Significant judgment is required in determining our worldwide income tax provision and other tax liabilities. In the ordinary course of a global business, there are many intercompany transactions and calculations where the ultimate tax determination is uncertain. Our tax returns are subject to review by various taxing authorities. Although we believe that our tax estimates are reasonable, the final determination of tax audits or tax disputes could be different from what is reflected in our historical income tax provisions and accruals.
Our effective tax rate and tax payment obligations can be adversely affected by several factors, many of which are outside of our control, including:
changes in tax laws (for example, the introduction of an amendment to Section 174 of the U.S. tax legislation), regulations, and interpretations in multiple jurisdictions in which we operate;
assessments, and any related tax interest or penalties, by taxing authorities;
changes in the relative proportions of revenues and income before taxes in the various jurisdictions in which we operate that have differing statutory tax rates;
changes to the financial accounting rules for income taxes;
unanticipated changes in tax rates; and
changes to a valuation allowance on net deferred tax assets, if any.
Item 1B. Unresolved Staff Comments
None.
Item 2. Properties
We currently have 83 office locations used in operations in the United States and internationally, predominately as sales and/or support offices and for research and development work. Of our total of approximately 1,076,000 square feet of leased facilities used in operations, approximately 421,000 square feet are located in the U.S., including approximately 250,000 square feet at our headquarters facility located in Boston, Massachusetts, and approximately 267,000 square feet are located in India, where a significant amount of our research and development is conducted.
Item 3. Legal Proceedings
None.
Item 4. Mine Safety Disclosures
Not applicable.
PART II
Item 5. Market for Registrant’s Common Equity, Related Stockholder Matters and Issuer Purchases of Equity Securities
Our common stock is traded on the Nasdaq Global Select Market under the symbol "PTC."
On September 30, 2023, the close of our fiscal year, and on November 13, 2023, our common stock was held by 952 and 950 shareholders of record, respectively.
Item 6. [Reserved]
Item 7. Management’s Discussion and Analysis of Financial Condition and Results of Operations
Operating and Non-GAAP Financial Measures
Our discussion of results includes discussion of our ARR (Annual Run Rate) operating measure, non-GAAP financial measures, and disclosure of our results on a constant currency basis. ARR and our non-GAAP financial measures, including the reasons we use those measures, are described below in Results of Operations - Operating Measure and Results of Operations - Non-GAAP Financial Measures, respectively. The methodology used to calculate constant currency disclosures is described in Results of Operations - Impact of Foreign Currency Exchange on Results of Operations. You should read those sections to understand our operating measure, non-GAAP financial measures, and constant currency disclosures.
Executive Overview
ARR grew 26% (23% constant currency) to $1.98 billion as of the end of FY'23 compared to FY’22. Organic ARR, which excludes contributions from the ServiceMax business we acquired in Q2'23, grew 15% (13% constant currency) year over year to $1.81 billion. Organic ARR growth was driven by double-digit growth across all product groups and geographies.
We generated $611 million of cash from operations in FY’23 compared to $435 million in FY’22, an increase of 40%. Free cash flow of $587 million in FY'23 increased 41% from $416 million in FY'22. Our cash flow growth is attributable to strong collections driven by our solid top-line growth from our subscription business model and operational discipline. Interest payments were $41 million higher in FY'23 compared to FY'22, while restructuring payments decreased $39 million year-over-year. We ended FY’23 with cash and cash equivalents of $288 million and gross debt of $1.70 billion, with an aggregate weighted average interest rate of 5.2%.
Revenue growth of 8% (12% constant currency) in FY'23 compared to FY'22 was primarily due to the contributions from ServiceMax and Codebeamer. The timing of revenue recognition for on-premises subscription revenue can vary significantly, impacting reported revenue and growth rates. Interest expense was $75 million higher in FY'23 compared to FY'22, which adversely affected our net income and earnings per share results. The increase was driven by debt and liabilities related to the ServiceMax acquisition.
Results of Operations
The following table shows the measures that we consider the most significant indicators of our business performance. In addition to providing operating income, operating margin, diluted earnings per share and cash from operations as calculated under GAAP, we provide our ARR operating measure and non-GAAP operating income, non-GAAP operating margin, non-GAAP diluted earnings per share, and free cash flow for the reported periods. We also provide a view of our actual results on a constant currency basis. Our non-GAAP financial measures exclude the items described in Non-GAAP Financial Measures below. Investors should use our non-GAAP financial measures only in conjunction with our GAAP results.
For discussion of our FY'22 results and comparison to our FY'21 results, refer to Management's Discussion and Analysis of Financial Conditions and Results of Operations in our Annual Report on Form 10-K for the year ended September 30, 2022.
| (Dollar amounts in millions, except per share data) | Year ended September 30, | Percent Change | ||||||||||||||
| 2023 | 2022 | Actual | Constant Currency**(1)** | |||||||||||||
| ARR as of September 30 | $ | 1,978.6 | $ | 1,572.0 | 26 | % | 23 | % | ||||||||
| Total recurring revenue(2) | $ | 1,907.9 | $ | 1,736.2 | 10 | % | 13 | % | ||||||||
| Perpetual license | 38.6 | 34.1 | 13 | % | 17 | % | ||||||||||
| Professional services | 150.5 | 163.1 | (8 | )% | (5 | )% | ||||||||||
| Total revenue | 2,097.1 | 1,933.3 | 8 | % | 12 | % | ||||||||||
| Total cost of revenue | 441.0 | 386.0 | 14 | % | 16 | % | ||||||||||
| Gross margin | 1,656.0 | 1,547.4 | 7 | % | 11 | % | ||||||||||
| Operating expenses | 1,197.6 | 1,100.0 | 9 | % | 11 | % | ||||||||||
| Operating income | $ | 458.5 | $ | 447.4 | 2 | % | 10 | % | ||||||||
| Non-GAAP operating income(1) | $ | 758.9 | $ | 732.2 | 4 | % | 8 | % | ||||||||
| Operating margin | 21.9 | % | 23.1 | % | ||||||||||||
| Non-GAAP operating margin(1) | 36.2 | % | 37.9 | % | ||||||||||||
| Diluted earnings per share | $ | 2.06 | $ | 2.65 | ||||||||||||
| Non-GAAP diluted earnings per share(1) | $ | 4.34 | $ | 4.58 | ||||||||||||
| Cash flow from operations(3) | $ | 610.9 | $ | 435.3 | ||||||||||||
| Capital expenditure | (23.8 | ) | (19.5 | ) | ||||||||||||
| Free cash flow | $ | 587.0 | $ | 415.8 |
(1)
See Non-GAAP Financial Measures below for a reconciliation of our GAAP results to our non-GAAP measures and Impact of Foreign Currency Exchange on Results of Operations below for a description of how we calculate our results on a constant currency basis.
(2)
Recurring revenue is comprised of on-premises subscription, perpetual support, SaaS, and cloud revenue.
(3)
Cash flow from operations for FY'23 and FY'22 includes $1.5 million and $40.8 million of restructuring payments, respectively. Cash from operations for FY'23 and FY'22 includes $19.6 million and $11.8 million of acquisition and transaction-related payments, respectively.
Impact of Foreign Currency Exchange on Results of Operations
Approximately 50% of our revenue and 35% of our expenses are transacted in currencies other than the U.S. Dollar. Because we report our results of operations in U.S. Dollars, currency translation, particularly changes in the Euro, Yen, Shekel, and Rupee relative to the U.S. Dollar, affects our reported results. Changes in foreign currency exchange rates were a headwind to reported income statement results in FY’23. However, ARR was positively impacted by improvements in currency exchange rates, particularly the Euro to U.S. Dollar exchange rate, as of September 30, 2023 compared to September 30, 2022.
The results of operations in the table above, and the tables and discussions below about revenue by line of business and product group present both actual percentage changes year over year and percentage changes on a constant currency basis. Our constant currency disclosures are calculated by multiplying the results in local currency for FY'23 and FY'22 by the exchange rates in effect on September 30, 2022. If FY'23 reported results were converted into U.S. Dollars using the rates in effect as of September 30, 2022, ARR would have been lower by $38 million, revenue would have been lower by $59 million, and expenses would have been lower by $26 million. If FY'22 reported results were converted into U.S. Dollars using the rates in effect as of September 30, 2022, ARR would have been the same, revenue would have been lower by $112 million, and expenses would have been lower by $50 million.
Revenue
Under ASC 606, the volume, mix, and duration of contract types (support, SaaS, on-premises subscription) starting or renewing in any given period can have a material impact on revenue in the period, and as a result can impact the comparability of reported revenue period over period. We recognize revenue for the license portion of on-premises subscription contracts up front when we deliver the licenses to the customer, typically on the start date, and we recognize revenue on the support portion of on-premises subscription contracts and stand-alone support contracts ratably over the term. We continue to convert existing perpetual support contracts to on-premises subscriptions, resulting in a shift to up-front recognition of on-premises subscription license revenue in the period converted compared to ratable recognition for a perpetual support contract. Revenue from our cloud services (primarily SaaS) contracts is recognized ratably. We expect that over time a higher portion of our revenue will be recognized ratably as we continue to expand our SaaS offerings, release additional cloud functionality into our products, and migrate customers from on-premises subscriptions to SaaS. Given the different mix, duration and volume of new and renewing contracts in any period, year-over-year or sequential revenue can vary significantly.
Revenue by Line of Business
| (Dollar amounts in millions) | Year ended September 30, | Percent Change | ||||||||||||||
| 2023 | 2022 | Actual | Constant Currency | |||||||||||||
| License(1) | $ | 747.0 | $ | 782.7 | (5 | )% | (1 | )% | ||||||||
| Support and cloud services(2) | 1,199.5 | 987.6 | 21 | % | 25 | % | ||||||||||
| Total software revenue | 1,946.6 | 1,770.3 | 10 | % | 13 | % | ||||||||||
| Professional services | 150.5 | 163.1 | (8 | )% | (5 | )% | ||||||||||
| Total revenue | $ | 2,097.1 | $ | 1,933.3 | 8 | % | 12 | % |
(1)
Includes perpetual licenses and the license portion of on-premises subscription sales.
(2)
Includes support on perpetual licenses, the support portion of on-premises subscription sales, SaaS, and cloud services.
Software revenue in FY'23 benefited from contributions from ServiceMax, acquired early in Q2'23, and Codebeamer, acquired in Q3'22. Changes in foreign currency exchange rates were a headwind to year-over-year revenue growth.
Within software revenue, license revenue is impacted by the quantity and size of expiring and renewing multi-year on-premises subscription contracts, along with the duration of those contracts that start in the period. In FY'23, the weighted-average duration of contracts starting in the year decreased compared to FY'22 primarily due to a few high-value renewal contracts in FY'22 that had longer than typical durations. Because longer duration contracts typically have a higher total contract value, which drives the amount of upfront license revenue recognized for on-premises contracts, this year-over-year duration decrease represented a headwind to license revenue growth in FY'23.
Professional services revenue decreased in FY'23 as we continue to execute on our strategy of leveraging partners to deliver services rather than contracting to deliver services ourselves, including the Q3'22 sale of a portion of our PLM services business to ITC Infotech (which branded the business DxP Services). Changes in foreign currency exchange rates also contributed to the year-over-year revenue decline. These decreases were partially offset by ServiceMax professional services revenue.
Our expectation is that professional services revenue will continue to trend down over time as we execute on our partner strategy and deliver products that require less consulting and training services.
Software Revenue by Product Group
| (Dollar amounts in millions) | Year ended September 30, | Percent Change | ||||||||||||||
| 2023 | 2022 | Actual | Constant Currency | |||||||||||||
| Product lifecycle management (PLM) | $ | 1,186.0 | $ | 980.5 | 21 | % | 24 | % | ||||||||
| Computer-aided design (CAD) | 760.6 | 789.8 | (4 | )% | 0 | % | ||||||||||
| Software revenue | $ | 1,946.6 | $ | 1,770.3 | 10 | % | 13 | % |
PLM software revenue growth in FY'23 benefited from contributions from ServiceMax and Codebeamer. Changes in foreign currency exchange rates were a headwind to year-over-year revenue growth. Excluding contributions from ServiceMax and Codebeamer, constant currency revenue growth was driven by Windchill and IIoT in the Americas.
PLM ARR grew 36% (34% constant currency) from Q4’22 to Q4'23, driven by ServiceMax, which contributed $171 million of ARR; Windchill; IIoT; and Codebeamer.
CAD software revenue was negatively impacted by changes in foreign currency exchange rates. Constant currency revenue growth was flat due to decreases in Creo revenue in Europe due to shorter durations of on-premises subscription contracts, offset by Creo revenue growth in the Americas and Asia Pacific.
CAD ARR grew 12% (10% constant currency) in FY'23 compared to FY'22, driven by Creo.
Gross Margin
| (Dollar amounts in millions) | Year ended September 30, | |||||||||||
| 2023 | 2022 | Percent Change | ||||||||||
| License gross margin | $ | 693.8 | $ | 733.4 | (5 | )% | ||||||
| License gross margin percentage | 93 | % | 94 | % | ||||||||
| Support and cloud services gross margin | $ | 954.5 | $ | 802.8 | 19 | % | ||||||
| Support and cloud services gross margin percentage | 80 | % | 81 | % | ||||||||
| Professional services gross margin | $ | 7.7 | $ | 11.1 | (31 | )% | ||||||
| Professional services gross margin percentage | 5 | % | 7 | % | ||||||||
| Total gross margin | $ | 1,656.0 | $ | 1,547.4 | 7 | % | ||||||
| Total gross margin percentage | 79 | % | 80 | % | ||||||||
| Non-GAAP gross margin(1) | $ | 1,712.6 | $ | 1,595.7 | 7 | % | ||||||
| Non-GAAP gross margin percentage(1) | 82 | % | 83 | % |
(1) Non-GAAP financial measures are reconciled to GAAP results under Non-GAAP Financial Measures below.
License gross margin decreased in FY’23 compared to FY’22 due to lower license revenue and higher royalty expense.
Support and cloud services gross margin increased in FY’23 compared to FY’22 due to higher support and cloud services revenue, partially offset by increases in cost of support and cloud services, which were driven by higher royalty expenses, compensation costs, higher intangible amortization expense due to the ServiceMax acquisition, and cloud hosting costs.
Professional services gross margin decreased in FY’23 compared to FY’22 due to lower professional services revenue, offset by lower professional services costs. The decrease in professional services revenue is mainly due to the sale of a portion of our PLM services business in FY'22 and continued execution on our strategy of leveraging partners to deliver services rather than contracting to deliver services ourselves.
Operating Expenses
| (Dollar amounts in millions) | Year ended September 30, | |||||||||||
| 2023 | 2022 | Percent Change | ||||||||||
| Sales and marketing | $ | 530.1 | $ | 485.2 | 9 | % | ||||||
| % of total revenue | 25 | % | 25 | % | ||||||||
| Research and development | 394.4 | 338.8 | 16 | % | ||||||||
| % of total revenue | 19 | % | 18 | % | ||||||||
| General and administrative | 233.5 | 204.7 | 14 | % | ||||||||
| % of total revenue | 11 | % | 11 | % | ||||||||
| Amortization of acquired intangible assets | 40.0 | 35.0 | 14 | % | ||||||||
| % of total revenue | 2 | % | 2 | % | ||||||||
| Restructuring and other charges (credits), net | (0.5 | ) | 36.2 | (101 | )% | |||||||
| % of total revenue | 0 | % | 2 | % | ||||||||
| Total operating expenses | $ | 1,197.6 | $ | 1,100.0 | 9 | % |
Total headcount increased by 11% between FY'22 and FY'23, primarily driven by our acquisition of ServiceMax.
Operating expenses in FY'23 compared to FY'22 increased primarily due to the following:
a $90 million increase in compensation expense (including stock-based compensation and benefit costs), primarily due to our acquisition of ServiceMax;
a $12 million increase in marketing expense, primarily due to our Q3'23 LiveWorx event;
an $11 million increase in software subscriptions and internal hosting costs;
a $10 million increase in travel expenses;
partially offset by:
a $38 million decrease in restructuring charges, primarily due to the restructuring plan initiated and substantially completed in FY'22.
Interest Expense
| (Dollar amounts in millions) | Year ended September 30, | |||||||||||
| 2023 | 2022 | Percent Change | ||||||||||
| Interest and debt premium expense | $ | (129.4 | ) | $ | (54.3 | ) | 138 | % |
Interest expense includes interest on our revolving credit facility and term loan, our Senior Notes due 2025 and 2028, and imputed interest on the deferred payment of a portion of the ServiceMax purchase price. The increase in interest expense was driven by higher total debt and higher interest rates in FY'23 compared to FY'22, as well as $30 million of imputed interest associated with the ServiceMax deferred acquisition payment.
Other Income
| (Dollar amounts in millions) | Year ended September 30, | |||||||||||
| 2023 | 2022 | Percent Change | ||||||||||
| Interest income | $ | 5.4 | $ | 2.5 | 116 | % | ||||||
| Other income (expense), net | (1.9 | ) | 1.5 | (227 | )% | |||||||
| Other income, net | $ | 3.5 | $ | 4.0 | (13 | )% |
Other income (expense), net in FY'23 was related to foreign currency exchange losses. Other income (expense), net in FY’22 included $36 million of recognized gains from the sale of assets, primarily related to the sale of a portion of our PLM services business, offset by a $35 million loss associated with an equity investment in a publicly traded company.
Income Taxes
| (Dollar amounts in millions) | Year ended September 30, | |||||||||||
| 2023 | 2022 | Percent Change | ||||||||||
| Income before income taxes | $ | 332.6 | $ | 397.1 | (16 | )% | ||||||
| Provision for income taxes | 87.0 | 84.0 | 4 | % | ||||||||
| Effective income tax rate | 26 | % | 21 | % |
The effective tax rate for FY’23 was higher than the effective rate for FY’22, primarily due to tax expense of $21.8 million related to an uncertain tax position regarding transfer pricing in a foreign jurisdiction where we are currently under audit. Our rate was also impacted by tax expense of $6.3 million related to non-deductible imputed interest related to the deferred payment on the acquisition of ServiceMax Inc. Additionally, in FY'22, our rate included $8.1 million of tax expense arising from the basis difference on goodwill related to the sale of a portion of our PLM services business.
In the normal course of business, PTC and its subsidiaries are examined by various taxing authorities, including the IRS in the United States. We regularly assess the likelihood of additional assessments by tax authorities and provide for these matters as appropriate. We are currently under audit by tax authorities in several jurisdictions including Germany, Ireland, and Italy. Audits by tax authorities typically involve examination of the deductibility of certain permanent items, transfer pricing, limitations on net operating losses, and tax credits.
Liquidity and Capital Resources
| (in millions) | September 30, | |||||||
| 2023 | 2022 | |||||||
| Cash and cash equivalents | $ | 288.1 | $ | 272.2 | ||||
| Restricted cash | 0.7 | 0.7 | ||||||
| Total | $ | 288.8 | $ | 272.9 |
| (in millions) | Year ended September 30, | |||||||
| 2023 | 2022 | |||||||
| Net cash provided by operating activities | $ | 610.9 | $ | 435.3 | ||||
| Net cash used in investing activities | $ | (866.1 | ) | $ | (201.2 | ) | ||
| Net cash provided by (used in) financing activities | $ | 268.3 | $ | (264.1 | ) |
Cash, Cash Equivalents and Restricted Cash
We invest our cash with highly rated financial institutions. Cash and cash equivalents include highly liquid investments with original maturities of three months or less.
A significant portion of our cash is generated and held outside the U.S. As of September 30, 2023, we had cash and cash equivalents of $35 million in the U.S., $111 million in Europe, $121 million in Asia Pacific (including India), and $21 million in other non-U.S. countries. We have substantial cash requirements in the U.S., but believe that the combination of our existing U.S. cash and cash equivalents, our ability to repatriate cash to the U.S., future U.S. operating cash flows, and cash available under our revolving credit facility will be sufficient to meet our ongoing U.S. operating expenses and known capital requirements.
Cash Provided by Operating Activities
Cash provided by operating activities increased by $175.6 million in FY'23 compared to FY'22. This increase was driven by higher collections, including contributions from ServiceMax, offset by higher vendor disbursements and higher interest payments due to a higher debt burden and higher interest rates. Cash from operations in FY'23 includes $1.5 million of restructuring payments and $19.6 million of acquisition and transaction-related payments compared to $40.8 million of restructuring payments and $11.8 million of acquisition and transaction-related payments in FY'22.
Cash Used in Investing Activities
Cash used in investing activities in FY'23 was driven by the acquisition of ServiceMax, with $828.2 million paid in Q2'23. Cash used in investing activities in FY'22 was driven by the acquisition of the Codebeamer business for $278.1 million, offset by $46.9 million of proceeds from the sale of an investment and $32.5 million of proceeds from the sale of a portion of our PLM services business.
Cash Provided by (Used in) Financing Activities
Cash provided by financing activities in FY’23 was primarily related to net new borrowings of $771.0 million (a $500.0 million term loan and a $271.0 million incremental revolving line) to fund the ServiceMax acquisition and net repayments of $428.0 million on the new revolving facility. Cash used in financing activities in FY’22 includes repayments of $355.0 million under our credit facility and repurchases of common stock of $125.0 million, offset by borrowings of $264.0 million to fund our acquisition of the Codebeamer business.
Outstanding Debt
| (in millions) | September 30, 2023 | |||
| 4.000% Senior Notes due 2028 | $ | 500.0 | ||
| 3.625% Senior Notes due 2025 | 500.0 | |||
| Credit facility revolver line | 202.0 | |||
| Credit facility term loan | 500.0 | |||
| Total debt | 1,702.0 | |||
| Unamortized debt issuance costs for the Senior Notes | (6.2 | ) | ||
| Total debt, net of issuance costs | $ | 1,695.8 | ||
| Undrawn under credit facility revolver | $ | 1,048.0 | ||
| Undrawn under credit facility revolver available for borrowing | $ | 384.6 |
In addition to the debt shown in the above table, as of September 30, 2023, we had a $620 million deferred acquisition payment liability related to the fair value of the $650 million installment paid in October 2023 for the ServiceMax acquisition. Of the $650 million paid, $620 million has been recorded as a financing outflow and the $30 million of imputed interest has been recorded as an operating cash outflow in our Q1'24 financials. To finance this payment and the payment for the acquisition of pure-systems in Q1'24, we borrowed $740 million under the revolving line of our credit facility. This is described in Note 18. Subsequent Events of Notes to the Consolidated Financial Statements in this Annual Report.
As of September 30, 2023, we were in compliance with all financial and operating covenants of the credit facility and the Senior Note indentures. Any failure to comply with such covenants under the credit facility would prevent us from being able to borrow additional funds under the credit facility, and, as with any failure to comply with such covenants under the Senior Note indentures, could constitute a default that could cause all amounts outstanding to become due and payable immediately. Loans under the credit facility bear interest at variable rates which reset every 30 to 180 days. As of September 30, 2023, the annual rates for borrowings outstanding under the credit facility revolver line and term loan were both 7.2%.
Our credit facility and our Senior Notes are described in Note 9. Debt of Notes to the Consolidated Financial Statements in this Annual Report.
Expectations for 2024
We believe that existing cash and cash equivalents, together with cash generated from operations and amounts available under our credit facility, will be sufficient to meet our working capital and capital expenditure requirements (which we expect to be approximately $20 million in FY’24) through at least the next twelve months and to meet our known long-term capital requirements.
For the remainder of FY'24, we expect to use substantially all our cash generated from operating activities to repay debt outstanding under our credit facility revolving line.
Our expected uses and sources of cash could change, our cash position could be reduced, and we could incur additional debt obligations if we decide to retire other debt, engage in strategic transactions, or repurchase shares, any of which could be commenced, suspended, or completed at any time. Any such repurchases or retirement of debt will depend on prevailing market conditions, our liquidity requirements, contractual restrictions and other factors. The amounts involved in any debt retirement or issuance, share repurchases, or strategic transactions may be material.
Contractual Obligations
At September 30, 2023, our future contractual obligations were related to debt, deferred acquisition payments, leases, pension liabilities, unrecognized tax benefits, and purchase obligations. See Note 6. Acquisitions and Disposition of Businesses, Note 9. Debt, Note 17. Leases, Note 14. Pension Plans, and Note 8. Income Taxes of Notes to Consolidated Financial Statements in this Annual Report for information about those obligations, which Notes are incorporated by reference into this section. Our purchase obligations were approximately $164.7 million, with $75.9 million expected to be paid in FY'24 and $88.8 million thereafter. Purchase obligations represent minimum commitments due to third parties, including royalty contracts, research and development contracts, telecommunication contracts, information technology maintenance contracts in support of internal-use software and hardware, financing leases, operating leases with original terms of less than 12 months, and other marketing and consulting contracts. Contracts for which our commitment is variable or based on volumes with no fixed minimum quantities and contracts that can be canceled without payment penalties are not included in the purchase obligation amounts above. The purchase obligations included above are in addition to amounts included in Current liabilities and Prepaid expenses recorded on our September 30, 2023 Consolidated Balance Sheet.
As of September 30, 2023, we had letters of credit and bank guarantees outstanding of approximately $13.1 million (of which $0.5 million was collateralized).
Operating Measure
ARR
ARR (Annual Run Rate) represents the annualized value of our portfolio of active subscription software, cloud, SaaS, and support contracts as of the end of the reporting period. We calculate ARR as follows:
We consider a contract to be active when the product or service contractual term commences (the “start date”) until the right to use the product or service ends (the “expiration date”). Even if the contract with the customer is executed before the start date, the contract will not count toward ARR until the customer right to receive the benefit of the products or services has commenced.
For contracts that include annual values that increase over time, which we refer to as ramp contracts, we include in ARR only the annualized value of components of the contract that are considered active as of the date of the ARR calculation. We do not include any future committed increases in the contract value as of the date of the ARR calculation.
As ARR includes only contracts that are active at the end of the reporting period, ARR does not reflect assumptions or estimates regarding future customer renewals or non-renewals.
Active contracts are annualized by dividing the total active contract value by the contract duration in days (expiration date minus start date), then multiplying that by 365 days (or 366 days for leap years).
We believe ARR is a valuable operating measure to assess the health of a subscription business because it is aligned with the amount that we invoice the customer on an annual basis. We generally invoice customers annually for the current year of the contract. A customer with a one-year contract will typically be invoiced for the total value of the contract at the beginning of the contractual term, while a customer with a multi-year contract will be invoiced for each annual period at the beginning of each year of the contract.
ARR increases by the annualized value of active contracts that commence in a reporting period and decreases by the annualized value of contracts that expire in the reporting period.
As ARR is not annualized recurring revenue, it is not calculated based on recognized or unearned revenue and is not affected by variability in the timing of revenue under ASC 606, particularly for on-premises license subscriptions where a substantial portion of the total value of the contract is recognized as revenue at a point in time upon the later of when the software is made available, or the subscription term commences.
ARR should be viewed independently of recognized and unearned revenue and is not intended to be combined with, or to replace, either of those items. Investors should consider our ARR operating measure only in conjunction with our GAAP financial results.
Non-GAAP Financial Measures
The non-GAAP financial measures presented in the discussion of our results of operations and the respective most directly comparable GAAP measures are:
free cash flow—cash flow from operations
non-GAAP gross margin—GAAP gross margin
non-GAAP operating income—GAAP operating income
non-GAAP operating margin—GAAP operating margin
non-GAAP net income—GAAP net income
non-GAAP diluted earnings per share—GAAP diluted earnings per share
Free cash flow is cash flow from operations net of capital expenditures, which are expenditures for property and equipment and consist primarily of facility improvements, office equipment, computer equipment, and software. We believe that free cash flow, in conjunction with cash from operations, is a useful measure of liquidity since capital expenditures are a necessary component of ongoing operations.
The non-GAAP financial measures other than free cash flow exclude, as applicable: stock-based compensation expense; amortization of acquired intangible assets; acquisition and transaction-related charges included in General and administrative expenses; restructuring and other charges (credits), net; non-operating charges (credits), net; and income tax adjustments.
The items excluded from these non-GAAP financial measures are normally included in the comparable measures calculated and presented in accordance with GAAP. We do not include these items, which can vary significantly from period to period, when reviewing our operating results internally because we do not consider them to be part of our core operating results. Excluding them facilitates evaluation of our ongoing performance, our earnings trends, and comparisons to the performance of other companies in our industry. Management uses non-GAAP financial measures in conjunction with our GAAP results, as should investors.
Stock-based compensation is a non-cash expense relating to stock-based awards issued to executive officers, employees and outside directors, consisting of restricted stock units. We exclude this expense as it is a non-cash expense and we assess our internal operations excluding this expense and believe it facilitates comparisons to the performance of other companies in our industry.
Amortization of acquired intangible assets is a non-cash expense that is impacted by the timing and magnitude of our acquisitions. We believe the assessment of our operations excluding these costs is relevant to our assessment of internal operations and comparisons to the performance of other companies in our industry.
Acquisition and transaction-related charges included in General and administrative expenses are direct costs of potential and completed acquisitions and expenses related to acquisition integration activities, including transaction fees, due diligence costs, severance and professional fees. Subsequent adjustments to our initial estimated amount of contingent consideration associated with specific acquisitions are also included within acquisition and transaction-related charges. Other transactional charges include third-party costs related to structuring merger and acquisition transactions outside of ordinary business operations. We do not include these costs when reviewing our operating results internally. The occurrence and amount of these costs will vary depending on the timing and size of acquisitions and transactions.
Restructuring and other charges (credits), net includes excess facility restructuring charges (credits); impairment and accretion expense charges related to the lease assets of exited facilities; sublease income from previously impaired facilities; severance charges resulting from reductions of personnel; and third-party professional consulting fees related to modifications of our business strategy. These costs may vary in size based on our restructuring plan.
Non-operating charges (credits), net are gains or losses associated with sales or changes in value of assets or liabilities that are generally investing or financing in nature and are not indicative of our ongoing ordinary operating activities. In FY'23, we recognized a financing charge for a debt commitment agreement associated with our acquisition of ServiceMax. In FY'22, we recorded gains associated with the sale of assets, including the sale of a portion of our PLM services business, and we recorded a loss associated with the reduction in value of an equity investment in a publicly-traded company.
Income tax adjustments include the tax impact of the items above. Additionally, we exclude other material tax items that we do not include when reviewing our operating results internally. For example, in FY’23, adjustments include a charge related to an uncertain tax position in a foreign jurisdiction.
We use these non-GAAP financial measures, and we believe that they assist our investors, to make period-to-period comparisons of our operational performance because they provide a view of our operating results without items that are not, in our view, indicative of our core operating results. We believe that these non-GAAP financial measures help illustrate underlying trends in our business, and we use the measures to establish budgets and operational goals (communicated internally and externally) for managing our business and evaluating our performance. We believe that providing non-GAAP financial measures also affords investors a view of our operating results that may be more easily compared to the results of other companies in our industry that use similar financial measures to supplement their GAAP results.
The items excluded from the non-GAAP financial measures often have a material impact on our financial results and such items often recur. Accordingly, the non-GAAP financial measures included in this Annual Report should be considered in addition to, and not as a substitute for or superior to, the comparable measures prepared in accordance with GAAP. The following tables reconcile each of these non-GAAP financial measures to its most closely comparable GAAP measure on our financial statements.
| (in millions, except per share amounts) | Year ended September 30, | |||||||
| 2023 | 2022 | |||||||
| GAAP gross margin | $ | 1,656.0 | $ | 1,547.4 | ||||
| Stock-based compensation | 20.9 | 22.8 | ||||||
| Amortization of acquired intangible assets included in cost of revenue | 35.7 | 25.6 | ||||||
| Non-GAAP gross margin | $ | 1,712.6 | $ | 1,595.7 | ||||
| GAAP operating income | $ | 458.5 | $ | 447.4 | ||||
| Stock-based compensation | 206.5 | 174.9 | ||||||
| Amortization of acquired intangible assets | 75.7 | 60.5 | ||||||
| Acquisition and transaction-related charges | 18.7 | 13.2 | ||||||
| Restructuring and other charges (credits), net | (0.5 | ) | 36.2 | |||||
| Non-GAAP operating income | $ | 758.9 | $ | 732.2 | ||||
| GAAP net income | $ | 245.5 | $ | 313.1 | ||||
| Stock-based compensation | 206.5 | 174.9 | ||||||
| Amortization of acquired intangible assets | 75.7 | 60.5 | ||||||
| Acquisition and transaction-related charges | 18.7 | 13.2 | ||||||
| Restructuring and other charges (credits), net | (0.5 | ) | 36.2 | |||||
| Non-operating charges (credits), net(1) | 5.1 | (1.4 | ) | |||||
| Income tax adjustments(2) | (33.5 | ) | (55.1 | ) | ||||
| Non-GAAP net income | $ | 517.6 | $ | 541.5 | ||||
| GAAP diluted earnings per share | $ | 2.06 | $ | 2.65 | ||||
| Stock-based compensation | 1.73 | 1.48 | ||||||
| Total amortization of acquired intangible assets | 0.63 | 0.51 | ||||||
| Acquisition and transaction-related charges | 0.16 | 0.11 | ||||||
| Restructuring and other charges (credits), net | — | 0.31 | ||||||
| Non-operating charges (credits), net(1) | 0.04 | (0.01 | ) | |||||
| Income tax adjustments(2) | (0.28 | ) | (0.47 | ) | ||||
| Non-GAAP diluted earnings per share | $ | 4.34 | $ | 4.58 | ||||
| Cash flow from operations | $ | 610.9 | $ | 435.3 | ||||
| Capital expenditure | (23.8 | ) | (19.5 | ) | ||||
| Free cash flow | $ | 587.0 | $ | 415.8 |
(1)
In FY'23, we recognized $4.2 million of financing charges for a debt commitment agreement associated with our acquisition of ServiceMax. Net credits for FY'22 include a $29.8 million gain on the sale of a portion of our PLM services business, a $3.4 million gain on the sale of an asset, and a $3.0 million gain on the sale of an investment, offset by a $34.8 million charge from the reduction in value of an equity investment in a publicly-traded company.
(2)
Income tax adjustments reflect the tax effects of non-GAAP adjustments which are calculated by applying the applicable tax rate by jurisdiction to the non-GAAP adjustments listed above. In FY'23, non-GAAP expense excludes $21.8 million related to uncertain tax positions in a foreign jurisdiction.
Operating margin impact of non-GAAP adjustments:
| Year ended September 30, | ||||||||
| 2023 | 2022 | |||||||
| GAAP operating margin | 21.9 | % | 23.1 | % | ||||
| Stock-based compensation | 9.8 | % | 9.0 | % | ||||
| Total amortization of acquired intangible assets | 3.6 | % | 3.1 | % | ||||
| Acquisition and transaction-related charges | 0.9 | % | 0.7 | % | ||||
| Restructuring and other charges (credits), net | (— | )% | 1.9 | % | ||||
| Non-GAAP operating margin | 36.2 | % | 37.9 | % |
Critical Accounting Policies and Estimates
We have prepared our consolidated financial statements in accordance with accounting principles generally accepted in the United States of America. In preparing our financial statements, we make estimates, assumptions and judgments that can have a significant impact on our reported revenues, results of operations, and net income, as well as on the value of certain assets and liabilities on our balance sheet. These estimates, assumptions and judgments are made based on our historical experience and on other assumptions that we believe to be reasonable under the circumstances. These estimates may change as new events occur or additional information is obtained, and we may periodically be faced with uncertainties, the outcomes of which are not within our control and may not be known for a prolonged period of time.
The accounting policies, methods and estimates used to prepare our financial statements are described generally in Note 2. Summary of Significant Accounting Policies of Notes to Consolidated Financial Statements in this Annual Report. The most important accounting judgments and estimates that we made in preparing the financial statements involved:
revenue recognition;
accounting for income taxes; and
valuation of assets and liabilities acquired in business combinations.
A critical accounting policy is one that is both material to the presentation of our financial statements and requires us to make subjective or complex judgments that could have a material effect on our financial condition and results of operations. Critical accounting policies require us to make assumptions about matters that are uncertain at the time of the estimate, and different estimates that we could have used, or changes in the estimates that are reasonably likely to occur, may have a material impact on our financial condition or results of operations. Because the use of estimates is inherent in the financial reporting process, actual results could differ from those estimates.
Accounting policies, guidelines and interpretations related to our critical accounting policies and estimates are generally subject to numerous sources of authoritative guidance and are often reexamined by accounting standards rule makers and regulators. These rule makers and/or regulators may promulgate interpretations, guidance or regulations that may result in changes to our accounting policies, which could have a material impact on our financial position and results of operations.
Revenue Recognition
We record revenues in accordance with the guidance provided by ASC 606, Revenue from Contracts with Customers. For a full description of our revenue accounting policy, refer to Note 2. Summary of Significant Accounting Policies, included in the Notes to Consolidated Financial Statements in this Annual Report.
Our sources of revenue include: (1) subscriptions, (2) perpetual licenses, (3) support for perpetual licenses, and (4) professional services. Subscriptions include term-based on-premises licenses and related support, Software-as-a-Service (SaaS), and hosting services.
Judgments and Estimates
Determination of performance obligations. Our subscriptions are frequently sold as a bundle of products and services, typically pairing on-premises term software licenses with support and, for certain offerings, cloud services over the same term. Significant judgment is used in determining the performance obligations related to these bundled products and services. On-premises software is typically determined to be a distinct performance obligation and is thus recognized separately from the support and cloud components. On-premises license software revenue is generally recognized at the point in time that the software is made available to the customer, while the support and cloud software revenue components are recognized ratably over the term of the contract. In cases where subscriptions include cloud functionality and on-premises software, an assessment has been performed to determine whether the cloud services are distinct from the on-premises software. In the substantial majority of instances, cloud services provide incremental functionality to customers and have been considered distinct and recognized separately from the on-premises software. This assessment could have a significant impact on the timing of revenue recognition and may change as our product offerings evolve.
Allocation of transaction price. We estimate the standalone selling price of each identified performance obligation and use that estimate to allocate the transaction price among said performance obligations. The estimated standalone selling price is determined using all information reasonably available to us, including market conditions and other observable inputs. Significant judgment is used in determining the standalone selling prices of the on-premises license, support, and cloud components of our subscription products. These estimates are subject to change as our product offerings change and could have a significant impact due to the difference in the timing of revenue recognition for on-premises licenses versus support and cloud.
Right to exchange. Our multi-year, non-cancellable subscription contracts provide customers with an annual right to exchange software within the original subscription with other software. When it applies to on-premises licenses, we account for this right as a liability. For most contracts, we use the expected value method to determine the liability associated with this right across a portfolio of contracts. Where contracts are outside of the standard portfolio of contracts due to contract size, longer contract duration, or other unique contractual terms, we use the most likely amount method to determine the liability for each individual contract. In both circumstances, the transaction price is constrained based on our estimates, which impacts the amount of revenue recognized. Changes in these estimates could significantly impact revenue for any given period.
Accounting for Income Taxes
As part of the process of preparing our consolidated financial statements, we are required to calculate our income tax expense based on taxable income by jurisdiction. There are many transactions and calculations about which the ultimate tax outcome is uncertain; as a result, our calculations involve estimates by management. Some of these uncertainties arise as a consequence of revenue-sharing, cost-reimbursement and transfer pricing arrangements among related entities and the differing tax treatment of revenue and cost items across various jurisdictions. If we were compelled to revise or to account differently for our arrangements, that revision could affect our recorded tax liabilities.
The income tax accounting process also involves estimating our actual current tax liability, together with assessing temporary differences resulting from differing treatment of items for tax and accounting purposes. These differences result in deferred tax assets and liabilities, which are included within our consolidated balance sheets. We must then assess the likelihood that our deferred tax assets will be recovered from future taxable income and, to the extent we believe that it is more likely than not that all or a portion of our deferred tax assets will not be realized, we must establish a valuation allowance as a charge to income tax expense.
We have unrecognized tax benefits as of September 30, 2023 of $50.7 million. Although we believe our tax estimates are appropriate, the final determination of tax audits and any related litigation could result in favorable or unfavorable changes in our estimates. We believe it is reasonably possible that within the next 12 months the amount of unrecognized tax benefits related to the resolution of multi-jurisdictional tax positions could be reduced by up to $26 million as audits close and statutes of limitations expire.
As of September 30, 2023, we have a valuation allowance of $17.4 million against net deferred tax assets in the U.S. and a valuation allowance of $4.3 million against net deferred tax assets in certain foreign jurisdictions. The valuation allowance recorded in the U.S. relates to Massachusetts tax credit carryforwards that we do not expect to realize a benefit from prior to expiration.
The valuation allowance recorded against net deferred tax assets of certain foreign jurisdictions is established primarily for our capital loss carryforwards, the majority of which do not expire. However, there are limitations imposed on the utilization of such capital losses that could further restrict the recognition of any tax benefits. We will continue to reassess our valuation allowance requirements each financial reporting period.
Prior to the passage of the U.S. Tax Act, we asserted that substantially all of the undistributed earnings of its foreign subsidiaries were considered indefinitely invested and accordingly, no deferred taxes were provided. Pursuant to the provisions of the U.S. Tax Act, these earnings were subjected to a one-time transition tax and there is therefore no longer a material cumulative basis difference associated with the undistributed earnings. We maintain our assertion to permanently reinvest these earnings outside the U.S. unless repatriation can be done substantially tax-free, with the exception of a foreign holding company formed in 2018 and our Taiwan subsidiary. If we decide to repatriate any additional non-U.S. earnings in the future, we may be required to establish a deferred tax liability on such earnings. The amount of unrecognized deferred tax liability on the undistributed earnings would not be material.
In the normal course of business, PTC and its subsidiaries are examined by various taxing authorities, including the Internal Revenue Service (IRS) in the U.S. We regularly assess the likelihood of additional assessments by tax authorities and provide for these matters as appropriate. We are currently under audit by tax authorities in several jurisdictions. Audits by tax authorities typically involve examination of the deductibility of certain permanent items, transfer pricing, limitations on net operating losses and tax credits. Although we believe our tax estimates are appropriate, the final determination of tax audits and any related litigation could result in material changes in our estimates.
Valuation of Assets and Liabilities Acquired in Business Combinations
In accordance with business combination accounting, we allocate the purchase price of acquired companies to the tangible and intangible assets acquired and liabilities assumed based on their estimated fair values. Determining these fair values requires management to make significant estimates and assumptions, especially with respect to intangible assets.
Our identifiable intangible assets acquired consist of purchased software, tradenames, customer lists and contracts, and software support agreements and related relationships. Purchased software consists of products that have reached technological feasibility and the combination of processes, inventions and trade secrets related to the design and development of acquired products. Customer lists and contracts and software support agreements and related relationships represent the underlying relationships and agreements with customers of the acquired company’s installed base. We have
generally valued intangible assets using discounted cash flow models. Critical estimates in valuing certain of the intangible assets include but are not limited to:
future expected revenues and costs related to software license sales, customer support agreements, customer contracts and related customer relationships and acquired developed technologies and trademarks and trade names; and
discount rates used to determine the present value of estimated future cash flows.
In addition, we estimate the useful lives of our intangible assets based upon the expected period over which we anticipate generating economic benefits from the related intangible asset.
Net tangible assets consist of the fair values of tangible assets less the fair values of assumed liabilities and obligations. Except for deferred revenues, net tangible assets were generally valued by us at the respective carrying amounts recorded by the acquired company, if we believed that their carrying values approximated their fair values at the acquisition date. For acquisitions completed prior to FY'22, the values assigned to deferred revenue reflect an amount equivalent to the estimated cost plus an appropriate profit margin to perform the services related to the acquired company’s software support contracts. During FY'22, we adopted ASU 2021-08, whereby deferred revenue for acquisitions completed in FY'22 and thereafter reflect the amounts that would have been deferred as of the acquisition date in accordance with ASC 606.
In addition, uncertain tax positions and tax-related valuation allowances assumed in connection with a business combination are initially estimated as of the acquisition date. We reevaluate these items quarterly with any adjustments to our preliminary estimates being recorded to goodwill provided that we are within the measurement period (up to one year from the acquisition date) and we continue to collect information in order to determine their estimated values. Subsequent to the measurement period or our final determination of the estimated value of uncertain tax positions or tax-related valuation allowances, whichever comes first, changes to these uncertain tax positions and tax-related valuation allowances will affect our provision for income taxes in our Consolidated Statements of Operations.
Our estimates of fair value are based upon assumptions believed to be reasonable at that time, but which are inherently uncertain and unpredictable. Assumptions may be incomplete or inaccurate, and unanticipated events and circumstances may occur, which may affect the accuracy or validity of such assumptions, estimates or actual results.
When events or changes in circumstances indicate that the carrying value of a finite-lived intangible asset may not be recoverable, we perform an assessment of the asset for potential impairment. This assessment is based on projected undiscounted future cash flows over the asset’s remaining life. If the carrying value of the asset exceeds its undiscounted cash flows, we record an impairment loss equal to the excess of the carrying value over the fair value of the asset, determined using projected discounted future cash flows of the asset.
Recent Accounting Pronouncements
In accordance with recently issued accounting pronouncements, we will be required to comply with certain changes in accounting rules and regulations, none of which are expected to have a material impact on our consolidated financial statements.
Off-Balance Sheet Arrangements
We have not created, and are not party to, any special-purpose or off-balance sheet entities for the purpose of raising capital, incurring debt or operating parts of our business that are not consolidated (to the extent of our ownership interest therein) into our financial statements. We have not entered into any transactions with unconsolidated entities whereby we have subordinated retained interests, derivative instruments or other contingent arrangements that expose us to material continuing risks, contingent liabilities, or any other obligation under a variable interest in an unconsolidated entity that provides financing, liquidity, market risk or credit risk support to us.
Item 7A. Quantitative and Qualitative Disclosures about Market Risk
We face exposure to financial market risks, including adverse movements in foreign currency exchange rates and changes in interest rates. These exposures may change over time as business practices evolve and could have a material adverse impact on our financial results.
Foreign currency exchange risk
Our earnings and cash flows are subject to fluctuations due to changes in foreign currency exchange rates. Our most significant foreign currency exposures relate to Eurozone countries, Japan, Sweden, Switzerland, China and India. We enter into foreign currency forward contracts and options to manage our exposure to fluctuations in foreign exchange rates that arise from receivables and payables denominated in foreign currencies. We do not enter into or hold foreign currency derivative financial instruments for trading or speculative purposes.
Our non-U.S. revenues generally are transacted through our non-U.S. subsidiaries and typically are denominated in their local currency. In addition, expenses that are incurred by our non-U.S. subsidiaries typically are denominated in their local currency. Approximately 50% of our revenue and 35% of our expenses were transacted in currencies other than the U.S. Dollar. Currency translation affects our reported results because we report our results of operations in U.S. Dollars. Historically, our most significant currency risk has been changes in the Euro and Japanese Yen relative to the U.S. Dollar. Based on current revenue and expense levels (excluding restructuring charges and stock-based compensation), a $0.10 change in the USD to EUR exchange rate and a 10 Yen change in the Yen to USD exchange rate would impact operating income by approximately $30 million and $6 million, respectively.
Our exposure to foreign currency exchange rate fluctuations arises in part from intercompany transactions, with most intercompany transactions occurring between a U.S. Dollar functional currency entity and a foreign currency denominated entity. Intercompany transactions typically are denominated in the local currency of the non-U.S. Dollar functional currency subsidiary in order to centralize foreign currency risk. Also, both PTC (the parent company) and our non-U.S. subsidiaries may transact business with our customers and vendors in a currency other than their functional currency (transaction risk). In addition, we are exposed to foreign exchange rate fluctuations as the financial results and balances of our non-U.S. subsidiaries are translated into U.S. Dollars (translation risk). If sales to customers outside the United States increase, our exposure to fluctuations in foreign currency exchange rates will increase.
Our foreign currency risk management strategy is principally designed to mitigate the future potential financial impact of changes in the U.S. Dollar value of balances denominated in foreign currency, resulting from changes in foreign currency exchange rates. Our foreign currency hedging program uses forward contracts and options to manage the foreign currency exposures that exist as part of our ongoing business operations. The contracts are primarily denominated in the Euro, Swedish Krona, and Swiss Franc currencies, and have maturities of less than four months.
The majority of our foreign currency forward contracts and options are not designated as hedges for accounting purposes, and changes in the fair value of these instruments are recognized immediately in earnings. Because we enter into these derivative contracts only as an economic hedge, any gain or loss on the underlying foreign-denominated balance would be offset by the loss or gain on the derivative contract. Gains and losses on these derivatives and foreign currency denominated receivables and payables are included in Other income, net.
As of September 30, 2023 and 2022, we had outstanding forward contracts for derivatives not designated as hedging instruments with notional amounts equivalent to the following:
| September 30, | ||||||||
| Currency Hedged (in thousands) | 2023 | 2022 | ||||||
| Canadian Dollar / U.S. Dollar | $ | 5,135 | $ | 2,731 | ||||
| Euro / U.S. Dollar | 383,227 | 316,869 | ||||||
| British Pound / U.S. Dollar | 6,058 | 7,368 | ||||||
| Israeli Shekel / U.S. Dollar | 11,852 | 12,052 | ||||||
| Japanese Yen / U.S. Dollar | 4,770 | 25,566 | ||||||
| Swiss Franc / U.S. Dollar | 32,766 | 25,559 | ||||||
| Swedish Krona / U.S. Dollar | 35,085 | 35,713 | ||||||
| Singapore Dollar / U.S. Dollar | — | 3,637 | ||||||
| Chinese Renminbi / U.S. Dollar | 16,660 | 23,965 | ||||||
| New Taiwan Dollar / U.S. Dollar | 11,855 | 13,906 | ||||||
| Korean Won / U.S. Dollar | 6,157 | 4,919 | ||||||
| Danish Krone / U.S. Dollar | 6,731 | 3,192 | ||||||
| Australian Dollar / U.S. Dollar | 452 | 3,269 | ||||||
| All other | 2,888 | 4,432 | ||||||
| Total | $ | 523,636 | $ | 483,178 |
Debt
In addition to the $1 billion due under our 2025 and 2028 Senior Notes, as of September 30, 2023, we had $702 million outstanding under our credit facility. We also had a $620 million deferred acquisition payment liability related to the fair value of the $650 million installment for the ServiceMax acquisition, which we paid in October 2023 leveraging financing from our credit facility. Loans under the credit facility bear interest at variable rates which reset every 30 to 180 days depending on the rate and period selected by us. These loans are subject to interest rate risk as interest rates will be adjusted at each rollover date to the extent such amounts are not repaid. As of September 30, 2023, the annual rate on the credit facility loans was 7.18%. If there were a 100 basis point change in interest rates, the annual net impact to earnings and cash flows would be $7 million. This change in cash flows and earnings has been calculated based on the borrowings outstanding at September 30, 2023 and a 100 basis point per annum change in interest rate applied over a one-year period.
Cash and cash equivalents
As of September 30, 2023, cash equivalents were invested in highly liquid investments with maturities of three months or less when purchased. We invest our cash with highly rated financial institutions in North America, Europe and Asia Pacific and in diversified domestic and international money market mutual funds. At September 30, 2023, we had cash and cash equivalents of $35 million in the United States, $111 million in Europe, $121 million in Asia Pacific (including India), and $21 million in other non-U.S. countries. Given the short maturities and investment grade quality of the portfolio holdings at September 30, 2023, a hypothetical 10% change in interest rates would not materially affect the fair value of our cash and cash equivalents.
Our invested cash is subject to interest rate fluctuations and, for non-U.S. operations, foreign currency exchange rate risk. In a declining interest rate environment, we would experience a decrease in interest income. The opposite holds true in a rising interest rate environment. Over the past several years, the U.S. Federal Reserve Board, European Central Bank and Bank of England have changed certain benchmark interest rates, which has led to declines and increases in market interest rates. These changes in market interest rates have resulted in fluctuations in interest income earned on our cash and cash equivalents. Interest income will continue to fluctuate based on changes in market interest rates and levels of cash available for investment. Changes in foreign currencies relative to the U.S. Dollar had a favorable impact of $2.9 million and an unfavorable impact of $24.2 million on our consolidated cash balances in FY'23 and FY'22, respectively. The impact in FY'23 was due in particular to changes in the Euro and the Korean Won.
Item 8. Financial Statements and Supplementary Data
The consolidated financial statements and notes to the consolidated financial statements are attached as APPENDIX A.
Item 9. Changes in and Disagreements with Accountants on Accounting and Financial Disclosure
None.
Item 9A. Controls and Procedures
Evaluation of Disclosure Controls and Procedures
Our management maintains disclosure controls and procedures as defined in Rules 13a-15(e) and 15d-15(e) under the Securities Exchange Act of 1934, as amended (the “Exchange Act”) that are designed to provide reasonable assurance that information required to be disclosed in our reports filed or submitted under the Exchange Act is processed, recorded, summarized and reported within the time periods specified in the SEC’s rules and forms, and that such information is accumulated and communicated to our management, including our Chief Executive Officer and Chief Financial Officer (our principal executive officer and principal financial officer, respectively), as appropriate, to allow for timely decisions regarding required disclosure.
As required by SEC Rule 15d-15(b), we carried out an evaluation, under the supervision and with the participation of management, including our principal executive and principal financial officers, of the effectiveness of the design and operation of our disclosure controls and procedures as of the end of the period covered by this Annual Report. Based on this evaluation, we concluded that our disclosure controls and procedures were effective at the reasonable assurance level as of September 30, 2023.
Management excluded ServiceMax from its assessment of internal control over financial reporting as of September 30, 2023 because it was acquired in a business combination in the current fiscal year. ServiceMax's total assets and total revenues represent approximately 1% (excluding the impact of goodwill and intangibles from the acquisition) and 7%, respectively, of our total assets and total revenues, as of and for the year ended September 30, 2023.
Management’s Annual Report on Internal Control over Financial Reporting
Our management is responsible for establishing and maintaining adequate internal control over financial reporting. Internal control over financial reporting is defined in Rules 13a-15(f) and 15d-15(f) of the Exchange Act as a process designed by, or under the supervision of, our principal executive and principal financial officers and effected by our board of directors, management and other personnel, to provide reasonable assurance regarding the reliability of financial reporting and the preparation of financial statements for external purposes in accordance with generally accepted accounting principles and includes those policies and procedures that:
Pertain to the maintenance of records that in reasonable detail accurately and fairly reflect the transactions and dispositions of our assets;
Provide reasonable assurance that transactions are recorded as necessary to permit preparation of financial statements in accordance with generally accepted accounting principles, and that our receipts and expenditures are being made only in accordance with authorizations of our management and directors; and
Provide reasonable assurance regarding prevention or timely detection of unauthorized acquisition, use or disposition of our assets that could have a material effect on the financial statements.
Because of its inherent limitations, internal control over financial reporting may not prevent or detect misstatements. Projections of any evaluation of effectiveness to future periods are subject to the risk that controls may become inadequate because of changes in conditions, or that the degree of compliance with the policies or procedures may deteriorate.
Our management assessed the effectiveness of our internal control over financial reporting as of September 30, 2023 using the criteria set forth by the Committee of Sponsoring Organizations of the Treadway Commission (COSO) in Internal Control-Integrated Framework (2013). Based on this assessment and those criteria, our management concluded that, as of September 30, 2023, our internal control over financial reporting was effective.
The effectiveness of our internal control over financial reporting as of September 30, 2023 has been audited by PricewaterhouseCoopers LLP, an independent registered public accounting firm, as stated in their report, which appears under Item 8.
Changes in Internal Control over Financial Reporting
There was no change in our internal control over financial reporting that occurred during the quarter ended September 30, 2023 that has materially affected, or is reasonably likely to materially affect, our internal control over financial reporting.
Item 9B. Other Information
Item 5.02 Departure of Directors or Certain Officers; Election of Directors; Appointment of Certain Officers; Compensatory Arrangements of Certain Officers.
On November 16, 2023, Michael DiTullio, President and Chief Operating Officer of the Company, Kristian Talvitie, Executive Vice President, Chief Financial Officer, Catherine Kniker, Executive Vice President, Chief Strategy and Marketing Officer, and Aaron von Staats, Executive Vice President, General Counsel entered into new Executive Agreements with PTC Inc. (the “Company”). The new Executive Agreements replace the executives’ existing Executive Agreements with the Company.
The Executive Agreements provide certain compensation and employment protections to the executives. Each Executive Agreement provides that, upon a change in control of the Company, (i) all performance measures under any outstanding equity award held by the executive will be deemed to have been met at the target level, and (ii) the executive will receive a payment in an amount equal to the pro-rata portion of the executive’s target incentive bonus for the current year. Upon any termination of the executive’s employment after a change in control of the Company, (i) all equity awards held by the executive will accelerate and vest in full, (ii) the executive will receive a payment in an amount equal to: (a) 100% of the executive’s highest base salary in the six months preceding the termination date, plus (b) 100% of the executive’s highest applicable target bonus, and (iii) the executive will be entitled to continued participation in the Company’s medical, dental and vision benefit plans (the “Benefit Plans”) for one year, or payment of an amount sufficient to purchase substantially equivalent benefits if continued participation is not permitted under the applicable Benefit Plan or if the Benefit Plan is terminated. The Executive Agreement also provides that, upon termination of the executive’s employment by the Company without cause (i) the executive will receive a payment in an amount equal to 100% of the executive’s highest base salary in the six months preceding the termination date plus 100% of the executive’s target bonus for the year in which the termination occurs, (ii) all equity awards held by the executive that would have vested in the twelve months following the termination date will vest, and (iii) the executive will be entitled to continued participation in the Benefit Plans or payment in lieu thereof as described above. The Executive Agreement also provides that upon termination of the executive’s employment by the Company due to the executive’s death or disability, all equity held by the executive will vest in full. Mr. DiTullio’s Executive Agreement also provides that if he voluntarily terminates his employment after September 30, 2025, or if he is terminated without cause, all outstanding equity held by him will continue to vest after such termination in accordance with its terms, which continued equity vesting after termination without cause replaces the equity acceleration described above in the event of termination without cause. To receive the payments and benefits under the Executive Agreement, the
executive must execute a release of claims in favor of the Company and continue to comply with the terms of the executive’s Proprietary Information Agreement with the Company. The preceding description of the Executive Agreements is qualified by reference to the full text of such agreements, copies of which are filed as Exhibits 10.5 and 10.6 of this Form 10-K.
Insider Trading Arrangements
Our Section 16 officers and directors may enter into plans or arrangements for the purchase or sale of our securities that are intended to satisfy the affirmative defense conditions of Rule 10b5-1(c) of the Exchange Act. Such plans and arrangements must comply in all respects with our insider trading policies, including our policy governing entry into and operation of 10b5-1 plans and arrangements.
During the quarter ended September 30, 2023, the following Section 16 officers and directors adopted Rule 10b5-1 trading arrangements (as defined in Item 408 of Regulation S-K of the Exchange Act). All plans adopted covered only sales of PTC common stock. No plans were modified or terminated.
| Name and Title of Director or Section 16 Officer | Date of Adoption, Modification, or Termination | Duration of the Plan | Aggregate Number of Shares of Common Stock that may be Sold under the Plan | |||
| James Heppelmann, Chairman and Chief Executive Officer | Adopted August 7, 2023 | Ends February 12, 2024 | 35,000 | |||
| Kristian Talvitie, Executive Vice President, Chief Financial Officer | Adopted August 31, 2023 | Ends February 29, 2024 | 22,240 | |||
| Catherine Kniker**,** Executive Vice President, Chief Strategy and Marketing Officer | Adopted August 15, 2023 | Ends August 8, 2024 | 4,857, plus all net vested shares issued for the FY2023 Corporate Incentive Plan, plus all shares purchased under the 2016 Employee Stock Purchase Plan for the offering periods ending on January 31, 2024 and July 31, 2024(1)(2) | |||
| Aaron von Staats**,**Executive Vice President, General Counsel | Adopted August 24, 2023 | Ends May 31, 2024 | 3,835, plus all net vested shares issued for the FY2023 Corporate Incentive Plan, plus 40.5% of total shares that vest on November 15, 2023 under the performance-based RSU awards granted on November 17, 2020, November 17, 2021, and November 16, 2022(1)(3) |
(1)
The total number of shares that would be issued for the FY2023 Corporate Incentive Plan could not be known when the plan was adopted as the FY2023 performance period had not yet ended and attainment of the performance measure was not known.
(2)
The total number of shares that will be purchased under the 2016 Employee Stock Purchase Plan for the offering periods ending January 31, 2024 and July 31, 2024 could not be known when the plan was adopted.
(3)
The total number of shares that would be earned and vested under the performance-based RSU awards for the FY2023 performance period could not be known when the plan was adopted as the FY2023 performance period had not yet ended and attainment of the performance measures was not known.
Item 9C. Disclosure Regarding Foreign Jurisdictions that Prevent Inspections
Not applicable.
PART III
Item 10. Directors, Executive Officers and Corporate Governance
The information required by this item with respect to our directors and executive officers may be found under the headings “Proposal 1: Election of Directors,” “Corporate Governance,” "Information About Our Executive Officers," and “Transactions with Related Persons” appearing in our 2024 Proxy Statement. Such information is incorporated herein by reference.
Code of Ethics for Senior Executive Officers
We have adopted a Code of Ethics for Senior Executive Officers that applies to our Chief Executive Officer, President, Chief Financial Officer, and Controller, as well as others. The Code is embedded in our Code of Business Conduct and Ethics applicable to all employees. A copy of the Code of Business Conduct and Ethics is publicly available on our website at www.ptc.com. If we make any substantive amendments to, or grant any waiver from, including any implicit waiver, the Code of Ethics for Senior Executive Officers to or for our Chief Executive Officer, President, Chief Financial Officer or Controller, we will disclose the nature of such amendment or waiver in a current report on Form 8-K.
Item 11. Executive Compensation
Information with respect to director and executive compensation may be found under the headings “Director Compensation,” “Compensation Discussion and Analysis,” “Compensation Committee Report,” “Compensation Tables,” and “Pay Ratio Disclosure” appearing in our 2024 Proxy Statement. Such information is incorporated herein by reference.
Item 12. Security Ownership of Certain Beneficial Owners and Management and Related Stockholder Matters
Information about our common stock ownership may be found under the heading “Information about PTC Common Stock Ownership” appearing in our 2024 Proxy Statement. Such information is incorporated herein by reference.
EQUITY COMPENSATION PLAN INFORMATION
as of September 30, 2023
| Plan Category | Number of securities to be issued upon exercise of outstanding options, warrants and rights | Weighted-average exercise price of outstanding options, warrants and rights | Number of securities remaining available for future issuance under equity compensation plans | ||||||||||
| Equity compensation plans approved by security holders: | |||||||||||||
| 2000 Equity Incentive Plan(1) | 2,580,222 | — | 7,257,075 | ||||||||||
| 2016 Employee Stock Purchase Plan(2) | — | — | 2,223,947 | ||||||||||
| Total | 2,580,222 | — | 9,481,022 |
(1)
All of the shares issuable upon vesting are restricted stock units, which have no exercise price.
(2)
This amount represents the total number of shares remaining available under the 2016 Employee Stock Purchase Plan, of which 105,794 shares are subject to purchase during the current offering period.
Item 13. Certain Relationships and Related Transactions, and Director Independence
Information with respect to this item may be found under the headings “Independence of Our Directors,” “Review of Transactions with Related Persons” and “Transactions with Related Persons” appearing in our 2024 Proxy Statement. Such information is incorporated herein by reference.
Item 14. Principal Accounting Fees and Services
Information with respect to this item may be found under the headings “Engagement of Independent Auditor and Approval of Professional Services and Fees” and “PricewaterhouseCoopers LLP Professional Services and Fees” in our 2024 Proxy Statement. Such information is incorporated herein by reference.
PART IV
Item 15. Exhibits and Financial Statement Schedules
(a) Documents Filed as Part of Form 10-K
| 1. | Financial Statements | |
| Report of Independent Registered Public Accounting Firm (PricewaterhouseCoopers LLP, Boston, MA, PCAOB ID: 238) | F-1 | |
| Consolidated Balance Sheets as of September 30, 2023 and 2022 | F-4 | |
| Consolidated Statements of Operations for the years ended September 30, 2023, 2022 and 2021 | F-5 | |
| Consolidated Statements of Comprehensive Income for the years ended September 30, 2023, 2022 and 2021 | F-6 | |
| Consolidated Statements of Cash Flows for the years ended September 30, 2023, 2022 and 2021 | F-7 | |
| Consolidated Statements of Stockholders’ Equity for the years ended September 30, 2023, 2022 and 2021 | F-8 | |
| Notes to Consolidated Financial Statements | F-9 | |
| 2. | Financial Statement Schedules | |
| Schedules have been omitted since they are either not required, not applicable, or the information is otherwise included in the Financial Statements per Item 15(a)1 above. | ||
| 3. | Exhibits | |
| The list of exhibits in the Exhibit Index is incorporated herein by reference. |
(b) Exhibits
We hereby file the exhibits listed in the attached Exhibit Index.
(c) Financial Statement Schedules
None.
Item 16. Form 10-K Summary
None.
EXHIBIT INDEX
| 10.3.1* | — | Executive Agreement by and between the Company and James Heppelmann dated September 30, 2020 (filed as Exhibit 10.1 to our Current Report on Form 8-K dated September 30, 2020 (File No. 0-18059) and incorporated herein by reference). |
| 10.3.2* | [Amendment No. 1 to Executive Agreement by and between the Company and James Heppelmann dated February 16, 2023 (filed as Exhibit 10.3 to our Current Report on Form 8-K filed on February 21, 2023 (File No. 0-18059) and incorporated herein by reference).](https://www.sec.gov/Archives/edgar/data/857005/000095017023003309 |
Showing the first 8K of 174K characters. Open the full section