 filings.tools
Quanta Services 10-K 2018-12-31
Filed 2019-02-28. 22 sections, 652K characters. Original on sec.gov · Markdown · JSON
Cover and table of contents
UNITED STATES SECURITIES AND EXC****HANGE COMMISSION
Washington, D.C. 20549
Form 10-K
| (Mark One) | ||
| þ | ANNUAL REPORT PURSUANT TO SECTION 13 OR 15(d) OF THE SECURITIES EXCHANGE ACT OF 1934 |
For the fiscal year ended December 31, 2018
| ¨ | TRANSITION REPORT PURSUANT TO SECTION 13 OR 15(d) OF THE SECURITIES EXCHANGE ACT OF 1934 |
Commission file number 001-13831
Quanta Services, Inc.
(Exact name of registrant as specified in its charter)
| Delaware | 74-2851603 | |
| (State or other jurisdiction of incorporation or organization) | (I.R.S. Employer Identification No.) |
2800 Post Oak Boulevard, Suite 2600
Houston, Texas 77056
(Address of principal executive offices, including zip code)
(713) 629-7600
(Registrant’s telephone number, including area code)
Securities registered pursuant to Section 12(b) of the Act:
| Title of Each Class | Name of Exchange on Which Registered | |
| Common Stock, $0.00001 par value | New York Stock Exchange |
Securities registered pursuant to Section 12(g) of the Act:
Title of Each Class
None
Indicate by check mark if the Registrant is a well-known seasoned issuer, as defined in Rule 405 of the Securities Act. Yes þ No o
Indicate by check mark if the Registrant is not required to file reports pursuant to Section 13 or Section 15(d) of the Exchange Act. Yes o No þ
Indicate by check mark whether the Registrant (1) has filed all reports required to be filed by Section 13 or 15(d) of the Securities Exchange Act of 1934 during the preceding 12 months (or for such shorter period that the Registrant was required to file such reports), and (2) has been subject to such filing requirements for the past 90 days. Yes þ No o
Indicate by check mark whether the Registrant has submitted electronically every Interactive Data File required to be submitted pursuant to Rule 405 of Regulation S-T (§ 232.405 of this chapter) during the preceding 12 months (or for such shorter period that the Registrant was required to submit such files). Yes þ No o
Indicate by check mark if disclosure of delinquent filers pursuant to Item 405 of Regulation S-K (§229.405 of this chapter) is not contained herein, and will not be contained, to the best of Registrant’s knowledge, in definitive proxy or information statements incorporated by reference in Part III of this Form 10-K or any amendment to this Form 10-K. o
Indicate by check mark whether the Registrant is a large accelerated filer, an accelerated filer, a non-accelerated filer, a smaller reporting company, or an emerging growth company. See the definitions of “large accelerated filer,” “accelerated filer,” “smaller reporting company,” and “emerging growth company” in Rule 12b-2 of the Exchange Act.
| Large accelerated filer þ | Accelerated filer o | ||||
| Non-accelerated filer o | Smaller reporting company o | ||||
| Emerging growth company o |
If an emerging growth company, indicate by check mark if the registrant has elected not to use the extended transition period for complying with any new or revised financial accounting standards provided pursuant to Section 13(a) of the Exchange Act. o
Indicate by check mark whether the Registrant is a shell company (as defined in Rule 12b-2 of the Exchange Act). Yes o No þ
As of June 29, 2018 (the last business day of the Registrant’s most recently completed second fiscal quarter), the aggregate market value of the Common Stock of the Registrant held by non-affiliates of the Registrant, based on the last sale price of the Common Stock reported by the New York Stock Exchange on such date, was $4.9 billion.
As of February 21, 2019, the number of outstanding shares of Common Stock of the Registrant was 141,356,413. As of the same date, 36,183 exchangeable shares of a Canadian subsidiary of the Registrant were outstanding.
DOCUMENTS INCORPORATED BY REFERENCE
Portions of the Registrant’s Definitive Proxy Statement for the 2019 Annual Meeting of Stockholders are incorporated by reference into Part III of this Form 10-K.
QUANTA SERVICES, INC.
ANNUAL REPORT ON FORM 10-K
For the Year Ended December 31, 2018
INDEX
PART I
Item 1. Business
General
Quanta Services, Inc. (Quanta) is a leading provider of specialty contracting services, delivering comprehensive infrastructure solutions for the electric power, energy and communications industries in the United States, Canada, Australia, Latin America and select other international markets. The services we provide include the design, installation, upgrade, repair and maintenance of infrastructure within each of the industries we serve, such as electric power transmission and distribution networks; substation facilities; pipeline transmission and distribution systems and facilities; refinery, petrochemical and industrial facilities; and telecommunications and cable multi-system operator networks. We have a workforce of approximately 39,200 employees as of December 31, 2018 and serve a diverse customer base. We believe our reputation for responsiveness and performance, geographic reach, comprehensive service offerings, safety leadership and financial strength have resulted in strong relationships with numerous customers, which include many of the leading companies in the industries we serve, and have positioned us to continue to take advantage of other opportunities. Our services are typically provided pursuant to master service agreements, repair and maintenance contracts and fixed price and non-fixed price installation contracts. Quanta is organized as a corporation under the laws of the State of Delaware and was formed in 1997.
We report our results under two reportable segments: (1) Electric Power Infrastructure Services and (2) Pipeline and Industrial Infrastructure Services. This structure is generally focused on broad end-user markets for our services. As of December 31, 2018, we changed the name of our Oil and Gas Infrastructure Services segment to the Pipeline and Industrial Infrastructure Services segment. There was no change to the composition of the segment, and the name change was made to better reflect the work performed within the segment and the diversity of its service offerings. Our consolidated revenues for the year ended December 31, 2018 were $11.17 billion, of which 57% was attributable to the Electric Power Infrastructure Services segment and 43% was attributable to the Pipeline and Industrial Infrastructure Services segment.
We believe that our business strategies, along with our safety culture and financial strength, differentiate us from our competition and position us to capitalize on future capital spending by our customers. We offer comprehensive and diverse solutions on a broad geographic scale and have a solid base of long-standing customer relationships in each of the industries we serve. We also have an experienced management team, both at the executive level and within our operating units, and various proprietary technologies that enhance our service offerings. Our strategies of expanding our portfolio of service offerings for existing and potential customers, increasing our geographic and technological capabilities, promoting best practices and cross-selling services to our existing customers, as well as continuing to maintain our financial strength, place us in the position to capitalize on opportunities and trends in the industries we serve and expand our operations to select international markets. We continue to evaluate potential strategic acquisitions and investments to broaden our customer base, expand our geographic area of operations, grow our portfolio of services and increase opportunities across our operations.
Reportable Segments
The following is an overview of the types of services provided by each of our reportable segments.
Electric Power Infrastructure Services Segment
The Electric Power Infrastructure Services segment provides comprehensive network solutions to customers in the electric power industry. Services performed by the Electric Power Infrastructure Services segment generally include the design, installation, upgrade, repair and maintenance of electric power transmission and distribution infrastructure and substation facilities along with other engineering and technical services. This segment also provides emergency restoration services, including the repair of infrastructure damaged by inclement weather, the energized installation, maintenance and upgrade of electric power infrastructure utilizing unique bare hand and hot stick methods and our proprietary robotic arm technologies, and the installation of “smart grid” technologies on electric power networks. In addition, this segment provides services that support the development of renewable energy generation, including solar, wind and certain types of natural gas generation facilities, and related switchyards and transmission infrastructure. This segment also provides comprehensive communications infrastructure services to wireline and wireless telecommunications companies, cable multi-system operators and other customers within the communications industry; services in connection with the construction of electric power generation facilities; and the design, installation, maintenance and repair of commercial and industrial wiring. This segment also includes our postsecondary educational institution, which specializes in pre-apprenticeship training, apprenticeship training and specialized utility task training for electric workers, and has been recently expanded to include curriculum for the gas distribution and communications industries.
Pipeline and Industrial Infrastructure Services Segment
The Pipeline and Industrial Infrastructure Services segment provides comprehensive infrastructure solutions to customers involved in the development, transportation, storage and processing of natural gas, oil and other products. Services performed by the Pipeline and Industrial Infrastructure Services segment generally include the design, installation, repair and maintenance of pipeline transmission and distribution systems, gathering systems, production systems, storage systems and compressor and pump stations, as well as related trenching, directional boring and mechanized welding services. In addition, this segment’s services include pipeline protection, integrity testing, rehabilitation and replacement, and the fabrication of pipeline support systems and related structures and facilities for natural gas utilities and midstream companies. We also provide high-pressure and critical-path turnaround services to the downstream and midstream energy markets and instrumentation and electrical services, piping, fabrication and storage tank services. To a lesser extent, this segment serves the offshore and inland water energy markets and designs, installs and maintains fueling systems and water and sewer infrastructure.
Financial Information and Geographic Areas
We operate primarily in the United States; however, we derived $2.60 billion, $2.48 billion and $1.59 billion of our revenues from foreign operations during the years ended December 31, 2018, 2017 and 2016, respectively. Of our foreign revenues, 76%, 79% and 75% were earned in Canada during the years ended December 31, 2018, 2017 and 2016, respectively. In addition, we held property and equipment of $304.0 million and $330.4 million in foreign countries, primarily Canada, as of December 31, 2018 and 2017.
Customers, Strategic Alliances and Preferred Provider Relationships
Our customers include electric power, energy and communications companies, as well as commercial, industrial and governmental entities. We have a large and diverse customer base, including many of the leading companies in the industries we serve. Our 10 largest customers accounted for 37% of our consolidated revenues during the year ended December 31, 2018. Our largest customer accounted for 7% of our consolidated revenues for the year ended December 31, 2018. Representative customers include:
| l | American Electric Power Company, Inc. | l | FirstEnergy Corp. |
| l | ATCO Electric | l | Fortis Inc. |
| l | CenterPoint Energy, Inc. | l | NextEra Energy, Inc. |
| l | Dominion Energy, Inc. | l | NiSource Inc. |
| l | Duke Energy Corporation | l | PG&E Corporation |
| l | Enbridge Inc. | l | Puget Sound Energy, Inc. |
| l | Entergy Corporation | l | Sempra Energy |
| l | Enterprise Products Partners L.P. | l | Southern California Edison Company |
| l | EQT Midstream | l | TransCanada Corporation |
| l | Exelon Corporation | l | Valero Energy Corporation |
| l | Eversource Energy | l | Xcel Energy Inc. |
Although we have a centralized marketing and business development strategy, management at each of our operating units is responsible for developing and maintaining successful long-term relationships with customers. Our operating unit management teams build upon existing customer relationships to secure additional projects and increase revenues. Many of these customer relationships are long-standing and are maintained through a partnering approach with centralized account management, which includes project evaluation and consulting, quality performance, performance measurement and direct customer contact. Additionally, operating unit management focuses on pursuing growth opportunities with prospective customers. We also encourage operating unit management to cross-sell services of our other operating units to their customers and coordinate with our other operating units to pursue projects, especially those that are larger and more complex. We believe our ability to provide services that cover a broad spectrum of our customers’ requirements is a significant differentiator. Our corporate-level business development group supports these activities by promoting and marketing our services for existing and prospective large national accounts, as well as projects that are capable of utilizing services from multiple operating units.
We are a preferred service provider for many of our customers, which means we have met minimum standards for a specific category of service, maintained a high level of performance and agreed to certain payment terms and negotiated rates. We strive to maintain preferred status as we believe it provides us an advantage in the award of future work for the applicable customer. Furthermore, many of our strategic relationships with customers take the form of strategic alliance or long-term maintenance agreements, which typically extend for an initial term of approximately two to five years and may include renewal options to
extend the initial term. Strategic alliance agreements also generally state an intention to work together over a period of time and/or on specific types of projects, and many provide us with preferential bidding procedures.
Remaining Performance Obligations and Backlog
As discussed in Note 3 of the Notes to Consolidated Financial Statements in Item 8. Financial Statements and Supplementary Data, effective January 1, 2018, we adopted the new revenue recognition guidance issued by the FASB. Pursuant to the new guidance, we are required to disclose, as of the end of each interim and annual period, the aggregate amount of remaining performance obligations under our contracts with customers. A performance obligation is a promise in a contract with a customer to transfer a distinct good or service. As of December 31, 2018, our remaining performance obligations were $4.68 billion, 66.2% of which was expected to be recognized in the subsequent twelve months. Our remaining performance obligations represent management’s estimate of consolidated revenues that are expected to be realized from the remaining portion of firm orders under fixed price contracts not yet completed or for which work has not yet begun. For purposes of calculating remaining performance obligations, we include all estimated revenues attributable to consolidated joint ventures and variable interest entities (VIEs), revenues from funded and unfunded portions of government contracts to the extent they are reasonably expected to be realized, and revenues from change orders and claims to the extent management believes additional contract revenues will be earned and are deemed probable of collection.
We have also historically disclosed our backlog, and while backlog is not a term recognized under generally accepted accounting principles in the United States (GAAP), it is a common measurement used in our industry. We also believe this non-GAAP measure enables us to more effectively forecast our future results and better identify future operating trends that may not otherwise be apparent. Our remaining performance obligations, as described above, are a component of our backlog calculation, which also includes estimated orders under master service agreements (MSAs), including estimated renewals, and non-fixed price contracts expected to be completed within one year. Our methodology for determining backlog may not be comparable to the methodologies used by other companies.
Generally, our customers are not contractually committed to specific volumes of services under our MSAs, and most of our contracts may be terminated, typically upon 30 to 90 days’ notice, even if we are not in default under the contract. We determine the estimated amount of backlog for work under MSAs by using recurring historical trends for current MSAs, factoring in seasonal demand and projected customer needs based upon ongoing communications with the customer. In addition, many of our MSAs are subject to renewal, and these potential renewals are considered in determining the estimated amount of backlog. As of December 31, 2018 and 2017, MSAs accounted for 53% and 44% of our estimated 12-month backlog and 60% and 52% of total backlog. There can be no assurance as to our customers’ actual requirements or that our estimates are accurate.
Revenue estimates included in our remaining performance obligations and backlog can be subject to change as a result of, among other things: project acceleration; cancellations or delays due to various factors, including but not limited to commercial issues, regulatory requirements and adverse weather conditions; and final acceptance of change orders by our customers. These factors can also cause revenue amounts to be realized in periods and at levels different than originally projected.
The following table reconciles total remaining performance obligations to our backlog (a non-GAAP measure) by reportable segment as of December 31, 2018, along with estimates of amounts expected to be realized within 12 months of December 31, 2018 (in thousands):
| December 31, 2018 | ||||||||
| 12 Month | Total | |||||||
| Electric Power Infrastructure Services | ||||||||
| Remaining performance obligations | $ | 2,093,461 | $ | 3,045,553 | ||||
| Estimated orders under MSAs and short-term, non-fixed price contracts | 2,467,654 | 5,499,887 | ||||||
| Backlog | 4,561,115 | 8,545,440 | ||||||
| Pipeline and Industrial Infrastructure Services | ||||||||
| Remaining performance obligations | 1,003,543 | 1,635,918 | ||||||
| Estimated orders under MSAs and short-term, non-fixed price contracts | 1,411,329 | 2,161,275 | ||||||
| Backlog | 2,414,872 | 3,797,193 | ||||||
| Total | ||||||||
| Remaining performance obligations | 3,097,004 | 4,681,471 | ||||||
| Estimated orders under MSAs and short-term, non-fixed price contracts | 3,878,983 | 7,661,162 | ||||||
| Backlog | $ | 6,975,987 | $ | 12,342,633 |
The following table presents our total backlog (a non-GAAP measure) by reportable segment as of December 31, 2018 and 2017, along with an estimate of the backlog amounts expected to be realized within 12 months of each balance sheet date (in thousands):
| Backlog as of | Backlog as of | ||||||||||||||
| December 31, 2018 | December 31, 2017 | ||||||||||||||
| 12 Month | Total | 12 Month | Total | ||||||||||||
| Electric Power Infrastructure Services | $ | 4,561,115 | $ | 8,545,440 | $ | 4,032,379 | $ | 7,359,237 | |||||||
| Pipeline and Industrial Infrastructure Services | 2,414,872 | 3,797,193 | 2,413,817 | 3,818,470 | |||||||||||
| Total | $ | 6,975,987 | $ | 12,342,633 | $ | 6,446,196 | $ | 11,177,707 |
Competition
The markets in which we operate are highly competitive. We compete with other contractors in most of the geographic markets in which we operate, and several of our competitors are large companies that have significant financial, technical and marketing resources. In addition, there are relatively few barriers to entry into some of the industries in which we operate and, as a result, any organization that has adequate financial resources and access to technical expertise may become a competitor. A significant portion of our revenues is currently derived from unit price or fixed price agreements, and price is often an important factor in the award of such agreements. Accordingly, we could be underbid by our competitors in an effort by them to procure such business. We believe that as demand for our services increases, customers often consider other factors in choosing a service provider, including technical expertise and experience, safety ratings, financial and operational resources, geographic presence, industry reputation and dependability, which we expect to benefit larger contractors such as us. In addition, competition may lessen as industry resources, such as labor supplies, approach capacity. There can be no assurance, however, that our competitors will not develop the expertise, experience and resources to provide services that are superior in both price and quality to our services, or that we will be able to maintain or enhance our competitive position. We also face competition from the in-house service organizations of our existing or prospective customers, including electric power, energy and engineering companies, which employ personnel who perform some of the same types of services we provide. Although these companies currently outsource a significant portion of these services, in particular services relating to larger energy transmission infrastructure projects, there can be no assurance that they will continue to do so in the future or that they will not acquire additional in-house capabilities.
Employees
As of December 31, 2018, we had approximately 39,200 employees, consisting of approximately 8,400 salaried employees, including executive officers, professional and administrative staff, project managers and engineers, job superintendents and field
personnel, and approximately 30,800 hourly employees, the number of which fluctuates depending upon the number and size of the projects that are ongoing and planned at any particular time. Approximately 38% of our employees at December 31, 2018 were covered by collective bargaining agreements, which require the payment of specified wages, the observance of certain workplace rules and the payment of certain amounts to multiemployer pension plans and employee benefit trusts. These collective bargaining agreements have varying terms and expiration dates, and the majority contain provisions that prohibit work stoppages or strikes, even during specified negotiation periods relating to agreement renewals, and provide for binding arbitration dispute resolution in the event of prolonged disagreement.
We provide health, welfare and benefit plans for employees who are not covered by collective bargaining agreements. We also have a 401(k) plan pursuant to which eligible U.S. employees who are not provided retirement benefits through a collective bargaining agreement may make contributions through a payroll deduction. We make matching cash contributions of 100% of each employee’s contribution up to 3% of that employee’s salary and 50% of each employee’s contribution between 3% and 6% of such employee’s salary, up to the maximum amount permitted by law.
Our industry is experiencing a shortage of journeyman linemen and specialty craft labor in certain geographic areas. In response to the shortage and to attract qualified employees, we support and utilize various training and educational programs and have developed additional company-wide and project-specific employee training and educational programs, as described in further detail below.
Training, Quality Assurance and Safety
Performance of our services requires the use of equipment and exposure to hazardous conditions. Although we are committed to a policy of operating safely and prudently, we have been and will continue to be subject to claims by employees, customers and third parties for property damage and personal injury. In response to these inherent hazards and as part of our commitment to employee safety, our operating units have established safety programs, policies and procedures and training requirements for our employees both before they begin work and on an ongoing basis. Additionally, we have implemented an enterprise-wide Automated External Defibrillator (AED) program, which provides AEDs to all of our crews and training to enhance life safety response measures. We have also continued to invest in our internal education and training capabilities, including the expansion of our training facility to add training for beginning linemen, lead and cable splicing and directional drilling to our existing energized electric power and pipeline integrity training. This facility provides classroom and on-the-job training programs and allows us to train employees in a controlled environment without the challenges of limited structure access and utility constraints. Additionally, during 2018, we acquired Northwest Lineman College, which specializes in pre-apprenticeship training, apprenticeship training and specialized utility task training for electric workers, and has been recently expanded to include curriculum for the gas distribution and communications industries.
Our operating units performing more sophisticated and technical jobs utilize, when applicable, training programs provided by the International Brotherhood of Electrical Workers/National Electrical Contractors Associations (IBEW/NECA) Apprenticeship Program, training programs sponsored by the four trade unions administered by the Pipe Line Contractors Association (PLCA), apprenticeship training programs sponsored by the Canadian Union of Skilled Workers (CUSW) or our equivalent programs. Under the IBEW/NECA Apprenticeship Program, all journeyman linemen are required to complete classroom education and on-the-job training, as well as extensive testing and certification. Certain of our operating units have established apprenticeship training programs approved by the U.S. Department of Labor that prescribe equivalent training requirements for employees who are not otherwise subject to the requirements of the IBEW/NECA Apprenticeship Program. Similarly, the CUSW offers apprenticeship training for construction and maintenance electricians and powerline technicians that requires classroom education and on-the-job training. In addition, the Laborers International Union of North America, the International Brotherhood of Teamsters, the United Association of Plumbers and Pipefitters and the International Union of Operating Engineers have training programs specifically designed for developing and improving the skills of their members who work in the pipeline construction industry. Our operating units also share best practices for training and educational programs and safety policies.
Materials
Our customers typically supply most or all of the materials required for each job. However, for some of our contracts, we may procure all or part of the materials required. As we continue to expand our comprehensive engineering, procurement and construction offerings, the cost of materials may become a proportionately larger component of our consolidated cost of services. We do not anticipate experiencing any significant procurement difficulties, as we purchase our required materials from a variety of sources; however, tariffs or other changes in U.S. trade relations could result in increased costs for these materials.
Regulation
Our operations are subject to various federal, state, local and international laws and regulations including:
| • | licensing, permitting and inspection requirements applicable to contractors, electricians and engineers; |
| • | regulations relating to worker safety and environmental protection; |
| • | permitting and inspection requirements applicable to construction projects; |
| • | wage and hour regulations; |
| • | regulations relating to transportation of equipment and materials, including licensing and permitting requirements; |
| • | building and electrical codes; and |
| • | special bidding, procurement and other requirements on government projects. |
We believe that we are in compliance with all material licensing and regulatory requirements that are necessary to conduct our operations. Our failure to comply with applicable regulations could result in substantial fines or revocation of our operating licenses, as well as give rise to termination or cancellation rights under our contracts or disqualify us from future bidding opportunities.
Environmental Matters and Climate Change Impacts
We are committed to the protection of the environment and train our employees to perform their duties accordingly. We are subject to numerous federal, state, local and international environmental laws and regulations governing our operations, including the handling, transportation and disposal of non-hazardous and hazardous substances and wastes, as well as emissions and discharges into the environment, including discharges to air, surface water, groundwater and soil. We also are subject to laws and regulations that impose liability and cleanup responsibility for releases of hazardous substances into the environment. Under certain of these laws and regulations, liability can be imposed for cleanup of previously owned or operated properties or currently owned properties at which hazardous substances or wastes were discharged or disposed of by a former owner or operator, regardless of whether we directly caused the contamination or violated any law at the time of discharge or disposal. The presence of contamination from such substances or wastes could also interfere with ongoing operations or adversely affect our ability to sell or lease the property or use it as collateral for financing. In addition, we could be held liable for significant penalties and damages under certain environmental laws and regulations or be subject to revocation of certain licenses or permits, which could materially and adversely affect our business, results of operations and cash flows. Our contracts with customers may also impose liability on us for environmental issues that arise through the performance of our services.
From time to time, we may incur costs and obligations for correcting environmental noncompliance matters and for remediation at or relating to certain of our properties. We believe that we are in substantial compliance with our environmental obligations and that any such obligations will not have a material adverse effect on our business or financial performance.
The potential impact of climate change on our operations is uncertain. Climate change may result in, among other things, changes in rainfall and storm patterns and intensity and increased temperature and sea levels. As discussed elsewhere in this Annual Report on Form 10-K (Annual Report), including in Item 1A. Risk Factors, our operating results are significantly influenced by weather, and significant changes in historical weather patterns could significantly impact our future operating results. For example, if climate change results in drier weather and more accommodating temperatures over a greater period of time, we may be able to increase our productivity, which could positively impact our revenues and gross margins. Conversely, if climate change results in a greater amount of rainfall, snow, ice or other less accommodating weather conditions, we could experience reduced productivity, which could negatively impact our revenues and gross margins. Further, while an increase in severe weather events, such as hurricanes, tropical storms, blizzards and ice storms, can create a greater amount of emergency restoration service work, it often also can result in delays or other negative consequences for our existing projects, which could negatively impact our financial results. Climate change may also affect the conditions in which we operate, and in some cases, expose us to potentially increased liabilities associated with those environmental conditions. For example, severe drought in the western United States has increased the risk of wildfires, which in turn has potentially exposed electrical operators and contractors to increased risk of liability.
Concerns about climate change could also result in potential new regulations, regulatory actions or requirements to fund energy efficiency activities, any of which could negatively affect our customers and decrease demand for our services, in particular our pipeline construction services, or result in increased costs associated with our operations. For example, any decrease in demand for fossil fuels could negatively impact demand for certain of our pipeline and industrial services. We also maintain a large fleet and a significant amount of construction machinery, all of which could be impacted by new regulations related to greenhouse gas emissions from such sources.
Risk Management and Insurance
We are insured for employer’s liability, workers’ compensation, auto liability and general liability claims. Under these programs, the deductible for employer’s liability is $1.0 million per occurrence, the deductible for workers’ compensation is $5.0 million per occurrence, and the deductibles for auto liability and general liability are $10.0 million per occurrence. We manage and maintain a portion of our casualty risk through our wholly-owned captive insurance company, which insures all claims up to the amount of the applicable deductible of our third-party insurance programs. In connection with our casualty insurance programs, we are required to issue letters of credit to secure our obligations. We also have employee health care benefit plans for most employees not subject to collective bargaining agreements, of which the primary plan is subject to a deductible of $0.5 million per claimant per year.
Losses under all of these insurance programs are accrued based upon our estimate of the ultimate liability for claims reported and an estimate of claims incurred but not reported, with assistance from third-party actuaries. These insurance liabilities are difficult to assess and estimate due to unknown factors, including the severity of an injury, the extent of damage, the determination of our liability in proportion to other parties and the number of incidents not reported. The accruals are based upon known facts and historical trends, and management believes such accruals are adequate.
We renew our insurance policies on an annual basis, and therefore deductibles and levels of insurance coverage may change in future periods. In addition, insurers may cancel our coverage or determine to exclude certain items from coverage, or we may elect not to obtain certain types or incremental levels of insurance based on the potential benefits considered relative to the cost of such insurance. In any such event, our overall risk exposure would increase, which could negatively affect our results of operations, financial condition and cash flows.
Seasonality and Cyclicality
Our revenues and results of operations can be subject to seasonal and other variations. These variations are influenced by weather, customer spending patterns, bidding seasons, receipt of required regulatory approvals, permits and rights of way, project timing and schedules, and holidays. Please read the section entitled Seasonality; Fluctuations of Results; Economic Conditions included in Item 7. Management’s Discussion and Analysis of Financial Condition and Results of Operations.
Website Access and Other Information
Our website address is www.quantaservices.com. Interested parties may obtain free electronic copies of our Annual Reports on Form 10-K, Quarterly Reports on Form 10-Q, Current Reports on Form 8-K, and any amendments to these reports through our website under the heading Investors & Media/Financial Info/SEC Filings or through the website of the Securities and Exchange Commission (the SEC) at www.sec.gov. These reports are available on our website as soon as reasonably practicable after we electronically file them with, or furnish them to, the SEC. We will also make available to any stockholder, without charge, copies of our Annual Report on Form 10-K as filed with the SEC. For copies of this or any other Quanta publication, stockholders may submit a request in writing to Quanta Services, Inc., Attn: Corporate Secretary, 2800 Post Oak Blvd., Suite 2600, Houston, TX 77056, or by phone at 713-629-7600.
Investors and others should note that we announce material financial information and make other public disclosures of information regarding Quanta through SEC filings, press releases, public conference calls, and our website. We also utilize social media to communicate this information, and it is possible that the information we post on social media could be deemed material. Accordingly, we encourage investors, the media and others interested in our company to follow Quanta, and review the information we post, on the social media channels listed on our website in the Investors & Media/Social Media section.
This Annual Report, our website and our social media channels contain information provided by other sources that we believe is reliable. We cannot provide assurance that the information obtained from other sources is accurate or complete. No information on our website or our social media channels is incorporated by reference herein.
Item 1A. Risk Factors
Our business is subject to a variety of risks and uncertainties, including, but not limited to, the risks and uncertainties described below. The matters described below are not the only risks and uncertainties facing our company. Additional risks and uncertainties not known to us or not described below also may impair our business operations. If any of the following risks actually occur, our business, financial condition, results of operations and cash flows could be negatively affected, and we may not be able to achieve our goals or expectations. This Annual Report also includes statements reflecting assumptions, expectations, projections, intentions or beliefs about future events that are intended as “forward-looking statements” under the Private Securities Litigation Reform Act of 1995 and should be read in conjunction with the section entitled Uncertainty of Forward-Looking Statements and Information included in Item 7. Management’s Discussion and Analysis of Financial Condition and Results of Operations.
Our operating results may vary significantly from quarter to quarter.
Our business can be highly cyclical and subject to seasonal and other variations that can result in significant differences in operating results from quarter to quarter. For example, we typically experience lower gross and operating margins during winter months due to lower demand for our services and more difficult operating conditions in the Northern Hemisphere. Additionally, our quarterly results may be materially and/or adversely affected by:
| • | the timing and volume of work we perform and our performance with respect to ongoing projects; |
| • | project delays, reductions in scope or cancellations, including as a result of permitting, regulatory or environmental processes, project performance, customer capital constraints, claimed force majeure events, protests or other political activity, or legal challenges; |
| • | adverse weather conditions and significant weather events; |
| • | variations in the size, scope and margins of projects we perform and the mix of our customers, contracts and business during any particular quarter; |
| • | increases in construction, design, engineering or procurement costs; |
| • | fluctuations in regional, national or global economic, political and market conditions, including as a result of tariffs or changes in U.S. trade relationships with other countries, which could result in decreased demand for our services; |
| • | pricing pressures resulting from competition; |
| • | the budgetary spending patterns of customers and federal, state and local governments; |
| • | disruptions in our customers’ strategic plans, which could occur as a result of, among other things, emerging technologies, financial difficulties of our customers or changing environmental conditions; |
| • | the magnitude of work performed under change orders and the timing of their recognition; |
| • | liabilities and costs experienced in our operations that are not covered by, or that are in excess of, our third-party insurance, including significant liabilities that may arise from the inherently hazardous conditions of our operations (e.g., explosions, fires) and which could be exacerbated by the geographies in which we operate; |
| • | disputes with customers or delays relating to billing and payment under our contracts and change orders, and our ability to successfully negotiate and obtain payment or reimbursement under our contracts and change orders; |
| • | the resolution of, or unexpected or increased costs associated with, pending or threatened litigation, indemnity obligations or other claims asserted against us; |
| • | liabilities associated with multiemployer pension plans in which our employees participate, including with respect to any withdrawal therefrom; |
| • | significant fluctuations in foreign currency exchange rates; |
| • | changes in accounting pronouncements that require us to account for items differently; |
| • | payment risk associated with the financial condition of our customers, including those customers affected by the volatility of natural gas and oil prices or that have filed for bankruptcy protection; |
| • | the termination or expiration of existing customer agreements; |
| • | changes in bonding and lien requirements applicable to existing and new customer agreements; |
| • | implementation of various information technology systems, which could temporarily disrupt day-to-day operations; |
| • | the decision by our Board of Directors to pay a dividend and market expectations with respect to the payment and amount of any dividends; |
| • | the recognition of tax impacts related to changes in tax laws or uncertain tax positions; |
| • | the timing and magnitude of costs we incur to support growth internally or through acquisitions or otherwise; |
| • | the timing and integration of acquisitions and the magnitude of the related acquisition and integration costs; and |
| • | estimates and assumptions in determining our financial results, remaining performance obligations and backlog, including the timing and significance of impairments of long-lived assets, equity or other investments, receivables, goodwill or other intangible assets. |
Accordingly, our operating results in any particular quarter may not be indicative of the results that can be expected for any other quarter or for the entire year.
Negative economic and market conditions, including low oil and natural gas prices, may adversely impact our customers’ future spending as well as payment for our services and, as a result, our operations and growth.
Stagnant or declining economic conditions can adversely impact the demand for our services and result in the delay, reduction or cancellation of certain projects. In addition, economic and market conditions specifically affecting the industries we serve could adversely affect our business, financial condition, results of operations and cash flows. A number of factors, including financing conditions and potential bankruptcies in the industries we serve or a prolonged economic downturn or recession, could adversely affect our customers and their ability or willingness to fund capital expenditures in the future or pay for past services. Consolidation, competition, capital constraints or negative economic conditions in the electric power, energy or communications industries may also result in reduced spending by, or the loss of, one or more of our customers.
Our Pipeline and Industrial Infrastructure Services segment is exposed to risks associated with the oil and gas industry. These risks, which are not subject to our control, include the volatility and cyclical nature of natural gas and oil prices and the resulting effect on demand for the services we provide, and a slowdown in the development or discovery of natural gas and/or oil reserves. Specifically, lower natural gas and oil prices can result in decreased spending by our customers in our Pipeline and Industrial Infrastructure Services segment. Declines in prices, or perceived risk thereof, may result in our customers reducing or delaying capital spending on larger pipeline projects, gas gathering and compressor systems and related infrastructure, resulting in less demand for our services. If the profitability of our Pipeline and Industrial Infrastructure Services segment were to decline, our o
Showing the first 8K of 113K characters. Open the full section
Item 1B. Unresolved Staff Comments
None.
Item 2. Properties
Facilities
We lease our corporate headquarters in Houston, Texas and own and lease other facilities throughout the United States, Canada and other foreign locations where we conduct business. Our facilities are utilized for operations in both of our reportable segments and include offices, equipment yards, warehouses, storage, maintenance shops and training and educational facilities. As of December 31, 2018, we owned 60 of our facilities and leased the remainder. We believe that our existing facilities are sufficient for our current needs.
Equipment
We operate a fleet of owned and leased trucks and trailers, support vehicles and specialty construction equipment, such as backhoes, excavators, trenchers, generators, boring machines, cranes, robotic arms, wire pullers, tensioners, marine vessels and helicopters. Our owned equipment and the leasehold interests in our leased equipment are encumbered by a security interest granted under our credit agreement. As of December 31, 2018, the total size of the rolling-stock fleet was approximately 45,000 units. Most of our fleet is serviced by our own mechanics who work at various maintenance sites and facilities. We believe that our equipment is generally well maintained and adequate for our present operations.
Item 3. Legal Proceedings
We are from time to time party to various lawsuits, claims and other legal proceedings that arise in the ordinary course of business. These actions typically seek, among other things, compensation for alleged personal injury, breach of contract and/or property damages, employment-related damages, punitive damages, civil penalties or other losses, or injunctive or declaratory relief. With respect to all such lawsuits, claims and proceedings, we record a reserve when it is probable that a loss has been incurred and the amount of loss can be reasonably estimated. In addition, we disclose matters for which management believes a material loss is at least reasonably possible. See Note 14 of the Notes to Consolidated Financial Statements in Item 8. Financial Statements and Supplementary Data, which are incorporated by reference in this Item 3, for additional information regarding litigation, claims and other legal proceedings.
Item 4. Mine Safety Disclosures
Not applicable.
PART II
Item 5. Market for Registrant’s Common Equity, Related Stockholder Matters and Issuer Purchases of Equity Securities
Our common stock is listed on the New York Stock Exchange (NYSE) under the symbol “PWR.”
On February 21, 2019, there were 650 holders of record of our common stock and three holders of record of exchangeable shares of Canadian subsidiaries of Quanta. There is no established trading market for the exchangeable shares; however, the exchangeable shares may be exchanged at the option of the holder for Quanta common stock on a one-for-one basis. See Note 10 of the Notes to Consolidated Financial Statements in Item 8. Financial Statements and Supplementary Data for additional discussion of our equity securities.
Unregistered Sales of Securities During the Fourth Quarter of 2018
None. However, subsequent to December 31, 2018, we issued 449,929 shares of our common stock to the former owner of an acquired business in exchange, on a one-for-one basis, for exchangeable shares in a Canadian subsidiary of Quanta that were held by the former owner. The former owner originally received the exchangeable shares as partial consideration for the sale of the acquired business. The shares of common stock issued in this transaction were issued in reliance upon the exemption from registration provided by Section 4(a)(2) of the Securities Act of 1933, as amended, as the shares were issued to the owner of business acquired in a privately negotiated transaction not involving any public offering or solicitation.
In connection with the aforementioned acquisition, the former owner also received one share of Quanta Series G Preferred Stock, which provided the former owner voting rights in Quanta common stock equivalent to the number of outstanding exchangeable shares held by the former owner. Upon completion of the exchange described above, no exchangeable shares associated with the preferred share remained outstanding. Accordingly, the share of Quanta Series G preferred stock was redeemed, deemed retired and canceled and may not be reissued.
Issuer Purchases of Equity Securities During the Fourth Quarter of 2018
The following table contains information about our purchases of equity securities during the three months ended December 31, 2018.
| Period | Total Number of Shares Purchased | Average Price Paid per Share | Total Number of Shares Purchased as Part of Publicly Announced Plans or Programs | Maximum Number (or Approximate Dollar Value) of Shares That May Yet be Purchased Under the Plans or Programs**(1)** | ||||||||||
| October 1 - 31, 2018 | ||||||||||||||
| Open Market Stock Repurchases (1) | 2,706,951 | $ | 31.86 | 2,706,951 | $ | 446,088,029 | ||||||||
| Tax Withholdings (2) | 10,098 | $ | 33.61 | — | ||||||||||
| November 1 - 30, 2018 | ||||||||||||||
| Open Market Stock Repurchases (1) | — | $ | — | — | $ | 446,088,029 | ||||||||
| Tax Withholdings (2) | 6,868 | $ | 34.71 | — | ||||||||||
| December 1 - 31, 2018 | ||||||||||||||
| Open Market Stock Repurchases (1) | 4,945,214 | $ | 29.80 | 4,945,214 | $ | 298,709,474 | ||||||||
| Tax Withholdings (2) | — | $ | — | — | ||||||||||
| Total | 7,669,131 | 7,652,165 | $ | 298,709,474 |
| (1) | Includes shares repurchased as of the trade date of such repurchases. On May 25, 2017, we issued a press release announcing that our Board of Directors approved a stock repurchase program that authorized us to purchase, from time to time through June 30, 2020, up to $300.0 million of our outstanding common stock (the 2017 Repurchase Program). Additionally, on September 4, 2018, we issued a press release announcing that our Board of Directors approved a stock repurchase program that authorizes us to purchase, from time to time through June 30, 2021, up to $500.0 million of our outstanding common stock (the 2018 Repurchase Program). Repurchases under these programs can be made in open market and privately negotiated transactions, at our discretion, based on market and business conditions, applicable contractual and legal requirements and other factors. These programs do not obligate us to acquire any specific amount of common stock and may be modified or terminated by our Board of Directors at any time at its sole discretion and without notice. As of December 31, 2018, we had repurchased 8.6 million shares of our common stock under the 2017 Repurchase Program at a cost of $300.0 million and 6.7 million shares of our common stock under the 2018 Repurchase Program at a cost of $201.3 million. As a result, the 2017 Repurchase Program was completed and $298.7 million remained available under the 2018 Repurchase Program as of December 31, 2018. | |
| (2) | Includes shares purchased from employees to satisfy tax withholding obligations in connection with the vesting of restricted stock unit and performance unit awards or the settlement of previously vested and deferred restricted stock unit and performance unit awards. |
Dividends
We did not declare any cash dividends on our common stock during the year ended December 31, 2017. During the fourth quarter of 2018, we declared a cash dividend of $0.04 per share of our common stock, which was paid on January 16, 2019 to stockholders of record as of January 2, 2019. The declaration, payment and amount of future cash dividends, if any, will be at the discretion of our Board of Directors after taking into account various factors, including our financial condition, results of operations, cash flows from operations, current and anticipated capital requirements and expansion plans, the income tax laws then in effect and the requirements of Delaware law. In addition, as discussed in Liquidity and Capital Resources — Debt Instruments — Senior Secured Credit Facility in Item 7. Management’s Discussion and Analysis of Financial Condition and Results of Operations, the credit agreement for our senior secured credit facility restricts the payment of cash dividends unless certain conditions are met.
Performance Graph
The following Performance Graph and related information shall not be deemed “soliciting material” or to be “filed” with the Securities and Exchange Commission, nor shall such information be incorporated by reference into any future filing under the Securities Act of 1933 or Securities Exchange Act of 1934, each as amended, except to the extent that we specifically incorporate it by reference into such filing.
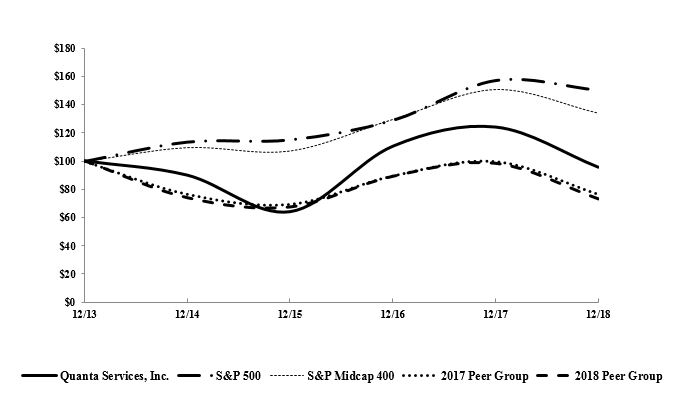
The following graph compares, for the period from December 31, 2013 to December 31, 2018, the cumulative stockholder return on our common stock with the cumulative total return of the S&P 500 Index (the S&P 500), the S&P MidCap 400 Index (the S&P 400) and two peer groups selected by our management that include public companies within our industries. The companies in the peer groups were selected to represent a broad group of publicly held corporations with operations similar to ours. The current peer group (the 2018 Peer Group) includes AECOM, EMCOR Group Inc., Fluor Corporation, Jacobs Engineering Group Inc., KBR, Inc., MasTec, Inc., McDermott International, Inc.; MYR Group Inc. and Primoris Services Corporation. The peer group used in the prior year (the 2017 Peer Group) was the same, except that McDermott International, Inc. replaced Chicago Bridge & Iron Company N.V. as a result of the combination of the two companies.
The graph below assumes an investment of $100 (with reinvestment of all dividends) in our common stock, the 2018 Peer Group, the 2017 Peer Group, the S&P 500 and the S&P MidCap 400 on December 31, 2013 and tracks their relative performance through December 31, 2018. The returns of each company in the Peer Group are weighted based on the market capitalization of that company at the beginning of the measurement period. The stock price performance reflected in the following graph is not necessarily indicative of future stock price performance.
COMPARISON OF 5 YEAR CUMULATIVE TOTAL RETURN
Among Quanta Services, Inc., the 2018 Peer Group, the 2017 Peer Group, the S&P 500, and the S&P MidCap 400
| December 31, | ||||||||||||||||||||||||
| 2013 | 2014 | 2015 | 2016 | 2017 | 2018 | |||||||||||||||||||
| Quanta Services, Inc. | $ | 100.00 | $ | 89.96 | $ | 64.16 | $ | 110.42 | $ | 123.92 | $ | 95.50 | ||||||||||||
| 2018 Peer Group | $ | 100.00 | $ | 74.06 | $ | 67.55 | $ | 89.16 | $ | 98.27 | $ | 73.20 | ||||||||||||
| 2017 Peer Group | $ | 100.00 | $ | 76.57 | $ | 69.40 | $ | 89.62 | $ | 99.85 | $ | 76.52 | ||||||||||||
| S&P 500 | $ | 100.00 | $ | 113.69 | $ | 115.26 | $ | 129.05 | $ | 157.22 | $ | 150.33 | ||||||||||||
| S&P MidCap 400 | $ | 100.00 | $ | 109.77 | $ | 107.38 | $ | 129.65 | $ | 150.71 | $ | 134.01 |
Item 6. Selected Financial Data
The following historical selected financial data has been derived from our consolidated financial statements. See Note 4 of the Notes to Consolidated Financial Statements in Item 8. Financial Statements and Supplementary Data for information regarding certain acquisitions and the related impact on our results of operations as these acquisitions may affect the comparability of such results. Additionally, on August 4, 2015, we sold our fiber optic licensing operations. We have presented the results of operations, financial position and cash flows of such fiber optic licensing subsidiaries as discontinued operations for all applicable periods presented in this Annual Report. The historical selected financial data should be read in conjunction with our consolidated financial statements and related notes thereto included in Item 8. Financial Statements and Supplementary Data and Item 7. Management’s Discussion and Analysis of Financial Condition and Results of Operations.
| Year Ended December 31, | |||||||||||||||||||||
| 2018 | 2017 | 2016 | 2015 | 2014 | |||||||||||||||||
| (In thousands, except per share information) | |||||||||||||||||||||
| Consolidated Statements of Operations Data: | |||||||||||||||||||||
| Revenues | $ | 11,171,423 | $ | 9,466,478 | $ | 7,651,319 | $ | 7,572,436 | $ | 7,747,229 | |||||||||||
| Cost of services (including depreciation) | 9,691,459 | 8,224,618 | 6,637,519 | 6,648,771 | 6,578,435 | ||||||||||||||||
| Gross profit | 1,479,964 | 1,241,860 | 1,013,800 | 923,665 | 1,168,794 | ||||||||||||||||
| Selling, general and administrative expenses | 857,574 | 777,920 | 653,338 | 592,863 | 705,477 | (c) | |||||||||||||||
| Amortization of intangible assets | 43,994 | 32,205 | 31,685 | 34,848 | 34,257 | ||||||||||||||||
| Asset impairment charges (a) | 49,375 | 58,057 | 7,964 | 58,451 | — | ||||||||||||||||
| Change in fair value of contingent consideration liabilities | (11,248 | ) | (5,171 | ) | — | — | — | ||||||||||||||
| Operating income | 540,269 | 378,849 | 320,813 | 237,503 | 429,060 | ||||||||||||||||
| Interest expense | (36,945 | ) | (20,946 | ) | (14,887 | ) | (8,024 | ) | (4,765 | ) | |||||||||||
| Interest income | 1,555 | 832 | 2,423 | 1,493 | 3,736 | ||||||||||||||||
| Other expense, net | (47,213 | ) | (4,978 | ) | (663 | ) | (2,297 | ) | (1,432 | ) | |||||||||||
| Income from continuing operations before income taxes | 457,666 | 353,757 | 307,686 | 228,675 | 426,599 | ||||||||||||||||
| Provision for income taxes (b) | 161,659 | 35,532 | 107,246 | 97,472 | 139,007 | ||||||||||||||||
| Net income from continuing operations | 296,007 | 318,225 | 200,440 | 131,203 | 287,592 | ||||||||||||||||
| Net income (loss) from discontinued operations | — | — | (342 | ) | 190,621 | 27,490 | |||||||||||||||
| Net income | 296,007 | 318,225 | 200,098 | 321,824 | 315,082 | ||||||||||||||||
| Less: Net income attributable to non-controlling interests | 2,661 | 3,247 | 1,715 | 10,917 | 18,368 | ||||||||||||||||
| Net income attributable to common stock | $ | 293,346 | $ | 314,978 | $ | 198,383 | $ | 310,907 | $ | 296,714 | |||||||||||
| Amounts attributable to common stock: | |||||||||||||||||||||
| Net income from continuing operations | $ | 293,346 | $ | 314,978 | $ | 198,725 | $ | 120,286 | $ | 269,224 | |||||||||||
| Net income (loss) from discontinued operations | — | — | (342 | ) | 190,621 | 27,490 | |||||||||||||||
| Net income attributable to common stock | $ | 293,346 | $ | 314,978 | $ | 198,383 | $ | 310,907 | $ | 296,714 | |||||||||||
| Basic earnings per share attributable to common stock from continuing operations | $ | 1.92 | $ | 2.02 | $ | 1.26 | $ | 0.62 | $ | 1.22 | |||||||||||
| Diluted earnings per share attributable to common stock from continuing operations | $ | 1.90 | $ | 2.00 | $ | 1.26 | $ | 0.62 | $ | 1.22 |
| (a) | In 2018, 2017, 2016 and 2015, we recorded asset impairment charges of $49.4 million ($36.5 million net of tax), $58.1 million ($36.6 million net of tax), $8.0 million ($7.1 million net of tax) and $58.5 million ($44.6 million net of tax).The charges recorded in 2018 related to the winding down of certain oil-influenced operations and assets. The charges recorded in 2017 related to goodwill and intangible assets, including a $57.0 million goodwill impairment and a $1.1 million impairment of a customer relationship intangible asset. The goodwill impairment was associated with two reporting units within our Pipeline and Industrial Infrastructure Services Division. The charges recorded in 2016 primarily related to a pending disposition of certain international renewable energy services operations, which was completed in 2017. The charges recorded in 2015 related to goodwill, intangible assets and property and equipment, including a $39.8 million goodwill impairment and a $12.1 million impairment to customer relationship, trade name and non-compete agreement intangible assets. For further discussion of these charges in 2018, 2017 and 2016, refer to Results of Operations — Consolidated Results — Asset impairment charges included in Item 7. Management’s Discussion and Analysis of Financial Condition and Results of Operations. |
| (b) | The effective tax rates in 2018 and 2017 were impacted by the enactment of the Tax Cuts and Jobs Act of 2017 (Tax Act), which, among other things, lowered the U.S. federal corporate tax rate from 35% to 21% as of January 1, 2018. The lower effective tax rate in 2017 was primarily due to $70.1 million of tax benefits related to the enactment of the Tax Act. For more information regarding the Tax Act, refer to Note 9 of the Notes to Consolidated Financial Statements in Item 8. Financial Statements and Supplementary Data. As a result of the tax reform regulations issued during 2018, the 2018 effective tax rate includes a $37.2 million provision to record a valuation allowance against tax benefits recognized during 2017 associated with the Tax Act and other entity restructuring and recapitalization efforts. For more information on other items that impacted the effective tax rates in 2018, 2017 and 2016, refer to Results of Operations — Consolidated Results — Provision for income taxes included in Item 7. Management’s Discussion and Analysis of Financial Condition and Results of Operations. The effective tax rate in 2015 did not include a significant decrease in reserves for uncertain tax positions. The effective tax rate in 2014 was impacted by $8.1 million in tax benefits primarily due to decreases in reserves for uncertain tax positions that resulted from the expiration of federal and state statute of limitations periods. |
| (c) | In 2014, selling, general and administrative expenses included a $102.5 million charge to provision for long-term contract receivable associated with an electric power infrastructure services project and a $38.8 million expense resulting from an arbitration decision associated with a contract dispute on a directional drilling project. |
| December 31, | ||||||||||||||||||||
| 2018 | 2017 | 2016 | 2015 | 2014 | ||||||||||||||||
| (In thousands) | ||||||||||||||||||||
| Balance Sheet Data: | ||||||||||||||||||||
| Working capital | $ | 1,519,977 | $ | 1,377,840 | $ | 1,083,517 | $ | 1,073,775 | $ | 1,389,393 | ||||||||||
| Goodwill | $ | 1,899,879 | $ | 1,868,600 | $ | 1,603,169 | $ | 1,552,658 | $ | 1,596,695 | ||||||||||
| Total assets | $ | 7,075,787 | $ | 6,480,154 | $ | 5,354,059 | $ | 5,213,543 | $ | 6,253,583 | ||||||||||
| Long-term debt, net of current maturities | $ | 1,040,532 | $ | 670,721 | $ | 353,562 | $ | 475,364 | $ | 72,489 | ||||||||||
| Total stockholders’ equity | $ | 3,604,159 | $ | 3,791,571 | $ | 3,339,427 | $ | 3,085,494 | $ | 4,514,473 |
Item 7. Management’s Discussion and Analysis of Financial Condition and Results of Operations
The following discussion and analysis of our financial condition and results of operations should be read in conjunction with our historical consolidated financial statements and related notes included elsewhere in Item 8. Financial Statements and Supplementary Data. The discussion below contains forward-looking statements that are based upon our current expectations and are subject to uncertainty and changes in circumstances. Actual results may differ materially from these expectations due to inaccurate assumptions and known or unknown risks and uncertainties, including those identified in Uncertainty of Forward-Looking Statements and Information below and Item 1A. Risk Factors.
Introduction
We are a leading provider of specialty contracting services, delivering comprehensive infrastructure solutions for the electric power, energy and communications industries in the United States, Canada, Australia, Latin America and select other international markets. The services we provide include the design, installation, upgrade, repair and maintenance of infrastructure within each of the industries we serve, such as electric power transmission and distribution networks; substation facilities; pipeline transmission and distribution systems and facilities; refinery, petrochemical and industrial facilities; and telecommunications and cable multi-system operator networks.
Our customers include many of the leading companies in the industries we serve. We have developed strong strategic alliances with numerous customers and strive to develop and maintain our status as a preferred service provider to our customers. Our services are typically provided pursuant to master service agreements, repair and maintenance contracts and fixed price and non-fixed price installation contracts.
We report our results under two reportable segments: (1) Electric Power Infrastructure Services and (2) Pipeline and Industrial Infrastructure Services. This structure is generally focused on broad end-user markets for our services. As of December 31, 2018, we changed the name of our Oil and Gas Infrastructure Services segment to the Pipeline and Industrial Infrastructure Services segment. There was no change to the composition of the segment, and the name change was made to better reflect the work performed within the segment and the diversity of its service offerings. Our consolidated revenues for the year ended December 31, 2018 were $11.17 billion, of which 57% was attributable to the Electric Power Infrastructure Services segment and 43% was attributable to the Pipeline and Industrial Infrastructure Services segment.
The Electric Power Infrastructure Services segment provides comprehensive network solutions to customers in the electric power industry. Services performed by the Electric Power Infrastructure Services segment generally include the design, installation, upgrade, repair and maintenance of electric power transmission and distribution infrastructure and substation facilities along with other engineering and technical services. This segment also provides emergency restoration services, including the repair of infrastructure damaged by inclement weather, the energized installation, maintenance and upgrade of electric power infrastructure utilizing unique bare hand and hot stick methods and our proprietary robotic arm technologies, and the installation of “smart grid” technologies on electric power networks. In addition, this segment provides services that support the development of renewable energy generation, including solar, wind and certain types of natural gas generation facilities, and related switchyards and transmission infrastructure. This segment also provides comprehensive communications infrastructure services to wireline and wireless telecommunications companies, cable multi-system operators and other customers within the communications industry; services in connection with the construction of electric power generation facilities; and the design, installation, maintenance and repair of commercial and industrial wiring. This segment also includes our postsecondary educational institution, which specializes in pre-apprenticeship training, apprenticeship training and specialized utility task training for electric workers, and has been recently expanded to include curriculum for the gas distribution and communications industries.
The Pipeline and Industrial Infrastructure Services segment provides comprehensive infrastructure solutions to customers involved in the development, transportation, storage and processing of natural gas, oil and other products. Services performed by the Pipeline and Industrial Infrastructure Services segment generally include the design, installation, repair and maintenance of pipeline transmission and distribution systems, gathering systems, production systems, storage systems and compressor and pump stations, as well as related trenching, directional boring and mechanized welding services. In addition, this segment’s services include pipeline protection, integrity testing, rehabilitation and replacement, and the fabrication of pipeline support systems and related structures and facilities for natural gas utilities and midstream companies. We also provide high-pressure and critical-path turnaround services to the downstream and midstream energy markets and instrumentation and electrical services, piping, fabrication and storage tank services. To a lesser extent, this segment serves the offshore and inland water energy markets and designs, installs and maintains fueling systems and water and sewer infrastructure.
For internal management purposes, we are also organized into two internal divisions: the Electric Power Infrastructure Services Division and the Pipeline and Industrial Infrastructure Services Division. These internal divisions are closely aligned with the reportable segments and are based on the predominant type of work provided by the operating units within each division.
Reportable segment information, including revenues and operating income by type of work, is gathered from each operating unit for the purpose of evaluating segment performance in support of our market strategies. These classifications of our operating unit revenues by type of work for segment reporting purposes can at times require judgment on the part of management. Our operating units may perform joint projects for customers in multiple industries, deliver multiple types of services under a single customer contract or provide service offerings to various industries. For example, we perform joint trenching projects to install distribution lines for electric power and natural gas customers. Our integrated operations and common administrative support for our operating units requires that certain allocations be made to determine segment profitability, including allocations of shared and indirect costs, such as facility costs, indirect operating expenses (e.g., depreciation), and general and administrative costs. Certain corporate costs are not allocated, including payroll and benefits, employee travel expenses, facility costs, professional fees, acquisition costs, non-cash stock-based compensation and amortization related to intangible assets.
We operate primarily in the United States; however, we derived $2.60 billion, $2.48 billion and $1.59 billion of our revenues from foreign operations during the years ended December 31, 2018, 2017 and 2016, respectively. Of our foreign revenues, 76%, 79% and 75% were earned in Canada during the years ended December 31, 2018, 2017 and 2016, respectively. In addition, we held property and equipment of $304.0 million and $330.4 million in foreign countries, primarily Canada, as of December 31, 2018 and 2017. See Note 2 of the Notes to Consolidated Financial Statements in Item 8. Financial Statements and Supplementary Data for a further disaggregation of revenues by geographic location.
**Recent Acquisitions
Showing the first 8K of 172K characters. Open the full section
Item 7A. Quantitative and Qualitative Disclosures about Market Risk
Our primary exposure to market risk relates to unfavorable changes in concentration of credit risk, interest rates and currency exchange rates.
Credit Risk. We are subject to concentrations of credit risk related to our cash and cash equivalents and net receivable position with customers, which includes amounts related to billed and unbilled accounts receivable and contract assets net of advanced billings with the same customer. Substantially all of our cash and cash equivalents are managed by what we believe to be high credit quality financial institutions. In accordance with our investment policies, these institutions are authorized to invest cash and cash equivalents in a diversified portfolio of what we believe to be high-quality investments, which primarily include interest-bearing demand deposits, money market investments and money market mutual funds. Although we do not currently believe the principal amounts of these cash and cash equivalents are subject to any material risk of loss, changes in economic conditions could impact the interest income we receive from these investments.
In addition, we grant credit under normal payment terms, generally without collateral; and therefore, are subject to potential credit risk related to our customers’ inability to pay for services provided. For example, in January 2019 one of our customers, PG&E, filed for bankruptcy protection under Chapter 11 of the U.S. Bankruptcy Code, as amended. See Item 7. Management's Discussion and Analysis of Financial Condition and Results of Operations — Concentration of Credit Risk for additional information regarding our pre-petition receivables and this bankruptcy matter. Furthermore, the risk of nonpayment may be heightened as a result of depressed economic and financial market conditions. We believe the concentration of credit risk related to billed and unbilled receivables and contract assets is limited because of the diversity of our customers, and we perform ongoing credit risk assessments of our customers and financial institutions and in some cases obtain collateral or other security from our customers.
Interest Rate Risk. As of December 31, 2018, we had no derivative financial instruments to manage interest rate risk. As such, we were exposed to earnings and fair value risk due to changes in interest rates with respect to our long-term obligations. As of December 31, 2018, the fair value of our variable rate debt of $1.07 billion approximated book value. Our weighted average interest rate on our variable rate debt for the year ended December 31, 2018 was 3.6%. The annual effect on our pretax earnings of a hypothetical 50 basis point increase or decrease in variable interest rates would be approximately $5.4 million based on our December 31, 2018 balance of variable rate debt.
Foreign Currency Risk. The U.S. dollar is the functional currency for the majority of our operations, which are primarily located within the United States. The functional currency for our foreign operations, which are primarily located in Canada, Australia and Latin America, is typically the currency of the country in which the foreign operating unit is located. Accordingly, our financial performance is subject to fluctuation due to changes in foreign currency exchange rates relative to the U.S. dollar. During 2018, revenues from our foreign operations accounted for 23.2% of our consolidated revenues. Fluctuations in foreign exchange rates during the year ended December 31, 2018 caused a decrease of approximately $18 million in foreign revenues
compared to the year ended December 31, 2017. Fluctuations in foreign exchange rates during the year ended December 31, 2017 caused an increase of approximately $53 million in foreign revenues compared to the year ended December 31, 2016.
We are also subject to foreign currency risk with respect to sales, purchases and borrowings that are denominated in a currency other than the respective functional currencies of our operating units. To minimize the risk from changes in foreign currency exchange rates, we may enter into foreign currency derivative contracts to hedge our foreign currency risk on a cash flow basis. There were no outstanding foreign currency derivative contracts at December 31, 2018.
We also have foreign exchange risk related to cash and cash equivalents in foreign banks. Based on the balance of cash and cash equivalents in foreign banks of $16.2 million as of December 31, 2018, an assumed 5% adverse change to foreign exchange rates would result in a fair value decline of $0.7 million. Fluctuations in fair value are recorded in “Accumulated other comprehensive income (loss),” a separate component of stockholders’ equity.
Item 8. Financial Statements and Supplementary Data
INDEX TO QUANTA SERVICES, INC.’S CONSOLIDATED FINANCIAL STATEMENTS
REPORT OF MANAGEMENT
Management’s Report on Financial Information and Procedures
The accompanying financial statements of Quanta Services, Inc. and its subsidiaries were prepared by management. These financial statements were prepared in accordance with accounting principles generally accepted in the United States, applying certain estimates and judgments as required.
Our management, including our Chief Executive Officer and Chief Financial Officer, does not expect that our disclosure controls or our internal control over financial reporting will prevent or detect all errors and all fraud. A control system, no matter how well designed and operated, can provide only reasonable, not absolute, assurance that the control system’s objectives will be met. The design of a control system must reflect the fact that there are resource constraints, and the benefits of controls must be considered relative to their costs. Further, because of the inherent limitations in all control systems, no evaluation of controls can provide absolute assurance that misstatements due to error or fraud will not occur or that all control issues and instances of fraud, if any, within the company have been detected. These inherent limitations include the realities that judgments in decision-making can be faulty and that breakdowns can occur because of simple errors or mistakes. Controls can also be circumvented by the individual acts of some persons, by collusion of two or more people, or by management override of the controls. The design of any system of controls is based in part on certain assumptions about the likelihood of future events, and there can be no assurance that any design will succeed in achieving its stated goals under all potential future conditions. Over time, controls may become inadequate because of changes in conditions or deterioration in the degree of compliance with policies or procedures.
Management’s Report on Internal Control Over Financial Reporting
Our management is responsible for establishing and maintaining adequate internal control over financial reporting as defined in Rule 13a-15(f) under the Securities Exchange Act of 1934. Our internal control over financial reporting is a process designed to provide reasonable assurance regarding the reliability of financial reporting and the preparation of our consolidated financial statements for external purposes in accordance with U.S. generally accepted accounting principles. Internal control over financial reporting includes those policies and procedures that (i) pertain to the maintenance of records that in reasonable detail accurately and fairly reflect the transactions and dispositions of the assets of the company; (ii) provide reasonable assurance that transactions are recorded as necessary to permit preparation of financial statements in accordance with U.S. generally accepted accounting principles, and that receipts and expenditures of the company are being made only in accordance with authorizations of management and directors of the company; and (iii) provide reasonable assurance regarding prevention or timely detection of unauthorized acquisition, use or disposition of the company’s assets that could have a material effect on the financial statements.
Under the supervision and with the participation of our management, including our Chief Executive Officer and Chief Financial Officer, we have conducted an evaluation of the effectiveness of our internal control over financial reporting based upon the criteria established in Internal Control — Integrated Framework (2013) issued by the Committee of Sponsoring Organizations of the Treadway Commission. Based on this evaluation, our management has concluded that our internal control over financial reporting was effective as of December 31, 2018 to provide reasonable assurance regarding the reliability of financial reporting and the preparation of financial statements for external reporting purposes in accordance with U.S. generally accepted accounting principles.
Because of its inherent limitations, a system of internal control over financial reporting can provide only reasonable assurances and may not prevent or detect misstatements. Also, projections of any evaluation of effectiveness to future periods are subject to the risk that controls may become inadequate because of changes in conditions, or that the degree of compliance with policies and procedures may deteriorate.
The effectiveness of Quanta Services, Inc.’s internal control over financial reporting as of December 31, 2018 has been audited by PricewaterhouseCoopers LLP, an independent registered public accounting firm, as stated in its report which appears herein.
Management’s assessment of the effectiveness of our internal control over financial reporting as of December 31, 2018 excluded the four acquisitions we completed in 2018. Such exclusion was in accordance with SEC guidance that an assessment of recently acquired businesses may be omitted in management’s report on internal control over financial reporting, provided the acquisition took place within twelve months of management’s evaluation. These acquisitions comprised approximately 0.9% and 0.6% of our consolidated assets and revenues as of and for the year ended December 31, 2018.
REPORT OF INDEPENDENT REGISTERED PUBLIC ACCOUNTING FIRM
To the Board of Directors and Stockholders of Quanta Services, Inc.:
Opinions on the Financial Statements and Internal Control over Financial Reporting
We have audited the accompanying consolidated balance sheets of Quanta Services, Inc. and its subsidiaries (the “Company”) as of December 31, 2018 and 2017, and the related consolidated statements of operations, comprehensive income, cash flows and equity for each of the three years in the period ended December 31, 2018, including the related notes (collectively referred to as the “consolidated financial statements”). We also have audited the Company’s internal control over financial reporting as of December 31, 2018, based on criteria established in Internal Control - Integrated Framework (2013) issued by the Committee of Sponsoring Organizations of the Treadway Commission (COSO).
In our opinion, the consolidated financial statements referred to above present fairly, in all material respects, the financial position of the Company as of December 31, 2018 and 2017, and the results of its operations and its cash flows for each of the three years in the period ended December 31, 2018 in conformity with accounting principles generally accepted in the United States of America. Also in our opinion, the Company maintained, in all material respects, effective internal control over financial reporting as of December 31, 2018, based on criteria established in Internal Control - Integrated Framework (2013) issued by the COSO.
*Basis for Opini
Showing the first 8K of 263K characters. Open the full section
Item 9. Changes in and Disagreements with Accountants on Accounting and Financial Disclosure
There have been no changes in or disagreements with accountants on accounting and financial disclosure within the parameters of Item 304(b) of Regulation S-K.
Item 9A. Controls and Procedures
Attached as exhibits to this Annual Report on Form 10-K are certifications of Quanta’s Chief Executive Officer and Chief Financial Officer that are required in accordance with Rule 13a-14 of the Securities Exchange Act of 1934, as amended (the Exchange Act). This Item 9A. section includes information concerning the controls and controls evaluation referred to in the certifications, and it should be read in conjunction with the certifications for a more complete understanding of the topics presented.
Evaluation of Disclosure Controls and Procedures
Our management has established and maintains a system of disclosure controls and procedures that are designed to provide reasonable assurance that information required to be disclosed by us in the reports that we file or submit under the Exchange Act, such as this Annual Report on Form 10-K, is recorded, processed, summarized and reported within the time periods specified in the SEC rules and forms. The disclosure controls and procedures are also designed to provide reasonable assurance that such information is accumulated and communicated to our management, including our Chief Executive Officer and Chief Financial Officer, as appropriate to allow timely decisions regarding required disclosure.
As of the end of the period covered by this Annual Report, we evaluated the effectiveness of the design and operation of our disclosure controls and procedures pursuant to Rule 13a-15(b) of the Exchange Act. This evaluation was carried out under the supervision and with the participation of our management, including our Chief Executive Officer and Chief Financial Officer. Based on this evaluation, these officers have concluded that, as of December 31, 2018, our disclosure controls and procedures were effective to provide reasonable assurance of achieving their objectives.
Evaluation of Internal Control over Financial Reporting
Management’s report on internal control over financial reporting can be found in Item 8. Financial Statements and Supplementary Data under the heading Report of Management and is incorporated herein by reference. The report of PricewaterhouseCoopers LLP, an independent registered public accounting firm, on the financial statements, and its opinion on the effectiveness of internal control over financial reporting, can also be found in Item 8. Financial Statements and Supplementary Data under the heading Report of Independent Registered Public Accounting Firm and is incorporated herein by reference.
There has been no change in our internal control over financial reporting that occurred during the quarter ended December 31, 2018 that has materially affected, or is reasonably likely to materially affect, our internal control over financial reporting.
Design and Operation of Control Systems
Our management, including the Chief Executive Officer and Chief Financial Officer, does not expect that our disclosure controls and procedures or our internal control over financial reporting will prevent or detect all errors and all fraud. A control system, no matter how well designed and operated, can provide only reasonable, not absolute, assurance that the control system’s objectives will be met. The design of a control system must reflect the fact that there are resource constraints, and the benefits of controls must be considered relative to their costs. Further, because of the inherent limitations in all control systems, no evaluation of controls can provide absolute assurance that misstatements due to error or fraud will not occur or that all control issues and instances of fraud, if any, within the company have been detected. These inherent limitations include the realities that judgments in decision-making can be faulty and breakdowns can occur because of simple errors or mistakes. Controls can be circumvented by the individual acts of some persons, by collusion of two or more people, or by management override of the controls. The design of any system of controls is based in part on certain assumptions about the likelihood of future events, and there can be no assurance that any design will succeed in achieving its stated goals under all potential future conditions. Over time, controls may become inadequate because of changes in conditions or deterioration in the degree of compliance with policies or procedures.
Item 9B. Other Information
None.
PART III
Item 10. Directors, Executive Officers and Corporate Governance
The information required by this Item 10 is incorporated by reference to our definitive proxy statement, which is to be filed with the SEC pursuant to the Exchange Act within 120 days following the end of our 2018 fiscal year.
Item 11. Executive Compensation
The information required by this Item 11 is incorporated by reference to our definitive proxy statement, which is to be filed with the SEC pursuant to the Exchange Act within 120 days following the end of our 2018 fiscal year.
Item 12. Security Ownership of Certain Beneficial Owners and Management and Related Stockholder Matters
The information required by this Item 12 is incorporated by reference to our definitive proxy statement, which is to be filed with the SEC pursuant to the Exchange Act within 120 days following the end of our 2018 fiscal year.
Item 13. Certain Relationships and Related Transactions, and Director Independence
The information required by this Item 13 is incorporated by reference to our definitive proxy statement, which is to be filed with the SEC pursuant to the Exchange Act within 120 days following the end of our 2018 fiscal year.
Item 14. Principal Accounting Fees and Services
The information required by this Item 14 is incorporated by reference to our definitive proxy statement, which is to be filed with the SEC pursuant to the Exchange Act within 120 days following the end of our 2018 fiscal year.
PART IV
Item 15. Exhibits and Financial Statement Schedules
The following financial statements, schedules and exhibits are filed as part of this Annual Report on Form 10-K:
(1) Consolidated financial statements. The consolidated financial statements are included in Item 8. Financial Statements and Supplementary Data of this Annual Report on Form 10-K.
(2) Financial statement schedules. All financial statement schedules are omitted because they are not applicable or the required information is shown in the consolidated financial statements or the notes to the consolidated financial statements in Item 8. Financial Statements and Supplementary Data of this Annual Report on Form 10-K.
(3) Exhibits.
EXHIBIT INDEX
| Exhibit | ||||
| No. | Description | |||
| 101.DEFˆ | — | XBRL Taxonomy Extension Definition Linkbase Document |
| * | Management contracts or compensatory plans or arrangements |
| ˆ | Filed with this Annual Report on Form 10-K |
| † | Furnished with this Annual Report on Form 10-K |
Item 16. Form 10-K Summary.
Not applicable.
SIGNATURES
Pursuant to the requirements of Section 13 or 15(d) of the Securities Exchange Act of 1934, Quanta Services, Inc. has duly caused this Report to be signed on its behalf by the undersigned, thereunto duly authorized, in the City of Houston, State of Texas, on February 28, 2019.
| QUANTA SERVICES, INC. |
| By: | /s/ EARL C. AUSTIN, JR. | |
| Earl C. Austin, Jr. President, Chief Executive Officer and Chief Operating Officer |
KNOW ALL PERSONS BY THESE PRESENTS, that each person whose signature appears below constitutes and appoints Earl C. Austin, Jr. and Derrick A. Jensen, each of whom may act without joinder of the other, as their true and lawful attorneys-in-fact and agents, each with full power of substitution and resubstitution, for such person and in his or her name, place and stead, in any and all capacities, to sign any and all amendments to this Annual Report on Form 10-K, and to file the same, with all exhibits thereto and other documents in connection therewith, with the Securities and Exchange Commission, granting unto said attorneys-in-fact and agents full power and authority to do and perform each and every act and thing requisite and necessary to be done in and about the premises, as fully to all intents and purposes as he might or could do in person, hereby ratifying and confirming all that said attorneys-in-fact and agents, or their substitutes, may lawfully do or cause to be done by virtue hereof.
Pursuant to the requirements of the Securities Exchange Act of 1934, this Report has been signed by the following persons in the capacities indicated on February 28, 2019.
| Signature | Title | |
| /s/ EARL C. AUSTIN, JR. | President, Chief Executive Officer, Chief Operating Officer and Director | |
| Earl C. Austin, Jr. | (Principal Executive Officer) | |
| /s/ DERRICK A. JENSEN | Chief Financial Officer | |
| Derrick A. Jensen | (Principal Financial Officer) | |
| /s/ JERRY K. LEMON | Chief Accounting Officer | |
| Jerry K. Lemon | (Principal Accounting Officer) | |
| /s/ DOYLE N. BENEBY | Director | |
| Doyle N. Beneby | ||
| /s/ J. MICHAL CONAWAY | Director | |
| J. Michal Conaway | ||
| /s/ VINCENT D. FOSTER | Director | |
| Vincent D. Foster | ||
| /s/ BERNARD FRIED | Director | |
| Bernard Fried | ||
| /s/ WORTHING F. JACKMAN | Director | |
| Worthing F. Jackman | ||
| /s/ DAVID M. McCLANAHAN | Chairman of the Board of Directors | |
| David M. McClanahan | ||
| /s/ MARGARET B. SHANNON | Director | |
| Margaret B. Shannon | ||
| /s/ PAT WOOD, III | Director | |
| Pat Wood, III |