 filings.tools
Item 5. Market for Registrant’s Common Equity, Related Stockholder Matters and Issuer Purchases of Equity Securities
8K characters. Original on sec.gov · Markdown
Item 5. Market for Registrant’s Common Equity, Related Stockholder Matters and Issuer Purchases of Equity Securities
Our common stock is listed on the New York Stock Exchange (NYSE) under the symbol “PWR.”
On February 25, 2020, there were approximately 590 holders of record of our common stock. See Note 11 of the Notes to Consolidated Financial Statements in Item 8. Financial Statements and Supplementary Data for additional discussion of our equity securities.
Unregistered Sales of Securities During the Fourth Quarter of 2019
None.
Subsequent to December 31, 2019, we issued 36,183 shares of our common stock to the former owners of an acquired business in exchange, on a one-for-one basis, for exchangeable shares in a Canadian subsidiary of Quanta that were held by the former owners. The former owners originally received the exchangeable shares as partial consideration for the sale of the acquired business. The shares of common stock issued in these transactions were issued in reliance upon the exemption from registration provided by Section 4(a)(2) of the Securities Act of 1933, as amended, as the shares were issued to the owners of the business acquired in a privately negotiated transaction not involving any public offering or solicitation.
Issuer Purchases of Equity Securities During the Fourth Quarter of 2019
The following table contains information about our purchases of equity securities during the three months ended December 31, 2019.
| Period | Total Number of Shares Purchased | Average Price Paid per Share | Total Number of Shares Purchased as Part of Publicly Announced Plans or Programs | Maximum Number (or Approximate Dollar Value) of Shares That May Yet be Purchased Under the Plans or Programs**(1)** | ||||||||||
| October 1 - 31, 2019 | ||||||||||||||
| Open Market Stock Repurchases (1) | — | $ | — | — | $ | 286,756,122 | ||||||||
| Tax Withholdings (2) | 5,185 | $ | 36.50 | — | ||||||||||
| November 1 - 30, 2019 | ||||||||||||||
| Open Market Stock Repurchases (1) | — | $ | — | — | $ | 286,756,122 | ||||||||
| Tax Withholdings (2) | 12,905 | $ | 42.25 | — | ||||||||||
| December 1 - 31, 2019 | ||||||||||||||
| Open Market Stock Repurchases (1) | — | $ | — | — | $ | 286,756,122 | ||||||||
| Tax Withholdings (2) | 5 | $ | 37.07 | — | ||||||||||
| Total | 18,095 | — | $ | 286,756,122 |
| (1) | Includes shares repurchased as of the trade date of such repurchases. On September 4, 2018, we issued a press release announcing that our Board of Directors approved a stock repurchase program that authorizes us to purchase, from time to time through June 30, 2021, up to $500.0 million of our outstanding common stock. Repurchases under this program can be made in open market and privately negotiated transactions, at our discretion, based on market and business conditions, applicable contractual and legal requirements and other factors. This program does not obligate us to acquire any specific amount of common stock and may be modified or terminated by our Board of Directors at any time at its sole discretion and without notice. |
| (2) | Includes shares purchased from employees to satisfy tax withholding obligations in connection with the vesting of restricted stock unit and performance stock units or the settlement of previously vested but deferred restricted stock unit awards. |
Dividends
We have declared a quarterly dividend during each quarter beginning in the fourth quarter of 2018. The declaration, payment and amount of future cash dividends will be at the discretion of our Board of Directors after taking into account various factors, including our financial condition, results of operations, cash flows from operations, current and anticipated capital requirements and expansion plans, income tax laws then in effect and the requirements of Delaware law. In addition, as discussed in Liquidity and Capital Resources — Debt Instruments — Senior Secured Credit Facility in Item 7. Management’s Discussion and Analysis of Financial Condition and Results of Operations, the credit agreement restricts the payment of cash dividends unless certain conditions are met.
Performance Graph
The following Performance Graph and related information shall not be deemed “soliciting material” or to be “filed” with the Securities and Exchange Commission, nor shall such information be incorporated by reference into any future filing under the Securities Act of 1933 or Securities Exchange Act of 1934, each as amended, except to the extent that we specifically incorporate it by reference into such filing.
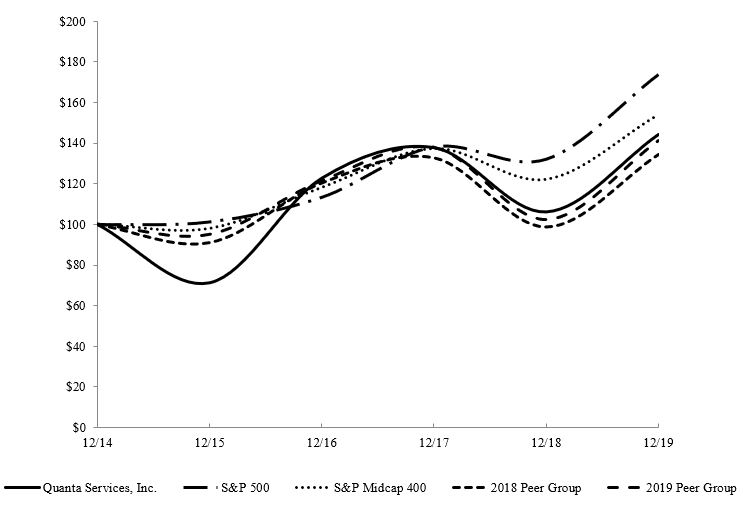
The following graph compares, for the period from December 31, 2014 to December 31, 2019, the cumulative stockholder return on our common stock with the cumulative total return of the S&P 500 Index (the S&P 500), the S&P MidCap 400 Index (the S&P 400) and two peer groups selected by our management that include public companies within our industries. The companies in the peer groups were selected to represent a broad group of publicly held corporations with operations similar to ours. The current peer group (the 2019 Peer Group) includes AECOM, Dycom Industries, Inc., EMCOR Group Inc., Fluor Corporation, Jacobs Engineering Group Inc., KBR, Inc., MasTec, Inc., MYR Group Inc. and Primoris Services Corporation. The peer group used in the previous year (the 2018 Peer Group) included each of the foregoing companies, as well as McDermott International, Inc., but did not include Dycom Industries, Inc. We determined that McDermott International, Inc. should be excluded due to dissimilarities with respect to its financial condition and end markets and that Dycom Industries, Inc. should be added due to its similarities with respect to market capitalization, lines of business and end markets.
The graph below assumes an investment of $100 (with reinvestment of all dividends) in our common stock, the S&P 500, the S&P MidCap 400, the 2018 Peer Group and the 2019 Peer Group on December 31, 2014 and tracks their relative performance through December 31, 2019. The returns of each company in the Peer Group are weighted based on the market capitalization of that company at the beginning of the measurement period. The stock price performance reflected in the following graph is not necessarily indicative of future stock price performance.
COMPARISON OF 5 YEAR CUMULATIVE TOTAL RETURN
Among Quanta Services, Inc., the S&P 500, the S&P MidCap 400, the 2018 Peer Group and the 2019 Peer Group
| December 31, | ||||||||||||||||||||||||
| 2014 | 2015 | 2016 | 2017 | 2018 | 2019 | |||||||||||||||||||
| Quanta Services, Inc. | $ | 100.00 | $ | 71.33 | $ | 122.75 | $ | 137.76 | $ | 106.16 | $ | 144.21 | ||||||||||||
| S&P 500 | $ | 100.00 | $ | 101.38 | $ | 113.51 | $ | 138.29 | $ | 132.23 | $ | 173.86 | ||||||||||||
| S&P MidCap 400 | $ | 100.00 | $ | 97.82 | $ | 118.11 | $ | 137.30 | $ | 122.08 | $ | 154.07 | ||||||||||||
| 2018 Peer Group | $ | 100.00 | $ | 91.21 | $ | 120.39 | $ | 132.69 | $ | 98.83 | $ | 134.34 | ||||||||||||
| 2019 Peer Group | $ | 100.00 | $ | 94.95 | $ | 121.47 | $ | 137.81 | $ | 102.22 | $ | 141.28 |
Previous: Item 4. Mine Safety Disclosures · Next: Item 6. Selected Financial Data