 filings.tools
Item 5. Market for the Registrant's Common Equity, Related Stockholder Matters, and Issuer Purchases of Equity Securities
6K characters. Original on sec.gov · Markdown
Item 5. Market for the Registrant's Common Equity, Related Stockholder Matters, and Issuer Purchases of Equity Securities
Our common stock is traded on the New York Stock Exchange under the symbol "REG." The following table sets forth the high and low sales prices and the cash dividends declared on our common stock by quarter for 2017 and 2016.
| 2017 | 2016 | |||||||||||||||||||
| Quarter Ended | High Price | Low Price | Cash Dividends Declared | High Price | Low Price | Cash Dividends Declared | ||||||||||||||
| March 31 | $ | 72.05 | 61.90 | 0.51 | $ | 77.17 | 66.05 | 0.50 | ||||||||||||
| June 30 | 69.07 | 58.63 | 0.53 | 83.73 | 72.35 | 0.50 | ||||||||||||||
| September 30 | 67.67 | 60.80 | 0.53 | 85.35 | 75.76 | 0.50 | ||||||||||||||
| December 31 | 70.64 | 61.19 | 0.53 | 77.25 | 65.16 | 0.50 |
We have determined that the dividends paid during 2017 and 2016 on our common stock qualify for the following tax treatment:
| Total Distribution per Share | Ordinary Dividends | Total Capital Gain Distributions | Nontaxable Distributions | Unrecapt Sec 1250 Gain | ||||||||||||
| 2017 | $ | 2.10 | 1.81 | 0.21 | 0.08 | 0.02 | ||||||||||
| 2016 | 2.00 | 1.06 | 0.16 | 0.78 | 0.16 |
As of February 9, 2018, there were 65,170 holders of common equity.
We intend to pay regular quarterly distributions to Regency Centers Corporation's common stockholders. Future distributions will be declared and paid at the discretion of our Board of Directors and will depend upon cash generated by operating activities, our financial condition, capital requirements, annual dividend requirements under the REIT provisions of the Internal Revenue Code of 1986, as amended, and such other factors as our Board of Directors deems relevant. In order to maintain Regency Centers Corporation's qualification as a REIT for federal income tax purposes, we are generally required to make annual distributions at least equal to 90% of our real estate investment trust taxable income for the taxable year. Under certain circumstances, which we do not expect to occur, we could be required to make distributions in excess of cash available for distributions in order to meet such requirements. We have a dividend reinvestment plan under which shareholders may elect to reinvest their dividends automatically in common stock. Under the plan, we may elect to purchase common stock in the open market on behalf of shareholders or may issue new common stock to such stockholders.
Under the loan agreement of our line of credit, in the event of any monetary default, we may not make distributions to stockholders except to the extent necessary to maintain our REIT status.
On February 7, 2018, our board of directors (the "Board") authorized a share repurchase program for up to $250 million of shares of our common stock. The share repurchase program authorizes us to purchase from time to time our outstanding common stock through open market purchases and/or in privately negotiated transactions. Any shares purchased will be retired. The program is scheduled to expire on February 6, 2020. The timing of share purchases under this new program depends upon marketplace conditions and other factors, and the program remains subject to the discretion of the Board.
There were no unregistered sales of equity securities during the quarter ended December 31, 2017.
The following table represents information with respect to purchases by the Parent Company of its common stock
during the months in the three month period ended December 31, 2017:
| Period | Total number of shares purchased (1) | Average price paid per share | Total number of shares purchased as part of publicly announced plans or programs | Maximum number or approximate dollar value of shares that may yet be purchased under the plans or programs | ||||||
| October 1, 2017, through October 31, 2017 | 61 | $ | 64.31 | — | — | |||||
| November 1, 2017, through November 30, 2017 | — | $ | — | — | — | |||||
| December 1, 2017, through December 31, 2017 | — | $ | — | — | — | |||||
| (1) Represents shares delivered in payment of withholding taxes in connection with option exercises or restricted stock vesting by participants under Regency's Long-Term Omnibus Plan. |
The performance graph furnished below shows Regency's cumulative total stockholder return to the S&P 500 Index, the FTSE NAREIT Equity REIT Index, and the FTSE NAREIT Equity Shopping Centers index since December 31, 2012. The stock performance graph should not be deemed filed or incorporated by reference into any other filing made by us under the Securities Act of 1933 or the Securities Exchange Act of 1934, except to the extent that we specifically incorporate the stock performance graph by reference in another filing.
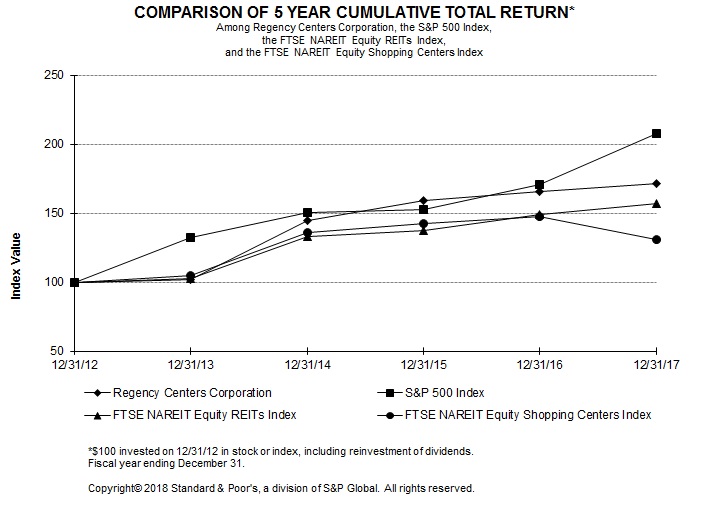
| 12/31/12 | 12/31/13 | 12/31/14 | 12/31/15 | 12/31/16 | 12/31/17 | |||||||||
| Regency Centers Corporation | $ | 100.00 | 101.81 | 145.11 | 159.66 | 166.00 | 171.96 | |||||||
| S&P 500 | 100.00 | 132.39 | 150.51 | 152.59 | 170.84 | 208.14 | ||||||||
| FTSE NAREIT Equity REITs | 100.00 | 102.47 | 133.35 | 137.61 | 149.33 | 157.14 | ||||||||
| FTSE NAREIT Equity Shopping Centers | 100.00 | 104.99 | 136.45 | 142.89 | 148.14 | 131.31 |
Previous: Item 4. Mine Safety Disclosures · Next: Item 6. Selected Financial Data