 filings.tools
Regency Centers 10-K 2022-12-31
Filed 2023-02-17. 20 sections, 624K characters. Original on sec.gov · Markdown · JSON
Cover and table of contents
UNITED STATES
SECURITIES AND EXCHANGE COMMISSION
Washington, DC 20549
FORM 10-K
| ☒ | ANNUAL REPORT PURSUANT TO SECTION 13 OR 15(d) OF THE SECURITIES EXCHANGE ACT OF 1934 |
For the fiscal year ended December 31, 2022
or
| ☐ | TRANSITION REPORT PURSUANT TO SECTION 13 OR 15(d) OF THE SECURITIES EXCHANGE ACT OF 1934 |
For the transition period from to
Commission File Number 1-12298 (Regency Centers Corporation)
Commission File Number 0-24763 (Regency Centers, L.P.)
REGENCY CENTERS CORPORATION
REGENCY CENTERS, L.P.
(Exact name of registrant as specified in its charter)
| Florida (REGENCY CENTERS CORPORATION) | 59-3191743 | |
| Delaware (REGENCY CENTERS, L.P.) |  | 59-3429602 |
| (State or other jurisdiction of incorporation or organization) | (I.R.S. Employer Identification No.) | |
| One Independent Drive**,** Suite 114 Jacksonville**,** Florida 32202 | (904) 598-7000 | |
| (Address of principal executive offices) (zip code) | (Registrant's telephone number, including area code) |
Securities registered pursuant to Section 12(b) of the Act:
Regency Centers Corporation
| Title of each class | Trading Symbol | Name of each exchange on which registered | ||
| Common Stock, $.01 par value | REG | The Nasdaq Stock Market LLC |
Regency Centers, L.P.
| Title of each class | Trading Symbol | Name of each exchange on which registered | ||
| None | N/A | N/A |
Securities registered pursuant to Section 12(g) of the Act:
Regency Centers Corporation: None
Regency Centers, L.P.: Units of Partnership Interest
Indicate by check mark if the registrant is a well-known seasoned issuer, as defined in Rule 405 of the Securities Act.
Regency Centers Corporation Yes ☒ No ☐ Regency Centers, L.P. Yes ☒ No ☐
Indicate by check mark if the registrant is not required to file reports pursuant to Section 13 or Section 15(d) of the Act
Regency Centers Corporation Yes ☐ No ☒ Regency Centers, L.P. Yes ☐ No ☒
Indicate by check mark whether the registrant (1) has filed all reports required to be filed by Section 13 or 15(d) of the Securities Exchange Act of 1934 during the preceding 12 months (or for such shorter period that the registrant was required to file such reports), and (2) has been subject to such filing requirements for the past 90 days.
Regency Centers Corporation Yes ☒ No ☐ Regency Centers, L.P. Yes ☒ No ☐
Indicate by check mark whether the registrant has submitted electronically every Interactive Data File required to be submitted pursuant to Rule 405 of Regulation S-T (§232.405 of this chapter) during the preceding 12 months (or for such shorter period that the registrant was required to submit such files).
Regency Centers Corporation Yes ☒ No ☐ Regency Centers, L.P. Yes ☒ No ☐
Indicate by check mark whether the registrant is a large accelerated filer, an accelerated filer, a non-accelerated filer, a smaller reporting company, or an emerging growth company. See the definitions of "large accelerated filer," "accelerated filer," "smaller reporting company," and "emerging growth company" in Rule 12b-2 of the Exchange Act. (Check one):
Regency Centers Corporation:
| Large accelerated filer | ☒ | Accelerated filer | ☐ | Emerging growth company | ☐ |
| Non-accelerated filer | ☐ | Smaller reporting company | ☐ |
Regency Centers, L.P.:
| Large accelerated filer | ☐ | Accelerated filer | ☐ | Emerging growth company | ☐ |
| Non-accelerated filer | ☒ | Smaller reporting company | ☐ |
If an emerging growth company, indicate by check mark if the registrant has elected not to use the extended transition period for complying with any new or revised financial accounting standards provided pursuant to Section 13(a) of the Exchange Act.
Regency Centers Corporation ☐ Regency Centers, L.P. ☐
Indicate by check mark whether the registrant has filed a report on and attestation to its management’s assessment of the effectiveness of its internal control over financial reporting under Section 404(b) of the Sarbanes-Oxley Act (15 U.S.C. 7262(b)) by the registered public accounting firm that prepared or issued its audit report.
Regency Centers Corporation ☒ Regency Centers, L.P. ☒
If securities are registered pursuant to Section 12(b) of the Act, indicate by check mark whether the financial statements of the registrant included in the filing reflect the correction of an error to previously issued financial statements.1
Regency Centers Corporation ☐ Regency Centers, L.P. ☐
Indicate by check mark whether any of those error corrections are restatements that required a recovery analysis of incentive-based compensation received by any of the registrant's executive officers during the relevant recovery period pursuant to Section 240.10D-1(b).1
Regency Centers Corporation ☐ Regency Centers, L.P. ☐
Indicate by check mark whether the registrant is a shell company (as defined in Rule 12b-2 of the Act).
Regency Centers Corporation Yes ☐ No ☒ Regency Centers, L.P. Yes ☐ No ☒
State the aggregate market value of the voting and non-voting common equity held by non-affiliates computed by reference to the price at which the common equity was last sold, or the average bid and asked price of such common equity, as of the last business day of the registrants' most recently completed second fiscal quarter.
Regency Centers Corporation $10.1 billion Regency Centers, L.P. N/A
The number of shares outstanding of the Regency Centers Corporation’s common stock was 171,307,927 as of February 16, 2023.
Documents Incorporated by Reference
Portions of Regency Centers Corporation's proxy statement, prepared in connection with its upcoming 2023 Annual Meeting of Stockholders, are incorporated by reference in Part III of this Annual Report on Form 10-K to the extent described therein.
1 Per SEC guidance, this blank checkbox is included on this cover page but no disclosure with respect thereto shall be made until the adoption and effectiveness of related stock exchange listing standards.
EXPLANATORY NOTE
This Annual Report on Form 10-K (this "Report") combines the annual reports on Form 10-K for the year ended December 31, 2022, of Regency Centers Corporation and Regency Centers, L.P. Unless stated otherwise or the context otherwise requires, references to "Regency Centers Corporation" or the "Parent Company" mean Regency Centers Corporation and its controlled subsidiaries and references to "Regency Centers, L.P." or the "Operating Partnership" mean Regency Centers, L.P. and its controlled subsidiaries. The terms "we," "our," "us," "the Company", "Regency Centers" and "Regency" as used in this Report mean the Parent Company and the Operating Partnership, collectively.
The Parent Company is a real estate investment trust ("REIT") and the general partner of the Operating Partnership. The Operating Partnership's capital includes general and limited common Partnership Units ("Units"). As of December 31, 2022, the Parent Company owned approximately 99.6% of the Units in the Operating Partnership. The remaining limited Units are owned by third party investors. As the sole general partner of the Operating Partnership, the Parent Company has exclusive control of the Operating Partnership's day-to-day management.
We believe combining the annual reports on Form 10-K of the Parent Company and the Operating Partnership into this single report provides the following benefits:
Enhances investors' understanding of the Parent Company and the Operating Partnership by enabling investors to view the business as a whole in the same manner as management views and operates the business;
Eliminates duplicative disclosure and provides a more streamlined and readable presentation; and
Creates time and cost efficiencies through the preparation of one combined report instead of two separate reports.
Management operates the Parent Company and the Operating Partnership as one business. The management of the Parent Company consists of the same individuals as the management of the Operating Partnership. These individuals are officers of the Parent Company and employees of the Operating Partnership.
The Company believes it is important to understand the key differences between the Parent Company and the Operating Partnership in the context of how the Parent Company and the Operating Partnership operate as a consolidated company. The Parent Company is a REIT, whose only material asset is its ownership of Units of partnership interests of the Operating Partnership. As a result, the Parent Company does not conduct business itself, other than acting as the sole general partner of the Operating Partnership, issuing public equity from time to time and guaranteeing certain debt of the Operating Partnership. Except for $200 million of unsecured private placement debt, the Parent Company does not hold any indebtedness, but guarantees all of the unsecured debt of the Operating Partnership. The Operating Partnership is also the co-issuer and guarantees the $200 million of Parent Company debt. The Operating Partnership holds all the assets of the Company and retains the ownership interests in the Company's joint ventures. Except for net proceeds from public equity issuances by the Parent Company, which are contributed to the Operating Partnership in exchange for partnership units, the Operating Partnership generates all remaining capital required by the Company's business. These sources include the Operating Partnership's operations, its direct or indirect incurrence of indebtedness, and the issuance of partnership units.
Stockholders' equity, partners' capital, and noncontrolling interests are the main areas of difference between the Consolidated Financial Statements of the Parent Company and those of the Operating Partnership. The Operating Partnership's capital includes general and limited common Partnership Units. The limited partners' Units in the Operating Partnership owned by third parties are accounted for in partners' capital in the Operating Partnership's financial statements and outside of stockholders' equity in noncontrolling interests in the Parent Company's financial statements.
In order to highlight the differences between the Parent Company and the Operating Partnership, there are sections in this Report that separately discuss the Parent Company and the Operating Partnership, including separate financial statements, controls and procedures sections, and separate Exhibit 31 and 32 certifications. In the sections that combine disclosure for the Parent Company and the Operating Partnership, this Report refers to actions or holdings as being actions or holdings of the Company.
As general partner with control of the Operating Partnership, the Parent Company consolidates the Operating Partnership for financial reporting purposes, and the Parent Company does not have assets other than its investment in the Operating Partnership. Therefore, while stockholders' equity and partners' capital differ as discussed above, the assets and liabilities of the Parent Company and the Operating Partnership are the same on their respective financial statements.
TABLE OF CONTENTS
Forward-Looking Statements
Certain statements in this document regarding anticipated financial, business, legal or other outcomes including business and market conditions, outlook and other similar statements relating to Regency's future events, developments, or financial or operational performance or results, are "forward-looking statements" made pursuant to the safe harbor provisions of the Private Securities Litigation Reform Act of 1995 and other federal securities laws. These forward-looking statements are identified by the use of words such as "may," "will," "could," "should," "would," "expect," "estimate," "believe," "intend," "forecast," "project," "anticipate," "guidance," and other similar language. However, the absence of these or similar words or expressions does not mean a statement is not forward-looking. While we believe these forward-looking statements are reasonable when made, forward-looking statements are not guarantees of future performance or events and undue reliance should not be placed on these statements. Although we believe the expectations reflected in any forward-looking statements are based on reasonable assumptions, we can give no assurance these expectations will be attained, and it is possible actual results may differ materially from those indicated by these forward-looking statements due to a variety of risks and uncertainties.
Our operations are subject to a number of risks and uncertainties including, but not limited to, those described in "Item 1A. Risk Factors" of this Report. When considering an investment in our securities, you should carefully read and consider these risks, together with all other information in our Annual Reports on Form 10-K, Quarterly Reports on Form 10-Q, and our other filings with and submissions to the Securities and Exchange Commission ("SEC"). If any of the events described in the risk factors actually occur, our business, financial condition or operating results, as well as the market price of our securities, could be materially adversely affected. Forward-looking statements are only as of the date they are made, and Regency undertakes no duty to update its forward-looking statements, whether as a result of new information, future events or developments or otherwise, except as and to the extent required by law.
PAR****T I
Item 1. Business
Regency Centers Corporation is a fully integrated real estate company and self-administered and self-managed real estate investment trust that began its operations as a publicly-traded REIT in 1993. Our corporate headquarters are located at One Independent Drive, Suite 114, Jacksonville, Florida. Regency Centers, L.P. is the entity through which Regency Centers Corporation conducts substantially all of its operations and owns substantially all of its assets. Our business consists of acquiring, developing, owning, and operating income-producing retail real estate principally located in top markets within the United States. We generate revenues by leasing space to necessity, service, convenience, and value-based retailers serving the essential needs of our communities. Regency has been an S&P 500 Index member since 2017.
As of December 31, 2022, we had full or partial ownership interests in 404 properties, primarily anchored by market leading grocery stores, encompassing 51.1 million square feet ("SF") of gross leasable area ("GLA"). Our Pro-rata share of this GLA is 43.3 million square feet, including our share of properties owned through unconsolidated investment partnerships.
We are a preeminent national owner, operator, and developer of shopping centers located in suburban trade areas with compelling demographics. Our mission is to create thriving environments for retailers and service providers to connect with surrounding neighborhoods and communities. Our vision is to elevate quality of life as an integral thread in the fabric of our communities. Our portfolio includes thriving properties merchandised with highly productive grocers, restaurants, service providers, and best-in-class retailers that connect with their neighborhoods, communities, and customers.
Our values:
We are our people: Our people are our greatest asset, and we believe a talented team from differing backgrounds and experiences makes us better.
We do what is right: We act with unwavering standards of honesty and integrity.
We connect with our communities: We promote philanthropic ideas and strive for the betterment of our neighborhoods by giving our time and financial support.
We are responsible: Our duty is to balance purpose and profit, being good stewards of capital and the environment for the benefit of all our stakeholders.
We strive for excellence: When we are passionate about what we do, it is reflected in our performance.
We are better together: When we listen to each other and our customers, we will succeed together.
Our goals are to:
Own and manage a portfolio of high-quality neighborhood and community shopping centers primarily anchored by market leading grocers and principally located in suburban trade areas in the most desirable metro areas in the United States of America ("USA" or "United States"). We believe that this strategy will result in highly desirable and attractive centers with best-in-class retailers. These centers should command higher rental and occupancy rates resulting in excellent prospects to grow net operating income ("NOI");
Maintain an industry leading and disciplined development and redevelopment platform to create exceptional retail centers that deliver favorable returns;
Support our business activities with a conservative capital structure, including a strong balance sheet with sufficient liquidity to meet our capital needs together with a carefully constructed debt maturity profile;
Implement leading environmental, social, and governance ("ESG") practices through our Corporate Responsibility Program;
Engage and retain an exceptional and diverse team that is guided by our strong values, while fostering an environment of innovation and continuous improvement; and
Create shareholder value by increasing earnings and dividends per share that generate total returns at or near the top of our shopping center peers.
Key strategies to achieve our goals are to:
Generate same property NOI growth that over the long-term consistently ranks at or near the top of our shopping center peers;
Reinvest free cash flow and portfolio enhancement disposition proceeds into high-quality developments, redevelopments and acquisitions in a long term accretive manner;
Maintain a conservative balance sheet that provides liquidity, financial flexibility and cost effective funding of investment opportunities, while also managing debt maturities that enable us to weather economic downturns;
Pursue best-in-class ESG programs and practices; and
Attract, retain, and engage an exceptional and diverse team that is guided by our values while fostering an environment of innovation and continuous improvement.
Competition
We are among the largest owners of shopping centers in the USA based on revenues, number of properties, GLA, and market capitalization. There are numerous companies and individuals engaged in the ownership, development, acquisition, and operation of shopping centers that compete with us in our targeted markets, including grocery store chains that own shopping centers and also anchor some of our shopping centers. This results in competition for attracting tenants as well as acquiring existing shopping centers and new development sites. In addition, brick and mortar shopping centers face continued competition from alternative shopping and delivery methods. We believe that our competitive advantages are driven by:
the market areas in which we operate, and the locations of our shopping centers within those market areas;
the design of our shopping centers including our strategy of maintaining and renovating these centers to our high standards of quality;
the compelling demographics surrounding our shopping centers;
our relationships with our anchor, shop, and out-parcel tenants;
our management experience and expertise; and
our ability to successfully develop, redevelop, and acquire shopping centers.
Corporate Responsibility and Human Capital
While executing our mission, we strive to achieve best-in-class corporate responsibility. Corporate responsibility, including our focus on ESG practices, is a foundational strategy of Regency. We believe that alignment of strategy and sustainable outcomes is critical to the long-term success of our Company, our shareholders, and the environment. Our ESG practices are built on four pillars:
Our People;
Our Communities;
Ethics and Governance; and
Environmental Stewardship.
These practices are guided by three overarching concepts: long-term value creation, our Regency brand and reputation, and the importance of maintaining our culture. Our continued commitment to these concepts guides our business strategy and helps us identify and address key corporate responsibility-related matters.
We regularly review our corporate responsibility (which term we use interchangeably with "ESG") strategies, goals, and objectives with our Board of Directors and its committees, which oversee our programs. More information about our corporate responsibility strategy, goals, performance, and reporting, including our annual Corporate Responsibility report, our Task Force on Climate-related Financial Disclosures ("TCFD") report, and our policies and practices related to corporate responsibility, is available on our website at www.regencycenters.com. The content of our website and other information contained therein, including relating to corporate responsibility, is not incorporated by reference into this Report or in any other report or document we file with the SEC, and any references to our website are intended to be inactive textual references only.
Our People – Our people are our most important asset, and we strive to ensure that they are engaged, passionate about their work, connected to their teams, and supported to deliver their best performance. Regency recognizes and values the importance of attracting and retaining talented individuals with different skills, backgrounds, and experiences to encourage diversity of thoughts and ideas. In addition, we strive to maintain a safe and healthy workspace, promote employee well-being, and empower our employees by focusing on their personal and professional development through training and education opportunities.
As of December 31, 2022, we had 445 employees, including 5 part-time employees. We presently maintain 22 market offices nationwide, including our corporate headquarters in Jacksonville, Florida. None of our employees are represented by a collective bargaining unit, and we believe our relationship with our employees is good.
In 2022, we continued implementing our comprehensive, multi-year diversity, equity, and inclusion ("DEI") strategy focused on promoting and advancing diversity across our organization, enabling our employees to grow and succeed, and supporting social justice initiatives in our operations and broader communities. Furthermore, aligned with our near-and long-term human capital goals, we remained focused on employee engagement, leveraging our annual employee survey to identify opportunities to improve and further engage our people. Additionally, we continued to develop our employees and look for new opportunities to ensure we attract and retain our most important assets: our people.
Diversity, Equity, and Inclusion - We believe that much of our success is rooted in the diversity and inclusion of our teams and our commitment to a diverse and inclusive culture. We value diversity at all levels and focus on extending our DEI initiatives across our workforce. We continue to foster a culture in which everyone is respected, valued, and has an equal opportunity to contribute and thrive. Our commitment is unwavering, and we remain focused on building a workforce that represents the many customers we serve and the communities in which we operate.
Our most recent U.S. Equal Employment Opportunity Commission EEO-1 survey data can be found on our website, including additional information related to employee gender and ethnic diversity.
Human Rights – Regency is committed to a workplace free from discrimination and harassment and is focused on advancing fundamental human rights. Anti-discrimination and anti-harassment training is provided to all employees at orientation, and annually thereafter.
Talent Attraction and Retention – Our core values place a strong importance on our people, which we believe makes us an employer of choice. We understand the importance of attracting and retaining the best talent to build long-term value. We strive to offer some of the most competitive pay and benefits in the industry in which we operate and are continually looking for new opportunities to ensure that we attract and retain our people.
Training and Development– We strive to provide an environment where our people are connected to their teams, passionate about what they do, and supported to deliver their best efforts and results. From individual contributors to managers and senior leaders, we want to empower our employees to take control of their career growth and realize their full potential through meaningful training and development opportunities.
Health, Safety, and Well-Being – The safety, health, and well-being of our people are a top priority for Regency. We strive to provide a benefit package that is comprehensive, competitive, and thoughtfully designed to attract and retain the best in the business. We prioritize employee safety at our centers and offices, and require contractors working at our sites to engage in safe work practices.
Our Communities – Our predominately grocery-anchored neighborhood and community shopping centers provide many benefits to the communities in which we live and work, including significant local economic impacts in the form of investment, jobs, and taxes. Our local teams are passionate about investing in and engaging with our communities as they customize and cultivate our centers to create a distinctive environment to bring our tenants and shoppers together for the best retail experience.
We believe philanthropy and charitable giving are important elements of our corporate responsibility commitment. Throughout 2022, Regency supported its employees to serve and invest in community organizations through volunteer and financial support. Charitable contributions were made directly by the Company, as well as by the vast majority of our employees who donated their time and money to local non-profits directly serving their communities. Furthermore, as part of our strategy, we continued to improve our communities by investing in property enhancements and placemaking at our new and existing shopping centers.
Ethics and Governance – As long-term stewards of our investors’ capital, we are committed to best-in-class corporate governance. To create long-term value for our stakeholders, we place great emphasis on our culture and core values, the integrity and transparency of our reporting practices, and our overall governance structure in respect of oversight and shareholder rights.
To achieve the right mix of skills, experience, backgrounds, tenures, and competencies, including diversity in terms of gender, ethnic background, age, and other attributes, Regency’s board of directors annually reviews its overall board composition. In 2022, Regency announced the appointment of Kristin A. Campbell to our board of directors, effective January 15, 2023. Mrs. Campbell’s appointment aligns with Regency’s ongoing commitment to board refreshment and best-in-class corporate governance.
Environmental Stewardship – We believe sustainability is in the best interest of our investors, tenants, employees, and the communities in which we operate, and we strive to integrate sustainable practices throughout our business.
We have seven strategic priorities for identifying and implementing sustainable business practices and minimizing our environmental impact: green building, energy efficiency, renewable energy, greenhouse gas emissions ("GHG") reduction, water conservation, waste management, and climate change analysis. We believe these strategic priorities are not only the right thing to do to address environmental concerns such as air pollution, climate change, and resource scarcity but also support us in achieving key strategic objectives in our operations and development projects.
During 2022, we remained committed to measuring and reducing our GHG emissions. Earlier in the year, we refined our strategy and elevated our commitment by aligning our goals with the Science Based Targets initiative ("SBTi"). We have committed to reducing our absolute Scope 1 and 2 GHG emissions by 28% by 2030 from a 2019 base year, endorsed by the SBTi, and to achieve net-zero Scope 1 and 2 GHG emissions across all operations by 2050. Concurrently, we announced new near-and long-term goals to demonstrate our commitment to environmental sustainability as described in our 2021 Corporate Responsibility Report. Based on our current estimates and asset base, we do not expect these commitments to materially impact our operating results and financial condition.
As a long-term owner, operator, and developer of real estate, we acknowledge the potential for climate change to have a material impact on our properties, people, and long-term success. Regency wants to ensure that our properties can safely, sustainably, and responsibly withstand the test of time. We continue to refine our understanding of our exposure to climate-related impacts by conducting ongoing property-level analysis. We continue our efforts to understand and address the risks that climate change may pose to our business.
Compliance with Governmental Regulations
We are subject to various regulatory and tax-related requirements within the jurisdictions in which we operate. Changes to such requirements may result in unanticipated material financial impacts or adverse tax consequences and could materially affect our operating results and financial condition. Significant regulatory requirements include the laws and regulations described below.
REIT Laws and Regulations
We have elected to be taxed as a REIT under the federal income tax laws. As a REIT, we are generally not subject to federal income tax on taxable income that we distribute to our stockholders. Under the Internal Revenue Code (the "Code"), REITs are subject to numerous regulatory requirements, including the requirement to generally distribute at least 90% of taxable income each year. We will be subject to federal income tax on our taxable income at regular corporate rates if we fail to qualify as a REIT for tax purposes in any taxable year, or to the extent we distribute less than 100% of our taxable income. We will also generally not qualify for treatment as a REIT for federal income tax purposes for four years following the year during which qualification is lost. Even if we qualify as a REIT for federal income tax purposes, we may be subject to certain state and local income and franchise taxes and to federal income and excise taxes on our undistributed taxable income.
We have elected to treat certain of our subsidiaries as taxable REIT subsidiaries ("TRS"). In general, a TRS may engage in any real estate business and certain non-real estate businesses, subject to certain limitations under the Code. A TRS is subject to federal and state income taxes which, to date, have not been material to us.
Environmental Laws and Regulations
Under various federal, state and local laws, ordinances and regulations, we may be liable for the cost to assess and remediate certain hazardous substances at our shopping centers. To the extent any environmental issues arise, they most typically stem from the historic practices of current and former dry cleaners, gas stations, and other similar businesses at our centers, as well as the presence of asbestos in some structures. These requirements often impose liability without regard to whether the owner knew of, or committed the acts or omissions that caused the presence of the hazardous substances. The presence of such substances, or the failure to properly address contamination caused by such substances, may adversely affect our ability to sell or lease the property or borrow using the property as collateral. Although we have a number of properties that could require or are currently undergoing varying levels of assessment and remediation, known environmental liabilities are not currently expected to have a material impact on our financial condition.
Information About Our Executive Officers
Our executive officers are appointed each year by our Board of Directors. Each of our executive officers has been employed by us for more than five years and, as of December 31, 2022, included the following:
| Name | Age | Title | Executive Officer in Position Shown Since |
| Martin E. Stein, Jr. | 70 | Executive Chairman of the Board of Directors | 2020 (1) |
| Lisa Palmer | 55 | President and Chief Executive Officer | 2020 (2) |
| Michael J. Mas | 47 | Executive Vice President, Chief Financial Officer | 2019 (3) |
| James D. Thompson | 67 | Executive Vice President, Chief Operating Officer | 2019 (4) |
(1)
Mr. Stein was appointed Executive Chairman of the Board of Directors effective January 1, 2020. Prior to this appointment, Mr. Stein served as Chief Executive Officer from 1993 through December 31, 2019 and Chairman of the Board since 1999.
(2)
Ms. Palmer was named Chief Executive Officer effective January 1, 2020, in addition to her responsibilities as President, a position she has held since January 2016. Prior to this appointment, Ms. Palmer served as Chief Financial Officer since January 2013. Prior to that, Ms. Palmer served as Senior Vice President of Capital Markets since 2003 and has been with the Company since 1996.
(3)
Mr. Mas assumed the responsibilities of Executive Vice President, Chief Financial Officer effective August 2019. Prior to this appointment, Mr. Mas served as Managing Director, Finance, since February 2017, and Senior Vice President, Capital Markets, since 2013.
(4)
Mr. Thompson assumed the role of Executive Vice President, Chief Operating Officer, effective August 2019. Mr. Thompson previously served as our Executive Vice President of Operations since 2016 and Managing Director - East since 1993. As previously announced, Mr. Thompson retired from the Company as of December 31, 2022 and effective January 1, 2023, he was succeeded by the following members of senior management:
Mr. Alan Roth, age 47, now Executive Vice President, National Property Operations and East Region President, was formerly Senior Managing Director, East Region since 2020. Prior to that, he served as Managing Director Northeast Region since 2016. Other positions held since joining the Company in 1997 include Senior Vice President and Senior Market Officer of the Mid-Atlantic and Northeast Portfolio, and Vice President and Regional Officer. Mr. Roth is responsible for operations strategy and processes nationally, as well as overseeing execution of the operations and investment strategies in our Northeast and Southeast regions.
Mr. Nick Wibbenmeyer, age 42, now Executive Vice President, West Region President, was formerly Senior Managing Director, West Region since 2020. Prior to that, he served as Managing Director of Florida and the Midwest Region, respectively. Other positions held since joining the Company in 2005 include Senior Vice President and Senior Market Officer, Vice President and Market Officer, and Vice President of Investments. Mr. Wibbenmeyer is responsible for investment and development strategy and processes nationally, as well as overseeing execution of the operations and investment strategies in our West and Central regions.
Company Website Access and SEC Filings
Our website may be accessed at www.regencycenters.com. All of our filings with the SEC can be accessed free of charge through our website promptly after filing; however, in the event that the website is inaccessible, we will provide paper copies of our most recent annual report on Form 10-K, the most recent quarterly report on Form 10-Q, current reports filed or furnished on Form 8-K, and all related amendments, excluding exhibits, free of charge upon request. These filings are also accessible on the SEC's website at www.sec.gov. The content of our website is not incorporated by reference into this Annual Report on Form 10-K or in any other report or document we file with the SEC, and any references to our website are intended to be inactive textual references only.
General Information
Our registrar and stock transfer agent is Broadridge Corporate Issuer Solutions, Inc. ("Broadridge"), Lake Success, NY. We offer a dividend reinvestment plan ("DRIP") that enables our shareholders to reinvest dividends automatically, as well as to make voluntary cash payments toward the purchase of additional shares. For more information, contact Broadridge toll free at (877) 830-4936 or our Shareholder Relations Department at (904) 598-7000.
The Company's common stock is listed on the NASDAQ Global Select Market and trades under the stock symbol "REG".
Our independent registered public accounting firm is KPMG LLP, Jacksonville, Florida, Firm ID 185.
Annual Meeting of Shareholders
Our 2023 annual meeting of shareholders is currently expected to be held on Wednesday, May 3, 2023, and will be conducted in a virtual-only format to the extent permitted by applicable law.
Non-GAAP Measures
In addition to the required Generally Accepted Accounting Principles ("GAAP") presentations, we use and report certain non-GAAP measures as we believe these measures improve the understanding of our operational results. We believe these non-GAAP measures provide useful information to our Board of Directors, management and investors regarding certain trends relating to our financial condition and results of operations. Our management uses these non-GAAP measures to compare our performance to that of prior periods for trend analyses, purposes of determining management incentive compensation and budgeting, forecasting and planning purposes. We continually evaluate the usefulness, relevance, limitations, and calculation of our reported non-GAAP measures to determine how best to provide relevant information to the public, and thus such reported measures could change.
We do not consider non-GAAP measures an alternative to financial measures determined in accordance with GAAP, rather they supplement GAAP measures by providing additional information we believe to be useful to our shareholders. The principal limitation of these non-GAAP measures is they may exclude significant expense and income items that are required by GAAP to be recognized in our Consolidated Financial Statements. In addition, they reflect the exercise of management's judgment about which expense and income items are excluded or included in determining these non-GAAP measures. In order to compensate for these limitations, reconciliations of the non-GAAP measures we use to their most directly comparable GAAP measures are provided. Non-GAAP measures should not be relied upon in evaluating the financial condition, results of operations, or future prospects of the Company.
Defined Terms
The following terms, as defined, are commonly used by management and the investing public to understand and evaluate our operational results, and are included in this document:
Core Operating Earnings is an additional performance measure we use because the computation of Nareit Funds from Operations ("Nareit FFO") includes certain non-comparable items that affect our period-over-period performance. Core Operating Earnings excludes from Nareit FFO: (i) transaction related income or expenses, (ii) gains or losses from the early extinguishment of debt, (iii) certain non-cash components of earnings derived from above and below market rent amortization, straight-line rents, and amortization of mark-to-market debt adjustments, and (iv) other amounts as they occur. We provide reconciliations of both Net income attributable to common stockholders to Nareit FFO and Nareit FFO to Core Operating Earnings.
Development Completion is a Property in Development that is deemed complete upon the earlier of: (i) 90% of total estimated net development costs have been incurred and percent leased equals or exceeds 95%, or (ii) the property features at least two years of anchor operations. Once deemed complete, the property is termed a Retail Operating Property.
Fixed Charge Coverage Ratio is defined as Operating EBITDAre divided by the sum of the gross interest and scheduled mortgage principal paid to our lenders.
Nareit EBITDAre is a measure of REIT performance, which the National Association of Real Estate Investment Trusts ("Nareit") defines as net income, computed in accordance with GAAP, excluding (i) interest expense, (ii) income tax expense, (iii) depreciation and amortization, (iv) gains on sales of real estate, (v) impairments of real estate, and (vi) adjustments to reflect the Company's share of unconsolidated partnerships and joint ventures.
Nareit Funds from Operations ("Nareit FFO") is a commonly used measure of REIT performance, which Nareit defines as net income, computed in accordance with GAAP, excluding gains on sales and impairments of real estate, net of tax, plus depreciation and amortization, and after adjustments for unconsolidated partnerships and joint ventures. We compute Nareit FFO for all periods presented in accordance with Nareit's definition.
Companies use different depreciable lives and methods, and real estate values historically fluctuate with market conditions. Since Nareit FFO excludes depreciation and amortization and gains on sale and impairments of real estate, it provides a performance measure that, when compared year over year, reflects the impact on operations from trends in percent leased, rental rates, operating costs, acquisition and development activities, and financing costs. This provides a perspective of our financial performance not immediately apparent from net income determined in accordance with GAAP. Thus, Nareit FFO is a supplemental non-GAAP financial measure of our operating performance, which does not represent cash generated from operating activities in accordance with GAAP; and, therefore, should not be considered a substitute measure of cash flows from operations. We provide a reconciliation of Net income attributable to common stockholders to Nareit FFO.
Net Operating Income ("NOI") is the sum of base rent, percentage rent, recoveries from tenants, other lease income, and other property income, less operating and maintenance expenses, real estate taxes, ground rent, and uncollectible lease income. NOI excludes straight-line rental income and expense, above and below market rent and ground rent amortization, tenant lease inducement amortization, and other fees. We also provide disclosure of NOI excluding termination fees, which excludes both termination fee income and expenses.
Non-Same Property is any property, during either calendar year period being compared, that was acquired, sold, a Property in Development, a Development Completion, or a property under, or being positioned for, significant redevelopment that distorts comparability between periods. Non-retail properties and corporate activities, including the captive insurance program, are part of Non-Same Property.
Operating EBITDAre begins with the Nareit EBITDAre and excludes certain non-cash components of earnings derived from above and below market rent amortization and straight-line rents. We provide a reconciliation of Net Income to Nareit EBITDAre to Operating EBITDAre.
Pro-rata information includes 100% of our consolidated properties plus our economic share (based on our ownership interest) in our unconsolidated real estate investment partnerships.
We provide Pro-rata financial information because we believe it assists investors and analysts in estimating our economic interest in our consolidated and unconsolidated partnerships, when read in conjunction with our reported results under GAAP. We believe presenting our Pro-rata share of assets, liabilities, operating results, and other metrics, along with certain other non-GAAP measures, makes comparison of our operating results to those of other REITs more meaningful. The Pro-rata information provided is not, nor is it intended to be, presented in accordance with GAAP. The Pro-rata supplemental details of assets and liabilities and supplemental details of operations reflect our proportionate economic ownership of the assets, liabilities, and operating results of the properties in our portfolio
The Pro-rata information is prepared on a basis consistent with the comparable consolidated amounts and is intended to more accurately reflect our proportionate economic interest in the assets, liabilities, and operating results of properties in our portfolio. We do not control the unconsolidated investment partnerships, and the Pro-rata presentations of the assets and liabilities, and revenues and expenses do not represent our legal claim to such items. The partners are entitled to profit or loss allocations and distributions of cash flows according to the operating agreements, which generally provide for such allocations according to their invested capital. Our share of invested capital establishes the ownership interests we use to prepare our Pro-rata share.
The presentation of Pro-rata information has limitations which include, but are not limited to, the following:
o
The amounts shown on the individual line items were derived by applying our overall economic ownership interest percentage determined when applying the equity method of accounting and do not necessarily represent our legal claim to the assets and liabilities, or the revenues and expenses; and
o
Other companies in our industry may calculate their Pro-rata interest differently, limiting the comparability of Pro-rata information.
Because of these limitations, the Pro-rata financial information should not be considered independently or as a substitute for our financial statements as reported under GAAP. We compensate for these limitations by relying primarily on our GAAP financial statements, using the Pro-rata information as a supplement.
Property In Development includes properties in various stages of ground-up development.
Property In Redevelopment includes Retail Operating Properties under redevelopment or being positioned for redevelopment. Unless otherwise indicated, a Property in Redevelopment is included in the Same Property pool.
Redevelopment Completion is a Property in Redevelopment that is deemed complete upon the earlier of: (i) 90% of total estimated project costs have been incurred and percent leased equals or exceeds 95% for the Company owned GLA related to the project, or (ii) the property features at least two years of anchor operations, if applicable.
Retail Operating Property is any retail property not termed a Property in Development. A retail property is any property where the majority of the income is generated from retail uses.
Same Property is a Retail Operating Property that was owned and operated for the entirety of both calendar year periods being compared. This term excludes Properties in Development, prior year Development Completions, and Non-Same Properties. Properties in Redevelopment are included unless otherwise indicated.
Item 1A. Risk Factors
Our operations are subject to a number of risks and uncertainties including, but not limited to, those listed below. When considering an investment in our securities, carefully read and consider these risks, together with all other information in our other filings and submissions to the SEC, which provide much more information and detail. If any of the events described in the following risk factors actually occur, our business, financial condition and/ or operating results, as well as the market price of our securities, could be materially adversely affected.
Risk Factors Related to the Current Economic Environment
Continued rising interest rates in the current economic environment may adversely impact our cost to borrow, real estate valuation, and stock price.
On multiple occasions during 2022, the Board of Governors of the Federal Reserve System ("the U.S. Federal Reserve") raised its benchmark federal funds rate, which has led to numerous increases in interest rates in the credit markets. The U.S. Federal Reserve may continue to raise the federal funds rate, which will likely lead to higher interest rates in the credit markets. Additionally, U.S. government policies implemented to address inflation, including actions by the U.S. Federal Reserve to increase interest rates, may negatively impact consumer spending, our tenants' businesses, and/or future demand for space in our shopping centers.
Rising interest rates adversely impact our cost of borrowing. Our exposure to increases in interest rates in the short term includes our variable-rate borrowings, which consist of borrowings under our unsecured senior line of credit and variable rate based secured notes payable. Increases in interest rates could increase our financing costs over time, either through near-term borrowings on our floating-rate line of credit or refinancing of our existing borrowings that may incur higher interest expenses related to the issuance of new debt. Prolonged periods of higher interest rates may negatively impact the valuation of our real estate asset portfolio and could result in the decline of our stock price and market capitalization, which may adversely impact our ability and willingness to raise equity capital on favorable terms through sales of our common shares, including through our At the Market ("ATM") program.
Although the extent of any prolonged periods of higher interest rates remains unknown at this time, negative impacts to our cost of capital may also adversely affect our future business plans and growth, at least in the near term.
Current economic challenges, including the potential for recession, may adversely impact our tenants and our business.
The success of our tenants in operating their businesses and their corresponding ability to pay us rent continue to be significantly impacted by many current economic challenges, which impact their cost of doing business, including, but not limited to, inflation, labor shortages, supply chain constraints, decreasing consumer confidence and discretionary spending, and increasing energy prices and interest rates. Additionally, macroeconomic and geopolitical risks create challenges that may exacerbate current market conditions in the United States, including the potential for a recession.
These economic challenges could adversely impact our volume of leasing activity, which could include tenant move outs and/or higher levels of uncollectible lease income, as well as negatively affect the business and financial results of our tenants. The aggregate impacts of these current economic challenges may also negatively affect the overall market for retail space, resulting in decreased demand for space in our centers. This, in turn, could result in pricing pressure on rent that we are able to charge to new or renewing tenants, such that future rent spreads could be adversely impacted. Further, we may experience higher costs for tenant buildouts, as costs of materials and labor may increase and supply and availability of both may become more limited.
Risk Factors Related to Pandemics or other Health Crises
Pandemics or other health crises, such as the COVID-19 pandemic, may adversely affect our tenants' financial condition, the profitability of our properties, and our access to the capital markets and could have a material adverse effect on our business, results of operations, cash flows and financial condition.
In response to the COVID-19 pandemic, federal, state, and local governments mandated or recommended various actions to reduce or prevent the spread of COVID-19, which altered customer behaviors and temporarily limited many of our tenants’ ability to operate. As a result, certain tenants requested rent concessions or sought to renegotiate future rents based on changes to the economic environment. Some tenants chose not to reopen or to honor the terms of their lease agreements. In addition, moratoria and other legal restrictions in certain states impacted our ability to bring legal action to enforce our leases and our ability to collect rent. Should federal, state, and local governments mandate or recommend lockdowns again in the future due to a pandemic or other similar health crises, tenants could request rent concessions or seek to renegotiate future rents.
In the event of future pandemics or similar health crises, consumers could elect to make more of their purchases online instead of in physical stores and businesses could delay executing new or renewals of leases amidst the immediate and uncertain economic impacts. These developments, coupled with potential tenant failures and a reduction in newly-formed businesses, could result in decreased demand for retail space in our centers, which could result in lower occupancy or higher levels of uncollectible lease income, as well as downward pressure on rents. Additionally, delays in construction of tenant improvements due to the impacts of constraints on supply chains and labor, resulting from government ordered lockdowns, could result in delayed rent commencement due to it taking longer for new tenants to open and operate.
Although the vast majority of our lease income is derived from contractual rent payments, the ability of certain of our tenants to meet their lease obligations could be negatively impacted by the disruptions and uncertainties of a new virus strain of COVID-19 or any future pandemic or other health crisis. Our tenants' ability to respond to these disruptions and uncertainties, including adjusting to governmental orders and changes in their customers' shopping habits and behaviors, may impact their ability to survive, and ultimately, their ability to comply with their lease obligations. Our future results of operations and overall financial performance could be uncertain should a new virus strain of COVID-19, or future pandemics or other health crises occur.
Risk Factors Related to Operating Retail-Based Shopping Centers
Economic and market conditions may adversely affect the retail industry and consequently reduce our revenues and cash flow, and increase our operating expenses.
Our properties are leased primarily to retail tenants from whom we derive most of our revenue in the form of base rent, expense recoveries and other income. Therefore, our performance and operating results are directly linked to the economic and market conditions occurring in the retail industry. We are subject to the risks that, upon expiration, leases for space in our properties are not renewed by existing tenants, vacant space is not leased to new tenants, and/or tenants demand modified lease terms, including costs for renovations or concessions. The economic and market conditions potentially affecting the retail industry and our properties specifically include the following:
changes in national, regional and local economic conditions;
changes in population and migration patterns to/from the markets in which we operat
Showing the first 8K of 66K characters. Open the full section
Item 1B. Unresolved Staff Comments
None.
Item 2. Properties
The following table is a list of our shopping centers, summarized by state and in order of largest holdings by number of properties, presented for consolidated properties (excludes properties owned by unconsolidated co-investment partnerships):
| December 31, 2022 | December 31, 2021 | |||||||||||||||||||||||||||||||
| Location | Number of Properties | GLA (in thousands) | Percent of Total GLA | Percent Leased | Number of Properties | GLA (in thousands) | Percent of Total GLA | Percent Leased | ||||||||||||||||||||||||
| Florida | 88 | 10,783 | 27.8 | % | 95.1 | % | 89 | 10,771 | 28.4 | % | 93.7 | % | ||||||||||||||||||||
| California | 53 | 8,204 | 21.1 | % | 93.9 | % | 53 | 8,219 | 21.7 | % | 93.2 | % | ||||||||||||||||||||
| Texas | 25 | 3,239 | 8.3 | % | 98.0 | % | 25 | 3,240 | 8.5 | % | 96.0 | % | ||||||||||||||||||||
| Georgia | 22 | 2,120 | 5.5 | % | 92.9 | % | 22 | 2,127 | 5.6 | % | 91.1 | % | ||||||||||||||||||||
| New York | 16 | 1,953 | 5.0 | % | 89.0 | % | 15 | 1,749 | 4.6 | % | 92.9 | % | ||||||||||||||||||||
| Connecticut | 14 | 1,452 | 3.7 | % | 91.1 | % | 14 | 1,464 | 3.9 | % | 94.4 | % | ||||||||||||||||||||
| Colorado | 13 | 1,097 | 2.8 | % | 96.6 | % | 13 | 1,096 | 2.9 | % | 95.8 | % | ||||||||||||||||||||
| North Carolina | 10 | 1,222 | 3.2 | % | 98.2 | % | 10 | 1,221 | 3.2 | % | 96.2 | % | ||||||||||||||||||||
| Washington | 10 | 963 | 2.5 | % | 97.3 | % | 9 | 857 | 2.3 | % | 96.5 | % | ||||||||||||||||||||
| Ohio | 8 | 1,224 | 3.2 | % | 96.7 | % | 8 | 1,215 | 3.2 | % | 98.3 | % | ||||||||||||||||||||
| Massachusetts | 8 | 897 | 2.3 | % | 97.6 | % | 8 | 898 | 2.4 | % | 95.1 | % | ||||||||||||||||||||
| Oregon | 7 | 742 | 1.9 | % | 94.6 | % | 7 | 741 | 2.0 | % | 94.5 | % | ||||||||||||||||||||
| Illinois | 6 | 1,085 | 2.8 | % | 94.9 | % | 6 | 1,085 | 2.9 | % | 94.8 | % | ||||||||||||||||||||
| Virginia | 6 | 939 | 2.4 | % | 93.4 | % | 6 | 939 | 2.5 | % | 90.8 | % | ||||||||||||||||||||
| Pennsylvania | 4 | 443 | 1.1 | % | 98.7 | % | 3 | 326 | 0.9 | % | 97.1 | % | ||||||||||||||||||||
| Missouri | 4 | 408 | 1.1 | % | 99.5 | % | 4 | 408 | 1.1 | % | 100.0 | % | ||||||||||||||||||||
| Tennessee | 3 | 314 | 0.8 | % | 99.1 | % | 3 | 314 | 0.8 | % | 98.3 | % | ||||||||||||||||||||
| New Jersey | 2 | 573 | 1.5 | % | 89.2 | % | 1 | 219 | 0.6 | % | 98.1 | % | ||||||||||||||||||||
| Maryland | 2 | 250 | 0.6 | % | 94.4 | % | 2 | 320 | 0.8 | % | 82.0 | % | ||||||||||||||||||||
| Minnesota | 2 | 246 | 0.6 | % | 100.0 | % | — | — | 0.0 | % | 0.0 | % | ||||||||||||||||||||
| Indiana | 1 | 279 | 0.7 | % | 100.0 | % | 1 | 279 | 0.7 | % | 100.0 | % | ||||||||||||||||||||
| Delaware | 1 | 230 | 0.6 | % | 94.5 | % | 1 | 228 | 0.6 | % | 93.2 | % | ||||||||||||||||||||
| Michigan | 1 | 97 | 0.3 | % | 74.0 | % | 1 | 97 | 0.3 | % | 74.0 | % | ||||||||||||||||||||
| South Carolina | 1 | 51 | 0.1 | % | 100.0 | % | 1 | 51 | 0.1 | % | 100.0 | % | ||||||||||||||||||||
| District of Columbia | 1 | 23 | 0.1 | % | 85.8 | % | — | — | 0.0 | % | 0.0 | % | ||||||||||||||||||||
| Total | 308 | 38,834 | 100.0 | % | 94.8 | % | 302 | 37,864 | 100.0 | % | 94.0 | % |
The weighted average annual effective rent for the consolidated portfolio of properties, net of tenant concessions, is $23.95 and $23.17 per square foot ("PSF") as of December 31, 2022 and 2021, respectively.
The following table is a list of our shopping centers, summarized by state and in order of largest holdings by number of properties, presented for unconsolidated properties (properties owned by our unconsolidated co-investment partnerships):
| December 31, 2022 | December 31, 2021 | |||||||||||||||||||||||||||||||
| Location | Number of Properties | GLA (in thousands) | Percent of Total GLA | Percent Leased | Number of Properties | GLA (in thousands) | Percent of Total GLA | Percent Leased | ||||||||||||||||||||||||
| California | 17 | 2,320 | 18.9 | % | 97.4 | % | 18 | 2,644 | 19.9 | % | 91.9 | % | ||||||||||||||||||||
| Virginia | 15 | 2,082 | 16.9 | % | 93.9 | % | 15 | 2,082 | 15.7 | % | 93.7 | % | ||||||||||||||||||||
| Maryland | 9 | 849 | 6.9 | % | 96.3 | % | 10 | 1,069 | 8.0 | % | 94.9 | % | ||||||||||||||||||||
| North Carolina | 7 | 1,197 | 9.7 | % | 95.5 | % | 8 | 1,270 | 9.5 | % | 96.1 | % | ||||||||||||||||||||
| Washington | 7 | 874 | 7.1 | % | 97.4 | % | 7 | 874 | 6.6 | % | 98.4 | % | ||||||||||||||||||||
| Colorado | 6 | 858 | 7.0 | % | 93.3 | % | 6 | 851 | 6.4 | % | 90.8 | % | ||||||||||||||||||||
| Pennsylvania | 6 | 669 | 5.4 | % | 84.5 | % | 6 | 669 | 5.0 | % | 84.6 | % | ||||||||||||||||||||
| Florida | 6 | 663 | 5.4 | % | 99.4 | % | 7 | 811 | 6.1 | % | 97.4 | % | ||||||||||||||||||||
| Texas | 5 | 742 | 6.0 | % | 94.4 | % | 5 | 691 | 5.2 | % | 95.5 | % | ||||||||||||||||||||
| Illinois | 4 | 690 | 5.6 | % | 91.9 | % | 3 | 575 | 4.3 | % | 97.4 | % | ||||||||||||||||||||
| Minnesota | 3 | 423 | 3.4 | % | 98.3 | % | 5 | 668 | 5.0 | % | 97.5 | % | ||||||||||||||||||||
| New Jersey | 3 | 224 | 1.8 | % | 81.8 | % | 4 | 353 | 2.7 | % | 92.6 | % | ||||||||||||||||||||
| Indiana | 2 | 139 | 1.1 | % | 82.9 | % | 2 | 139 | 1.0 | % | 75.8 | % | ||||||||||||||||||||
| Connecticut | 1 | 186 | 1.5 | % | 98.1 | % | 1 | 186 | 1.4 | % | 96.4 | % | ||||||||||||||||||||
| New York | 1 | 141 | 1.2 | % | 100.0 | % | 1 | 141 | 1.1 | % | 100.0 | % | ||||||||||||||||||||
| Oregon | 1 | 93 | 0.8 | % | 97.7 | % | 1 | 93 | 0.7 | % | 100.0 | % | ||||||||||||||||||||
| South Carolina | 1 |
Showing the first 8K of 100K characters. Open the full section
Item 3. Legal Proceedings
We are a party to various legal proceedings that arise in the ordinary course of our business. We are not currently involved in any litigation, nor, to our knowledge, is any litigation threatened against us, the outcome of which would, in our judgment based on information currently available to us, have a material adverse effect on our financial position or results of operations. However, no assurances can be given as to the outcome of any threatened or pending legal proceedings.
Item 4. Mine Safety Disclosures
Not applicable.
PART II
Item 5. Market for the Registrant's Common Equity, Related Stockholder Matters, and Issuer Purchases of Equity Securities
Our common stock is listed on the NASDAQ Global Select Market under the symbol "REG."
As of February 06, 2023, there were 87,993 holders of our common stock.
We intend to pay regular quarterly distributions to Regency Centers Corporation's common stockholders. Future distributions will be declared and paid at the discretion of our Board of Directors and will depend upon cash generated by our operating results, our financial condition, cash flows, capital requirements, future business prospects, annual dividend requirements under the REIT provisions of the Internal Revenue Code of 1986, as amended, and such other factors as our Board of Directors deems relevant. In order to maintain Regency Centers Corporation's qualification as a REIT for federal income tax purposes, we are generally required to make annual distributions equal to at least 90% of our real estate investment trust taxable income for the taxable year. Under certain circumstances we could be required to make distributions in excess of cash available for distributions in order to meet such requirements. We have a dividend reinvestment plan under which our shareholders may elect to reinvest their dividends automatically in common stock. Under the plan, we may elect to purchase common stock in the open market on behalf of shareholders or may issue new common stock to such stockholders.
Under the revolving credit agreement of our Line, in the event of any monetary default, we may not make distributions to stockholders except to the extent necessary to maintain our REIT status.
There were no unregistered sales of equity securities during the quarter ended December 31, 2022.
The following table represents information with respect to purchases by Regency of its common stock by months during the three month period ended December 31, 2022:
| Period | Total number of shares purchased (1) | Total number of shares purchased as part of publicly announced plans or programs (2) | Average price paid per share | Maximum number or approximate dollar value of shares that may yet be purchased under the plans or programs (2) | ||||||||||||
| October 1, 2022, through October 31, 2022 | 169 | — | $ | 54.36 | $ | 174,607,162 | ||||||||||
| November 1, 2022, through November 30, 2022 | — | — | $ | — | $ | 174,607,162 | ||||||||||
| December 1, 2022, through December 31, 2022 | — | — | $ | — | $ | 174,607,162 |
(1)
Represents shares repurchased to cover payment of withholding taxes in connection with restricted stock vesting by participants under Regency's Long-Term Omnibus Plan.
(2)
On February 3, 2021, our Board authorized a common share repurchase program (Authorized Repurchase Program) under which we could purchase, from time to time, up to a maximum of $250 million of shares of its outstanding common stock through open market purchases, and/or in privately negotiated transactions. Any shares purchased, if not retired, would be treated as treasury shares. During the year ended December 31, 2022, 1.3 million shares were repurchased and retired under this program, and $174.6 million remained available for repurchase. This previously authorized program expired on February 3, 2023. On February 8, 2023, our Board authorized a new common share repurchase program under which we may purchase, from time to time, up to a maximum of $250 million of our outstanding common stock through open market purchases, and/or in privately negotiated transactions. The timing and price of share repurchases, if any, will be dependent upon market
conditions and other factors. Any shares repurchased, if not retired, will be treated as treasury shares. This new authorization will expire February 7, 2025, unless modified or earlier terminated by the Board.
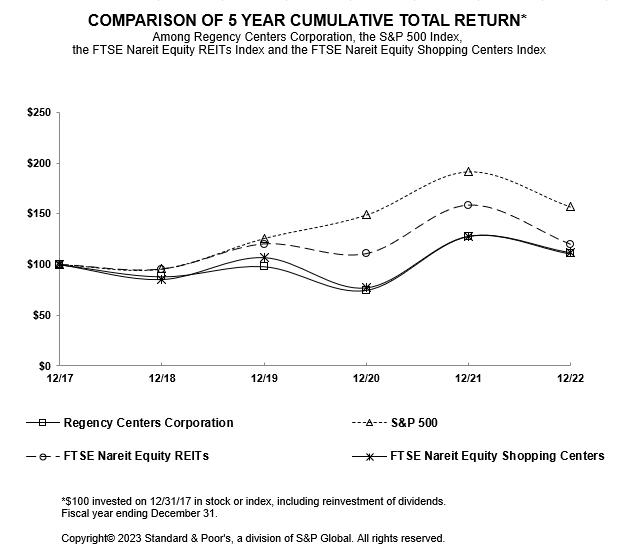
The performance graph furnished below shows Regency's cumulative total stockholder return relative to the S&P 500 Index, the FTSE Nareit Equity REIT Index, and the FTSE Nareit Equity Shopping Centers index since December 31, 2017. The following performance graph and table do not constitute soliciting material and should not be deemed filed or incorporated by reference into any other previous or future filings by us under the Securities Act of 1933, as amended (the "Securities Act") or the Securities Exchange Act of 1934, as amended (the "Exchange Act").
| 12/31/17 | 12/31/18 | 12/31/19 | 12/31/20 | 12/31/21 | 12/31/22 | |||||||||||||||||||
| Regency Centers Corporation | $ | 100.00 | 87.98 | 98.03 | 74.59 | 127.84 | 110.51 | |||||||||||||||||
| S&P 500 | 100.00 | 95.62 | 125.72 | 148.85 | 191.58 | 156.89 | ||||||||||||||||||
| FTSE NAREIT Equity REITs | 100.00 | 95.38 | 120.17 | 110.56 | 158.36 | 119.78 | ||||||||||||||||||
| FTSE NAREIT Equity Shopping Centers | 100.00 | 85.45 | 106.84 | 77.31 | 127.60 | 111.60 |
Item 6. [Reserved]
Item 7. Management’s Discussion and Analysis of Financial Condition and Results of Operations
Executing on our Strategy
During the year ended December 31, 2022, we had Net income attributable to common stockholders of $482.9 million, which includes gains on sale of real estate of $109.0 million, as compared to $361.4 million during the year ended December 31, 2021.
During the year ended December 31, 2022:
Our Pro-rata same property NOI, excluding termination fees, grew 2.9%, primarily attributable to continued improvement in collections of lease income from cash basis tenants, combined with improvements in base rent from increases in year over year occupancy rates, contractual rent steps in existing leases, and positive rent spreads on new and renewal leases.
We executed 1,981 new and renewal leasing transactions representing 7.3 million Pro-rata SF with positive trailing 12 month rent spreads of 7.4% during 2022, compared to 1,979 leasing transactions representing 7.0 million Pro-rata SF with positive trailing 12 month rent spreads of 5.5% in 2021. Rent spreads are calculated on all executed leasing transactions for comparable Retail Operating Property spaces, including spaces vacant greater than 12 months.
At December 31, 2022, our total property portfolio was 94.8% leased while our same property portfolio was 95.1% leased, compared to 94.1% and 94.3%, respectively, at December 31, 2021.
We continued our development and redevelopment of high quality shopping centers:
Estimated Pro-rata project costs of our current in process development and redevelopment projects totaled $300.9 million compared to $307.3 million at December 31, 2021.
Development and redevelopment projects completed during 2022 represented $122.0 million of estimated net project costs, with an average stabilized yield of 7%.
We maintained liquidity and financial flexibility to cost effectively fund investment opportunities and debt maturities:
During April 2022, we settled and issued 984,618 common shares under forward sale agreements at a weighted-average price of $65.78, before any underwriting discount and offering expenses. Net proceeds received at settlement were approximately $61.3 million and were used to fund acquisitions.
During June 2022, we executed multiple trades to purchase 1,294,201 common shares under the Authorized Repurchase Program for a total of $75.4 million at a weighted average price of $58.25 per share. All repurchased shares were retired on the respective settlement dates.
We have no unsecured debt maturities until 2024 and just over $110 million of secured mortgage maturities in 2023, including mortgages within our real estate partnerships.
At December 31, 2022, our Pro-rata net debt-to-operating EBITDAre ratio on a trailing 12 month basis was 5.0x compared to 5.1x at December 31, 2021.
Leasing Activity and Significant Tenants
We believe our high-quality, grocery anchored shopping centers located in suburban trade areas with compelling demographics create attractive spaces for retail and service providers to operate their businesses.
Pro-rata Percent Leased
The following table summarizes Pro-rata percent leased of our combined consolidated and unconsolidated shopping center portfolio:
| December 31, 2022 | December 31, 2021 | |||||||
| Percent Leased – All properties | 94.8 | % | 94.1 | % | ||||
| Anchor Space (spaces ≥ 10,000 SF) | 96.8 | % | 97.0 | % | ||||
| Shop Space (spaces < 10,000 SF) | 91.5 | % | 89.2 | % |
Our percent leased increased primarily due to favorable leasing activity in our Shop Space category during 2022.
Pro-rata Leasing Activity
The following table summarizes leasing activity, including our Pro-rata share of activity within the portfolio of our co-investment partnerships (totals as a weighted-average PSF):
| Year Ended December 31, 2022 | ||||||||||||||||||||
| Leasing Transactions | SF (in thousands) | Base Rent PSF | Tenant Allowance and Landlord Work PSF | Leasing Commissions PSF | ||||||||||||||||
| Anchor Space Leases | ||||||||||||||||||||
| New | 24 | 632 | $ | 15.09 | $ | 24.36 | $ | 5.32 | ||||||||||||
| Renewal | 108 | 3,252 | 16.36 | 1.07 | 0.23 | |||||||||||||||
| Total Anchor Space Leases | 132 | 3,884 | $ | 16.16 | $ | 4.86 | $ | 1.06 | ||||||||||||
| Shop Space Leases | ||||||||||||||||||||
| New | 562 | 1,058 | $ | 37.55 | $ | 36.17 | $ | 11.48 | ||||||||||||
| Renewal | 1,287 | 2,395 | 35.94 | 1.66 | 0.77 | |||||||||||||||
| Total Shop Space Leases | 1,849 | 3,453 | $ | 36.44 | $ | 12.23 | $ | 4.05 | ||||||||||||
| Total Leases | 1,981 | 7,337 | $ | 25.70 | $ | 8.33 | $ | 2.47 |
| Year Ended December 31, 2021 | ||||||||||||||||||||
| Leasing Transactions | SF (in thousands) | Base Rent PSF | Tenant Allowance and Landlord Work PSF | Leasing Commissions PSF | ||||||||||||||||
| Anchor Space Leases | ||||||||||||||||||||
| New | 25 | 667 | $ | 20.10 | $ | 44.50 | $ | 6.18 | ||||||||||||
| Renewal | 124 | 2,941 | 15.34 | 0.56 | 0.21 | |||||||||||||||
| Total Anchor Space Leases | 149 | 3,608 | $ | 16.22 | $ | 8.68 | $ | 1.31 | ||||||||||||
| Shop Space Leases | ||||||||||||||||||||
| New | 573 | 1,022 | $ | 34.38 | $ | 28.77 | $ | 10.87 | ||||||||||||
| Renewal | 1,257 | 2,324 | 34.31 | 1.62 | 0.79 | |||||||||||||||
| Total Shop Space Leases | 1,830 | 3,346 | $ | 34.33 | $ | 9.92 | $ | 3.87 | ||||||||||||
| Total Leases | 1,979 | 6,954 | $ | 24.93 | $ | 9.28 | $ | 2.54 |
The weighted-average base rent PSF on signed Shop Space leases during 2022 was $36.44 PSF, which is higher than the weighted average annual base rent PSF of all Shop Space leases due to expire during the next 12 months of $34.76 PSF. New and renewal rent spreads, as compared to prior rents on these same spaces leased, were positive at 7.4% for the 12 months ended December 31, 2022, as compared to 5.5% for the 12 months ended December 31, 2021.
The success of our tenants in operating their businesses and their corresponding ability to pay us rent continue to be significantly impacted by many current economic challenges, which increase their cost of doing business, including, but not limited to, inflation, labor shortages, supply chain constraints, increasing energy prices and interest rates. Additionally, macroeconomic and geopolitical risks create challenges that may exacerbate current market conditions in the United States.
These economic conditions could adversely impact our volume of leasing activity, leasing spreads, and financial results generally, as well as adversely affect the business and financial results of our tenants. The aggregate impacts of these current economic challenges may also negatively affect the overall market for retail space, resulting in decreased demand for space in our centers. This, in turn, could result in downward pressure on re
Showing the first 8K of 69K characters. Open the full section
Item 7A. Quantitative and Qualitative Disclosures about Market Risk
We are exposed to two significant components of interest rate risk:
We have a Line commitment, as further described in note 9 to the Consolidated Financial Statements, which has a variable interest rate that as of December 31, 2022, was based upon an annual rate of LIBOR plus 0.865%. On January 12, 2023, the Line was amended to convert the reference rate from LIBOR to the secured overnight financing rate ("SOFR") plus a 10 basis point market adjustment, with no changes in the applicable margin, which is dependent upon maintaining specific credit ratings. The current applicable margin is 0.865%. If our credit ratings are downgraded, the margin on the Line would increase, resulting in higher interest costs. The interest rate plus applicable margin based on our credit rating ranges from SOFR plus 0.690% to SOFR plus 1.540%.
We are also exposed to changes in interest rates when we refinance our existing long-term fixed rate debt. The objective of our interest rate risk management program is to limit the impact of interest rate changes on earnings and cash flows. To achieve these objectives, we borrow primarily at fixed interest rates and may enter into derivative financial instruments such as interest rate swaps, caps, or treasury locks in order to mitigate our interest rate risk on a related financial instrument. We do not enter into derivative or interest rate transactions for speculative purposes. Our interest rate swaps are structured solely for the purpose of interest rate protection.
We continuously monitor the capital markets and evaluate our ability to issue new debt, to repay maturing debt, or fund our commitments. We continue to believe, in light of our credit ratings, the available capacity under our unsecured credit facility, and the number of high quality, unencumbered properties that we own which could collateralize borrowings, we will be able to successfully issue new secured or unsecured debt to fund maturing debt obligations. It is uncertain the degree to which capital market volatility and rising interest rates will adversely impact the interest rates on any new debt that we may issue.
Our interest rate risk is monitored using a variety of techniques. The table below presents the principal cash flows, weighted average interest rates of remaining debt, and the fair value of total debt as of December 31, 2022. For variable rate mortgages and unsecured credit facilities for which we have interest rate swaps in place to fix the interest rate, they are included in the Fixed rate debt section below at their all-in fixed rate. The table is presented by year of expected maturity to evaluate the expected cash flows and sensitivity to interest rate changes. Although the average interest rate for variable rate debt is included in the table, those rates represent rates that existed as of December 31, 2022, and are subject to change on a monthly basis. In addition, the Company continually assesses the market risk for its floating rate debt and believes that a 1% increase in interest rates would decrease future earnings and cash flows by approximately $42,500 per year based on $4.3 million of floating rate mortgage debt outstanding at December 31, 2022. If the Company increases its line of credit balance in the future, additional decreases to future earnings and cash flows could occur.
Further, the table below incorporates only those exposures that exist as of December 31, 2022, and does not consider exposures or positions that could arise after that date or obligations repaid before maturity. Since firm commitments are not presented, the table has limited predictive value. As a result, our ultimate realized gain or loss with respect to interest rate fluctuations will depend on the exposures that arise during the period, our hedging strategies at that time, and actual interest rates.
The table below presents the principal cash flow payments associated with our outstanding debt by year, weighted average interest rates on debt outstanding at each year-end, and fair value of total debt as of December 31, 2022.
| (dollars in thousands) | 2023 | 2024 | 2025 | 2026 | 2027 | Thereafter | Total | Fair Value | ||||||||||||||||||||||||
| Fixed rate debt (1) | $ | 69,078 | 345,607 | 293,732 | 316,287 | 666,703 | 2,053,192 | 3,744,599 | 3,329,135 | |||||||||||||||||||||||
| Average interest rate for all fixed rate debt (2) | 3.82 | % | 3.82 | % | 3.83 | % | 3.84 | % | 3.84 | % | 3.89 | % | ||||||||||||||||||||
| Variable rate SOFR debt (1) | $ | — | — | 4,250 | — | — | — | 4,250 | 4,243 | |||||||||||||||||||||||
| Average interest rate for all variable rate debt (2) | 3.07 | % | 3.07 | % | 3.07 | % | — | % | — | % | — | % |
(1)
Reflects amount of debt maturities during each of the years presented as of December 31, 2022.
(2)
Reflects weighted average interest rates of debt outstanding at the end of each year presented. For variable rate debt, the rate as of December 31, 2022, was used to determine the average interest rate for all future periods.
Item 8. Consolidated Financial Statements and Supplementary Data
Regency Centers Corporation and Regency Centers, L.P.
Index to Financial Statements
All other schedules are omitted because of the absence of conditions under which they are required, materiality or because information required therein is shown in the Consolidated Financial Statements or notes thereto.
Report of Independent Registered Public Accounting Firm
To the Stockholders and the Board of Directors of
Regency Centers Corporation:
Opinion on the Consolidated Financial Statements
We have audited the accompanying consolidated balance sheets of Regency Centers Corporation and subsidiaries (the Company) as of December 31
Showing the first 8K of 292K characters. Open the full section
Item 9. Changes in and Disagreements with Accountants on Accounting and Financial Disclosure
None.
Item 9A. Controls and Procedures
Controls and Procedures (Regency Centers Corporation)
Conclusion Regarding the Effectiveness of Disclosure Controls and Procedures
Under the supervision and with the participation of the Parent Company's management, including its chief executive officer and chief financial officer, the Parent Company conducted an evaluation of its disclosure controls and procedures, as such term is defined under Rule 13a-15(e) and 15d-15(e) promulgated under the Exchange Act. Based on this evaluation, the Parent Company's chief executive officer and chief financial officer concluded that as of December 31, 2022, the Parent Company's disclosure controls and procedures were effective to ensure information required to be disclosed in the reports filed or submitted under the Exchange Act is recorded, processed, summarized and reported, within the time period specified in the SEC's rules and forms. These disclosure controls and procedures include controls and procedures designed to ensure that information required to be disclosed by the Parent Company in the reports it files or submits is accumulated and communicated to management, including its chief executive officer and chief financial officer, as appropriate, to allow timely decisions regarding required disclosure.
Management's Report on Internal Control over Financial Reporting
The Parent Company's management is responsible for establishing and maintaining adequate internal control over financial reporting, as such term is defined in Exchange Act Rules 13a-15(f) and 15d-15(f). Under the supervision and with the participation of its management, including its chief executive officer and chief financial officer, the Parent Company conducted an evaluation of the effectiveness of its internal control over financial reporting based on the framework in Internal Control - Integrated Framework (2013) issued by the Committee of Sponsoring Organizations of the Treadway Commission. Based on its evaluation under the framework in Internal Control - Integrated Framework (2013), the Parent Company's management concluded that its internal control over financial reporting was effective as of December 31, 2022.
KPMG LLP, an independent registered public accounting firm, has audited the Consolidated Financial Statements included in this Report and, as part of their audit, has issued a report, included within "Item 8. Financial Statements and Supplementary Data" of this Report, on the effectiveness of the Parent Company's internal control over financial reporting.
The Parent Company's system of internal control over financial reporting was designed to provide reasonable assurance regarding the preparation and fair presentation of published financial statements in accordance with accounting principles generally accepted in the United States. All internal control systems, no matter how well designed, have inherent limitations. Therefore, even those systems determined to be effective can provide only reasonable assurance and may not prevent or detect misstatements. Also, projections of any evaluation of effectiveness to future periods are subject to the risk that controls may become inadequate because of changes in conditions, or that the degree of compliance with the policies or procedures may deteriorate.
Changes in Internal Controls
There have been no changes in the Parent Company's internal controls over financial reporting identified in connection with this evaluation that occurred during the quarter ended December 31, 2022 that have materially affected, or are reasonably likely to materially affect, our internal controls over financial reporting.
Controls and Procedures (Regency Centers, L.P.)
Conclusion Regarding the Effectiveness of Disclosure Controls and Procedures
Under the supervision and with the participation of the Operating Partnership's management, including the chief executive officer and chief financial officer of its general partner, the Operating Partnership conducted an evaluation of its disclosure controls and procedures, as such term is defined under Rule 13a-15(e) and 15d-15(e) promulgated under the Exchange Act. Based on this evaluation, the chief executive officer and chief financial officer of its general partner concluded that, as of December 31, 2022, the Operating Partnership's disclosure controls and procedures were effective to ensure information required to be disclosed in the reports filed or submitted under the Exchange Act is recorded, processed, summarized and reported, within the time period specified in the SEC's rules and forms. These disclosure controls and procedures include controls and procedures designed to ensure that information required to be disclosed by the Operating Partnership in the reports it files or submits is accumulated and communicated to management, including the chief executive officer and chief financial officer of its general partner, as appropriate, to allow timely decisions regarding required disclosure.
Management's Report on Internal Control over Financial Reporting
The Operating Partnership's management is responsible for establishing and maintaining adequate internal control over financial reporting, as such term is defined in Exchange Act Rules 13a-15(f) and 15d-15(f). Under the supervision and with the participation of its management, including the chief executive officer and chief financial officer of its general partner, the Operating Partnership conducted an evaluation of the effectiveness of its internal control over financial reporting based on the framework in Internal Control - Integrated Framework (2013) issued by the Committee of Sponsoring Organizations of the Treadway Commission. Based on its evaluation under the framework in Internal Control - Integrated Framework (2013), the Operating Partnership's management concluded that its internal control over financial reporting was effective as of December 31, 2022.
KPMG LLP, an independent registered public accounting firm, has audited the Consolidated Financial Statements included in this Report and, as part of their audit, has issued a report, included within "Item 8. Financial Statements and Supplementary Data" of this Report, on the effectiveness of the Operating Partnership's internal control over financial reporting.
The Operating Partnership's system of internal control over financial reporting was designed to provide reasonable assurance regarding the preparation and fair presentation of published financial statements in accordance with accounting principles generally accepted in the United States. All internal control systems, no matter how well designed, have inherent limitations. Therefore, even those systems determined to be effective can provide only reasonable assurance and may not prevent or detect misstatements. Also, projections of any evaluation of effectiveness to future periods are subject to the risk that controls may become inadequate because of changes in conditions, or that the degree of compliance with the policies or procedures may deteriorate.
Changes in Internal Controls
There have been no changes in the Operating Partnership's internal controls over financial reporting identified in connection with this evaluation that occurred during the quarter ended December 31, 2022 that have materially affected, or are reasonably likely to materially affect, our internal controls over financial reporting.
Item 9B. Other Information
Not applicable
Item 9C. Disclosure Regarding Foreign Jurisdictions that Prevent Inspections
Not applicable
PART III
Item 10. Directors, Executive Officers, and Corporate Governance
Information concerning our directors, executive officers, and corporate governance is incorporated herein by reference to our definitive proxy statement to be filed with the SEC within 120 days after the end of the fiscal year covered by this Report with respect to the 2023 Annual Meeting of Stockholders. Information regarding executive officers is included in Part I of this Form 10-K as permitted by General Instruction G(3).
Code of Ethics.
We have a code of ethics applicable to our Board of Directors, principal executive officers, principal financial officer, principal accounting officer and persons performing similar functions. The text of this code of ethics may be found on our website at https://investors.regencycenters.com/corporate-governance/governance-overview. We will post a notice of any waiver from, or amendment to, any provision of our code of ethics on our website.
Item 11. Executive Compensation
Incorporated herein by reference to our definitive proxy statement to be filed with the SEC within 120 days after the end of the fiscal year covered by this Report with respect to the 2023 Annual Meeting of Stockholders.
Item 12. Security Ownership of Certain Beneficial Owners and Management and Related Stockholder Matters
The following table provides information about securities that may be issued under our existing equity compensation plans:
Equity Compensation Plan Information
(as of December 31, 2022)
| (a) | (b) | (c) | ||||||||||
| Plan Category | Number of securities to be issued upon exercise of outstanding options, warrants and rights (1) | Weighted-average exercise price of outstanding options, warrants and rights (2) | Number of securities remaining available for future issuance under equity compensation plans (excluding securities reflected in column a) (3) | |||||||||
| Equity compensation plans approved by security holders | — | $ | — | 4,056,077 | ||||||||
| Equity compensation plans not approved by security holders | N/A | N/A | N/A | |||||||||
| Total | — | $ | — | 4,056,077 |
(1)
This column does not include 711,699 shares that may be issued pursuant to unvested restricted stock and performance share awards.
(2)
The weighted average exercise price excludes stock rights awards, which we sometimes refer to as unvested restricted stock.
(3)
The Regency Centers Corporation Omnibus Incentive Plan, ("Omnibus Plan"), as approved by stockholders at our 2019 annual meeting, provides that an aggregate maximum of 5.6 million shares of our common stock are reserved for issuance under the Omnibus Plan.
Information about security ownership is incorporated herein by reference to our definitive proxy statement to be filed with the SEC within 120 days after the end of the fiscal year covered by this Report with respect to the 2023 Annual Meeting of Stockholders.
Item 13. Certain Relationships and Related Transactions, and Director Independence
Incorporated herein by reference to our definitive proxy statement to be filed with the SEC within 120 days after the end of the fiscal year covered by this Report with respect to the 2023 Annual Meeting of Stockholders.
Item 14. Principal Accountant Fees and Services
Incorporated herein by reference to our definitive proxy statement to be filed with the SEC within 120 days after the end of the fiscal year covered by this Report with respect to the 2023 Annual Meeting of Stockholders.
PAR****T IV
Item 15. Exhibits and Financial Statement Schedules
(a)
Financial Statements and Financial Statement Schedules:
Regency Centers Corporation and Regency Centers, L.P. 2022 financial statements and financial statement schedule, together with the reports of KPMG LLP are listed on the index immediately preceding the financial statements within "Item 8. Financial Statements and Supplementary Data" of this Report.
(b)
Exhibits:
In reviewing the agreements included as exhibits to this Report, please remember they are included to provide you with information regarding their terms and are not intended to provide any other factual or disclosure information about the Company, its subsidiaries or other parties to the agreements. The agreements contain representations and warranties by each of the parties to the applicable agreement. These representations and warranties have been made solely for the benefit of the other parties to the applicable agreement and:
should not in all instances be treated as categorical statements of fact, but rather as a way of allocating the risk to one of the parties if those statements prove to be inaccurate;
have been qualified by disclosures that were made to the other party in connection with the negotiation of the applicable agreement, which disclosures are not necessarily reflected in the agreement;
may apply standards of materiality in a way that is different from what may be viewed as material to you or other investors; and
were made only as of the date of the applicable agreement or such other date or dates as may be specified in the agreement and are subject to more recent developments.
Accordingly, these representations and warranties may not describe the actual state of affairs as of the date they were made or at any other time. We acknowledge that, notwithstanding the inclusion of the foregoing cautionary statements, we are responsible for considering whether additional specific disclosures of material information regarding material contractual provisions are required to make the statements in this Report not misleading. Additional information about the Company may be found elsewhere in this Report and the Company's other public files, which are available without charge through the SEC's website at http://www.sec.gov .
Unless otherwise indicated below, the Commission file number to the exhibit is No. 001-12298.
| 1. | Underwriting Agreement | |||
| (a) | Form of Equity Distribution Agreement dated May 17, 2017 among Regency Centers Corporation, Regency Centers, L.P. and the parties listed below (incorporated by reference to Exhibit 1.1 to the Company’s Form 8-K filed on May 17, 2017). The Equity Distribution Agreements listed below are substantially identical in all material respects to the Form of Equity Distribution Agreement, except for the identities of the parties, and have not been filed as exhibits to the Company’s 1934 Act reports pursuant to Instruction 2 to item 601 of Regulation S-K: | |||
| (i) | Equity Distribution Agreement dated May 17, 2017 among Regency Centers Corporation, Regency Centers, L.P. and Wells Fargo Securities, LLC; | |||
| (ii) | Equity Distribution Agreement dated May 17, 2017 among Regency Centers Corporation, Regency Centers, L.P. and J.P. Morgan Securities LLC; | |||
| (iii) | Equity Distribution Agreement dated May 17, 2017 among Regency Centers Corporation, Regency Centers, L.P. and Merrill Lynch, Pierce, Fenner & Smith Incorporated; | |||
| (iv) | Equity Distribution Agreement dated May 17, 2017 among Regency Centers Corporation, Regency Centers, L.P. and BB&T Capital Markets, a division of BB&T Securities, LLC; | |||
| (v) | Equity Distribution Agreement dated May 17, 2017 among Regency Centers Corporation, Regency Centers, L.P. and BTIG, LLC; | |||
| (iv) | Equity Distribution Agreement, dated May 8, 2020, among Regency Centers Corporation, Regency Centers, L.P., The Bank of Nova Scotia and Scotia Capital (USA) Inc. | ||||
| (v) | Equity Distribution Agreement, dated May 8, 2020, among Regency Centers Corporation, Regency Centers, L.P., Bank of Montreal and BMO Capital Markets Corp. | ||||
| (vi) | Equity Distribution Agreement, dated May 8, 2020, among Regency Centers Corporation, Regency Centers, L.P., TD Securities (USA) LLC and The Toronto-Dominion Bank | ||||
| (f) | Form of Forward Master Confirmation, dated May 8, 2020 (incorporated by reference to Exhibit 1.4 to the Company’s Form 8-K filed on May 8, 2020). The Forward Master Confirmations listed below are substantially identical in all material respects to the Form of Forward Master Confirmation, except for the identities of the parties, and have not been filed as exhibits to the Company’s 1934 Act reports pursuant to Instruction 2 to item 601 of Regulation S-K: | ||||
| (i) | Forward Master Confirmation, dated May 8, 2020, by and between Regency Centers Corporation and Wells Fargo Bank, National Association and Wells Fargo Securities, LLC. | ||||
| (ii) | Forward Master Confirmation, dated May 8, 2020, by and between Regency Centers Corporation and Bank of America, N.A. | ||||
| (iii) | Forward Master Confirmation, dated May 8, 2020, by and between Regency Centers Corporation and JPMorgan Chase Bank, National Association, New York Branch | ||||
| (iv) | Forward Master Confirmation, dated May 8, 2020, by and between Regency Centers Corporation and Bank of Montreal | ||||
| (v) | Forward Master Confirmation, dated May 8, 2020, by and between Regency Centers Corporation and Mizuho Markets Americas LLC | ||||
| (vi) | Forward Master Confirmation, dated May 8, 2020, by and between Regency Centers Corporation and Jefferies LLC | ||||
| (vii) | Forward Master Confirmation, dated May 8, 2020, by and between Regency Centers Corporation and The Bank of Nova Scotia | ||||
| (viii) | Forward Master Confirmation, dated May 8, 2020, by and between Regency Centers Corporation and The Toronto-Dominion Bank. | ||||
| 3. | Articles of Incorporation and Bylaws | ||||
| (a) | Restated Articles of Incorporation of Regency Centers Corporation (amendment is incorporated by reference to Exhibit 3.A to the Company’s Form 10-Q filed on August 8, 2017). | ||||
| (b) | Amended and Restated Bylaws of Regency Centers Corporation (amendment is incorporated by reference to Exhibit 3.1 to the Company’s Form 10-Q filed on August 5, 2022). | ||||
| (c) | Fifth Amended and Restated Agreement of Limited Partnership of Regency Centers, L.P. , (incorporated by reference to Exhibit 3(d) to the Company's Form 10-K filed on February 19, 2014). | ||||
| 4. | Instruments Defining Rights of Security Holders | ||||
| (a) | See Exhibits 3(a) and 3(b) for provisions of the Articles of Incorporation and Bylaws of the Company defining the rights of security holders. See Exhibits 3(c) for provisions of the Partnership Agreement of Regency Centers, L.P. defining rights of security holders. | ||||
| (b) | Indenture dated December 5, 2001 between Regency Centers, L.P., the guarantors named therein and First Union National Bank, as trustee (incorporated by reference to Exhibit 4.4 to Regency Centers, L.P.'s Form 8-K filed on December 10, 2001). |
| 31. | Rule 13a-14(a)/15d-14(a) Certifications. | |||
| 31.1 | Rule 13a-14 Certification of Chief Executive Officer for Regency Centers Corporation. | |||
| 31.2 | Rule 13a-14 Certification of Chief Financial Officer for Regency Centers Corporation. | |||
| 31.3 | Rule 13a-14 Certification of Chief Executive Officer for Regency Centers, L.P. | |||
| 31.4 | Rule 13a-14 Certification of Chief Financial Officer for Regency Centers, L.P. | |||
| 32. | Section 1350 Certifications. |
The certifications in this exhibit 32 are being furnished solely to accompany this Report pursuant to 18 U.S.C. § 1350, and are not being filed for purposes of Section 18 of the Exchange Act, or otherwise subject to the liability of that section and shall not be deemed to be incorporated by reference into any of the Company's filings under the Securities Act or the Exchange Act, whether made before or after the date hereof, except to the extent that the Company specifically incorporates it by reference.
| 32.1 | 18 U.S.C. § 1350 Certification of Chief Executive Officer for Regency Centers Corporation. | |
| 32.2 | 18 U.S.C. § 1350 Certification of Chief Financial Officer for Regency Centers Corporation. | |
| 32.3 | 18 U.S.C. § 1350 Certification of Chief Executive Officer for Regency Centers, L.P. | |
| 32.4 | 18 U.S.C. § 1350 Certification of Chief Financial Officer for Regency Centers, L.P. | |
| 101. | Interactive Data Files | |
| 101.INS+ | Inline XBRL Instance Document - the instance document does not appear in the Interactive Data File because its XBRL tags are embedded within the Inline XBRL document | |
| 101.SCH+ | Inline XBRL Taxonomy Extension Schema Document | |
| 101.CAL+ | Inline XBRL Taxonomy Extension Calculation Linkbase Document | |
| 101.DEF+ | Inline XBRL Taxonomy Definition Linkbase Document | |
| 101.LAB+ | Inline XBRL Taxonomy Extension Label Linkbase Document | |
| 101.PRE+ | Inline XBRL Taxonomy Extension Presentation Linkbase Document | |
| 104. | Cover Page Interactive Data File (formatted as inline XBRL and contained in Exhibit 101) |
+ Submitted electronically with this Annual Report
Item 16. Form 10-K Summary
None.
SIGNA****TURES
Pursuant to the requirements of Section 13 or 15(d) of the Securities Exchange Act of 1934, the registrant has duly caused this report to be signed on its behalf by the undersigned, thereunto duly authorized.
| February 17, 2023 | REGENCY CENTERS CORPORATION | |||
| By: | /s/ Lisa Palmer | |||
| Lisa Palmer, President and Chief Executive Officer |
| February 17, 2023 | REGENCY CENTERS, L.P. | ||
| By: | Regency Centers Corporation, General Partner | ||
| By: | /s/ Lisa Palmer | ||
| Lisa Palmer, President and Chief Executive Officer |
Pursuant to the requirements of the Securities Exchange Act of 1934, this report has been signed below by the following persons on behalf of the registrant and in the capacities and on the dates indicated.
| February 17, 2023 | /s/ Martin E. Stein, Jr. | |
| Martin E. Stein. Jr., Executive Chairman of the Board | ||
| February 17, 2023 | /s/ Lisa Palmer | |
| Lisa Palmer, President, Chief Executive Officer, and Director | ||
| February 17, 2023 | /s/ Michael J. Mas | |
| Michael J. Mas, Executive Vice President, Chief Financial Officer (Principal Financial Officer) | ||
| February 17, 2023 | /s/ J. Christian Leavitt | |
| J. Christian Leavitt, Senior Vice President and Treasurer (Principal Accounting Officer) | ||
| February 17, 2023 | /s/ Bryce Blair | |
| Bryce Blair, Director | ||
| February 17, 2023 | /s/ C. Ronald Blankenship | |
| C. Ronald Blankenship, Director | ||
| February 17, 2023 | /s/ Kristin A. Campbell | |
| Kristin A. Campbell, Director | ||
| February 17, 2023 | /s/ Deirdre J. Evens | |
| Deirdre J. Evens, Director | ||
| February 17, 2023 | /s/ Thomas W. Furphy | |
| Thomas W. Furphy, Director | ||
| February 17, 2023 | /s/ Karin M. Klein | |
| Karin M. Klein, Director | ||
| February 17, 2023 | /s/ Peter Linneman | |
| Peter Linneman, Director | ||
| February 17, 2023 | /s/ David P. O'Connor | |
| David P. O'Connor, Director | ||
| February 17, 2023 | /s/ James H Simmons | |
| James H. Simmons, Director | ||
| February 17, 2023 | /s/ Thomas G. Wattles | |
| Thomas G. Wattles, Director |