 filings.tools
Item 5. Market For Registrant’s Common Equity, Related Shareholder Matters and Issuer Purchases of Equity Securities
5K characters. Original on sec.gov · Markdown
Item 5. Market For Registrant’s Common Equity, Related Shareholder Matters and Issuer Purchases of Equity Securities
Regions common stock, par value $.01 per share, is listed for trading on the New York Stock Exchange under the symbol RF. Information relating to compensation plans under which Regions' equity securities are authorized for issuance is presented in Part III, Item 12. As of February 21, 2024, there were 35,025 holders of record of Regions common stock (including participants in the Broadridge Direct Stock Purchase and Dividend Reinvestment Plan for Regions Financial Corporation).
Restrictions on the ability of Regions Bank to transfer funds to Regions at December 31, 2023, are set forth in Note 12 "Regulatory Capital Requirements and Restrictions" to the consolidated financial statements, which are included in Item 8. of this Annual Report on Form 10-K. A discussion of certain limitations on the ability of Regions Bank to pay dividends to Regions and the ability of Regions to pay dividends on its common stock is set forth in Item 1. “Business” under the heading “Supervision and Regulation—Payment of Dividends” of this Annual Report on Form 10-K.
Issuer Purchases of Equity Securities
On April 20, 2022, the Board authorized the repurchase of up to $2.5 billion of the Company's common stock, permitting purchases from the second quarter of 2022 through the fourth quarter of 2024.
The following table presents information regarding issuer purchases of equity securities during the fourth quarter of 2023. All of these shares were immediately retired upon repurchase and therefore were not included in treasury stock.
| Period | Total Number of Shares Purchased | Average Price Paid per Share**(1)** | Total Number of Shares Purchased as Part of Publicly Announced Plans or Programs | Maximum Approximate Dollar Value of Shares that May Yet Be Purchased Under Publicly Announced Plans or Programs | |||||||||||||||||||||||||
| October 1-31, 2023 | 6,437,685 | $ | 14.22 | 6,437,685 | $ | 2,393,179,589 | |||||||||||||||||||||||
| November 1-30, 2023 | 5,653,231 | $ | 15.66 | 5,653,231 | $ | 2,304,697,925 | |||||||||||||||||||||||
| December 1-31, 2023 | 4,038,243 | $ | 17.36 | 4,038,243 | $ | 2,234,699,026 | |||||||||||||||||||||||
| Total Fourth Quarter | 16,129,159 | $ | 15.82 | 16,129,159 | $ | 2,234,699,026 |
(1) Average price paid does not reflect the 1 percent excise tax charged on public company share repurchases.
Table of Contents
PERFORMANCE GRAPH
The graph below compares the yearly percentage change in the cumulative total return of Regions common stock against the cumulative total return of the S&P 500 Index and the S&P 500 Banks Index for the past five years. This presentation assumes that the value of the investment in Regions’ common stock and in each index was $100 and that all dividends were reinvested.
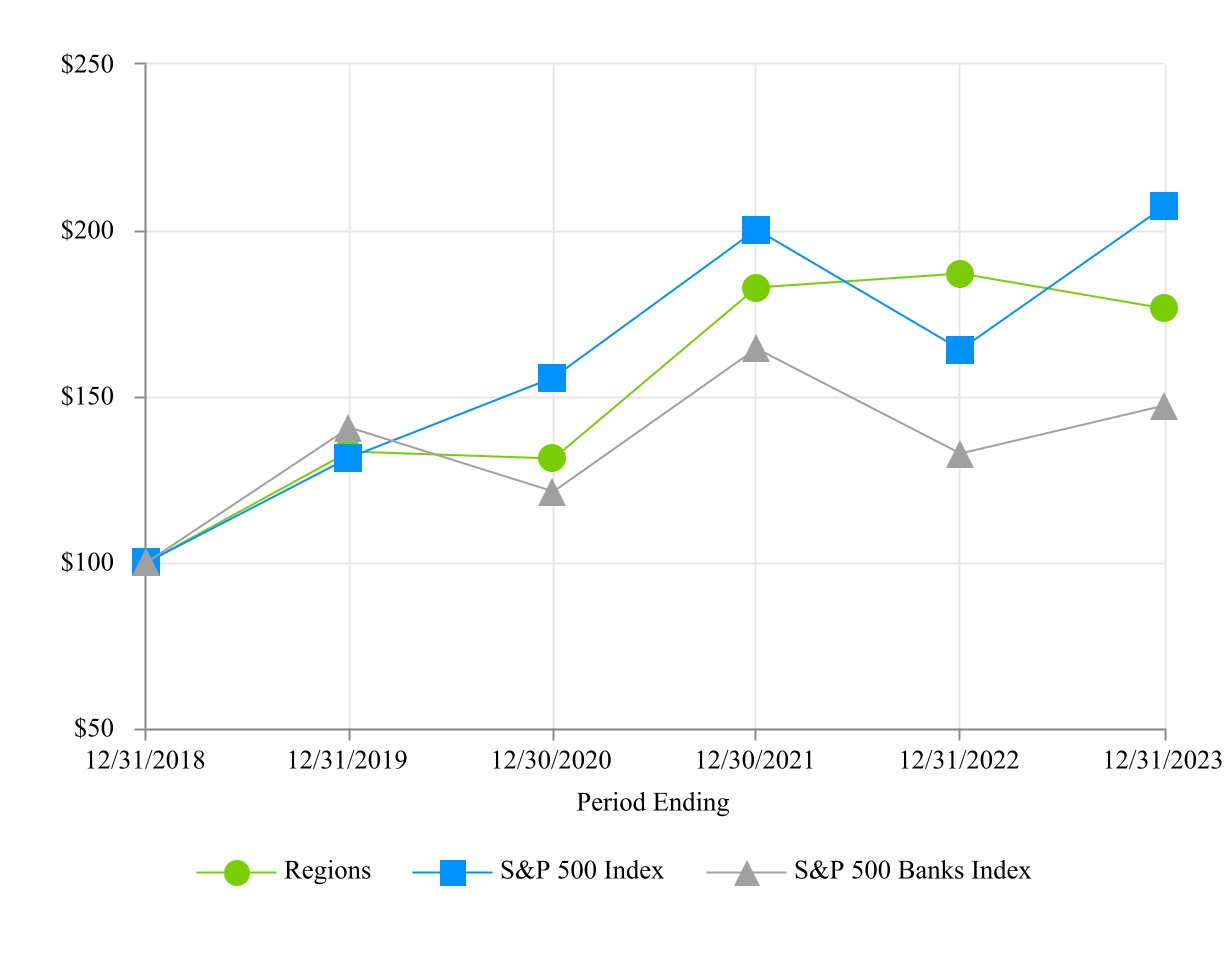
| Cumulative Total Return | |||||||||||||||||||||||||||||||||||
| 12/31/2018 | 12/31/2019 | 12/31/2020 | 12/31/2021 | 12/31/2022 | 12/31/2023 | ||||||||||||||||||||||||||||||
| Regions | $ | 100.00 | $ | 133.30 | $ | 131.12 | $ | 182.78 | $ | 187.01 | $ | 176.35 | |||||||||||||||||||||||
| S&P 500 Index | 100.00 | 131.47 | 155.65 | 200.29 | 163.98 | 207.04 | |||||||||||||||||||||||||||||
| S&P 500 Banks Index | 100.00 | 140.64 | 121.29 | 164.28 | 132.73 | 147.28 |
Previous: Item 4. Mine Safety Disclosures. · Next: Item 6. [Reserved]