 filings.tools
Item 5. MARKET FOR REGISTRANT’S COMMON EQUITY, RELATED STOCKHOLDER MATTERS AND ISSUER PURCHASES OF EQUITY SECURITIES
5K characters. Original on sec.gov · Markdown
Item 5. MARKET FOR REGISTRANT’S COMMON EQUITY, RELATED STOCKHOLDER MATTERS AND ISSUER PURCHASES OF EQUITY SECURITIES
Our common stock is traded on the NYSE under the symbol “RMD”. As of June 30, 2019, there were 20 holders of record of our common stock, although many of these holders of record own shares as nominees on behalf of other beneficial owners.
Securities Authorized for Issuance Under Equity Compensation Plans
The information included under Item 12 of Part III of this Report, “Security Ownership of Certain Beneficial Owners and Management and Related Stockholder Matters,” is hereby incorporated by reference into this Item 5 of Part II of this Report.
Purchases of Equity Securities
During all of our share buyback programs, we have repurchased an aggregate of 41.8 million shares at a total cost of $1.6 billion. The following table summarizes purchases by us of our common stock during the fiscal year ending June 30, 2019:
| Period | Total Number of Shares Purchased | Average Price Paid per Share (USD) | Total Number of Shares Purchased as Part of Publicly Announced Programs (1) | Maximum Number of Shares that May Yet Be Purchased Under the Programs (1) | ||||||||
| July 1 - 31, 2018 | - | - | 41,636,234 | 13,079,779 | ||||||||
| August 1 - 31, 2018 | - | - | 41,636,234 | 13,079,779 | ||||||||
| September 1 - 30, 2018 | 200,000 | $ | 114.20 | 41,836,234 | 12,879,779 | |||||||
| October 1 - 31, 2018 | - | - | 41,836,234 | 12,879,779 | ||||||||
| November 1 - 30, 2018 | - | - | 41,836,234 | 12,879,779 | ||||||||
| December 1 - 31, 2018 | - | - | 41,836,234 | 12,879,779 | ||||||||
| January 1 - 31, 2019 | - | - | 41,836,234 | 12,879,779 | ||||||||
| February 1 - 28, 2019 | - | - | 41,836,234 | 12,879,779 | ||||||||
| March 1 - 31, 2019 | - | - | 41,836,234 | 12,879,779 | ||||||||
| April 1 - 30, 2019 | - | - | 41,836,234 | 12,879,779 | ||||||||
| May 1 - 31, 2019 | - | - | 41,836,234 | 12,879,779 | ||||||||
| June 1 - 30, 2019 | - | - | 41,836,234 | 12,879,779 | ||||||||
| Total | 200,000 | $ | 114.20 | 41,836,234 | 12,879,779 |
(1) On February 21, 2014, our board of directors approved our current share repurchase program, authorizing us to acquire up to an aggregate of 20.0 million shares of our common stock. The program allows us to repurchase shares of our common stock from time to time for cash in the open market, or in negotiated or block transactions, as market and business conditions warrant and subject to applicable legal requirements. There is no expiration date for this program, and the program may be accelerated, suspended, delayed or discontinued at any time at the discretion of our board of directors. All share repurchases after February 21, 2014 have been executed under this program.
-34-
| PART II | Item 5 |
|---|
RESMED INC. AND SUBSIDIARIES
PERFORMANCE GRAPH
This performance graph is furnished and shall not be deemed “filed” with the SEC or subject to Section 18 of the Exchange Act, nor shall it be deemed incorporated by reference in any of our filings under the Securities Act of 1933, as amended.
The following graph compares the cumulative total stockholders return on our common stock from June 30, 2014 through June 30, 2019, with the comparable cumulative return of the S&P 500 index, the S&P 500 Health Care index, and the Dow Jones U.S. Medical Devices index. The graph assumes that $100 was invested in our common stock and each index on June 30, 2014. In addition, the graph assumes the reinvestment of all dividends paid. The stock price performance on the following graph is not necessarily indicative of future stock price performance.
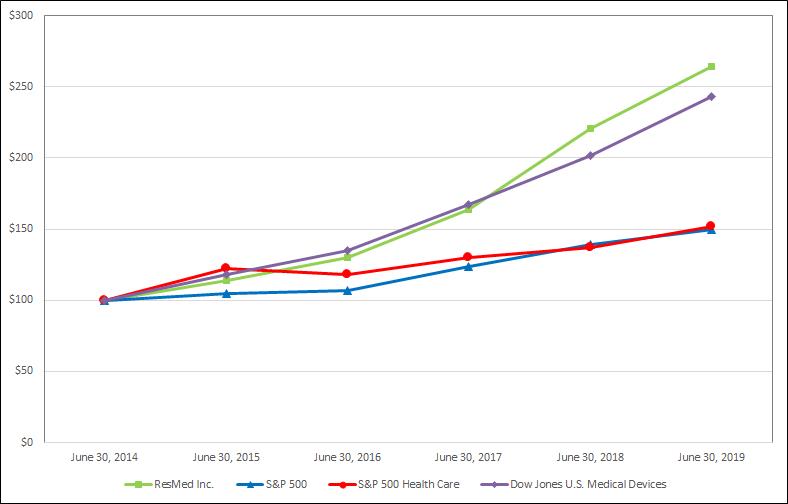
The following table shows total indexed return of stock price plus reinvestments of dividends, assuming an initial investment of $100 at June 30, 2014, for the indicated periods.
| As of June 30, | ||||||
| Index | 2014 | 2015 | 2016 | 2017 | 2018 | 2019 |
| ResMed Inc. | 100 | 114 | 130 | 164 | 221 | 264 |
| S&P 500 | 100 | 105 | 107 | 124 | 139 | 150 |
| S&P 500 Health Care | 100 | 122 | 118 | 130 | 137 | 152 |
| Dow Jones U.S. Medical Devices | 100 | 118 | 135 | 167 | 202 | 243 |
-35-
| PART II | Item 6 |
|---|
RESMED INC. AND SUBSIDIARIES
Previous: Item 4. MINE SAFETY DISCLOSURES · Next: Item 6. SELECTED FINANCIAL DATA