 filings.tools
Rockwell Automation 10-K 2022-09-30
Filed 2022-11-08. 24 sections, 444K characters. Original on sec.gov · Markdown · JSON
Cover and table of contents
UNITED STATES
SECURITIES AND EXCHANGE COMMISSION
Washington, D.C. 20549
____________
Form 10-K
(Mark One)
| ☒ | ANNUAL REPORT PURSUANT TO SECTION 13 OR 15(d) OF THE SECURITIES EXCHANGE ACT OF 1934 |
For the fiscal year ended September 30, 2022
OR
| ☐ | TRANSITION REPORT PURSUANT TO SECTION 13 OR 15(d) OF THE SECURITIES EXCHANGE ACT OF 1934 |
For the transition period from _______ to _______
Commission file number 1-12383
Rockwell Automation, Inc.
(Exact name of registrant as specified in its charter)
| Delaware | 25-1797617 | ||||||||||
| (State or other jurisdiction of | (I.R.S. Employer | ||||||||||
| incorporation or organization) | Identification No.) | ||||||||||
| 1201 South Second Street | Milwaukee | Wisconsin | 53204 | ||||||||
| (Address of principal executive offices) | (Zip Code) |
+1 (414) 382-2000
Registrant’s telephone number, including area code
Securities registered pursuant to Section 12(b) of the Act:
| Title of each class | Trading Symbol | Name of each exchange on which registered | ||||||||||||
| Common Stock ($1.00 par value) | ROK | New York Stock Exchange |
Securities registered pursuant to Section 12(g) of the Act: None
Indicate by check mark if the registrant is a well-known seasoned issuer, as defined in Rule 405 of the Securities Act. Yes ☒ No ☐
Indicate by check mark if the registrant is not required to file reports pursuant to Section 13 or Section 15(d) of the Act. Yes ☐ No ☒
Indicate by check mark whether the registrant (1) has filed all reports required to be filed by Section 13 or 15(d) of the Securities Exchange Act of 1934 during the preceding 12 months (or for such shorter period that the registrant was required to file such reports), and (2) has been subject to such filing requirements for the past 90 days. Yes ☒ No ☐
Indicate by check mark whether the registrant has submitted electronically every Interactive Data File required to be submitted pursuant to Rule 405 of Regulation S-T during the preceding 12 months (or for such shorter period that the registrant was required to submit such files). Yes ☒ No ☐
Indicate by check mark whether the registrant is a large accelerated filer, an accelerated filer, a non-accelerated filer, a smaller reporting company, or an emerging growth company. See the definitions of “large accelerated filer,” “accelerated filer,” “smaller reporting company,” and “emerging growth company” in Rule 12b-2 of the Exchange Act. (Check one):
| Large accelerated filer | ☒ | Accelerated filer | ☐ | |||||||||||||||||
| Non-accelerated filer | ☐ | Smaller reporting company | ☐ | |||||||||||||||||
| Emerging growth company | ☐ |
If an emerging growth company, indicate by check mark if the registrant has elected not to use the extended transition period for complying with any new or revised financial accounting standards provided pursuant to Section 13(a) of the Exchange Act. ☐
Indicate by check mark whether the registrant has filed a report on and attestation to its management’s assessment of the effectiveness of its internal control over financial reporting under Section 404(b) of the Sarbanes-Oxley Act (15 U.S.C. 7262(b)) by the registered public accounting firm that prepared or issued its audit report. ☒
Indicate by check mark whether the registrant is a shell company (as defined in Rule 12b-2 of the Act). Yes ☐ No ☒
The aggregate market value of registrant’s voting stock held by non-affiliates of registrant on March 31, 2022 was approximately $32.5 billion. 114,844,152 shares of registrant’s Common Stock, par value $1 per share, were outstanding on October 31, 2022.
DOCUMENTS INCORPORATED BY REFERENCE
Certain information contained in the Proxy Statement for the Annual Meeting of Shareowners of registrant to be held on February 7, 2023, is incorporated by reference into Part III hereof.
PART I
FORWARD-LOOKING STATEMENTS
This Annual Report on Form 10-K contains statements (including certain projections and business trends) that are “forward-looking statements” as defined in the Private Securities Litigation Reform Act of 1995. Words such as “believe”, “estimate”, “project”, “plan”, “expect”, “anticipate”, “will”, “intend”, and other similar expressions may identify forward-looking statements. Actual results may differ materially from those projected as a result of certain risks and uncertainties, many of which are beyond our control, including but not limited to:
-
the availability and price of components and materials;
-
macroeconomic factors, including inflation, global and regional business conditions (including adverse impacts in certain markets, such as Oil & Gas), commodity prices, currency exchange rates, the cyclical nature of our customers’ capital spending, and sovereign debt concerns;
-
the severity and duration of disruptions to our business due to pandemics (including the COVID-19 pandemic), natural disasters (including those as a result of climate change), acts of war (including the Russia and Ukraine conflict), strikes, terrorism, social unrest or other causes, including the impacts of the COVID-19 pandemic and efforts to manage it on the global economy, liquidity and financial markets, demand for our hardware and software products, solutions, and services, our supply chain, our work force, our liquidity and the value of the assets we own;
-
the availability and cost of capital;
-
our ability to attract, develop, and retain qualified personnel;
-
the successful integration and management of strategic transactions and achievement of the expected benefits of these transactions;
-
laws, regulations, and governmental policies affecting our activities in the countries where we do business, including those related to tariffs, taxation, trade controls (including sanctions placed on Russia), cybersecurity, and climate change;
-
the availability, effectiveness, and security of our information technology systems;
-
our ability to manage and mitigate the risk related to security vulnerabilities and breaches of our hardware and software products, solutions, and services;
-
the successful development of advanced technologies and demand for and market acceptance of new and existing hardware and software products;
-
our ability to manage and mitigate the risks associated with our solutions and services businesses;
-
the successful execution of our cost productivity initiatives;
-
competitive hardware and software products, solutions, and services, pricing pressures, and our ability to provide high quality products, solutions, and services;
-
disruptions to our distribution channels or the failure of distributors to develop and maintain capabilities to sell our products;
-
intellectual property infringement claims by others and the ability to protect our intellectual property;
-
the uncertainty of claims by taxing authorities in the various jurisdictions where we do business;
-
the uncertainties of litigation, including liabilities related to the safety and security of the hardware and software products, solutions, and services we sell;
-
risks associated with our investment in common stock of PTC Inc., including the potential for volatility in our reported quarterly earnings associated with changes in the market value of such stock;
-
our ability to manage costs related to employee retirement and health care benefits; and
-
other risks and uncertainties, including but not limited to those detailed from time to time in our Securities and Exchange Commission (SEC) filings.
These forward-looking statements reflect our beliefs as of the date of filing this report. We undertake no obligation to update or revise any forward-looking statement, whether as a result of new information, future events, or otherwise. See Item 1A. Risk Factors for more information.
Item 1. Business
General
Rockwell Automation, Inc. (“Rockwell Automation” or the “Company”) is a global leader in industrial automation and digital transformation. We connect the imaginations of people with the potential of technology to expand what is humanly possible, making the world more productive and more sustainable. Our hardware and software products, solutions, and services are designed to meet our customers’ needs to reduce total cost of ownership, maximize asset utilization, improve time to market, and reduce enterprise business risk. See Item 7. Management’s Discussion and Analysis of Financial Condition and Results of Operations (MD&A) for additional information on our business and long-term strategy.
The Company continues the business founded as the Allen-Bradley Company in 1903. The privately-owned Allen-Bradley Company was a leading North American manufacturer of industrial automation equipment when the former Rockwell International Corporation (RIC) purchased it in 1985.
The Company was incorporated in Delaware in connection with a tax-free reorganization completed on December 6, 1996, pursuant to which we divested our former aerospace and defense businesses (the A&D Business) to The Boeing Company (Boeing). In the reorganization, RIC contributed all of its businesses, other than the A&D Business, to the Company and distributed all capital stock of the Company to RIC’s shareowners. Boeing then acquired RIC.
As used herein, the terms “we”, “us”, “our”, “Rockwell Automation”, or the “Company” include wholly-owned and controlled majority-owned subsidiaries and predecessors unless the context indicates otherwise. Information included in this Annual Report on Form 10-K refers to our continuing businesses unless otherwise indicated.
Whenever an Item of this Annual Report on Form 10-K refers to information in our Proxy Statement for our Annual Meeting of Shareowners to be held on February 7, 2023 (the Proxy Statement), or to information under specific captions in Item 7. MD&A, or in Item 8. Financial Statements and Supplementary Data (the Consolidated Financial Statements), the information is incorporated in that Item by reference. All date references to years and quarters refer to our fiscal year and quarters, unless otherwise stated.
Operating Segments
Starting in fiscal 2021, we have three operating segments: Intelligent Devices, Software & Control, and Lifecycle Services. The Intelligent Devices segment includes drives, motion, safety, sensing, industrial components, and configured-to-order products. The Software & Control segment includes control and visualization software and hardware, information software, and network and security infrastructure. The Lifecycle Services segment includes consulting, professional services and solutions, connected services, and maintenance services, as well as the Sensia joint venture.
Our operating segments share common sales, supply chain, and functional support organizations and conduct business globally. Major markets served by all segments consist of discrete end markets (e.g., Automotive, Semiconductor, and Warehousing & Logistics), hybrid end markets (e.g., Food & Beverage and Life Sciences), and process end markets (e.g., Oil & Gas, Metals, and Chemicals). See Note 19 in the Consolidated Financial Statements for additional information on our operating segments.
Geographic Information
We do business in more than 100 countries around the world. The largest sales outside the United States on a country of destination basis are in China, Canada, Italy, Mexico, Germany, and the United Kingdom. See Item 1A. Risk Factors for a discussion of risks associated with our global operations.
Competition
Our competitors range from large, diversified corporations that may also have business interests outside of industrial automation to smaller companies that offer a limited portfolio of industrial automation products, solutions, and services. Factors that influence our competitive position include the breadth of our product portfolio and scope of solutions, technology differentiation, domain expertise, installed base, distribution network, quality of hardware and software products, solutions, and services, global presence, and price. Major competitors include Siemens AG, ABB Ltd, Schneider Electric SA, Emerson Electric Co., Mitsubishi Electric Corp., Honeywell International Inc., AVEVA Group plc, Dassault Systemes, and Aspen Technology, Inc.
Distribution
In most countries, we sell primarily through independent distributors in conjunction with our direct sales force. Approximately 75 percent of our global sales are through independent distributors. Sales to our largest distributor in 2022, 2021, and 2020, were approximately 10 percent of our total sales.
Employees
See Item 7. MD&A for information on our employees, including information related to attracting, developing, and retaining highly qualified talent.
Raw Materials
We purchase a wide range of equipment, components, finished products, and materials used in our business. The raw materials essential to the manufacture of our products generally are available at competitive prices. We have a broad base of suppliers and subcontractors. We depend upon the ability of our suppliers and subcontractors to meet performance and quality specifications and delivery schedules. See Item 1A. Risk Factors for a discussion of risks associated with our reliance on third-party suppliers.
Backlog
See Item 7. MD&A for information on our order backlog.
Environmental Protection Requirements
Information about the effect of compliance with environmental protection requirements and resolution of environmental claims is contained in Note 17 in the Consolidated Financial Statements. See Item 1A. Risk Factors for a discussion of risks associated with liabilities and costs related to environmental remediation.
Patents, Licenses, and Trademarks
We own or license numerous patents and patent applications related to our hardware and software products, solutions, and services. While in the aggregate our patents and licenses are important in the operation of our business, we do not believe that loss or termination of any one of them would materially affect our business or financial condition. We have received various claims of patent infringement and requests for patent indemnification. We believe that none of these claims or requests will have a material adverse effect on our financial condition. See Item 1A. Risk Factors for a discussion of risks associated with our intellectual property.
The Company’s name and its registered trademark “Rockwell Automation®” and other trademarks such as “Allen-Bradley®”, “A-B®”, “PlantPAx® Process Automation System™”, and “The Connected Enterprise®” are important to all of our business segments. In addition, we own other important trademarks that we use, such as “ControlLogix®” and “CompactLogix®” for our control systems, “PowerFlex®” for our AC drives, and “Rockwell Software®”, “FactoryTalk®”, “Plex Systems®”, and “Fiix®” for our software and cloud offerings.
Seasonality
Our business segments are not subject to significant seasonality. However, the calendarization of our results can vary and may be affected by the seasonal spending patterns of our customers due to their annual budgeting processes and their working schedules.
Available Information
We maintain a website at https://www.rockwellautomation.com. Our annual reports on Form 10-K, quarterly reports on Form 10-Q, current reports on Form 8-K, and any amendments to such reports filed or furnished pursuant to Section 13(a) or 15(d) of the Securities Exchange Act of 1934 (the Exchange Act), as well as our annual reports to shareowners and Section 16 reports on Forms 3, 4 and 5, are available free of charge on this site through the “Investors” link as soon as reasonably practicable after we file or furnish these reports with the SEC. All reports we file with the SEC are also available free of charge via EDGAR through the SEC’s website at https://www.sec.gov. Our Guidelines on Corporate Governance and charters for our Board committees are also available on our website. The information contained on and linked from our website is not incorporated by reference into this Annual Report on Form 10-K.
Item 1A. Risk Factors
In the ordinary course of our business, we face various strategic, operating, compliance, and financial risks. These risks could have an impact on our business, financial condition, operating results, and cash flows. Our most significant risks are set forth below and elsewhere in this Annual Report on Form 10-K.
Our Enterprise Risk Management (ERM) process seeks to identify and address significant risks. Our ERM process assesses, manages, and monitors risks consistent with the integrated risk framework in the Enterprise Risk Management - Integrated Framework (2017) issued by the Committee of Sponsoring Organizations of the Treadway Commission (COSO). We believe that risk-taking is an inherent aspect of the pursuit of our strategy. Our goal is to manage risks prudently rather than avoid risks. We can mitigate risks and their impact on the Company only to a limited extent.
A team of senior executives prioritizes identified risks and assigns an executive to address each major identified risk area and lead action plans to manage risks. Our Board of Directors provides oversight of the ERM process and reviews significant identified risks. The Audit Committee of the Board of Directors also reviews significant financial risk exposures and the steps management has taken to monitor and manage them. Our other Board committees also play a role in risk management, as set forth in their respective charters.
Our goal is to proactively manage risks using a structured approach in conjunction with strategic planning, with the intent to preserve and enhance shareowner value. However, the risks set forth below and elsewhere in this Annual Report on Form 10-K and other risks and uncertainties could adversely affect us and cause our results to vary materially from recent results or from our anticipated future results.
Industry and Economic Risks
Adverse changes in macroeconomic or industry conditions may result in decreases in our sales and profitability.
We are subject to macroeconomic cycles and when recessions occur, we may experience reduced, canceled or delayed orders, payment delays or defaults, supply chain disruptions, or other adverse events as a result of the economic challenges faced by our customers, prospective customers, and suppliers.
Demand for our hardware and software products, solutions, and services is sensitive to changes in levels of production and the financial performance of major industries that we serve. As economic activity slows, credit markets tighten, or sovereign debt concerns arise, companies tend to reduce their levels of capital spending, which could result in decreased demand for our hardware and software products, solutions, and services.
As a global company operating in over 100 countries, we face risks related to foreign currency markets. A strengthening U.S. Dollar (USD) may adversely impact our sales and profitability related to business we do outside the U.S.
Oil & Gas is a major industry that we serve, including through our Sensia joint venture. When adverse Oil & Gas industry events arise, companies may reduce their levels of spending, which could result in decreased demand for our hardware and software products, solutions, and services. Demand for our hardware and software products, solutions, and services is sensitive to industry volatility and risks including those related to commodity prices, supply and demand dynamics, production costs, geological and political activities, and environmental regulations including those intended to reduce the impact of climate change.
Increases in energy demand and supply disruptions caused by the Russia and Ukraine conflict have resulted in significantly higher energy prices, particularly in Europe. Persistent high energy prices and the potential for further supply disruptions, including rationing, may have an adverse impact on industrial output and could reduce demand for our hardware and software products, solutions, and services in Europe.
We face the potential harms of natural disasters, including those as a result of climate change, pandemics, including the COVID-19 pandemic, acts of war, including the Russia and Ukraine conflict, terrorism, international conflicts, or other disruptions to our operations, the duration and severity of which are highly uncertain and difficult to predict.
Our business depends on the movement of people and goods around the world. Natural disasters (including but not limited to those as a result of climate change), pandemics (including the COVID-19 pandemic), acts or threats of war (including the Russia and Ukraine conflict) or terrorism, international conflicts, power outages, fires, explosions, equipment failures, sabotage, political instability, and the actions taken by governments could cause damage to or disrupt our business operations, our suppliers or our customers, and could create economic instability. Disruptions to our information technology (IT) infrastructure from system failures, shutdowns, power outages, telecommunication or utility failures, and other events, including disruptions at third-party IT and other service providers, could also interfere with or disrupt our operations. Although it is not possible to predict such events or their consequences, these events could decrease demand for our hardware and software products, solutions, or services, increase our costs, or make it difficult or impossible for us to deliver products, solutions, or services.
The COVID-19 pandemic continues to cause disruption to the global economy, including in all of the regions in which we, our suppliers, distributors, business partners, and customers do business and in which our workforce is located. We continue to monitor the pandemic, and while periodic local increases and decreases in COVID-19 cases are likely, generally the restrictions due to and in response to the pandemic continue to relax in most locations. However, the COVID-19 pandemic and efforts to manage it, including those by governmental authorities, have had, and could continue to have, an adverse effect on the economy and our business in many ways. This includes, but is not limited to, a continued limit on the movement of goods, services, and to some extent people, including our own workforce, resulting in worldwide disruptions in our supply chain and distribution. Adverse impacts to our customers’ business operations and financial condition could lead to a decrease in their liquidity and/or spending resulting in a decrease in demand for and our customers’ ability to pay for our hardware and software products, solutions, and services.
The unprecedented and continuously evolving nature of the COVID-19 pandemic make the duration and severity of its impacts difficult to predict, which could limit our ability to respond to those impacts. Additionally, the impacts described above and other impacts of the COVID-19 pandemic and responses to it could substantially increase the risk to us from the other risks described in this Item 1A. Risk Factors.
Volatility and disruption of the capital and credit markets may result in increased costs to maintain our capital structure.
Our ability to access the credit markets and the costs of borrowing are affected by the strength of our credit rating and current market conditions. If our access to credit, including the commercial paper market, is adversely affected by a change in market conditions or otherwise, our cost of borrowings may increase or our ability to fund operations may be reduced.
Our industry is highly competitive.
We face strong competition in all of our market segments in several significant respects. We compete based on breadth and scope of our hardware and software product portfolio and solution and service offerings, technology differentiation, the domain expertise of our employees and partners, product performance, quality of our hardware and software products, solutions, and services, knowledge of integrated systems and applications that address our customers’ business challenges, pricing, delivery, and customer service. The relative importance of these factors differs across the geographic markets and product areas that we serve and across our market segments. We seek to maintain competitive pricing levels across and within geographic markets by continually developing advanced technologies for new hardware and software products and product enhancements and offering complete solutions for our customers’ business problems. In addition, we continue to drive productivity to reduce our cost structure. If we fail to achieve our objectives, to keep pace with technological changes, or to provide high quality hardware and software products, solutions, and services, we may lose business or experience price erosion and correspondingly lower sales and margins. We expect the level of competition to remain high in the future, which could limit our ability to maintain or increase our market share or profitability.
Business and Operational Risks
We rely on suppliers to provide equipment, components, and services.
Our business requires that we buy equipment, components, and services including finished products, electronic components, and commodities. Our reliance on suppliers involves certain risks, including:
-
shortages of components, commodities, or other materials, which could adversely affect our manufacturing efficiencies and ability to make timely delivery of our products, solutions, and services;
-
changes in the cost of these purchases due to inflation, exchange rate fluctuations, taxes, tariffs, commodity market volatility, or other factors that affect our suppliers;
-
poor quality or an insecure supply chain, which could adversely affect the reliability and reputation of our hardware and software products, solutions, and services;
-
embargoes, sanctions, and other trade restrictions that may affect our ability to purchase from various suppliers; and
-
intellectual property risks such as challenges to ownership of rights or alleged infringement by suppliers.
Any of these uncertainties could adversely affect our profitability and ability to compete. We also maintain several single-source supplier relationships because either alternative sources are not available or the relationship is advantageous due to performance, quality, support, delivery, capacity, or price considerations. Unavailability of, or delivery delays for, single-source components or products could adversely affect our ability to ship the related products in a timely manner. The effect of unavailability or delivery delays would be more severe if associated with our higher volume and more profitable products. Even where substitute sources of supply are available, qualifying alternative suppliers and establishing reliable supplies could cost more or result in delays and a loss of sales.
Our business success depends on attracting, developing, and retaining highly qualified personnel.
Our success depends on the efforts and abilities of our management team and employees. The skills, experience, and industry knowledge of our employees significantly benefit our operations and performance. The market for employees and leaders with certain skills and experiences is very competitive, and difficulty attracting, developing, and retaining members of our management team and key employees could have a negative effect on our business, operating results, and financial condition. Maintaining a positive and inclusive culture and work environment, offering attractive compensation, benefits, and development opportunities, and effectively implementing processes and technology that enable our employees to work effectively and efficiently are important to our ability to attract and retain employees.
We sell to customers around the world and are subject to the risks of doing business in many countries.
We do business in more than 100 countries around the world. In addition, our manufacturing operations, suppliers, and employees are located in many places around the world. Less than half of our total sales in 2022 were to customers outside the U.S. The future success of our business depends on growth in our sales in all global markets. Our global operations are subject to numerous financial, legal, and operating risks, such as political and economic instability; prevalence of corruption in certain countries; enforcement of contract and intellectual property rights; and compliance with existing and future laws, regulations, and policies, including those related to exports, imports, tariffs, embargoes and other trade restrictions (including sanctions placed on Russia), investments, taxation, product content and performance, employment, and repatriation of earnings. In addition, we are affected by changes in foreign currency exchange rates, inflation rates, and interest rates. The occurrence or consequences of these risks may make it more difficult to operate our business and may increase our costs, which could decrease our profitability and have an adverse effect on our financial condition.
Failures or security breaches of our products, connected services, manufacturing environment, supply chain, or information technology systems could have an adverse effect on our business.
We rely heavily on technology in our hardware and software products, solutions, and services for our customers’ manufacturing environment, and in our enterprise infrastructure. Despite the implementation of security measures, our systems are vulnerable to unauthorized access by nation states, hackers, cyber-criminals, malicious insiders, and other actors who may engage in fraud, theft of confidential or proprietary information, or sabotage. Our systems could be compromised by malware (including ransomware), cyber attacks, and other events, ranging from widespread, non-targeted, global cyber threats to targeted advanced persistent threats. Given that our hardware and software products, solutions, and services are used in critical infrastructure, these threats could indicate increased risk for our products, services, solutions, manufacturing, and IT infrastructure. Past global cyber attacks have also been perpetuated by compromising software updates in widely-used software products, increasing the risk that vulnerabilities or malicious content could be inserted into our products. In some cases, malware attacks were spread throughout the supply chain, moving from one company to the next via authorized network connections.
Our hardware and software products, solutions, and services are used by our direct and indirect customers in applications that may be subject to information theft, tampering, sabotage, or cyber-attacks. Careless or malicious actors could cause a customer’s process to be disrupted or could cause equipment to operate in an improper manner that could result in harm to people or property. While we continue to improve the security attributes of our hardware and software products, solutions, and services, we can reduce risk, not eliminate it. To a significant extent, the security of our customers’ systems depends on how those systems are designed, installed, protected, configured, updated and monitored, and much of this is typically outside our control. In addition, both software and hardware supply chains introduce security vulnerabilities into many products across the industry.
Our business uses technology resources on a dispersed, global basis for a wide variety of functions including development, engineering, manufacturing, sales, accounting, and human resources. Our vendors, partners, employees, and customers have access to, and share, information across multiple locations via various digital technologies. In addition, we rely on partners and vendors, including cloud providers, for a wide range of products and outsourced activities as part of our internal IT infrastructure and our commercial offerings. Secure connectivity is important to these ongoing operations. Also, our partners and vendors frequently have access to our confidential information as well as confidential information about our customers, employees, and others. We design our security architecture to reduce the risk that a compromise of our partners’ infrastructure, for example a cloud platform, could lead to a compromise of our internal systems or customer networks. In addition, our Third-Party Risk Program manages risk posed by our suppliers that have access to our confidential information, systems, or network, but this risk cannot be eliminated and vulnerabilities at third parties could result in unknown risk exposure to our business and information.
The current cyber threat environment indicates increased risk for all companies, including those in industrial automation and information. Like other global companies, we have experienced cyber threats and incidents, although none have been material or had a material adverse effect on our business or financial condition. Our information security efforts, under the leadership of our Chief Information Security Officer and Chief Product Security Officer, with the support of the entire management team, include major programs designed to address security governance and risk, product security, identification and protection of critical assets, insider risk, third-party risk, security awareness, and cyber defense operations. We believe these measures reduce, but cannot eliminate, the risk of a cybersecurity incident. Any significant security incidents could have an adverse impact on sales, harm our reputation and cause us to incur legal liability and increased costs to address such events and related security concerns.
An inability to respond to changes in customer preferences could result in decreased demand for our products.
Our success depends in part on our ability to anticipate and offer hardware and software products that appeal to the changing needs and preferences of our customers in the various markets we serve. Developing new hardware and software products requires high levels of innovation, and the development process is often lengthy and costly. If we are not able to anticipate, identify, develop, and market products that respond to changes in customer preferences and emerging technological and broader industry trends, demand for our products could decline.
There are inherent risks in our solutions and services businesses.
Risks inherent in the sale of solutions and services include assuming greater responsibility for successfully delivering projects that meet a particular customer specification, including defining and controlling contract scope, efficiently executing projects, and managing the performance and quality of our subcontractors and suppliers. If we are unable to manage and mitigate these risks, we could incur cost overruns, liabilities, and other losses that would adversely affect our results of operations.
We rely on our distribution channel for a substantial portion of our sales.
In North America, a large percentage of our sales are through distributors. In certain other countries, the majority of our sales are also through a limited number of distributors. We depend on the capabilities and competencies of our distributors to sell our hardware and software products, solutions, and services and deliver value to our customers. Disruptions to our existing distribution channel or the failure of distributors to maintain and develop the appropriate capabilities to sell our hardware and software products, solutions, and services could adversely affect our sales. A disruption could result from the sale of a distributor to a competitor, financial instability of a distributor, or other events.
Intellectual property infringement claims of others and the inability to protect our intellectual property rights could harm our business and our customers.
Others may assert intellectual property infringement claims against us or our customers. We frequently provide a limited intellectual property indemnity in connection with our terms and conditions of sale to our customers and in other types of contracts with third parties. Indemnification payments and legal expenses to defend claims could be costly.
In addition, we own the rights to many patents, trademarks, brand names, and trade names that are important to our business. The inability to enforce our intellectual property rights (including as a result of counterfeit products and sales made by unauthorized resellers) may have an adverse effect on our results of operations. Expenses related to enforcing our intellectual property rights could be significant.
Increasing employee benefit costs and funding requirements could have a negative effect on our operating results and financial condition.
One important aspect of attracting and retaining qualified personnel is continuing to offer competitive employee retirement and health care benefits. The expenses we record for our pension and other postretirement benefit plans depend on factors such as changes in market interest rates, the value of plan assets, mortality assumptions, and healthcare trend rates. Significant unfavorable changes in these factors would increase our expenses and funding requirements. Expenses and funding requirements related to employer-funded healthcare benefits depend on laws and regulations, which could change, as well as healthcare cost inflation. An inability to control costs and funding requirements related to employee and retiree benefits could negatively impact our operating results and financial condition.
Strategic Transactions and Investments Risks
Failure to identify, manage, complete, and integrate strategic transactions may adversely affect our business or we may not achieve the expected benefits of these transactions.
As part of our strategy, we pursue strategic transactions, including acquisitions, joint ventures, investments, and other business opportunities and purchases of technology from third parties. In order to be successful, we must identify attractive transaction opportunities, effectively complete the transaction, and manage post-closing matters, such as integration of the acquired business or technology (including related personnel) and cooperation with our joint venture and other strategic partners. We may not be able to identify or complete beneficial transaction opportunities given the intense competition for them. Completing these transactions requires favorable environments and we may encounter difficulties in obtaining the necessary regulatory approvals in both domestic and foreign jurisdictions. Even if we successfully identify and complete such transactions, we may not achieve the expected benefits of such transactions and we may not be able to successfully address risks and uncertainties inherent in such transactions, including:
-
difficulties in integrating the purchased or new operations, technologies, products or services, retaining customers, and achieving the expected benefits of the transaction, such as sales increases, access to technologies, cost savings, and increases in geographic or product presence, in the desired time frames;
-
loss of key employees or difficulties integrating personnel;
-
legal and compliance issues;
-
unknown or undisclosed and unmitigated cyber risks to purchased systems, products, and services;
-
difficulties implementing and maintaining consistent standards, financial systems, internal and other controls, procedures, policies, and information systems;
-
difficulties maintaining relationships with our joint venture and other strategic partners (including as a result of such joint venture and other strategic partners having differing business objectives) and managing disputes with such joint venture and other strategic partners that may arise in connection with our relationships with them; and
-
difficulties in yielding the desired strategic or financial benefit from venture capital investments, including as a result of being a minority investor or macroeconomic conditions.
Strategic transactions and technology investments could result in debt, dilution, liabilities, increased interest expense, restructuring charges, and impairment and amortization expenses related to goodwill and identifiable intangible assets.
We own common stock in PTC Inc. and are exposed to the volatility, liquidity, and other risks inherent in holding that stock.
We own common stock of PTC Inc. (PTC), a Nasdaq-listed company. We present this investment on our Consolidated Balance Sheet at its fair value at the end of each reporting period. The fair value of our shares of PTC common stock (PTC Shares) is subject to fluctuation in the future due to the volatility of the stock market, changes in general economic conditions, and the performance of PTC. We recognize all changes in the fair value of the PTC Shares (whether realized or unrealized) as gains or losses in our Consolidated Statement of Operations. Accordingly, changes in the fair value of the PTC Shares can materially impact the earnings we report, which introduces volatility in our earnings that is not associated with the results of our business operations. In particular, significant declines in the fair value of the PTC Shares would produce significant declines in our reported earnings.
While there is an established trading market for shares of PTC common stock, there are limitations on our ability to dispose of some or all of the PTC Shares should we wish to reduce our investment. Until September 2023, we are subject to contractual restrictions on our ability to transfer the PTC Shares, subject to certain exceptions. In addition, we are subject to certain restrictions on our ability to transfer the PTC Shares under the securities laws. If we were forced to sell some or all of the PTC Shares in the market, there can be no assurance that we would be able to sell them at prices equivalent to the value of the PTC Shares that we have reported on our Consolidated Balance Sheet, and we may be forced to sell them at significantly lower prices.
Finally, our equity position in PTC is a minority position, which exposes us to further risk as we are not able to exert control over PTC.
Legal, Tax, and Regulatory Risks
New legislative and regulatory actions could adversely affect our business.
Legislative and regulatory action, including those related to corporate income taxes, the environment, materials, products, certification, and labeling, privacy, cybersecurity, or climate change, may be taken in the jurisdictions where we operate that may affect our business activities or may otherwise increase our costs to do business.
In October 2021, the Organization for Economic Cooperation and Development (OECD) and G20 Finance Ministers reached an agreement that, among other things, ensures that income earned in each jurisdiction that a multinational enterprise operates in is subject to a minimum corporate income tax rate of at least 15%. Discussions related to the formal implementation of this agreement, including within the tax law of each member jurisdiction including the United States, are ongoing. Enactment of this regulation in its current form would increase the amount of global corporate income tax paid by the Company.
We are increasingly required to comply with various environmental and other material, product, certification, and labeling laws and regulations (including the emerging European Union Eco-design for Sustainable Products Regulation). Our customers may also be required to comply with such legislative and regulatory requirements. These requirements could increase our costs and could potentially have an adverse effect on our ability to do business in certain jurisdictions. Changes in these requirements could impact demand for our hardware and software products, solutions, and services.
Compliance with privacy and cybersecurity regulations could increase our operating costs as part of our efforts to protect and safeguard our sensitive data, personal information, and IT infrastructure. Failure to maintain information privacy could result in legal liability or reputational harm.
In addition, increased public awareness and concern regarding climate change may result in more requirements or expectations that could mandate more restrictive or expansive standards, such as more prescriptive reporting of environmental, social, and governance metrics. There continues to be a lack of consistent climate change legislation and standards, which creates uncertainty. While the Company has adopted certain voluntary targets, environmental laws, regulations, or standards may be changed, accelerated, or adopted and impose significant operational restrictions and compliance requirements upon the Company, its products, or customers, which could negatively impact the Company’s business, capital expenditures, results of operations, and financial condition.
Claims from taxing authorities could have an adverse effect on our income tax expense and financial condition.
We conduct business in many countries, which requires us to interpret and comply with the income tax laws and rulings in each of those taxing jurisdictions. Due to the ambiguity of tax laws among those jurisdictions as well as the uncertainty of how underlying facts may be construed, our estimates of income tax liabilities may differ from actual payments or assessments. We must successfully defend any claims from taxing authorities to avoid an adverse effect on our operating results and financial condition.
Potential liabilities and costs from litigation (including asbestos claims and environmental remediation) could reduce our profitability.
Various lawsuits, claims, and proceedings have been or may be asserted against us relating to the conduct of our business or of our divested businesses, including those pertaining to the safety and security of the hardware and software products, solutions, and services we sell, employment, contract matters, and environmental remediation.
We have been named as a defendant in lawsuits alleging personal injury as a result of exposure to asbestos that was used in certain of our products many years ago. Our products may also be used in hazardous industrial activities, which could result in product liability claims. The uncertainties of litigation (including asbestos claims) and the uncertainties related to the collection of insurance proceeds make it difficult to predict the ultimate resolution of these lawsuits.
Our operations are subject to various environmental regulations concerning human health, the limitation and control of emissions and discharges into the air, ground, and water, the quality of air and bodies of water, and the handling, use, and disposal of specified substances. Our financial responsibility to clean up contaminated property or for natural resource damages may extend to previously owned or used properties, waterways and properties owned by unrelated companies or individuals, as well as properties that we currently own and use, regardless of whether the contamination is attributable to prior owners. We have been named as a potentially responsible party at cleanup sites and may be so named in the future, and the costs associated with these current and future sites may be significant.
We have, from time to time, divested certain of our businesses. In connection with these divestitures, certain lawsuits, claims, and proceedings may be instituted or asserted against us related to the period that we owned the businesses, either because we agreed to retain certain liabilities related to these periods or because such liabilities fall upon us by operation of law. In some instances, the divested business has assumed the liabilities; however, it is possible that we might be responsible for satisfying those liabilities if the divested business is unable to do so.
Item 1B. Unresolved Staff Comments
None.
Item 2. Properties
Our global headquarters in Milwaukee, Wisconsin, an owned facility, includes product development, sales, marketing, manufacturing, supply chain operations, finance, and other administrative and executive office functions. Most of our other facilities are leased and shared across our three operating segments. At September 30, 2022, the Company had approximately 50 manufacturing and distribution locations worldwide, disbursed evenly across our regions.
There are no major encumbrances (other than financing arrangements, which in the aggregate are not significant) on any of our properties or equipment. Our properties and equipment are in good operating condition and are adequate for our present needs. We do not anticipate difficulty in renewing existing leases as they expire or in finding alternative facilities.
Item 3. Legal Proceedings
The information required by this Item 3 is contained in Note 17 in the Consolidated Financial Statements within the section entitled Other Matters.
Item 4. Mine Safety Disclosures
Not applicable.
Item 4A. Information about our Executive Officers
The name, age, office and position held with the Company, and principal occupations and employment during the past five years of each of the executive officers of the Company as of November 1, 2022 are:
| Name, Office and Position, and Principal Occupations and Employment | Age | ||||
| Blake D. Moret — Chairman of the Board since January 1, 2018, and President and Chief Executive Officer since July 1, 2016 | 59 | ||||
| Nicholas C. Gangestad — Senior Vice President and Chief Financial Officer since March 1, 2021; previously Senior Vice President and Chief Financial Officer, 3M Company (consumer goods, health care and worker safety) | 58 | ||||
| Scott A. Genereux — Senior Vice President and Chief Revenue Officer since February 1, 2021; previously Executive Vice President of Worldwide Field Operations at Veritas (provider of information management services) (2017-2020), and Senior Vice President at Oracle (cloud applications and platform services) | 59 | ||||
| Rebecca W. House — Senior Vice President, Chief People (since July 2020) and Legal Officer and Secretary since January 3, 2017 | 49 | ||||
| Frank C. Kulaszewicz — Senior Vice President Lifecycle Services since October 1, 2020; previously Senior Vice President | 58 | ||||
| Veena M. Lakkundi — Senior Vice President, Strategy and Corporate Development since November 1, 2021; previously Senior Vice President, Strategy & Business Development (2020-2021), Vice President and General Manager, Industrial Adhesives and Tapes Division (2019-2020), Vice President and Chief Ethics & Compliance Officer, Compliance and Business Conduct, Legal Affairs (2017-2019) at 3M Company (consumer goods, health care and worker safety) | 53 | ||||
| John M. Miller — Vice President and Chief Intellectual Property Counsel | 55 | ||||
| Tessa M. Myers — Senior Vice President Intelligent Devices since June 6, 2022; previously Vice President and General Manager, Production Operations Management (from April 2021-June 2022), Vice President, Product Management (from October 2020-April 2021), and Regional President, North America | 46 | ||||
| Christopher Nardecchia — Senior Vice President and Chief Information Officer since November 1, 2017 | 60 | ||||
| Cyril P. Perducat — Senior Vice President (since June 1, 2021) and Chief Technology Officer since July 1, 2021; previously Executive Vice President, Schneider Electric (energy and automation digital solutions) | 53 | ||||
| Terry L. Riesterer — Vice President and Controller since November 29, 2019; previously Vice President, Corporate Financial Planning and Analysis and Corporate Development (from August 2016-November 2019) and Vice President, Global Finance Operations | 54 | ||||
| Brian A. Shepherd — Senior Vice President Software and Control since February 1, 2021; previously President, Production Software SFx (2019-2020) and Senior Vice President, Software Solutions (2017-2019) at Hexagon Manufacturing Intelligence (metrology and manufacturing solution specialist), and Executive Vice President, PTC Inc. (digital technology) | 57 | ||||
| Isaac R. Woods — Vice President and Treasurer since October 1, 2020; previously Director, Finance, Power Control Business (from March 2019-October 2020), Director, Capital Markets (from January 2017-March 2019), and Manager, Corporate Finance and Investor Relations | 37 | ||||
| Francis S. Wlodarczyk — Senior Vice President since June 1, 2022; previously Senior Vice President Intelligent Devices (from October 2020-June 2022) and Senior Vice President (from July 2018-October 2020) | 57 | ||||
There are no family relationships, as defined by applicable SEC rules, between any of the above executive officers and any other executive officer or director of the Company. No officer of the Company was selected pursuant to any arrangement or understanding between the officer and any person other than the Company. All executive officers are elected annually.
PART II
Item 5. Market for Registrant’s Common Equity, Related Stockholder Matters, and Issuer Purchases of Equity Securities
Market Information
Our common stock, $1 par value, is listed on the New York Stock Exchange and trades under the symbol “ROK”. On October 31, 2022, there were 12,652 shareowners of record of our common stock.
Company Purchases
The table below sets forth information with respect to purchases made by or on behalf of us of shares of our common stock during the three months ended September 30, 2022:
| Period | Total Number of Shares Purchased (1) | Average Price Paid Per Share (2) | Total Number of Shares Purchased as Part of Publicly Announced Plans or Programs | Maximum Approx. Dollar Value of Shares that May Yet Be Purchased Under the Plans or Programs (3) | ||||||||||||||||||||||
| July 1 – 31, 2022 | 193,368 | $ | 208.92 | 193,368 | $ | 1,286,459,441 | ||||||||||||||||||||
| August 1 – 31, 2022 | 73,880 | 249.01 | 73,880 | 1,268,062,555 | ||||||||||||||||||||||
| September 1 – 30, 2022 | 71,780 | 234.01 | 71,780 | 1,251,265,224 | ||||||||||||||||||||||
| Total | 339,028 | $ | 222.97 | 339,028 |
(1) All of the shares purchased during the quarter ended September 30, 2022, were acquired pursuant to the repurchase program described in (3) below.
(2) Average price paid per share includes brokerage commissions.
(3) On both July 24, 2019, and May 2, 2022, the Board of Directors authorized us to expend an additional $1.0 billion to repurchase shares of our common stock. Our repurchase program allows us to repurchase shares at management’s discretion or at our broker’s discretion pursuant to a share repurchase plan subject to price and volume parameters.
Performance Graph
The following information is not deemed to be “soliciting material” or to be “filed” with the SEC or subject to Regulation 14A or 14C under the Exchange Act or to the liabilities of Section 18 of the Exchange Act, and will not be deemed to be incorporated by reference into any filing of the Company under the Securities Act of 1933, as amended, or the Exchange Act, except to the extent the Company specifically incorporates it by reference into such a filing.
The following line graph compares the cumulative total shareowner return on our common stock against the cumulative total return of the S&P Composite-500 Stock Index (S&P 500 Index), the S&P 500 Selected GICS groups (Capital Goods, Software & Services, and Technology Hardware & Equipment), and the S&P Electrical Components & Equipment Index for the period of five fiscal years from October 1, 2017, to September 30, 2022, assuming in each case a fixed investment of $100 at the respective closing prices on September 30, 2017, and reinvestment of all dividends.
For performance shares awarded in fiscal 2021, we changed our relative performance benchmark group from the S&P 500 Index to the S&P 500 Selected GICS groups noted above in order to include companies that are more aligned with the Company's strategic direction. Accordingly, we will begin comparing our cumulative total shareowner return to the cumulative total return of both the S&P 500 Index and the S&P 500 Selected GICS groups (weighted based on respective GICS market capitalization) in the following graph. We have included the S&P Electrical Components & Equipment Index for this fiscal year only for comparative purposes to prior fiscal year graphs.
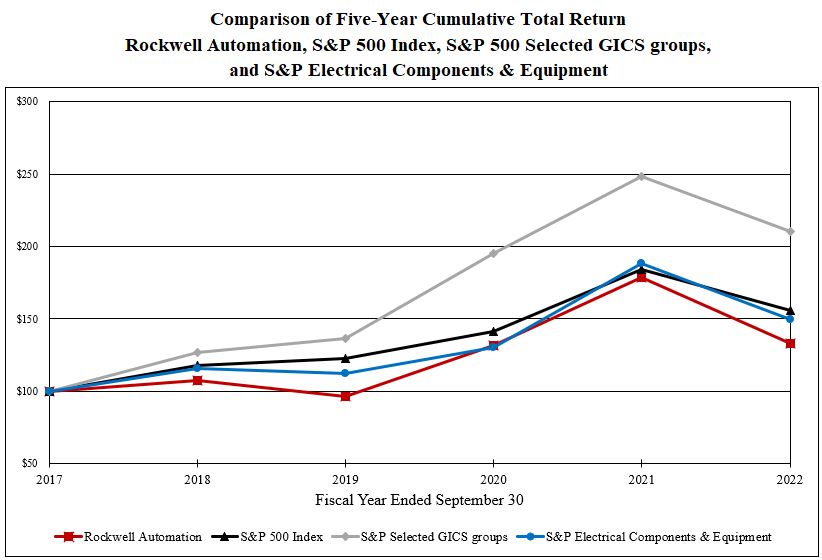
The cumulative total returns on Rockwell Automation common stock and each index as of September 30, 2017 through 2022 plotted in the above graph are as follows:
| 2017 | 2018 | 2019 | 2020 | 2021 | 2022 | ||||||||||||||||||||||||||||||
| Rockwell Automation (1) | $ | 100.00 | $ | 107.27 | $ | 96.48 | $ | 131.85 | $ | 178.54 | $ | 132.89 | |||||||||||||||||||||||
| S&P 500 Index | 100.00 | 117.90 | 122.90 | 141.50 | 183.93 | 155.43 | |||||||||||||||||||||||||||||
| S&P Selected GICS groups | 100.00 | 126.80 | 136.68 | 195.25 | 248.49 | 210.34 | |||||||||||||||||||||||||||||
| S&P Electrical Components & Equipment | 100.00 | 115.84 | 111.96 | 130.07 | 188.42 | 149.34 | |||||||||||||||||||||||||||||
| Cash dividends per common share | 3.04 | 3.51 | 3.88 | 4.08 | 4.28 | 4.48 |
(1) Includes the reinvestment of all dividends in our common stock.
Item 6. Reserved
Not required.
Item 7. Management’s Discussion and Analysis of Financial Condition and Results of Operations
Results of Operations
Non-GAAP Measures
The following discussion includes organic sales, total segment operating earnings and margin, Adjusted Income, Adjusted EPS, Adjusted Effective Tax Rate and free cash flow, which are non-GAAP measures. See Supplemental Sales Information for a reconciliation of reported sales to organic sales and a discussion of why we believe this non-GAAP measure is useful to investors. See Summary of Results of Operations for a reconciliation of Income before income taxes to total segment operating earnings and margin and a discussion of why we believe these non-GAAP measures are useful to investors. See Adjusted Income, Adjusted EPS, and Adjusted Effective Tax Rate Reconciliation for a reconciliation of Net income attributable to Rockwell Automation, diluted EPS, and effective tax rate to Adjusted Income, Adjusted EPS, and Adjusted Effective Tax Rate, respectively, and a discussion of why we believe these non-GAAP measures are useful to investors. See Financial Condition for a reconciliation of cash flows from operating activities to free cash flow and a discussion of why we believe this non-GAAP measure is useful to investors.
Overview
Rockwell Automation, Inc. is a global leader in industrial automation and digital transformation. We connect the imaginations of people with the potential of technology to expand what is humanly possible, making the world more productive and more sustainable. Overall demand for our hardware and software products, solutions, and services is driven by:
-
investments in manufacturing, including upgrades, modifications and expansions of existing facilities or production lines, and new facilities or production lines;
-
investments in basic materials production capacity, which may be related to commodity pricing levels;
-
our customers’ needs for faster time to market, operational productivity, asset management and reliability, and enterprise risk management;
-
our customers’ needs to continuously improve quality, safety, and sustainability;
-
industry factors that include our customers’ new product introductions, demand for our customers’ products or services, and the regulatory and competitive environments in which our customers operate;
-
levels of global industrial production and capacity utilization;
-
regional factors that include local political, social, regulatory, and economic circumstances; and
-
the spending patterns of our customers due to their annual budgeting processes and their working schedules.
Long-term Strategy
Our strategy is to bring The Connected Enterprise to life by integrating control and information across the enterprise. We deliver customer outcomes by combining advanced industrial automation with the latest information technology. Our growth and performance strategy seeks to:
-
achieve organic sales growth in excess of the automation market by expanding our served market and strengthening our competitive differentiation;
-
grow market share of our core platforms;
-
drive double digit growth in information solutions and connected services;
-
drive double digit growth in annual recurring revenue (ARR);
-
acquire companies that serve as catalysts to organic growth by increasing our information solutions and high-value services offerings and capabilities, expanding our global presence, or enhancing our process expertise;
-
enhance our market access by building our channel capability and partner network;
-
deploy human and financial resources to strengthen our technology leadership and our intellectual capital business model;
-
continuously improve quality and customer experience; and
-
drive annual cost productivity.
By implementing the above strategy, we seek to achieve our long-term financial goals, including above-market organic sales growth, increasing the portion of our total revenue that is recurring in nature, EPS growth above sales growth, return on invested capital in excess of 20 percent, and free cash flow equal to about 100 percent of Adjusted Income. We expect acquisitions to add a percentage point or more per year to long-term sales growth.
Our customers face the challenge of remaining globally cost competitive and automation can help them achieve their productivity and sustainability objectives. Our value proposition is to help our customers reduce time to market, lower total cost of ownership, improve asset utilization and manage enterprise risks.
Differentiation through Technology Innovation and Domain Expertise
Our integrated control and information architecture, with Logix at its core, is an important differentiator. We are the only automation provider that can support discrete, process, batch, safety, motion, and power control on the same hardware platform with the same software programming environment. Our integrated architecture is scalable with standard open communications protocols making it easier for customers to implement it more cost effectively. Our information software portfolio, combined with the software made available as a result of our strategic alliance with PTC, is the most comprehensive and flexible information platform in the industry. Through the combination of this technology and our domain expertise we help customers to achieve additional productivity benefits, such as reduced unplanned downtime, improved energy efficiency, higher quality, and increased throughput yield.
Intelligent motor control is one of our core competencies and an important aspect of an automation system. These hardware and software products and solutions enhance the availability, efficiency and safe operation of our customers’ critical and most energy-intensive plant assets. Our intelligent motor control offering can be integrated seamlessly with the Logix architecture.
Domain expertise refers to the industry and application knowledge required to deliver solutions and services that support customers through the entire life cycle of their automation investment. The combination of industry-specific domain expertise of our people with our innovative technologies enables us to help our customers solve their manufacturing and business challenges.
Global Expansion
As the manufacturing world continues to expand, we must be able to meet our customers’ needs around the world. Approximately 66 percent of our employees and less than half of our total sales are outside the U.S. We continue to expand our footprint in emerging markets.
As we expand in markets with considerable growth potential and shift our global footprint, we expect to continue to broaden the portfolio of hardware and software products, solutions, and services that we provide to our customers in these regions. We have made significant investments to globalize our manufacturing, product development and customer-facing resources in order to be closer to our customers throughout the world. The emerging markets of Asia Pacific, including China and India, Latin America, Central and Eastern Europe and Africa are projected to be the fastest growing over the long term, due to higher levels of infrastructure investment and the growing middle-class population. We believe that increased demand for consumer products in these markets will lead to manufacturing investment and provide us with additional growth opportunities in the future.
Enhanced Market Access
Over the past decade, our investments in technology and globalization have enabled us to expand our addressed market to over $100 billion. Our process initiative has been the most important contributor to this expansion and remains our largest growth opportunity.
Original Equipment Manufacturers (OEMs) represent another area of addressed market expansion and an important growth opportunity. To remain competitive, OEMs need to find the optimal balance of machine cost and performance while reducing their time to market. Our scalable integrated architecture and intelligent motor control offerin
Showing the first 8K of 100K characters. Open the full section
Item 7A. Quantitative and Qualitative Disclosures About Market Risk
We are exposed to market risk during the normal course of business from changes in foreign currency exchange rates and interest rates. We manage exposure to these risks through a combination of normal operating and financing activities as well as derivative financial instruments in the form of foreign currency forward exchange contracts. We sometimes use interest rate swap contracts to manage the balance of fixed and floating rate debt.
Foreign Currency Risk
We are exposed to foreign currency risks that arise from normal business operations. These risks include the translation of local currency balances of foreign subsidiaries, transaction gains and losses associated with intercompany loans with foreign subsidiaries, and transactions denominated in currencies other than a location’s functional currency. Our objective is to minimize our exposure to these risks through a combination of normal operating activities and the use of foreign currency forward exchange contracts. Contracts are usually denominated in currencies of major industrial countries. The fair value of our foreign currency forward exchange contracts is an asset of $120.1 million and a liability of $32.2 million at September 30, 2022. We enter into these contracts with major financial institutions that we believe to be creditworthy.
We do not enter into derivative financial instruments for speculative purposes. The strengthening of the U.S. dollar against foreign currencies has an unfavorable impact on our sales and results of operations. While future changes in foreign currency exchange rates are difficult to predict, our sales and profitability may be adversely affected if the U.S. dollar strengthens relative to current levels.
Certain of our locations have assets and liabilities denominated in currencies other than their functional currencies. We enter into foreign currency forward exchange contracts to offset the transaction gains or losses associated with some of these assets and liabilities. For such assets and liabilities without offsetting foreign currency forward exchange contracts, a 10 percent adverse change in the underlying foreign currency exchange rates would reduce our pre-tax income by approximately $35.1 million.
We record all derivatives on the balance sheet at fair value regardless of the purpose for holding them. The use of foreign currency forward exchange contracts allows us to manage transactional exposure to exchange rate fluctuations as the gains or losses incurred on these contracts will offset, in whole or in part, losses or gains on the underlying foreign currency exposure. Derivatives that are not designated as hedges for accounting purposes are adjusted to fair value through earnings. For derivatives that are hedges, depending on the nature of the hedge, changes in fair value are either offset by changes in the fair value of the hedged assets, liabilities, or firm commitments through earnings or recognized in other comprehensive loss until the hedged item is recognized in earnings. We recognize the ineffective portion of a derivative’s change in fair value in earnings immediately. There was no impact on earnings due to ineffective hedges in 2022, 2021, or 2020. A hypothetical 10 percent adverse change in underlying foreign currency exchange rates associated with the hedged exposures and related contracts would not be significant to our financial condition or results of operations.
Interest Rate Risk
In addition to existing cash balances and cash provided by normal operating activities, we use a combination of short-term and long-term debt to finance operations. We are exposed to interest rate risk on certain of these debt obligations.
Our Short-term debt as of September 30, 2022 and 2021, includes commercial paper borrowings of $317.0 million and $484.0 million, respectively, with weighted average interest rates of 3.03 percent and 0.18 percent, respectively, and weighted average maturity periods of 22 days and 90 days, respectively. Also included in Short-term debt as of September 30, 2022 and 2021, is $42.3 million and $23.5 million, respectively, of interest-bearing loans from SLB to Sensia, due in December 2022. We have issued, and anticipate continuing to issue, short-term commercial paper obligations as needed. Changes in market interest rates on commercial paper borrowings affect our results of operations. A hypothetical 50 basis point increase in average market interest rates related to our short-term debt would not be significant to our results of operations or financial condition.
We had outstanding fixed rate long-term and current portion of long-term debt obligations with a carrying value of $3,476.9 million at September 30, 2022, and $3,471.4 million at September 30, 2021. The fair value of this debt was approximately $3,074.5 million at September 30, 2022, and $3,881.6 million at September 30, 2021. The potential increase in fair value on such fixed-rate debt obligations from a hypothetical 50 basis point decrease in market interest rates would not be significant to our results of operations or financial condition. We currently have no plans to repurchase our outstanding fixed-rate instruments before their maturity and, therefore, fluctuations in market interest rates would not have an effect on our results of operations or shareowners’ equity.
Item 8. Financial Statements and Supplementary Data
CONSOLIDATED BALANCE SHEET
(in millions, except per share amounts)
| September 30, | |||||||||||
| 2022 | 2021 | ||||||||||
| ASSETS | |||||||||||
| Current assets | |||||||||||
| Cash and cash equivalents | $ | 490.7 | $ | 662.2 | |||||||
| Receivables | 1,736.7 | 1,424.5 | |||||||||
| Inventories | 1,054.2 | 798.1 | |||||||||
| Other current assets | 329.1 | 178.6 | |||||||||
| Total current assets | 3,610.7 | 3,063.4 | |||||||||
| Property, net of accumulated depreciation | 586.5 | 581.9 | |||||||||
| Operating lease right-of-use assets | 321.0 | 377.7 | |||||||||
| Goodwill | 3,524.0 | 3,625.9 | |||||||||
| Other intangible assets, net | 902.0 | 1,021.8 | |||||||||
| Deferred income taxes | 384.3 | 380.9 | |||||||||
| Long-term investments | 1,056.0 | 1,363.5 | |||||||||
| Other assets | 374.2 | 286.5 | |||||||||
| Total | $ | 10,758.7 | $ | 10,701.6 | |||||||
| LIABILITIES AND SHAREOWNERS’ EQUITY | |||||||||||
| Current liabilities | |||||||||||
| Short-term debt | $ | 359.3 | $ | 509.7 | |||||||
| Current portion of long-term debt | 609.1 | 6.8 | |||||||||
| Accounts payable | 1,028.0 | 889.8 | |||||||||
| Compensation and benefits | 292.7 | 408.0 | |||||||||
| Contract liabilities | 507.0 | 462.5 | |||||||||
| Customer returns, rebates and incentives | 373.1 | 237.8 | |||||||||
| Other current liabilities | 403.0 | 477.6 | |||||||||
| Total current liabilities | 3,572.2 | 2,992.2 | |||||||||
| Long-term debt | 2,867.8 | 3,464.6 | |||||||||
| Retirement benefits | 471.2 | 720.6 | |||||||||
| Operating lease liabilities | 263.5 | 313.6 | |||||||||
| Other liabilities | 567.3 | 516.5 | |||||||||
| Commitments and contingent liabilities (Note 17) | |||||||||||
| Shareowners’ equity | |||||||||||
| Common stock ($1.00 par value, shares issued: 181.4) | 181.4 | 181.4 | |||||||||
| Additional paid-in capital | 2,007.1 | 1,933.6 | |||||||||
| Retained earnings | 8,411.8 | 8,000.4 | |||||||||
| Accumulated other comprehensive loss | (917.5) | (1,017.1) | |||||||||
| Common stock in treasury, at cost (shares held: 66.2 and 65.4, respectively) | (6,957.2) | (6,708.7) | |||||||||
| Shareowners’ equity attributable to Rockwell Automation, Inc. | 2,725.6 | 2,389.6 | |||||||||
| Noncontrolling interests | 291.1 | 304.5 | |||||||||
| Total shareowners’ equity | 3,016.7 | 2,694.1 | |||||||||
| Total | $ | 10,758.7 | $ | 10,701.6 |
See Notes to Consolidated Financial Statements.
CONSOLIDATED STATEMENT OF OPERATIONS
(in millions, except per share amounts)
| Year Ended September 30, | |||||||||||||||||
| 2022 | 2021 | 2020 | |||||||||||||||
| Sales | |||||||||||||||||
| Products and solutions | $ | 6,993.4 | $ | 6,285.2 | $ | 5,663.6 | |||||||||||
| Services | 767.0 | 712.2 | 666.2 | ||||||||||||||
| 7,760.4 | 6,997.4 | 6,329.8 | |||||||||||||||
| Cost of sales | |||||||||||||||||
| Products and solutions | (4,173.4) | (3,638.7) | (3,305.9) | ||||||||||||||
| Services | (485.0) | (461.0) | (428.7) | ||||||||||||||
| (4,658.4) | (4,099.7) | (3,734.6) | |||||||||||||||
| Gross profit | 3,102.0 | 2,897.7 | 2,595.2 | ||||||||||||||
| Selling, general and administrative expenses | (1,766.7) | (1,680.0) | (1,479.8) | ||||||||||||||
| Change in fair value of investments | (136.9) | 397.4 | 153.9 | ||||||||||||||
| Other (expense) income (Note 15) | (1.6) | 5.7 | (29.7) | ||||||||||||||
| Interest expense | (123.2) | (94.6) | (103.5) | ||||||||||||||
| Income before income taxes | 1,073.6 | 1,526.2 | 1,136.1 | ||||||||||||||
| Income tax provision (Note 16) | (154.5) | (181.9) | (112.9) | ||||||||||||||
| Net income | 919.1 | 1,344.3 | 1,023.2 | ||||||||||||||
| Net loss attributable to noncontrolling interests | (13.1) | (13.8) | (0.2) | ||||||||||||||
| Net income attributable to Rockwell Automation, Inc. | $ | 932.2 | $ | 1,358.1 | $ | 1,023.4 | |||||||||||
| Earnings per share: | |||||||||||||||||
| Basic | $ | 8.02 | $ | 11.69 | $ | 8.83 | |||||||||||
| Diluted | $ | 7.97 | $ | 11.58 | $ | 8.77 | |||||||||||
| Weighted average outstanding shares: | |||||||||||||||||
| Basic | 115.9 | 116.0 | 115.8 | ||||||||||||||
| Diluted | 116.7 | 117.1 | 116.6 |
See Notes to Consolidated Financial Statements.
CONSOLIDATED STATEMENT OF COMPREHENSIVE INCOME
(in millions)
| Year Ended September 30, | |||||||||||||||||
| 2022 | 2021 | 2020 | |||||||||||||||
| Net income | $ | 919.1 | $ | 1,344.3 | $ | 1,023.2 | |||||||||||
| Other comprehensive income (loss) | |||||||||||||||||
| Pension and other postretirement benefit plan adjustments (net of tax expense of ($76.0), ($181.0), and ($3.4)) | 246.5 | 576.4 | 9.3 | ||||||||||||||
| Currency translation adjustments | (185.4) | 31.4 | 25.7 | ||||||||||||||
| Net change in cash flow hedges (net of tax (expense) benefit of ($14.3), $3.1, and $6.6) | 38.2 | (11.4) | (18.5) | ||||||||||||||
| Other comprehensive income | 99.3 | 596.4 | 16.5 | ||||||||||||||
| Comprehensive income | 1,018.4 | 1,940.7 | 1,039.7 | ||||||||||||||
| Comprehensive loss attributable to noncontrolling interests | (13.4) | (14.5) | (0.5) | ||||||||||||||
| Comprehensive income attributable to Rockwell Automation, Inc. | $ | 1,031.8 | $ | 1,955.2 | $ | 1,040.2 |
See Notes to Consolidated Financial Statements.
**CONSOLIDATED STATEMENT OF CASH FLOWS
Showing the first 8K of 220K characters. Open the full section
Item 9. Changes in and Disagreements with Accountants on Accounting and Financial Disclosure
None.
Item 9A. Controls and Procedures
Evaluation of Disclosure Controls and Procedures
Under the supervision and with the participation of our management, including the Chief Executive Officer and Chief Financial Officer, we have evaluated the effectiveness, as of September 30, 2022, of our disclosure controls and procedures, as defined in Rule 13a-15(e) and Rule 15d-15(e) under the Exchange Act. Based on that evaluation, our Chief Executive Officer and Chief Financial Officer have concluded that our disclosure controls and procedures were effective as of September 30, 2022.
Management’s Report on Internal Control Over Financial Reporting
We are responsible for establishing and maintaining adequate internal control over financial reporting, as defined in Rule 13a-15(f) under the Exchange Act. Our internal control over financial reporting is a process designed to provide reasonable assurance regarding the reliability of our financial reporting and the preparation of financial statements for external purposes in accordance with generally accepted accounting principles. Under the supervision and with the participation of our management, including the Chief Executive Officer and Chief Financial Officer, we evaluated the effectiveness of our internal control over financial reporting based on the framework in Internal Control - Integrated Framework (2013) issued by the Committee of Sponsoring Organizations of the Treadway Commission (COSO). Based on that evaluation, management has concluded that our internal control over financial reporting was effective as of September 30, 2022.
The effectiveness of our internal control over financial reporting, as of September 30, 2022, has been audited by Deloitte & Touche LLP, as stated in their report that is included on the previous page.
Because of its inherent limitations, internal control over financial reporting may not prevent or detect misstatements. Also, projections of any evaluation of effectiveness to future periods are subject to the risk that controls may become inadequate because of changes in conditions, or that the degree of compliance with the policies or procedures may deteriorate.
Changes in Internal Control Over Financial Reporting
There has not been any change in our internal control over financial reporting (as such term is defined in Rule 13a-15(f) under the Exchange Act) during the fiscal quarter to which this report relates that has materially affected, or is reasonably likely to materially affect, our internal control over financial reporting.
Item 9B. Other Information
None.
Item 9C. Disclosure Regarding Foreign Jurisdictions that Prevent Inspections
Not applicable.
PART III
Item 10. Directors, Executive Officers, and Corporate Governance
Other than the information below, the information required by this Item 10 is incorporated by reference to the sections entitled Corporate Governance, Election of Directors, and Stock Ownership Information in the Proxy Statement.
No nominee for director was selected pursuant to any arrangement or understanding between the nominee and any person other than the Company pursuant to which such person is or was to be selected as a director or nominee. See also the information about executive officers of the Company under Item 4A of Part I.
We have adopted a code of ethics that applies to our executive officers, including the principal executive officer, principal financial officer, and principal accounting officer. A copy of our Code of Conduct is posted on our Internet site at https://www.rockwellautomation.com under the “Investors” link. In the event that we amend or grant any waiver from a provision of the code of ethics that applies to the principal executive officer, principal financial officer, or principal accounting officer, and that requires disclosure under applicable SEC rules, we intend to disclose such amendment or waiver and the reasons therefor on our Internet site.
Item 11. Executive Compensation
The information required by this Item 11 is incorporated by reference to the sections entitled Executive Compensation, Election of Directors, Corporate Governance, and Compensation Committee Report in the Proxy Statement.
Item 12. Security Ownership of Certain Beneficial Owners and Management and Related Stockholder Matters
Other than the information below, the information required by this Item 12 is incorporated by reference to the section entitled Stock Ownership Information in the Proxy Statement.
The following table provides information, as of September 30, 2022, about our common stock that may be issued upon the exercise of options, warrants, and rights granted to employees, consultants, or directors under all of our existing equity compensation plans.
| Number of Securities to be issued upon Exercise of Outstanding Options, Warrants, and Rights | Weighted Average Exercise Price of Outstanding Options, Warrants, and Rights | Number of Securities Remaining Available for Future Issuance under Equity Compensation Plans (excluding Securities reflected in Column (a)) | |||||||||||||||||||||
| Plan Category | (a) | (b) | (c) | ||||||||||||||||||||
| Equity compensation plans approved by shareowners | 2,862,970 | (1) | $ | 186.72 | (2) | 10,106,671 | (3) | ||||||||||||||||
| Equity compensation plans not approved by shareowners | — | n/a | — | ||||||||||||||||||||
| Total | 2,862,970 | $ | 186.72 | 10,106,671 |
(1) Represents outstanding options, shares issuable in payment of outstanding performance shares (at maximum payout), and restricted stock units under our 2020 Long-Term Incentives Plan, 2012 Long-Term Incentives Plan, 2008 Long-Term Incentives Plan, and 2003 Directors Stock Plan.
(2) Represents the weighted average exercise price of outstanding options and does not take into account the performance shares and restricted stock units.
(3) Represents shares available for future issuance under our 2020 Long-Term Incentives Plan.
Item 13. Certain Relationships and Related Transactions, and Director Independence
The information required by this Item 13 is incorporated by reference to the sections entitled Corporate Governance and Election of Directors in the Proxy Statement.
Item 14. Principal Accountant Fees and Services
The information required by this Item 14 is incorporated by reference to the section entitled Audit Matters in the Proxy Statement.
PART IV
Item 15. Exhibits and Financial Statement Schedules
(a) Financial Statements, Financial Statement Schedule, and Exhibits
(1)Financial Statements (all financial statements listed below are those of the Company and its consolidated subsidiaries)
| Page | |||||
| Consolidated Balance Sheet, September 30, 2022 and 2021 | 42 | ||||
| Consolidated Statement of Operations, years ended September 30, 2022, 2021, and 2020 | 43 | ||||
| Consolidated Statement of Comprehensive Income, years ended September 30, 2022, 2021, and 2020 | 44 | ||||
| Consolidated Statement of Cash Flows, years ended September 30, 2022, 2021, and 2020 | 45 | ||||
| Consolidated Statement of Shareowners’ Equity, years ended September 30, 2022, 2021, and 2020 | 46 | ||||
| Notes to Consolidated Financial Statements | 47 | ||||
| Report of Independent Registered Public Accounting Firm (PCAOB ID No. 34) | 91 | ||||
(2)Financial Statement Schedule for the years ended September 30, 2022, 2021, and 2020
| Page | |||||
| Schedule II—Valuation and Qualifying Accounts | 101 |
Schedules not filed herewith are omitted because of the absence of conditions under which they are required or because the information called for is shown in the consolidated financial statements or notes thereto.
(3)Exhibits
| * | Management contract or compensatory plan or arrangement. |
Item 16. Form 10-K Summary
None.
SIGNATURES
Pursuant to the requirements of Section 13 or 15(d) of the Securities Exchange Act of 1934, the registrant has duly caused this report to be signed on its behalf by the undersigned, thereunto duly authorized.
| ROCKWELL AUTOMATION, INC. | ||||||||
| By | /s/ NICHOLAS C. GANGESTAD | |||||||
| Nicholas C. Gangestad | ||||||||
| Senior Vice President and | ||||||||
| Chief Financial Officer |
Dated: November 8, 2022
Pursuant to the requirements of the Securities Exchange Act of 1934, this report has been signed below on the 8th day of November 2022 by the following persons on behalf of the registrant and in the capacities indicated.
| By | /s/ NICHOLAS C. GANGESTAD | ||||
| Nicholas C. Gangestad | |||||
| Senior Vice President and | |||||
| Chief Financial Officer | |||||
| (Principal Financial Officer) | |||||
| By | /s/ TERRY L. RIESTERER | ||||
| Terry L. Riesterer | |||||
| Vice President and Controller | |||||
| (Principal Accounting Officer) | |||||
| Blake D. Moret* | |||||
| Chairman of the Board, President and | |||||
| Chief Executive Officer | |||||
| (Principal Executive Officer) | |||||
| and Director | |||||
| William P. Gipson* | |||||
| Director | |||||
| J. Phillip Holloman* | |||||
| Director | |||||
| Steven R. Kalmanson* | |||||
| Director | |||||
| James P. Keane* | |||||
| Director | |||||
| Pam Murphy* | |||||
| Director | |||||
| Donald R. Parfet * | |||||
| Director | |||||
| Lisa A. Payne* | |||||
| Director | |||||
| Thomas W. Rosamilia* | |||||
| Director | |||||
| Robert Soderbery* | |||||
| Director | |||||
| Patricia A. Watson* | |||||
| Director | |||||
| *By | /s/ REBECCA W. HOUSE | ||||
| Rebecca W. House, Attorney-in-fact** | |||||
| **By | authority of powers of attorney filed herewith |
SCHEDULE II
ROCKWELL AUTOMATION, INC.
VALUATION AND QUALIFYING ACCOUNTS
For the Years Ended September 30, 2022, 2021, and 2020
(in millions)
| Additions | ||||||||||||||||||||||||||||||||
| Balance at Beginning of Year | Charged to Costs and Expenses | Charged to Other Accounts | Deductions (2) | Balance at End of Year | ||||||||||||||||||||||||||||
| Description | ||||||||||||||||||||||||||||||||
| Year ended September 30, 2022 | ||||||||||||||||||||||||||||||||
| Allowance for doubtful accounts (1) | $ | 13.2 | $ | 4.7 | $ | — | $ | 4.8 | $ | 13.1 | ||||||||||||||||||||||
| Valuation allowance for deferred tax assets | 32.6 | 3.4 | 1.1 | 14.0 | 23.1 | |||||||||||||||||||||||||||
| Year ended September 30, 2021 | ||||||||||||||||||||||||||||||||
| Allowance for doubtful accounts (1) | $ | 15.2 | $ | 3.1 | $ | 0.4 | $ | 5.5 | $ | 13.2 | ||||||||||||||||||||||
| Valuation allowance for deferred tax assets | 58.0 | 5.4 | 1.5 | 32.3 | 32.6 | |||||||||||||||||||||||||||
| Year ended September 30, 2020 | ||||||||||||||||||||||||||||||||
| Allowance for doubtful accounts (1) | $ | 17.4 | $ | 7.0 | $ | 1.1 | $ | 10.3 | $ | 15.2 | ||||||||||||||||||||||
| Valuation allowance for deferred tax assets | 93.8 | 3.0 | 0.2 | 39.0 | 58.0 |
(1) Includes allowances for current and other long-term receivables.
(2) Consists of amounts written off for the allowance for doubtful accounts and adjustments resulting from our ability to utilize foreign tax credits, capital losses, or net operating loss carryforwards for which a valuation allowance had previously been recorded.
INDEX TO EXHIBITS*
| * | See Part IV, Item 15(a)(3) for exhibits incorporated by reference. | |||||||