 filings.tools
Rollins 10-K 2023-12-31
Filed 2024-02-15. 20 sections, 333K characters. Original on sec.gov · Markdown · JSON
Cover and table of contents
UNITED STATES
SECURITIES AND EXCHANGE COMMISSION
Washington, D.C. 20549
FORM 10-K
ANNUAL REPORT PURSUANT TO SECTION 13 OR 15(d) OF THE SECURITIES EXCHANGE ACT OF 1934
FOR THE FISCAL YEAR ENDED DECEMBER 31, 2023
Commission file No. 1-4422
ROLLINS, INC.
(Exact name of registrant as specified in its charter)
| Delaware | 51-0068479 | ||||
| (State or other jurisdiction of incorporation or organization) | (I.R.S. Employer Identification No.) | ||||
| 2170 Piedmont Road, N.E., Atlanta, Georgia | 30324 | ||||
| (Address of principal executive offices) | (Zip Code) |
Registrant’s telephone number, including area code: (404) 888-2000
Securities registered pursuant to Section 12(b) of the Act:
| Title of each class | Trading Symbol(s) | Name of each exchange on which registered | ||||||||||||
| Common Stock, $1 Par Value | ROL | The New York Stock Exchange |
Securities registered pursuant to section 12(g) of the Act: None.
Indicate by check mark if the registrant is a well-known seasoned issuer, as defined in Rule 405 of the Securities Act. Yes o No x
Indicate by check mark if the registrant is not required to file reports pursuant to Section 13 or Section 15(d) of the Act. Yes o No x
Indicate by check mark whether the Registrant (1) has filed all reports required to be filed by Section 13 or 15(d) of the Securities Exchange Act of 1934 during the preceding 12 months (or for such shorter period that the Registrant was required to file such reports), and (2) has been subject to such filing requirements for the past 90 days. Yes x No o
Indicate by check mark whether the registrant has submitted electronically every Interactive Data File required to be submitted pursuant to Rule 405 of Regulation S-T (§ 232.405 of this chapter) during the preceding 12 months (or for such shorter period that the registrant was required to submit such files). Yes x No o
Indicate by check mark whether the registrant is a large accelerated filer, an accelerated filer, a non-accelerated filer, a smaller reporting company, or an emerging growth company. See the definitions of “large accelerated filer,” “accelerated filer,” “smaller reporting company,” and emerging growth company in Rule 12b-2 of the Exchange Act.
| Large Accelerated Filer | x | Accelerated filer | o | ||||||||||||||
| Non-accelerated filer | o | Smaller reporting company | o | ||||||||||||||
| Emerging growth company | o |
If an emerging growth company, indicate by check mark if the registrant has elected not to use the extended transition period for complying with any new or revised financial accounting standards pursuant to Section 13(a) of the Exchange Act. o
Indicate by check mark whether the registrant has filed a report on and attestation to its management’s assessment of the effectiveness of its internal control over financial reporting under Section 404(b) of the Sarbanes-Oxley Act (15 U.S.C.7262(b)) by the registered public accounting firm that prepared or issued its audit report. Yes x No o
If securities are registered pursuant to Section 12(b) of the Act, indicate by check mark whether the financial statements of the registrant included in the filing reflect the correction of an error to previously issued financial statements. x
Indicate by check mark whether any of those error corrections are restatements that required a recovery analysis of incentive-based compensation received by any of the registrant’s executive officers during the relevant recovery period pursuant to §240.10D-1(b). o
Indicate by check mark whether the registrant is a shell company (as defined in Rule 12b-2 of the Exchange Act). Yes o No x
The aggregate market value of Rollins, Inc. Common Stock held by non-affiliates on June 30, 2023 was $10,383,238,055 based on the reported last sale price of common stock on June 30, 2023, which is the last business day of the registrant’s most recently completed second fiscal quarter.
Rollins, Inc. had 483,885,114 shares of Common Stock outstanding as of January 31, 2024.
DOCUMENTS INCORPORATED BY REFERENCE
Portions of the Proxy Statement for the 2024 Annual Meeting of Stockholders of Rollins, Inc. are incorporated by reference into Part III, Items 10-14.
Rollins, Inc.
Form 10-K
For the Year Ended December 31, 2023
Table of Contents
PART I
Item 1. Business
General Overview
Rollins, Inc. (“Rollins,” “we,” “us,” “our,” or the “Company”), is an international services company headquartered in Atlanta, Georgia. Through our family of leading brands, we provide essential pest and wildlife control services and protection against termite damage, rodents and insects to more than two million residential and commercial customers from more than 800 Company-owned and franchised locations in approximately 70 countries. Over the course of our lengthy operating history, we have garnered a reputation for providing great customer service. The contracted and recurring nature of our services provide us with visibility into a significant portion of our future revenue.
In 1964, brothers O. Wayne and John Rollins acquired Orkin Exterminating Company and in 1965 we changed our name from Rollins Broadcasting, Inc to Rollins, Inc. In 1968, Rollins began trading on the New York Stock Exchange under the symbol “ROL.” Since then, we have grown into a premier consumer and commercial services business with numerous industry leading brands including the world renowned Orkin, as well as HomeTeam Pest Defense, Clark Pest Control, Western Pest Services, Critter Control Wildlife, Northwest Exterminating, and Fox Pest Control, among others.
Pest control generally consists of assessing a customer's property for conditions that invite pests, tackling current infestations, and stopping the life cycle to prevent future invaders. Termite protection programs include liquid treatments, wet and dry foam applications, termite baiting and wood treatments. We operate under one reportable segment which contains our three service offerings:
-
Residential: Pest control services protecting residential properties from common pests, including rodents, insects and wildlife;
-
Commercial: Workplace pest control solutions for customers across diverse end markets such as healthcare, food service, logistics; and
-
Termite: Termite protection services and ancillary services for both residential and commercial customers.
Risk factors associated with our business are discussed in Item 1.A. "Risk Factors."
Our Strategic Objectives
We regularly assess the business environment, as well as our own strengths and opportunities, and have aligned around key strategic objectives that will help us to drive continued success for Rollins.
People First
We promote a people first mindset that prioritizes the well-being and development of the individual, as well as our collective team, in all aspects of our business. To provide our customers with the best customer experience, we must focus on cultivating our position as the employer of choice in our industry. This means not only investing in competitive wages and benefits, but also providing tools, training and development opportunities that drive a high level of employee engagement.
Customer Loyalty
We focus on creating the best customer experience that will enable a loyal customer base and in turn reduce the amount of churn across our customer base. This starts with our people and the interactions they have with our customers. By focusing on this key objective, we expect it to enable growth that will outpace our market growth.
Growth Mindset
A growth mindset helps us consider ways to improve and best position our business. Our focus here is to identify changes that may present both risks and opportunities to our business. We focus on evaluating changes in the markets we compete
in but also across other industries to continue to identify changing dynamics that may impact our people and our customers that may impact our position in the markets we compete.
Operational Efficiency
As a complement to our growth mindset, our dedication to continuous improvement and operational efficiency is another key tenet of our strategy and culture. We approach our operations from the perspective that everything we do can be improved upon. We are constantly striving to improve our service levels by optimizing our business model and modernizing our business.
We believe that our alignment around the key strategic areas will enable us to grow faster than our market, position our business for the future, and deliver value for all stakeholders, including our customers, our employees, our communities and our shareholders.
Our Competitive Strengths
Rollins is a leader in the global pest control market. We have established a portfolio of premier brands with extensive service capabilities across a deep operating network with a focus on our core pest control market. Our scale enables delivery of great service and provides a significant and reinforcing competitive advantage through (i) comprehensive capabilities to win new residential and commercial accounts, (ii) technology investments for operations optimization and enhanced customer experience, (iii) route density to manage variable costs, and (iv) financial flexibility to generate organic growth and pursue M&A.
Robust Operating Platform with Proprietary Technology
Our extensive footprint creates an efficient and scalable operating platform to facilitate exceptional customer service delivery, increased cross-selling opportunities, and cost efficiencies. We have strategically invested in proprietary routing and scheduling technologies to increase our competitive advantage, which includes real-time service tracking and customer internet communication to personalize the customer experience. The majority of our business runs our proprietary Branch Operating Support System (“BOSS”), which offers a back-end interface to facilitate service tracking and payment processing for technicians. BOSS also provides virtual route management tools to increase route efficiency across our network, reducing miles driven and associated costs while increasing customer retention through on-time and rapid response service.
Differentiated Employee Base and Service Delivery
Our employees are critical to delivering an outstanding customer experience, and we are highly focused on providing our team with best-in-class training and development opportunities. We operate the 27,000 square foot Rollins Learning Center training facility located in Atlanta, GA, which is a distance-learning and global broadcast facility with simulated environments and classrooms for training. In addition to in-person training, the Rollins Learning Center offers on-demand training sessions that employees can access from anywhere in the world that are produced at our on-site, state-of-the-art broadcast studio. Our unique programs contribute to our position as an employer of choice and have earned us recognition from Training magazine among the Top 125 U.S. Training Companies 17 times in the past 21 years. We were also recognized by the Top Workplaces program as a top workplace on both a national and local level. This marks the seventh consecutive year to be recognized in Atlanta. We continuously monitor co-worker engagement and customer loyalty.
Experienced Management Team
Our management team combines extensive business and consumer services experience with robust local pest control leadership. Consistent with our culture of attracting, developing and progressing talented individuals, our senior leadership team consists of a combination of long-term internal leaders and strategic hires from well-respected external platforms.
Our Chairman, Gary Rollins, is the son of Rollins, Inc. co-founder O. Wayne Rollins and has spent his entire career with the Company, serving as Chief Executive Officer (“CEO”) from 2001 to 2022. John Wilson, having served in various roles of increasing responsibility at the Company for over 26 years, serves as Vice Chairman of the Company.
Effective January 1, 2023, Jerry Gahlhoff, Jr. assumed the role of CEO and now serves as President and CEO. Mr. Gahlhoff joined the Company as part of the HomeTeam acquisition in 2008. Mr. Gahlhoff has extensive knowledge of the
Compa
Showing the first 8K of 85K characters. Open the full section
Item 2. Properties.
The Company’s administrative headquarters are owned by the Company, and are located at 2170 Piedmont Road, N.E., Atlanta, Georgia 30324. The Company owns or leases over 700 branch offices and operating facilities used in its business as well as the Rollins Training Center located in Atlanta, Georgia, and the Pacific Division Administration and Training Center in Riverside, California. None of the branch offices, individually considered, represents a materially important physical property of the Company. The facilities are suitable and adequate to meet the current and reasonably anticipated future needs of the Company.
Item 3. Legal Proceedings.
In the normal course of business, the Company and its subsidiaries are involved in, and will continue to be involved in, various claims, arbitrations, contractual disputes, investigations, litigation, environmental and tax and other regulatory matters relating to, and arising out of, our businesses and our operations. These matters may involve, but are not limited to, allegations that our services or vehicles caused damage or injury, claims that our services did not achieve the desired results, claims related to acquisitions and allegations by federal, state or local authorities, including taxing authorities, of violations of regulations or statutes. In addition, we are parties to employment-related cases and claims from time to time, which may include claims on a representative or class action basis alleging wage and hour law violations or claims related to the operation of our retirement benefit plans. We are also involved from time to time in certain environmental and tax matters primarily arising in the normal course of business. We evaluate pending and threatened claims and establish loss contingency reserves based upon outcomes we currently believe to be probable and reasonably estimable.
The Company retains, up to specified limits, certain risks related to general liability, workers’ compensation and auto liability. The estimated costs of existing and future claims under the retained loss program are accrued based upon historical trends as incidents occur, whether reported or unreported (although actual settlement of the claims may not be made until future periods) and may be subsequently revised based on developments relating to such claims. The Company contracts with an independent third party to provide the Company an estimated liability based upon historical claims information. The actuarial study is a major consideration in establishing the reserve, along with management’s knowledge of changes in business practice and existing claims compared to current balances. Management’s judgment is inherently subjective as a number of factors are outside management’s knowledge and control. Additionally, historical information is not always an accurate indication of future events. The accruals and reserves we hold are based on estimates that involve a degree of judgment and are inherently variable and could be overestimated or insufficient. If actual claims exceed our estimates, our operating results could be materially affected, and our ability to take timely corrective actions to limit future costs may be limited.
Item 103 of SEC Regulation S-K requires disclosure of certain environmental legal proceedings if the proceeding reasonably involves potential monetary sanctions of $300,000 or more. The Company has received a notice of alleged violations and information requests from local governmental authorities in California for our Orkin and Clark Pest Control operations and is currently working with several local governments regarding compliance with environmental regulations governing the management of hazardous waste and pesticide disposal. The investigation appears to be part of a broader effort to investigate waste handling and disposal processes of a number of industries. While we are unable to predict the outcome of this investigation, we do not believe the outcome will have a material effect on our results of operations, financial condition, or cash flows.
Management does not believe that any pending claim, proceeding or litigation, regulatory action or investigation, either alone or in the aggregate, will have a material adverse effect on the Company’s financial position, results of operations or liquidity; however, it is possible that an unfavorable outcome of some or all of the matters could result in a charge that might be material to the results of an individual quarter or year.
Item 4. Mine Safety Disclosures.
Not applicable.
PART II
Item 5. Market for Registrant’s Common Equity, Related Stockholder Matters and Issuer Purchases of Equity Securities.
Market Information, Holders, and Dividends
The common stock of the Company is listed on the New York Stock Exchange and is traded on the Philadelphia, Chicago and Boston Exchanges under the symbol ROL.
As of January 31, 2024, there were 8,118 holders of record of the Company’s common stock. However, a large number of our shareholders hold their shares in “street name” in brokerage accounts and, therefore, do not appear on the shareholder list maintained by our transfer agent.
Dividends will be payable only when, and if, declared by our Board and will be subject to our ongoing ability to generate sufficient income and free cash flow, any future capital needs and other contingencies. The Company expects to continue to pay cash dividends to the common stockholders, subject to the earnings and financial condition of the Company and other relevant factors.
Issuer Purchases of Equity Securities
The Company did not repurchase shares on the open market during the quarter ended December 31, 2023.
The following table presents the Company's share repurchase activity for the period from October 1, 2023 to December 31, 2023.
| Period | Total number of shares purchased (1) | Weighted- average price paid per share | Total number of shares purchased as part of publicly announced repurchases (2) | Maximum number of shares that may yet be purchased under the repurchase plan (2) | ||||||||||||||||||||||
| October 1 to 31, 2023 | 1,213 | $ | 36.01 | — | 11,415,625 | |||||||||||||||||||||
| November 1 to 30, 2023 | 1,293 | 43.02 | — | 11,415,625 | ||||||||||||||||||||||
| December 1 to 31, 2023 | — | — | — | 11,415,625 | ||||||||||||||||||||||
| Total | 2,506 | $ | 39.63 | — | 11,415,625 |
(1)Includes shares withheld by the Company in connection with tax withholding obligations of its employees upon vesting of such employees’ equity awards.
(2)The Company has a share repurchase plan, adopted in 2012, to repurchase up to 16.9 million shares of the Company’s common stock. As of December 31, 2023, the Company has a remaining authorization to repurchase 11.4 million shares of the Company's common stock under this program. The repurchase plan has no expiration date.
Performance Graph
The following graph sets forth a five-year comparison of the cumulative total stockholder return based on the performance of the stock of the Company as compared with both a broad equity market index and an industry index. The indices included in the following graph are the S&P 500 Index and the S&P 500 Commercial Services & Supplies Index.

*$100 invested on 12/31/18 in stock or index, including reinvestment of dividends.
Fiscal year ending December 31.
Copyright© 2023 Standard & Poor's, a division of S&P Global. All rights reserved.
| 2018 | 2019 | 2020 | 2021 | 2022 | 2023 | ||||||||||||||||||||||||||||||
| Rollins Inc. | $ | 100.00 | $ | 93.03 | $ | 166.06 | $ | 147.06 | $ | 158.95 | $ | 192.61 | |||||||||||||||||||||||
| S&P 500 | 100.00 | 131.49 | 155.68 | 200.37 | 164.08 | 207.21 | |||||||||||||||||||||||||||||
| S&P 500 Commercial Services & Supplies | 100.00 | 140.15 | 169.56 | 223.20 | 211.29 | 271.25 |
Item 6. [Reserved]
Item 7. Management’s Discussion and Analysis of Financial Condition and Results of Operations.
Presentation
This discussion should be read in conjunction with our audited financial statements and related notes included elsewhere in this document. Discussions of 2021 items and year-to-year comparisons of 2022 and 2021 that are not included in this Form 10-K can be found in “Management’s Discussion and Analysis of Financial Condition and Results of Operations” in Part II, Item 7 of our Annual Report on Form 10-K for the year ended December 31, 2022. The following discussion (as well as other discussions in this document) contains forward-looking statements. Please see “Cautionary Statement Regarding Forward-Looking Statements” and "Risk Factors" for a discussion of uncertainties, risks and assumptions associated with these statements.
The Company
Rollins, Inc. (“Rollins,” “we,” “us,” “our,” or the “Company”), is an international services company headquartered in Atlanta, Georgia that provides pest and termite control services to both residential and commercial customers through its wholly-owned subsidiaries and independent franchises in the United States, Canada, Australia, Europe, and Asia with international franchises in Canada, Central and South America, the Caribbean, Europe, the Middle East, Asia, Africa, and Australia. Our pest and termite control services are performed pursuant to terms of contracts that specify the pricing arrangement with the customer. The Company operates as one reportable segment and the results of operations and its financial condition are not reliant upon any single customer.
Strategic Update
We are focused on continuous improvement throughout the business. During 2023, we made significant strides in all four pillars of our strategic objectives: 1) people first 2) customer loyalty 3) growth mindset and 4) operational efficiency.
People First
During 2023, we focused on the safety of our people. We are continuously improving our safety culture and monitoring our measurable safety goals. For example, throughout the year we made considerable progress with respect to the implementation and adoption of our driver safety application, which monitors driver behaviors once a vehicle is in motion. Our average driver safety score for drivers that we monitor showed improvement in 2023. We also executed a restructuring program during the year to modernize our workforce and enable us to make more strategic improvements in our support functions. We remain committed to developing exceptional talent and investing in our teams, including a focus on strategic hiring in both support functions, as well as the customer-facing side of our business.
Customer Loyalty
We remain committed to providing our customers with the best customer experience. Effective sales and service staffing levels helped us to capitalize on continued demand and deliver solid results for the year, with organic revenues* growing by 8.2% compared to 2022.
Growth Mindset
2023 marked a record year in terms of revenues, totaling $3.1 billion, an increase of 14.0% over 2022, with acquisition revenues* growing by 5.9% compared to 2022. We completed the acquisition of Fox Pest Control ("Fox"), one of the largest acquisitions in the Company's history, for $339.5 million. We also completed 23 additional acquisitions in 2023, driving inorganic growth at several of our brands.
Operational Efficiency
We saw healthy margins in 2023, with gross margin improving 70 basis points to 52.2% in 2023 compared to 51.5% in 2022. Operating margin was 19.0% of revenue, an increase of 70 basis points over 2022 and adjusted operating income margin* at 19.7%, an increase of 140 basis points over the prior year.
*Amounts are non-GAAP financial measures. See the schedules below for definitions and a discussion of non-GAAP financial metrics, including a reconciliation to the most directly comparable GAAP measure.
Impact of Economic Trends
The continued disruption in economic markets due to high inflation, increases in interest rates, business interruptions due to natural disasters and changes in weather patterns, employee shortages, and supply chain issues, all pose challenges which may adversely affect our future performance. The Company continues to execute various strategies previously implemented to help mitigate the impact of these economic disruptors.
However, the Company cannot reasonably estimate whether these strategies will help mitigate the impact of these economic disruptors in the future.
The Company’s consolidated financial statements reflect estimates and assumptions made by management that affect the reported amounts of assets and liabilities and related disclosures as of the date of the condensed consolidated financial statements. The Company considered the impact of economic trends on the assumptions and estimates used in preparing the consolidated financial statements. In the opinion of management, all material adjustments necessary for a fair presentation of the Company’s financial results for the year have been made. These adjustments are of a normal recurring nature but are complicated by the continued uncertainty surrounding these macro economic trends. The severity, magnitude and duration of certain economic trends continue to be uncertain and are difficult to predict. Therefore, our accounting estimates and assumptions may change over time in response to economic trends and may change materially in future periods.
The extent to which increasing interest rates, inflation and other economic trends will continue to impact the Company’s business, financial condition and results of operations is uncertain. Therefore, we cannot reasonably estimate the full future impacts of these matters at this time.
Results of Operations—2023 Compared to 2022
| Twelve Months Ended December 31, | ||||||||||||||||||||
| Variance | ||||||||||||||||||||
| (in thousands, except per share data and margins) | 2023 | 2022 | $ | % | ||||||||||||||||
| GAAP Metrics | ||||||||||||||||||||
| Revenues | $ | 3,073,278 | $ | 2,695,823 | $ | 377,455 | 14.0 | % | ||||||||||||
| Gross profit (1) | $ | 1,603,407 | $ | 1,387,424 | $ | 215,983 | 15.6 | % | ||||||||||||
| Gross profit margin (1) | 52.2 | % | 51.5 | % | 70 bps | |||||||||||||||
| Operating income | $ | 583,226 | $ | 493,388 | $ | 89,838 | 18.2 | % | ||||||||||||
| Operating income margin | 19.0 | % | 18.3 | % | 70 bps | |||||||||||||||
| Net income | $ | 434,957 | $ | 368,599 | $ | 66,358 | 18.0 | % | ||||||||||||
| EPS | $ | 0.89 | $ | 0.75 | $ | 0.14 | 18.7 | % | ||||||||||||
| Operating cash flow | $ | 528,366 | $ | 465,930 | $ | 62,436 | 13.4 | % | ||||||||||||
| Non-GAAP Metrics | ||||||||||||||||||||
| Adjusted operating income (2) | $ | 604,217 | $ | 493,388 | $ | 110,829 | 22.5 | % | ||||||||||||
| Adjusted operating margin (2) | 19.7 | % | 18.3 | % | 140 bps | |||||||||||||||
| Adjusted net income (2) | $ | 439,080 | $ | 368,599 | $ | 70,481 | 19.1 | % | ||||||||||||
| Adjusted EPS (2) | $ | 0.90 | $ | 0.75 | $ | 0.15 | 20.0 | % | ||||||||||||
| Adjusted EBITDA (2) | $ | 697,958 | $ | 592,881 | $ | 105,077 | 17.7 | % | ||||||||||||
| Adjusted EBITDA margin (2) | 22.7 | % | 22.0 | % | 70 bps | |||||||||||||||
| Free cash flow (2) | $ | 495,901 | $ | 435,302 | $ | 60,599 | 13.9 | % |
(1) Exclusive of depreciation and amortization
(2) Amounts are non-GAAP financial measures. See "Non-GAAP Financial Measures" below for a discussion of non-GAAP financial metrics including a reconciliation to the most directly comparable GAAP measure.
Revenues
The following presents a summary of revenues by product and service offering and revenues by geography:
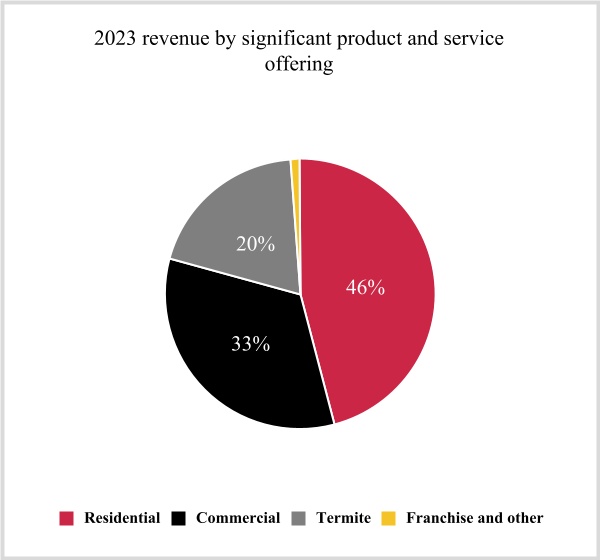
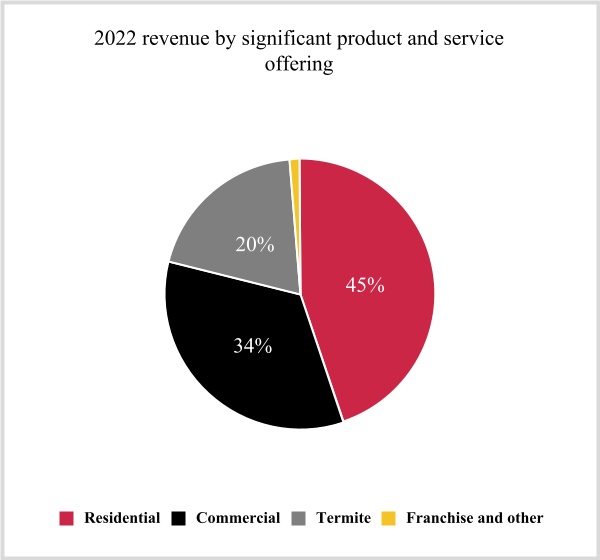
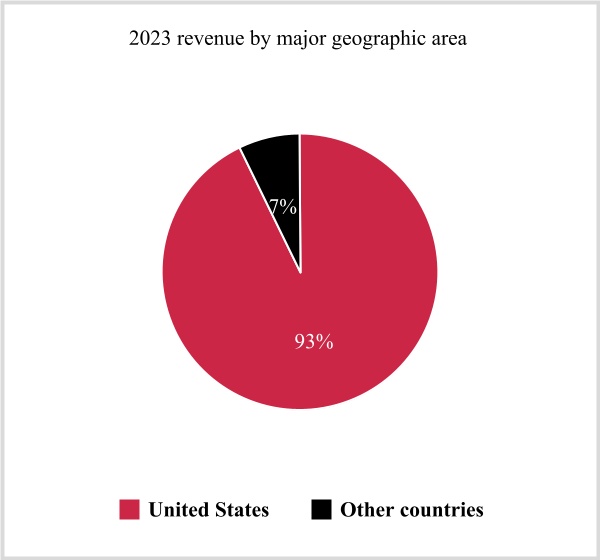
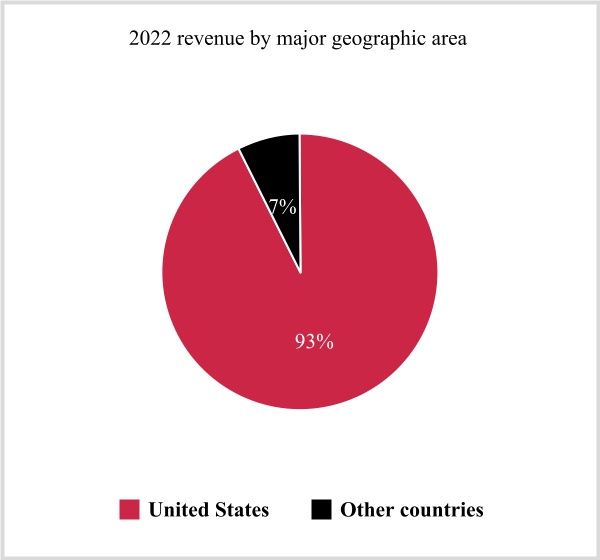
Revenues for the year ended December 31, 2023 were $3.1 billion, an increase of $377.5 million, or 14.0%, from 2022 revenues of $2.7 billion. The increase in revenues was driven by demand from our customers that remained strong throughout the year across all major service offerings. Comparing 2023 to 2022, organic revenue* growth was 8.2% while acquisitions drove 5.9% of total growth. Looking at the service offerings, residential pest control revenue increased approximately 17%, commercial pest control revenue increased approximately 11% and termite and ancillary services grew approximately 13% including both organic and acquisition-related growth in each area. Organic revenue* growth was strong across our service offerings, growing over 6% in residential, approximately 10% in commercial, and over 10% in termite and ancillary activity. The Company’s foreign operations accounted for approximately 7% of total revenues for the years ended December 31, 2023 and 2022.
We continue to maintain a very healthy balance sheet that positions us well to continue to invest in growth initiatives across our business as we enter 2024, From an organic perspective, we are proactively managing pricing across our portfolio. Additionally, while lead generation and the overall demand environment are healthy to start the new year, we continue to navigate the negative impact of a colder January in certain parts of our business.
*Amounts are non-GAAP financial measures. See the schedules below for definitions and a discussion of non-GAAP financial metrics, including a reconciliation to the most directly comparable GAAP measure.
Gross Profit
Gross profit for the year ended December 31, 2023 was $1.6 billion, an increase of $216.0 million, or 15.6%, compared to $1.4 billion for the year ended December 31, 2022. Gross margin improved 70 basis points to 52.2% in 2023 compared to 51.5% in 2022. The acquisition of Fox drove 20 basis points of leverage in 2023. Excluding this, gross margin improved 50 basis points as pricing more than offset increases in our cost structure. Looking specifically at people related costs, materials and supplies, and fleet, which comprise 87% of total cost of services, we saw an improvement of 90 basis points associated with leverage in these categories, as pricing more than offset inflationary pressures. Insurance and claims experience decreased gross margins in 2023 by 10 basis points.
We expect the normal seasonality to drive lower gross profit margins in the first and fourth quarters of 2024 relative to the second and third quarters on the lower level of business activity.
Sales, General and Administrative
For the twelve months ended December 31, 2023, sales, general and administrative (SG&A) expenses increased $112.5 million, or 14.0%, compared to the twelve months ended December 31, 2022. The increase is driven by people-related costs, advertising and selling expenses associated with growth initiatives. As a percentage of revenue, SG&A was consistent at 29.8% in 2023 and 2022, as we continue to manage our cost structure while investing in growth initiatives.
Restructuring Costs
During the twelve months ended December 31, 2023, we executed a restructuring program to modernize our workforce. This effort resulted in expense of approximately $5.2 million in the year. The large majority of the costs incurred are related to severance-related costs for employees who were terminated as part of this effort. The changes were primarily across corporate-related functions and will enable us to make more strategic improvements in our support functions.
Depreciation and Amortization
For the twelve months ended December 31, 2023, depreciation and amortization increased $8.4 million, or 9.2%, compared to the twelve months ended December 31, 2022. The increase was due to higher amortization of intangible assets from acquisitions, most notably Fox, offset by lower depreciation of operating equipment and internal-use software.
Operating Income
For the twelve months ended December 31, 2023, operating income increased $89.8 million or 18.2% compared to the prior year. As a percentage of revenue, operating income increased to 19.0% from 18.3% in the prior year. The improvement in operating income as a percentage of sales is primarily driven by the improvement in gross profit discussed previously.
We expect the first and fourth quarters to represent our lowest level for margins and profitability due primarily to the lower level of volume generated in those quarters due to the impact of seasonality.
Interest Expense, Net
During the twelve months ended December 31, 2023, interest expense, net increased $16.4 million compared to the prior year, due to the increase in the average debt balance associated primarily with the acquisition of Fox and the share repurchase completed during 2023.
Debt levels and corresponding interest expense are expected to remain elevated in the first half of 2024 due primarily to the higher level of debt associated with the acquisition of Fox and the share repurchases during 2023.
Other Income, Net
During the twelve months ended December 31, 2023, other income, net increased $13.9 million primarily due to the Company recognizing a $15.5 million gain on the sale of certain businesses during 2023, offset by lower gains from asset sales.
Income Taxes
The Company’s effective tax rate was 25.8% in 2023 compared to 26.1% in 2022. The 2023 rate was favorably impacted by lower state income taxes and federal tax credits compared to 2022.
Non-GAAP Financial Measures
Reconciliation of GAAP and non-GAAP Financial Measures
The Company has used the non-GAAP financial measures of organic revenues, adjusted operating income, adjusted operating margin, adjusted net income, and adjusted earnings per share (“EPS”), earnings before interest, taxes, depreciation and amortization (“EBITDA”), EBITDA margin, adjusted EBITDA, adjusted EBITDA margin, and free cash flow in this Form 10-K. Organic revenue is calculated as revenue less the revenue from acquisitions completed within the prior 12 months and excluding the revenue from divested businesses. Adjusted operating income and adjusted operating margin are calculated by adding back to the GAAP measures those expenses resulting from the amortization of certain intangible assets and adjustments to the fair value of contingent consideration resulting from the acquisition of Fox Pest Control and restructuring costs related to restructuring and workforce reduction plans. Adjusted EBITDA and adjusted EBITDA margin are calculated by adding back to net income interest, taxes, depreciation and amortization expense those expenses resulting from the adjustments to the fair value of contingent consideration resulting from the acquisition of Fox Pest Control, restructuring costs related to restructuring and workforce reduction plans, and gains on the sale of businesses. Adjusted net income and adjusted EPS are calculated by adding back those acquisition-related expenses, restructuring costs, and gains on the sale of businesses to the GAAP measures and by further subtracting the tax impact of those expenses and/or gains. Free cash flow is calculated by subtracting capital expenditures from cash provided by operating activities. These measures should not be considered in isolation or as a substitute for revenues, net income, earnings per share or other performance measures prepared in accordance with GAAP.
Management uses adjusted operating income, adjusted operating margin, adjusted net income, adjusted EPS, EBITDA, EBITDA margin, adjusted EBITDA, adjusted EBITDA margin, and free cash flow as measures of operating performance because this measure allows the Company to compare performance consistently over various periods. Management also uses organic revenues to compare revenues over various periods excluding the impact of acquisitions and divestitures. Management uses free cash flow to demonstrate the Company’s ability to maintain its asset base and generate future cash flows from operations. An analysis of any non-GAAP financial measure should be used in conjunction with results presented in accordance with GAAP.
A non-GAAP financial measure is a numerical measure of financial performance, financial position, or cash flows that either 1) excludes amounts, or is subject to adjustments that have the effect of excluding amounts, that are included in the most directly comparable measure calculated and presented in accordance with GAAP in the statement of operations, balance sheet or statement of cash flows, or 2) includes amounts, or is subject to adjustments that have the effect of including amounts, that are excluded from the most directly comparable measure so calculated and presented.
Set forth below is a reconciliation of the non-GAAP financial measures contained in this report with their most directly comparable GAAP measures (in thousands, except per share data and margins).
| Twelve Months Ended December 31, | Variance | |||||||||||||||||||||||||
| 2023 | 2022 (1) | $ | % | |||||||||||||||||||||||
| Reconciliation of Revenues to Organic Revenues | ||||||||||||||||||||||||||
| Revenues | $ | 3,073,278 | $ | 2,695,823 | 377,455 | 14.0 | ||||||||||||||||||||
| Revenues from acquisitions | (159,919) | — | (159,919) | 5.9 | ||||||||||||||||||||||
| Revenues of divestitures | — | (1,474) | 1,474 | (0.1) | ||||||||||||||||||||||
| Organic revenues | $ | 2,913,359 | $ | 2,694,349 | 219,010 | 8.2 | ||||||||||||||||||||
| Reconciliation of Residential Revenues to Organic Residential Revenues | ||||||||||||||||||||||||||
| Residential revenues | $ | 1,409,872 | $ | 1,207,089 | 202,783 | 16.8 | ||||||||||||||||||||
| Residential revenues from acquisitions | (129,476) | — | (129,476) | 10.7 | ||||||||||||||||||||||
| Residential revenues of divestitures | — | (958) | 958 | (0.1) | ||||||||||||||||||||||
| Residential organic revenues | $ | 1,280,396 | $ | 1,206,131 | 74,265 | 6.2 | ||||||||||||||||||||
| Reconciliation of Commercial Revenues to Organic Commercial Revenues | ||||||||||||||||||||||||||
| Commercial revenues | $ | 1,024,176 | $ | 920,625 | 103,551 | 11.2 | ||||||||||||||||||||
| Commercial revenues from acquisitions | (15,105) | — | (15,105) | 1.6 | ||||||||||||||||||||||
| Commercial revenues of divestitures | — | (516) | 516 | (0.1) | ||||||||||||||||||||||
| Commercial organic revenues | $ | 1,009,071 | $ | 920,109 | 88,962 | 9.7 | ||||||||||||||||||||
| Reconciliation of Termite and Ancillary Revenues to Organic Termite and Ancillary Revenues | ||||||||||||||||||||||||||
| Termite and ancillary revenues | $ | 605,533 | $ | 535,494 | 70,039 | 13.1 | ||||||||||||||||||||
| Termite and ancillary revenues from acquisitions | (15,338) | — | (15,338) | 2.9 | ||||||||||||||||||||||
| Termite and ancillary organic revenues | $ | 590,195 | $ | 535,494 | 54,701 | 10.2 |
(1) Subsequent to the issuance of the Company's 2022 financial statements, management determined that certain immaterial reclassifications within the product and service offerings were required for the years ended December 31, 2022 and 2021. Revenues classified by significant product and service offerings for the years ended December 31, 2022 and 2021 have been restated from the amounts previously reported to correct the classification of such revenues. There was no impact on our consolidated statements of income, financial position, or cash flows.
| Twelve Months Ended December 31, | Variance | |||||||||||||||||||||||||
| 2023 | 2022 | $ | % | |||||||||||||||||||||||
| Reconciliation of Operating Income to Adjusted Operating Income and Adjusted Operating Income Margin | ||||||||||||||||||||||||||
| Operating income | $ | 583,226 | $ | 493,388 | ||||||||||||||||||||||
| Fox acquisition-related expenses (1) | 15,795 | — | ||||||||||||||||||||||||
| Restructuring costs (2) | 5,196 | — | ||||||||||||||||||||||||
| Adjusted operating income | $ | 604,217 | $ | 493,388 | 110,829 | 22.5 | ||||||||||||||||||||
| Revenues | $ | 3,073,278 | $ | 2,695,823 | ||||||||||||||||||||||
| Operating income margin | 19.0 | % | 18.3 | % | ||||||||||||||||||||||
| Adjusted operating margin | 19.7 | % | 18.3 | % | ||||||||||||||||||||||
| Reconciliation of Net Income to Adjusted Net Income and Adjusted EPS | ||||||||||||||||||||||||||
| Net income | $ | 434,957 | $ | 368,599 | ||||||||||||||||||||||
| Fox acquisition-related expenses (1) | 15,795 | — | ||||||||||||||||||||||||
| Restructuring costs (2) | 5,196 | — | ||||||||||||||||||||||||
| Gain on sale of businesses (3) | (15,450) | — | ||||||||||||||||||||||||
| Tax impact of adjustments (4) | (1,418) | — | ||||||||||||||||||||||||
| Adjusted net income | $ | 439,080 | $ | 368,599 | 70,481 | 19.1 | ||||||||||||||||||||
| EPS - basic and diluted | $ | 0.89 | $ | 0.75 | ||||||||||||||||||||||
| Fox acquisition-related expenses (1) | 0.03 | — | ||||||||||||||||||||||||
| Restructuring costs (2) | 0.01 | — | ||||||||||||||||||||||||
| Gain on sale of businesses (3) | (0.03) | — | ||||||||||||||||||||||||
| Tax impact of adjustments (4) | — | — | ||||||||||||||||||||||||
| Adjusted EPS - basic and diluted (5) | $ | 0.90 | $ | 0.75 | 0.15 | 20.0 | ||||||||||||||||||||
| Weighted average shares outstanding - basic | 489,949 | 492,300 | ||||||||||||||||||||||||
| Weighted average shares outstanding - diluted | 490,130 | 492,413 | ||||||||||||||||||||||||
| Reconciliation of Net Income to EBITDA, Adjusted EBITDA, EBITDA Margin, and Adjusted EBITDA Margin | ||||||||||||||||||||||||||
| Net income | $ | 434,957 | $ | 368,599 | ||||||||||||||||||||||
| Depreciation and amortization | 99,752 | 91,326 | ||||||||||||||||||||||||
| Interest expense, net | 19,055 | 2,638 | ||||||||||||||||||||||||
| Provision for income taxes | 151,300 | 130,318 | ||||||||||||||||||||||||
| EBITDA | 705,064 | 592,881 | 112,183 | 18.9 | ||||||||||||||||||||||
| Fox acquisition-related expenses (1) | $ | 3,148 | $ | — | ||||||||||||||||||||||
| Restructuring costs (2) | 5,196 | — | ||||||||||||||||||||||||
| Gain on sale of businesses (3) | (15,450) | — | ||||||||||||||||||||||||
| Adjusted EBITDA | $ | 697,958 | $ | 592,881 | 105,077 | 17.7 | ||||||||||||||||||||
| Revenues | $ | 3,073,278 | $ | 2,695,823 | ||||||||||||||||||||||
| EBITDA margin | 22.9 | % | 22.0 | % | ||||||||||||||||||||||
| Adjusted EBITDA margin | 22.7 | % | 22.0 | % | ||||||||||||||||||||||
| Reconciliation of Net Cash Provided by Operating Activities to Free Cash Flow | ||||||||||||||||||||||||||
| Net cash provided by operating activities | $ | 528,366 | 465,930 | |||||||||||||||||||||||
| Capital expenditures | $ | (32,465) | $ | (30,628) | ||||||||||||||||||||||
| Free cash flow | 495,901 | 435,302 | 60,599 | 13.9 |
(1) Consists of expenses resulting from the amortization of certain intangible assets and adjustments to the fair value of contingent consideration resulting from the acquisition of Fox Pest Control. While we exclude such expenses in this non-GAAP measure, the revenue from the acquired company is reflected in this non-GAAP measure and the acquired assets contribute to revenue generation.
(2) Restructuring costs consist of costs primarily related to severance and benefits paid to employees pursuant to restructuring and workforce reduction plans.
(3) Represents the gain on the sale of certain non-core businesses.
(4) The tax effect of the adjustments is calculated using the applicable statutory tax rates for the respective periods.
(5) In some cases, the sum of the individual EPS amounts may not equal total non-GAAP EPS calculations due to rounding.
Liquidity and Capital Resources
Cash and Cash Flow
The Company’s $103.8 million of total cash at December 31, 2023 is held at various banking institutions. Approximately $52.1 million is held in cash by foreign subsidiaries and the remaining $51.7 million is held in Federal Deposit Insurance Corporation (“FDIC”) insured non-interest-bearing accounts at various domestic banks which at times exceed federally insured amounts.
We intend to continue to grow the business in the international markets where we have a presence. As it relates to our unremitted earnings in foreign jurisdictions, we assert that foreign cash earnings in excess of working capital and cash needed for strategic investments and acquisitions are not intended to be indefinitely reinvested offshore.
On February 24, 2023, the Company entered into a revolving credit agreement with, among others, JPMorgan Chase Bank, N.A. (“JPMorgan Chase”), as administrative agent (in such capacity, the “Administrative Agent”), which refinanced its previous credit facility.
The Credit Agreement provides for a $1.0 billion revolving Credit Facility, which may be denominated in U.S. Dollars and other currencies, including Euros, Australian Dollars, Canadian Dollars, New Zealand Dollars, Pounds Sterling and Japanese Yen, subject to a $400 million foreign currency sublimit. Rollins has the ability to expand its borrowing availability under the Credit Agreement in the form of increased revolving commitments or one or more tranches of term loans by up to an additional $750 million, subject to the agreement of the participating lenders and certain other customary conditions. The maturity date of the loans under the Credit Agreement is February 24, 2028. Refer to Note 10, Debt to the accompanying financial statements for further details.
As of December 31, 2023, the Company had outstanding borrowings of $493.0 million under the Credit Facility. The aggregate effective interest rate on the debt outstanding as of December 31, 2023 was 6.5%. As of December 31, 2022, the Company had outstanding borrowings of $54.9 million under the previous Term Loan and there were no outstanding borrowings under the previous Revolving Commitment. The aggregate effective interest rate on the debt outstanding as of December 31, 2022 was 5.1%.
The Company maintains $71.7 million in letters of credit as of December 31, 2023. These letters of credit are required by the Company’s insurance companies, due to the Company’s high deductible insurance program, to secure various workers’ compensation and casualty insurance contracts coverage and were increased from $71.3 million as of December 31, 2022. The Company believes that it has adequate liquid assets, funding sources and insurance accruals to accommodate potential future insurance claims.
The Company believes its current cash and cash equivalents balances, future cash flows expected to be generated from operating activities, and available borrowings under its Credit Facility will be sufficient to finance its current operations and obligations, and fund expansion of the business for the foreseeable future.
The following table sets forth a summary of our cash flows from operating, investing and financing activities for the year ended December 31, 2023 and 2022:
| Year Ended December 31, | Variance | ||||||||||||||||||||||
| (in thousands) | 2023 | 2022 | $ | % | |||||||||||||||||||
| Net cash provided by operating activities | 528,366 | 465,930 | 62,436 | 13.4 | |||||||||||||||||||
| Net cash used in investing activities | (372,895) | (134,141) | (238,754) | (178.0) | |||||||||||||||||||
| Net cash used in financing activities | (149,420) | (336,017) | 186,597 | 55.5 | |||||||||||||||||||
| Effect of exchange rate on cash | 2,428 | (5,727) | 8,155 | N/M | |||||||||||||||||||
| Net increase (decrease) in cash and cash equivalents | $ | 8,479 | $ | (9,955) | 18,434 | N/M |
N/M - calculation not meaningful
Cash Provided by Operating Activities
Cash from operating activities is the principal source of cash generation for our businesses. The most significant source of cash in our cash flow from operations is customer-related activities, the largest of which is collecting cash resulting from services sold. The most significant operating use of cash is to pay our suppliers, employees, and tax authorities. The Company’s operating activities generated net cash of $528.4 million and $465.9 million for the twelve months ended December 31, 2023 and 2022, respectively. The $62.4 million increase was driven primarily by strong operating results and the timing of cash receipts and cash payments to vendors, employees, and tax and regulatory authorities.
Cash Used in Investing Activities
The Company’s investing activities used $372.9 million and $134.1 million for the twelve months ended December 31, 2023 and 2022, respectively. Cash paid for acquisitions totaled $366.9 million for the twelve months ended December 31, 2023, as compared to $119.2 million for the twelve months ended December 31, 2022, driven primarily by the acquisition of Fox Pest Control. The Company invested $32.5 million in capital expenditures during the year, offset by $12.5 million in cash proceeds from the sale of assets, and $15.9 million in cash proceeds from the sale of businesses, compared with $30.6 million of capital expenditures and $14.6 million in cash proceeds from asset sales in 2022. The Company’s investing activities were funded through existing cash balances, operating cash flows, and borrowings under the Credit Facility.
Cash Used in Financing Activities
Cash used in financing activities was $149.4 million and $336.0 million during the twelve months ended December 31, 2023 and 2022, respectively. A total of $264.3 million was paid in cash dividends ($0.54 per share) during the twelve months ended December 31, 2023, compared to $211.6 million in cash dividends paid ($0.43 per share) during the twelve months ended December 31, 2022. The Company made net borrowings under its credit agreements of $438.0 million during the twelve months ended December 31, 2023, compared to net repayments of $100.0 million during 2022. In addition, during the twelve months ended December 31, 2023, the Company completed the repurchase of 8,724,100 of the shares of common stock from LOR, Inc ("LOR") (a company controlled by Mr. Gary W. Rollins and certain members of his family) for $300.0 million in conjunction with the transaction described below.
On September 6, 2023, the Company entered into an underwriting agreement (the “Underwriting Agreement”) with LOR, and Goldman Sachs & Co. LLC and Morgan Stanley & Co. LLC, as representatives of the several underwriters named in Schedule I thereto (the “Underwriters”), relating to the offer by LOR of 38,724,100 shares of the Company’s common stock, par value $1.00 per share, at a public offering price of $34.39 per share (the “Offering”). In connection with the Offering, LOR granted the Underwriters an option to purchase up to an additional 5,785,714 shares of common stock (the “Optional Shares”). The Offering, including the sale of the Optional Shares, closed on September 11, 2023. The Company did not sell any shares in the Offering and did not receive any proceeds from the Offering.
On June 5 2023, the Company entered into a registration rights agreement (the "Registration Rights Agreement") with LOR, and LOR paid $1.5 million to the Company and upon closing the Offering, LOR paid $3.5 million to the Company pursuant to the Registration Rights Agreement. Pursuant to the Registration Rights Agreement, the Company will pay all costs, fees and expenses incident to the Company’s performance or compliance with the Registration Rights Agreement with respect to a total of five (5) requested offerings, and thereafter, LOR will be responsible for all such expenses in connection with any subsequent offering. These cash receipts are included in other financing activities.
In 2012, the Company’s Board of Directors authorized the purchase of up to 5 million shares of the Company’s common stock. After adjustments for stock splits, the total authorized shares under the share repurchase program were 16.9 million shares. As of December 31, 2023, we have a remaining authorization of 11.4 million shares under the share repurchase program. The Company did not repurchase shares of its common stock on the open market during 2023 or 2022. However, in 2023 the Company purchased $4.2 million of shares on behalf of employees for the Employee Stock Purchase Plan. The Company also repurchased $10.8 million and $7.1 million of common stock for the twelve months ended December 31, 2023 and 2022, respectively, from employees for the payment of taxes on vesting restricted shares.
In addition, the Form S-3 shelf registration statement on file with the SEC registered $1.5 billion of the Company’s common stock, preferred stock, debt securities, depository shares, warrants, rights, purchase contracts and units for future issuance. The Company may offer and sell some or all of such securities from to time or to or through underwriters, brokers or dealers, directly to one or more other purchasers, through a block trade, through agents on a best-efforts basis,
through a combination of any of the above methods of sale or through other types of transactions described in the Form S-3. The Company has not sold any such securities as of the date of this Form 10-K.
Litigation
For discussion on the Company’s legal contingencies, see Note 12, Commitments and Contingencies to the accompanying financial statements, and Part I, Item 3, Legal Proceedings.
Contractual Commitments
We have material cash requirements for known contractual obligations and commitments in the form of operating leases and debt obligations. We expect to fund these obligations primarily through cash generated from our operations. Refer to Note 6, Leases and Note 10, Debt to the accompanying financial statements for further details.
Critical Accounting Estimates
The Company views critical accounting estimates to be those that are very important to the portrayal of our financial condition and results of operations, and that require management’s most difficult, complex or subjective judgments. The circumstances that make these judgments difficult or complex relate to the need for management to make estimates about the effect of matters that are inherently uncertain. We believe our critical accounting estimates to be as follows:
**Accrued Insurance—**The Company retains, up to specified limits, certain risks related to U.S. general liability, workers’ compensation and auto liability. Risks are managed through either high deductible insurance or, for Clark Pest Control only, a non-affiliated group captive insurance member arrangement. The estimated costs of existing and future claims under the retained loss program are accrued based upon historical trends as incidents occur, whether reported or unreported (although actual settlement of the claims may not be made until future periods) and may be subsequently revised based on developments relating to such claims. The group captive is subject to a third-party actuarial study retained by the captive manager, independent from the Company. For the high deductible insurance program, the Company contracts with an independent third-party actuary to provide the Company an estimated liability based upon historical claims information. The actuarial study is a major consideration in establishing the reserve, along with management’s knowledge of changes in business practice and existing claims compared to current balances. Management’s judgment is inherently subjective as a number of factors are outside management’s knowledge and control. Additionally, historical information is not always an accurate indication of future events. The Company continues to be proactive in safety and risk management to develop and maintain ongoing programs to reduce and prevent incidents and claims. Initiatives that have been implemented include required pre-employment screening and ongoing motor vehicle record review for all drivers, post-offer physicals for new employees, pre-hire, random and post incident drug testing, driver training and post-injury nurse triage for work-related injuries. The accruals and reserves we hold are based on estimates that involve a degree of judgment and are inherently variable and could be overestimated or insufficient. If actual claims exceed our estimates, our operating results could be materially affected, and our ability to take timely corrective actions to limit future costs may be limited.
**Business Combinations—**We account for business combinations by recognizing the assets acquired and liabilities assumed at the acquisition date fair value. In valuing certain acquired assets and liabilities, fair value estimates use significant, non-observable inputs (Level 3), including future expected cash flows and discount rates. Goodwill is measured as the excess of consideration transferred over the fair values of the assets acquired and the liabilities assumed. While we use our best estimates and assumptions to value assets acquired and liabilities assumed at the acquisition date, our estimates are inherently uncertain and subject to refinement. As a result, during the measurement period, which may be up to one year from the acquisition date, we may record adjustments to the assets acquired and liabilities assumed, with the corresponding offset to goodwill. Upon the conclusion of the measurement period, any subsequent adjustments arising from new facts and circumstances are recorded to the consolidated statements of operations. The results of operations of acquisitions are reflected in our consolidated financial statements from the date of acquisition.
Accounting for business combinations requires our management to make significant estimates and assumptions about intangible assets, assets and obligations assumed, contingent consideration, and other contingencies. Critical inputs and assumptions in valuing certain of the intangible assets include, but are not limited to, future expected cash flows from customer contracts; the acquired Company’s trademarks & tradenames, and competitive position, as well as assumptions about the period of time the acquired trademarks & tradenames will continue to be used in the combined Company’s product portfolio; and discount rates. These significant assumptions are forward-looking and could be affected by future economic and market conditions.
Recent Accounting Guidance and Other Policies and Estimates
See Note 1, Summary of Significant Accounting Policies to the accompanying financial statements (Part II, Item 8 of this Form 10-K) for further discussion.
Item 7A. Quantitative and Qualitative Disclosures about Market Risk
Market Risk
The Company is subject to interest rate risk exposure through borrowings on its $1.0 billion revolving credit facility (the "Credit Facility"). As of December 31, 2023, the Company had outstanding borrowings of $493.0 million under the Credit Facility. See Note 10, Debt to the accompanying financial statements for further details regarding debt. We do not believe that a one percent increase in interest rates, for example, would have a material effect on our results of operations or cash flows. The Company is also exposed to market risks arising from changes in foreign exchange rates. The Company believes that this foreign exchange rate risk will not have a material impact upon the Company’s results of operations going forward. For a discussion of the Company’s activities to manage risks relative to fluctuations in foreign currency exchange rates, see Note 1, Summary of Significant Accounting Policies to the accompanying financial statements.
Item 8. Financial Statements and Supplementary Data
MANAGEMENT’S REPORT ON INTERNAL CONTROL OVER FINANCIAL REPORTING
To the Stockholders of Rollins, Inc.:
The management of Rollins, Inc. and subsidiaries is responsible for establishing and maintaining adequate internal control over financial reporting for the Company. Rollins, Inc. maintains a system of internal accounting controls designed to provide reasonable assurance, at a reasonable cost, that assets are safeguarded against loss or unauthorized use and that the financial records are adequate and can be relied upon to produce financial statements in accordance with accounting principles generally accepted in the United States of America. The internal control system is augmented by written policies and procedures, an internal audit program and the selection and training of qualified personnel. This system includes policies that require adherence to ethical business standards and compliance with all applicable laws and regulations.
Under the supervision and with the participation of our management, including our principal executive officer and principal financial and principal accounting officer, we conducted an evaluation of the effectiveness of the design and operation of internal controls over financial reporting as of December 31, 2023 based on criteria established in the 2013 Internal Control—Integrated Framework issued by the Committee of Sponsoring Organizations of the Treadway Commission.
During the year ended December 31, 2023, we completed the acquisition of Fox Pest Control ("Fox"). See Note 2, Acquisitions, for more information. We are currently in the process of integrating Fox into our assessment of our internal control over financial reporting. Consistent with guidance issued by the Securities and Exchange Commission that an assessment of a recently acquired business may be omitted from management’s report on internal control over financial reporting in the year of acquisition, Management's assessment and conclusions on the effectiveness of our disclosure controls and procedures as of December 31, 2023 excludes an assessment of the internal control over financial reporting of Fox. Fox represented approximately 4% of our revenues for the year ended December 31, 2023 and approximately 1% of our total assets at December 31, 2023.
Excluding the above, management’s assessment is that Rollins, Inc. maintained effective internal control over financial reporting as of December 31, 2023.
The independent registered public accounting firm, Deloitte & Touche LLP has audited the consolidated financial statements as of and for the year ended December 31, 2023, and has also issued their report on the effectiveness of the Company’s internal control over financial reporting, included in this report on page 35.
| /s/ Jerry E. Gahlhoff, Jr. | /s/ Kenneth D. Krause | |||||||
| Jerry E. Gahlhoff, Jr. | Kenneth D. Krause | |||||||
| President and Chief Executive Officer | Executive Vice President, Chief Financial Officer and Treasurer | |||||||
| Principal Executive Officer | Principal Financial Officer | |||||||
| Atlanta, Georgia | ||||||||
| February 15, 2024 |
REPORT OF INDEPENDENT REGISTERED PUBLIC ACCOUNTING FIRM
To the stockholders and the Board of Directors of Rollins, Inc.
Opinion on Internal Control over Financial Reporting
We have audited the internal control over financial reporting of Rollins, Inc. and subsidiaries (the “Company”) as of December 31, 2023, based on criteria established in Internal Control — Integrated Framework (2013) issued by the Committee of Sponsoring Organizations of the Treadway Commission (COSO). In our opinion, the Company maintained, in all material respects, effective internal control over financial reporting as of December 31, 2023, based on criteria established in Internal Control — Integrated Framework (2013) issued by COSO.
We have also audited, in accordance with the standards of the Public Company Accounting Oversight Board (United States) (PCAOB), the consolidated financial statements as of and for the year ended December 31, 2023, of the Company and our report dated February 15, 2024, expressed an unqualified opinion on those financial statements.
As described in Management's Report on Internal Control Over Financial Reporting, management excluded from its assessment the internal control over financial reporting at Fox Pest Control, which was acquired on April 1, 2023, and whose financial statements constitute 1% of total assets and 4% of revenues of the consolidated financial statement amounts as of and for the year ended December 31, 2023. Accordingly, our audit did not include the internal control over financial reporting at Fox Pest Control.
Basis for Opinion
The Company’s management is responsible for maintaining effective internal control over financial reporting and for its assessment of the effectiveness of internal control over financial reporting, included in the accompanying Management’s Report on Internal Control Over Financial Reporting. Our responsibility is to express an opinion on the Company’s internal control over financial reporting based on our audit. We are a public accounting firm registered with the PCAOB and are required to be independent with respect to the Company in accordance with the U.S. federal securities laws and the applicable rules and regulations of the Securities and Exchange Commission and the PCAOB.
We conducted our audit in accordance with the standards of the PCAOB. Those standards require that we plan and perform the audit to obtain reasonable assurance about whether effective internal control over financial reporting was maintained in all material respects. Our audit included obtaining an understanding of internal control over financial reporting, assessing the risk that a material weakness exists, testing and evaluating the design and operating effectiveness of internal control based on the assessed risk, and performing such other procedures as we considered necessary in the circumstances. We believe that our audit provides a reasonable basis for our opinion.
Definition and Limitations of Internal Control over Financial Reporting
A company’s internal control over financial reporting is a process designed to provide reasonable assurance regarding the reliability of financial reporting and the preparation of financial statements for external purposes in accordance with generally accepted accounting principles. A company’s internal control over financial reporting includes those policies and procedures that (1) pertain to the maintenance of records that, in reasonable detail, accurately and fairly reflect the transactions and dispositions of the assets of the company; (2) provide reasonable assurance that transactions are recorded as necessary to permit preparation of financial statements in accordance with generally accepted accounting principles, and that receipts and expenditures of the company are being made only in accordance with authorizations of management and directors of the company; and (3) provide reasonable assurance regarding prevention or timely detection of unauthorized acquisition, use, or disposition of the company’s assets that could have a material effect on the financial statements.
Because of its inherent limitations, internal control over financial reporting may not prevent or detect misstatements. Also, projections of any evaluation of effectiveness to future periods are subject to the risk that controls may become inadequate because of changes in conditions, or that the degree of compliance with the policies or procedures may deteriorate.
/s/ Deloitte & Touche LLP
Atlanta, Georgia
February 15, 2024
**REPORT OF INDEPENDENT REGISTER
Showing the first 8K of 156K characters. Open the full section
Item 9. Changes in and Disagreements with Accountants on Accounting and Financial Disclosures.
None.
Item 9A. Controls and Procedures
Evaluation of Disclosure Controls and Procedures
The Company has a Disclosure Committee, consisting of certain members of management to assist our Chief Executive Officer (principal executive officer) and Chief Financial Officer (principal financial officer) in preparing the disclosures
required under the SEC rules and to help ensure that the Company’s disclosure controls and procedures are properly implemented. The Disclosure Committee meets on a quarterly basis and otherwise as may be necessary.
The Disclosure Committee, with the participation of our principal executive officer and principal financial officer, conducted an evaluation of the effectiveness of the design and operation of our disclosure controls and procedures, as defined in rules 13a 15(e) and 15d-15(e) under the Securities Exchange Act of 1934, as amended (the “Exchange Act”) as of December 31, 2023 (the “Evaluation Date”). Based on this evaluation, our principal executive officer and principal financial officer concluded that our disclosure controls and procedures were effective at the reasonable assurance level as of the Evaluation Date to ensure that the information required to be included in reports filed under the Exchange Act is recorded, processed, summarized and reported within the time periods specified in SEC rules and forms.
Management’s Report on Internal Control Over Financial Reporting—Management’s Report on Internal Control Over Financial Reporting is contained on page 34. The effectiveness of our internal control over financial reporting as of December 31, 2023 has been audited by Deloitte & Touche LLP, an independent registered public accounting firm, as stated in its report on page 35.
Changes in Internal Controls—There were no changes in the Company’s internal control over financial reporting, as defined in Rule 13a-15(f) under the Exchange Act, during the quarter ended December 31, 2023 that have materially affected, or are reasonably likely to materially affect, the Company’s internal control over financial reporting.
Item 9B. Other Information
Rule 10b5-1 Trading Plans
Securities Trading Plans of Directors and Executive Officers
During the quarter ended December 31, 2023, the following executive officers and directors entered into, modified or terminated, contracts, instructions or written plans for the sale of the Company’s securities, each of which is intended to satisfy the affirmative defense conditions of Rule 10b5-1 of the Exchange Act, referred to as Rule 10b5-1 trading plans.
| Name and Title | Date of Adoption of the Rule 10b5-1 Trading Plan | Scheduled Expiration Date of the Rule 10b5-1 Trading Plan | Total Amount of Securities to Be Sold | Transactions Pursuant to 10b5-1 Trading Plan | Early Termination of the Rule 10b5-1 Trading Plan | ||||||||||||
| Kenneth D. Krause Executive Vice President, Chief Financial Officer and Treasurer | December 13, 2023 | August 30, 2024 | 15,000 shares of Company common stock or lesser amount of shares received from January 1, 2024 vesting | Sales to occur in three tranches of 5,000 shares (or lesser amount of shares received from January 1, 2024 vesting) on or after March 13, 2024, April 13, 2024 and May 13, 2024, if certain limit prices are met | If all 15,000 shares are sold prior to the scheduled expiration date, the trading plan will terminate on such earlier date | ||||||||||||
| John F. Wilson Vice Chairman | November 2, 2023 | November 4, 2024 | 40,000 shares of Company common stock | Sales occurred on February 5, 2024; however, such sales were rescinded through the broker's error account on February 9, 2024. | The trading plan was terminated as of February 9, 2024. |
In addition to the material terms noted in the table, pursuant to each of these trading plans, in accordance with Rule 10b5-1 of the Exchange Act, there is a mandatory waiting period or “cooling-off period” before the transactions contemplated by each trading plan can begin consisting of the later of (i) ninety days after the adoption date of the applicable trading plan or (ii) two business days following the disclosure of the Company’s financial results in a Form 10-Q or Form 10-K for the completed fiscal quarter in which such plan was adopted. In addition, each trading plan disclosed in this Item 9B includes certain representations made by the applicable officer as to (a) the possession of material, non-public information about the Company; (b) the fact that officer is adopting the plan in good faith and will continue to act in good faith with respect to all transactions contemplated by the plan; and (c) the existence of other trading arrangements pursuant to Rule 10b5-1 currently in effect or scheduled to take effect.
Item 9C. Disclosure Regarding Foreign Jurisdictions that Prevent Inspections.
Not Applicable.
PART III
Item 10. Directors, Executive Officers and Corporate Governance.
The information required by this Item, except that set forth below regarding the Company’s code of ethics, will be set forth in our Proxy Statement for the 2024 Annual Meeting of Stockholders and is incorporated herein by reference. The Proxy Statement will be filed with the SEC within 120 days of the fiscal year ended December 31, 2023, or by the following business day.
The Company has adopted a Code of Business Conduct that applies to all employees. In addition, the Company has adopted a Code of Business Conduct and Ethics for Directors and Executive Officers and Related Party Transactions. Both of these documents are available on the Company’s website at www.rollins.com, under the heading “Governance- Governance Documents,” and a copy is available by writing to Investor Relations at 2170 Piedmont Road, Atlanta, Georgia 30324. The Company intends to satisfy the disclosure requirement under Item 5.05 of Form 8-K regarding an amendment to, or waiver from, a provision of its code of ethics that relates to any elements of the code of ethics definition enumerated in SEC rules by posting such information on its internet website, the address of which is provided above.
Item 11. Executive Compensation.
The information required by this Item will be set forth in our Proxy Statement for the 2024 Annual Meeting of Stockholders and is incorporated herein by reference. The Proxy Statement will be filed with the SEC within 120 days of the fiscal year ended December 31, 2023, or by the following business day.
Item 12. Security Ownership of Certain Beneficial Owners and Management and Related Stockholder Matters.
The information required by this Item will be set forth in our Proxy Statement for the 2024 Annual Meeting of Stockholders and is incorporated herein by reference. The Proxy Statement will be filed with the SEC within 120 days of the fiscal year ended December 31, 2023, or by the following business day.
Item 13. Certain Relationships and Related Party Transactions, and Director Independence.
Information concerning certain relationships and related party transactions and director independence will be included in the Proxy Statement for the 2024 Annual Meeting of Stockholders and is incorporated herein by reference.
Item 14. Principal Accounting Fees and Services.
Information regarding principal accounting fees and services will be included in the Proxy Statement for the 2024 Annual Meeting of Stockholders and is incorporated herein by reference.
PART IV
Item 15. Exhibits and Financial Statement Schedules
*(a)*Consolidated Financial Statements, Financial Statement Schedule and Exhibits.
1.Consolidated financial statements listed in the accompanying Index to Consolidated Financial Statements and Schedule are filed as part of this report.
2.All schedules have been omitted as not applicable, immaterial or disclosed in the Consolidated Financial Statements or notes thereto.
3.Exhibits listed in the accompanying Index to Exhibits are filed as part of this report.
- Indicates management contract or compensatory plan or arrangement.
** This certification is deemed furnished, and not filed, with the Securities and Exchange Commission and is not to be incorporated by reference into any filing of Rollins, Inc. under the Securities Act of 1933, as amended, or the Securities Exchange Act of 1934, as amended, whether made before or after the date of this Annual Report on Form 10-K, irrespective of any general incorporation language contained in such filing.
+ Confidential treatment has been requested for certain portions of this exhibit. Such information has been omitted and was filed separately with the Securities and Exchange Commission.
SIGNATURES
Pursuant to the requirements of Section 13 or 15(d) of the Securities Exchange Act of 1934, the Registrant has duly caused this report to be signed on its behalf by the undersigned, thereunto duly authorized.
| ROLLINS, INC. | ||||||||
| By: | /s/ Jerry E. Gahlhoff, Jr. | |||||||
| Jerry E. Gahlhoff, Jr. | ||||||||
| President and Chief Executive Officer | ||||||||
| (Principal Executive Officer) | ||||||||
| Date: | February 15, 2024 |
Pursuant to the requirements of the Securities Exchange Act of 1934, this report has been signed below by the following persons on behalf of the Registrant and in the capacities and on the dates indicated.
| By: | /s/ Jerry E. Gahlhoff, Jr. | By: | /s/ Kenneth D. Krause | |||||||||||
| Jerry E. Gahlhoff, Jr. | Kenneth D. Krause | |||||||||||||
| President and Chief Executive Officer | Executive Vice President, Chief Financial Officer and Treasurer | |||||||||||||
| (Principal Executive Officer) | (Principal Financial Officer) | |||||||||||||
| Date: | February 15, 2024 | Date: | February 15, 2024 | |||||||||||
| By: | /s/ Traci Hornfeck | |||||||||||||
| Traci Hornfeck | ||||||||||||||
| Chief Accounting Officer | ||||||||||||||
| (Principal Accounting Officer) | ||||||||||||||
| Date: | February 15, 2024 |
The Directors of Rollins, Inc. (listed below) executed a power of attorney appointing Jerry E. Gahlhoff, Jr. their attorney-in-fact, empowering him to sign this report on their behalf.
| Gary W. Rollins, Chairman | ||||||||
| Jerry W. Nix, Lead Director | ||||||||
| Susan R. Bell, Director | ||||||||
| Donald P. Carson, Director | ||||||||
| Jerry E. Gahlhoff, Director | ||||||||
| Patrick J. Gunning, Director | ||||||||
| Gregory B. Morrison, Director | ||||||||
| Louise S. Sams, Director | ||||||||
| Pamela R. Rollins, Director | ||||||||
| John F. Wilson, Director | ||||||||
| P. Russell Hardin, Director | ||||||||
| /s/ Jerry E. Gahlhoff, Jr. | ||||||||
| Jerry E. Gahlhoff, Jr. | ||||||||
| As Attorney-in-Fact & Director | ||||||||
| February 15, 2024 |
ROLLINS, INC. AND SUBSIDIARIES
INDEX TO CONSOLIDATED FINANCIAL STATEMENTS AND SCHEDULE
The following documents are filed as part of this report.