 filings.tools
Roper Technologies 10-K 2016-12-31
Filed 2017-02-27. 22 sections, 248K characters. Original on sec.gov · Markdown · JSON
Cover and table of contents
10-K 1 cy2016_10-k.htm
UNITED STATES
SECURITIES AND EXCHANGE COMMISSION
Washington, D.C. 20549
--------------------------
FORM 10-K
| ☑ ANNUAL REPORT PURSUANT TO SECTION 13 OR 15(d) OF THE SECURITIES EXCHANGE ACT OF 1934 |
|---|
For the fiscal year ended December 31, 2016
| ☐ TRANSITION REPORT PURSUANT TO SECTION 13 OR 15(d) OF THE SECURITIES EXCHANGE ACT OF 1934 |
|---|
For the transition period from ___ to ___
Commission File Number 1-12273
ROPER TECHNOLOGIES, INC.
(Exact name of Registrant as specified in its charter)
----------------
| Delaware | 51-0263969 | |
|---|---|---|
| (State or other jurisdiction of incorporation or organization) | (I.R.S. Employer Identification No.) |
----------------
6901 Professional Parkway East, Suite 200
Sarasota, Florida 34240
(Address of principal executive offices) (Zip Code)
Registrant's telephone number, including area code: (941) 556-2601
----------------
SECURITIES REGISTERED PURSUANT TO SECTION 12(b) OF THE ACT:
| Title of Each Class | Name of Each Exchange On Which Registered | |
|---|---|---|
| Common Stock, $0.01 Par Value | New York Stock Exchange |
SECURITIES REGISTERED PURSUANT TO SECTION 12(g) OF THE ACT: None
----------------
Indicate by check mark if the registrant is a well-known seasoned issuer, as defined in Rule 405 of the Securities Act. ☑ Yes ☐ No
Indicate by check mark if the registrant is not required to file reports pursuant to Section 13 or 15(d) of the Securities Exchange Act of 1934. ☐ Yes ☑ No
Indicate by check mark whether the registrant (1) has filed all reports required to be filed by Section 13 or 15(d) of the Securities Exchange Act of 1934 during the preceding 12 months (or for such shorter period that the registrant was required to file such reports), and (2) has been subject to such filing requirements for the past 90 days. ☑ Yes ☐ No
Indicate by check mark if disclosure of delinquent filers pursuant to Item 405 of Regulation S-K (§229.405) is not contained herein, and will not be contained, to the best of registrant's knowledge, in definitive proxy or information statements incorporated by reference in Part III of this Form 10-K or any amendment to this Form 10-K. ☐
Indicate by check mark whether the registrant has submitted electronically and posted on its corporate Web site, if any, every Interactive Data File required to be submitted and posted pursuant to Rule 405 of Regulation S-T (§223.405) during the preceding 12 months (or for such shorter period that the registrant was required to submit and post such files). ☑ Yes ☐ No
Indicate by check mark whether the registrant is a large accelerated filer, an accelerated filer, a non-accelerated filer, or a smaller reporting company (as defined in Rule 12b-2 of the Exchange Act). ☑ Large accelerated filer ☐ Accelerated filer ☐ Non-accelerated filer ☐ Smaller reporting company
Indicate by check mark if the registrant is a shell company (as defined in Rule 12-b2 of the Act). ☐ Yes ☑ No
Based on the closing sale price on the New York Stock Exchange on June 30, 2016, the aggregate market value of the voting and non-voting common stock held by non-affiliates of the registrant was: $16,984,404,742.
Number of shares of registrant's Common Stock outstanding as of February 16, 2017: 101,874,232.
DOCUMENTS INCORPORATED BY REFERENCE
Portions of the registrant's Proxy Statement to be furnished to Stockholders in connection with its Annual Meeting of Stockholders to be held on June 8, 2017, are incorporated by reference into Part III of this Annual Report on Form 10-K.
ROPER TECHNOLOGIES, INC.
FORM 10-K FOR THE FISCAL YEAR ENDED DECEMBER 31, 2016
Table of Contents
| PART I | Page | |
|---|---|---|
| Item 1. Business 4 | ||
| Item 1A. Risk Factors 8 | ||
| Item 1B. Unresolved Staff Comments 13 | ||
| Item 2. Properties 14 | ||
| Item 3. Legal Proceedings 15 |
Item 4. Mine Safety Disclosures 15
| | | | | PART II | | | Item 5. Market for Registrant's Common Equity, Related Stockholder Matters and Issuer Purchases of Equity Securities 15 Item 6. Selected Financial Data 17 Item 7. Management's Discussion and Analysis of Financial Condition and Results of Operations 18 Item 7A. Quantitative and Qualitative Disclosures about Market Risk 29 Item 8. Financial Statements and Supplementary Data 30 Item 9. Changes in and Disagreements with Accountants on Accounting and Financial Disclosure 61 Item 9A. Controls and Procedures 61 Item 9B. Other Information 62 | | | | | PART III | | | Item 10. Directors, Executive Officers and Corporate Governance 62 Item 11. Executive Compensation 62 Item 12. Security Ownership of Certain Beneficial Owners and Management and Related Stockholder Matters 63 Item 13. Certain Relationships and Related Transactions and Director Independence 63 Item 14. Principal Accountant Fees and Services 63 | | | | | PART IV | | | Item 15. Exhibits and Financial Statement Schedules 64
Item 16. Form 10-K Summary 66
| | Signatures | 67 |
Information About Forward-Looking Statements
This Annual Report on Form 10-K ("Annual Report") includes and incorporates by reference "forward-looking statements" within the meaning of the federal securities laws. In addition, we, or our executive officers on our behalf, may from time to time make forward-looking statements in reports and other documents we file with the U.S. Securities and Exchange Commission ("SEC") or in connection with oral statements made to the press, potential investors or others. All statements that are not historical facts are "forward-looking statements." Forward-looking statements may be indicated by words or phrases such as "anticipate," "estimate," "plans," "expects," "projects," "should," "will," "believes" or "intends" and similar words and phrases. These statements reflect management's current beliefs and are not guarantees of future performance. They involve risks and uncertainties that could cause actual results to differ materially from those expressed or implied in any forward-looking statement.
Examples of forward-looking statements in this report include but are not limited to statements regarding operating results, the success of our operating plans, our expectations regarding our ability to generate cash and reduce debt and associated interest expense, profit and cash flow expectations, the prospects for newly acquired businesses to be integrated and contribute to future growth and our expectations regarding growth through acquisitions. Important assumptions relating to the forward-looking statements include, among others, demand for our products, the cost, timing and success of product upgrades and new product introductions, raw material costs, expected pricing levels, expected outcomes of pending litigation, competitive conditions and general economic conditions. These assumptions could prove inaccurate. Although we believe that the estimates and projections reflected in the forward-looking statements are reasonable, our expectations may prove to be incorrect. Important factors that could cause actual results to differ materially from estimates or projections contained in the forward-looking statements include, but are not limited to:
| ● | general economic conditions; |
|---|
| ● | difficulty making acquisitions and successfully integrating acquired businesses; |
|---|
| ● | any unforeseen liabilities associated with future acquisitions; |
|---|
| ● | limitations on our business imposed by our indebtedness; |
|---|
| ● | unfavorable changes in foreign exchange rates; |
|---|
| ● | difficulties associated with exports; |
|---|
| ● | risks and costs associated with our international sales and operations; |
|---|
| ● | rising interest rates; |
|---|
| ● | product liability and insurance risks; |
|---|
| ● | increased warranty exposure; |
|---|
| ● | future competition; |
|---|
| ● | the cyclical nature of some of our markets; |
|---|
| ● | reduction of business with large customers; |
|---|
| ● | risks associated with government contracts; |
|---|
| ● | changes in the supply of, or price for, raw materials, parts and components; |
|---|
| ● | environmental compliance costs and liabilities; |
|---|
| ● | risks and costs associated with asbestos-related litigation; |
|---|
| ● | potential write-offs of our substantial goodwill and other intangible assets; |
|---|
| ● | our ability to successfully develop new products; |
|---|
| ● | failure to protect our intellectual property; |
|---|
| ● | the effect of, or change in, government regulations (including tax); |
|---|
| ● | economic disruption caused by terrorist attacks, including cybersecurity threats, health crises or other unforeseen events; and |
|---|
| ● | the factors discussed in Item 1A to this Annual Report under the heading "Risk Factors." |
|---|
We believe these forward-looking statements are reasonable. However, you should not place undue reliance on any forward-looking statements, which are based on current expectations. Further, forward-looking statements speak only as of the date they are made, and we undertake no obligation to publicly update any of them in light of new information or future events.
PART I
Item 1. BUSINESS
| --- | --- |
Our Business
Roper Technologies, Inc. ("Roper," the "Company," "we," "our" or "us") is a diversified technology company. We operate businesses that design and develop software (both license and software-as-a-service) and engineered products and solutions for a variety of niche end markets; including healthcare, transportation, commercial construction, food, energy, water, education and academic research.
We pursue consistent and sustainable growth in earnings by emphasizing continuous improvement in the operating performance of our existing businesses and by acquiring other businesses that offer high value-added software, services, engineered products and solutions that we believe are capable of achieving growth and maintaining high margins. We compete in many niche markets and believe we are the market leader or a competitive alternative to the market leader in most of these markets.
We were incorporated on December 17, 1981 under the laws of the State of Delaware.
Market Share, Market Expansion, and Product Development
Leadership with Engineered Content for Niche Markets - We maintain a leading position in many of our markets. We believe our market positions are attributable to the technical sophistication of our products and software, the applications expertise used to create our advanced products and systems, and our distribution and service capabilities. Our operating units grow their businesses through new product development and development of new applications and services to satisfy customer needs. In addition, our operating units grow our customer base by expanding our access to customers and entering adjacent markets.
Diversified End Markets and Geographic Reach - We have a global presence, with sales to customers outside the U.S. totaling $1.2 billion in 2016. Information regarding our international operations is set forth in Note 13 of the Notes to Consolidated Financial Statements included in this Annual Report.
Research and Development - We conduct applied research and development to improve the quality and performance of our products and to develop new technologies and products. Our research and development spending was $195 million in 2016 as compared to $164 million and $148 million in 2015 and 2014, respectively.
Our Business Segments
Our operations are reported in four segments based upon common customers, markets, sales channels, technologies and common cost opportunities. The segments are: Medical & Scientific Imaging, RF Technology, Industrial Technology and Energy Systems & Controls. Financial information about our business segments is presented in Note 13 of the Notes to Consolidated Financial Statements included in this Annual Report.
Medical and Scientific Imaging
Our Medical & Scientific Imaging segment offers products and software in medical applications, and high performance digital imaging products. These products and solutions are provided through eleven reporting units. For 2016, this segment had net sales of $1.36 billion, representing 36.0% of our total net sales.
Medical Products and Software - We provide diagnostic and laboratory software solutions to healthcare providers and services and technologies to support the diverse and complex needs of alternate site health care providers who deliver services outside of an acute care hospital setting. We also manufacture and sell patient positioning devices and related software for use in radiation oncology, 3-D measurement technology in computer-assisted surgery and supply diagnostic and therapeutic disposable products used in ultrasound imaging for minimally invasive medical procedures. We design and manufacture a non-invasive instrument for portable ultrasound bladder volume measurement and a video laryngoscope designed to enable rapid intubation even in the most difficult settings. In addition, we provide a cloud-based financial analytics and performance software platform to healthcare providers.
Digital Imaging Products and Software - We manufacture and sell extremely sensitive, high-performance electron filters, charged couple device ("CCD") and complementary metal oxide semiconductor ("CMOS") cameras, detectors and related software for a variety of scientific and industrial uses, which require high resolution and/or high speed digital video, including electron microscopy and spectroscopy applications. We sell these products for use within academic, government research, semiconductor, security and other end-user markets such as biological and material science. They are frequently incorporated into products by original equipment manufacturers ("OEMs").
Our Medical & Scientific Imaging segment companies have lead times of up to several months on some of their product sales, although standard products are often shipped within two weeks of receipt of order. Blanket purchase orders are placed by certain OEM and end-users, with continuing requirements for fulfillment over specified periods of time.
RF Technology
Our RF Technology segment provides radio frequency identification ("RFID") communication technology and software solutions that are used primarily in toll and traffic systems, security and access control, campus card systems, card readers, software-as-a-service in the freight matching, commercial construction and food industries, comprehensive application management software for legal and construction firms and metering and remote monitoring applications. These products and solutions are provided through ten reporting units. This segment had sales of $1.21 billion for the year ended December 31, 2016, representing 31.9% of our total net sales.
Toll and Traffic Systems - We manufacture and sell toll tags and monitoring systems as well as provide transaction and violation processing services for toll and traffic systems to both governmental and private sector entities. In addition, we provide intelligent traffic systems that assist customers in improving traffic flow and infrastructure utilization.
Card Systems/Integrated Security Solutions - We provide card systems and integrated security solutions primarily to education and health care markets. We also provide an integrated nutrition management solution used by food service customers.
RFID Card Readers - We design, develop and manufacture RFID card readers that support most smart cards worldwide. The readers are used in numerous applications and OEM solutions including: attendance management, multi-function printers, mobile, physical access, manufacturing, dispensing, kiosks, point-of-sale and computer logon.
Software-as-a-Service - We maintain electronic marketplaces that connect 1) available capacity of trucking units with the available loads of freight to be moved from location to location throughout North America, 2) food suppliers, distributors and vendors, primarily in the perishable food sector and 3) construction industry professionals.
Comprehensive Application Management Software - We provide 1) enterprise software and information solutions for government contractors, professional services firms and other project-based businesses, 2) comprehensive management software solutions for law and other professional services firms, including business development, calendar/docket matter management, time and billing and case management and 3) construction project management solutions for construction firms which encompass the end-to-end construction process.
Metering and Remote Monitoring - We manufacture and sell meter reading, data logging and pressure control products for use primarily in water and gas applications. We also provide network monitoring, leakage reduction and pressure control services in water and gas distribution networks.
The RF Technology segment companies' product sales reflect a combination of standard products, large engineered projects, and multi-year operations and maintenance contracts. Standard products generally ship within two weeks of receipt of order, and large engineered projects may have lead times of several months. As such, backlog may fluctuate depending upon the timing of large project awards.
Industrial Technology
Our Industrial Technology segment produces fluid handling pumps, materials analysis equipment and consumables, leak testing equipment, flow measurement and metering equipment and water meter and automatic meter reading ("AMR") products and systems. These products and solutions are provided through six reporting units. For 2016, this segment had net sales of $707 million, representing 18.6% of our total net sales.
Fluid Handling Pumps - We manufacture and sell a wide variety of pumps. These pumps vary significantly in complexity and in pumping method employed, which allows for the movement and application of a diverse range of low and high viscosity liquids, high solids content slurries and chemicals. Our pumps are used in end markets such as oil and gas, agricultural, water and wastewater, chemical and general industrial.
Materials Analysis Equipment and Consumables - We manufacture and sell equipment and supply consumables necessary to prepare material samples for testing and analysis. These products are used mostly within the material science, steel, automotive, electronics, mining and research end-user markets.
Water Meter and AMR Products and Systems - We manufacture and distribute water meter products serving the residential, commercial and industrial water management markets, and several lines of automatic meter reading products and systems serving these markets.
The Industrial Technology segment companies' sales reflect a combination of standard products and specially engineered, application-specific products. Standard products are typically shipped within two weeks of receipt of order. Application-specific products typically ship within 6 to 12 weeks following receipt of order. However, larger project orders and blanket purchase orders for certain OEMs may extend shipment for longer periods.
Energy Systems & Controls
Our Energy Systems & Controls segment principally produces control systems, fluid properties testing equipment, industrial valves and controls, vibration sensors and controls and non-destructive inspection and measurement products and solutions, which are provided through six reporting units. For 2016, this segment had net sales of $510 million, representing 13.5% of our total net sales.
Control Systems - We manufacture control systems and provide related engineering and commissioning services for turbomachinery applications, primarily in energy markets.
Fluid Properties Testing Equipment - We manufacture and sell test equipment to determine physical and elemental properties, such as sulfur and nitrogen content, flash point, viscosity, freeze point and distillation range of liquids and gases primarily for the petroleum industry.
Sensors, Controls and Valves - We manufacture sensors and control equipment including pressure sensors, temperature sensors, measurement instruments and control software for global rubber, plastics and process industries. We also manufacture and distribute valves, sensors, switches and control products used on engines, compressors, turbines and other powered equipment for the oil and gas, pipeline, power generation, marine engine and general industrial markets. Many of these products are designed for use in hazardous environments.
Non-destructive Inspection and Measurement Instrumentation - We manufacture non-destructive inspection and measurement solutions including measurement probes, robotics, vibration sensors, switches and transmitters. These solutions are applied principally in nuclear energy markets. Many of these products are designed for use in hazardous environments.
The Energy Systems & Controls segment companies' sales reflect a combination of standard products and large engineered projects. Standard products generally ship within two weeks of receipt of order, and large engineered projects may have lead times of several months. As such, backlog may fluctuate depending upon the timing of large project awards.
Materials and Suppliers
We believe most materials and supplies we use are readily available from numerous sources and suppliers throughout the world. However, some components and sub-assemblies are currently available from a limited number of suppliers. Some high-performance components for digital imaging products can be in short supply and/or suppliers have occasional difficulty manufacturing such components to our specifications. We regularly investigate and identify alternative sources where possible, and we believe these conditions equally affect our competitors. Supply shortages have not had a material adverse effect on our sales although delays in shipments have occurred following such supply interruptions.
Backlog
Our backlog includes only firm unfilled orders expected to be recognized as revenue within twelve months. Backlog was $1.6 billion at December 31, 2016, and $1.1 billion at December 31, 2015.
Distribution and Sales
Distribution and sales occur through direct sales offices, manufacturers' representatives and distributors. In addition, our Medical & Scientific Imaging segment also sells through value added resellers ("VARs") and OEMs.
Environmental Matters and Other Governmental Regulation
Our operations and properties are subject to laws and regulations relating to environmental protection, including those governing air emissions, water discharges, waste management and workplace safety. We use, generate and dispose of hazardous substances and waste in our operations and could be subject to material liabilities relating to the investigation and clean-up of contaminated properties and related claims. We are required to conform our operations and properties to these laws and adapt to regulatory requirements in all countries as these requirements change. In connection with our acquisitions, we may assume significant environmental liabilities, some of which we may not be aware of, or may not be quantifiable, at the time of acquisition. In addition, new laws and regulations, the discovery of previously unknown contamination or the imposition of new requirements could increase our costs or subject us to new or increased liabilities.
Customers
No customer accounted for 10% or more of net sales for 2016 for any of our segments or for our company as a whole.
Competition
Generally, our products and solutions face significant competition, usually from a limited number of competitors. We believe that we are a leader in most of our markets, and no single company competes with us over a significant number of product lines. Competitors might be large or small in size, often depending on the size of the niche market we serve. We compete primarily on product quality, performance, innovation, technology, price, applications expertise, system and service flexibility, distribution channel access and customer service capabilities.
Patents and Trademarks
In addition to trade secrets, unpatented know-how, and other intellectual property rights, we own or license the rights under a number of patents, trademarks and copyrights relating to certain of our products and businesses. We also employ various methods, including confidentiality and non-disclosure agreements with individuals and companies we do business with, employees, distributors, representatives and customers to protect our trade secrets and know-how. We believe our operating units are not substantially dependent on any single patent, trademark, copyright, or other item of intellectual property or group of patents, trademarks or copyrights.
Employees
As of December 31, 2016, we had 14,155 employees, with 10,751 located in the United States. We have 172 employees who are subject to collective bargaining agreements. We have not experienced any work stoppages and consider our relations with our employees to be good.
Available Information
All reports we file electronically with the SEC, including our annual reports on Form 10-K, quarterly reports on Form 10-Q, current reports on Form 8-K and our annual proxy statements, as well as any amendments to those reports, are accessible at no cost on our website at www.ropertech.com as soon as reasonably practicable after we electronically file such material with, or furnish it to, the SEC. These filings are also accessible on the SEC's website at www.sec.gov. You may also read and copy any material we file with the SEC at the SEC's Public Reference Room at 100 F Street, N.E., Washington, D.C. 20549. You may obtain information on the operation of the Public Reference Room by calling the SEC at 1-800-SEC-0330. Our Corporate Governance Guidelines; the charters of our Audit Committee, Compensation Committee, and Nominating and Governance Committee; and our Code of Business Conduct and Ethics are also available on our website. Any amendment to the Code of Business Conduct and Ethics and any waiver applicable to our directors, executive officers or senior financial officers will be posted on our website within the time period required by the SEC and the New York Stock Exchange (the "NYSE"). The information posted on our website is not incorporated into this Annual Report.
We have included the Chief Executive Officer and the Chief Financial Officer certifications regarding our public disclosure required by Section 302 of the Sarbanes-Oxley Act of 2002 as Exhibits 31.1 and 31.2 of this report. Additionally, we filed with the NYSE the Chief Executive Officer certification regarding our compliance with the NYSE's Corporate Governance Listing Standards (the "Listing Standards") pursuant to Section 303A.12(a) of the Listing Standards. We filed the certification with the NYSE on June 21, 2016 and our Chief Executive Officer indicated that he was not aware of any violations of the Listing Standards by us.
Item 1A. RISK FACTORS
| --- | --- |
Risks Relating to Our Business
Our indebtedness may affect our business and may restrict our operating flexibility.
As of December 31, 2016, we had $6.2 billion in total consolidated indebtedness. In addition, we had $535 million undrawn availability under our senior unsecured credit facility. Subject to restrictions contained in our credit facility, we may incur additional indebtedness in the future, including indebtedness incurred to finance acquisitions.
Our level of indebtedness and the debt servicing costs associated with that indebtedness could have important effects on our operations and business strategy. For example, our indebtedness could:
| ● | place us at a competitive disadvantage relative to our competitors, some of which have lower debt service obligations and greater financial resources; |
|---|
| ● | limit our ability to borrow additional funds; |
|---|
| ● | limit our ability to complete future acquisitions; |
|---|
| ● | limit our ability to pay dividends; |
|---|
| ● | limit our ability to make capital expenditures; and |
|---|
| ● | increase our vulnerability to general adverse economic and industry conditions. |
|---|
Our ability to make scheduled principal payments of, to pay interest on, or to refinance our indebtedness and to satisfy our other debt obligations will depend upon our future operating performance, which may be affected by factors beyond our control. In addition, there can be no assurance that future borrowings or equity financing will be available to us on favorable terms for the payment or refinancing of our indebtedness. If we are unable to service our indebtedness, our business, financial condition and results of operations would be materially adversely affected.
Our credit facility contains covenants requiring us to achieve certain financial and operating results and maintain compliance with specified financial ratios. Our ability to meet the financial covenants or requirements in our credit facility may be affected by events beyond our control, and we may not be able to satisfy such covenants and requirements. A breach of these covenants or our inability to comply with the financial ratios, tests or other restrictions contained in our facility could result in an event of default under this facility. Upon the occurrence of an event of default under our credit facility, and the expiration of any grace periods, the lenders could elect to declare all amounts outstanding under the facility, together with accrued interest, to be immediately due and payable. If this were to occur, our assets may not be sufficient to fully repay the amounts due under this facility or our other indebtedness.
Unfavorable changes in foreign exchange rates may harm our business.
Several of our operating companies have transactions and balances denominated in currencies other than the U.S. dollar. Most of these transactions and balances are denominated in euros, Canadian dollars, British pounds or Danish kroner. Sales by our operating companies whose functional currency is not the U.S. dollar represented 20% of our total net sales for each of the years ended December 31, 2016 and 2015. Unfavorable changes in exchange rates between the U.S. dollar and those currencies could significantly reduce our reported sales and earnings.
We export a significant portion of our products. Difficulties associated with the export of our products could harm our business.
Sales to customers outside the U.S. by our businesses located in the U.S. account for a significant portion of our net sales. These sales accounted for 12% of our net sales for the year ended December 31, 2016 and 13% for the year ended December 31, 2015. We are subject to risks that could limit our ability to export our products or otherwise reduce the demand for these products in our foreign markets. Such risks include, without limitation, the following:
| ● | unfavorable changes in or noncompliance with U.S. and other jurisdictions' export requirements; |
|---|
| ● | restrictions on the export of technology and related products; |
|---|
| ● | unfavorable changes in or noncompliance with U.S. and other jurisdictions' export policies to certain countries; |
|---|
| ● | unfavorable changes in the import policies of our foreign markets; and |
|---|
| ● | a general economic downturn in our foreign markets. |
|---|
The occurrence of any of these events could reduce the foreign demand for our products or could limit our ability to export our products and, therefore, could have a material negative effect on our future sales and earnings.
Economic, political and other risks associated with our international operations could adversely affect our business.
As of and for the year ended December 31, 2016, 21% of our net sales and 13% of our long-lived assets, excluding goodwill and intangibles, were attributable to operations outside the U.S. We expect our international operations to contribute materially to our business for the foreseeable future. Our international operations are subject to varying degrees of risk inherent in doing business outside the U.S. including, without limitation, the following:
| ● | adverse changes in a specific country's or region's political or economic conditions, particularly in emerging markets; |
|---|
| ● | oil price shocks; |
|---|
| ● | trade protection measures and import or export requirements; |
|---|
| ● | subsidies or increased access to capital for firms that are currently, or may emerge as, competitors in countries in which we have operations; |
|---|
| ● | partial or total expropriation; |
|---|
| ● | potentially negative consequences from changes in tax laws; |
|---|
| ● | difficulty in staffing and managing widespread operations; |
|---|
| ● | differing labor regulations; |
|---|
| ● | differing protection of intellectual property; and |
|---|
| ● | unexpected changes in regulatory requirements. |
|---|
The occurrence of any of these events could materially harm our business.
Our growth strategy includes acquisitions. We may not be able to identify suitable acquisition candidates, complete acquisitions or integrate acquisitions successfully.
Our future growth is likely to depend to some degree on our ability to acquire and successfully integrate new businesses. We intend to seek additional acquisition opportunities, both to expand into new markets and to enhance our position in existing markets. There are no assurances, however, that we will be able to successfully identify suitable candidates, negotiate appropriate terms, obtain financing on acceptable terms, complete proposed acquisitions, successfully integrate acquired businesses or expand into new markets. Once acquired, operations may not achieve anticipated levels of revenues or profitability.
Acquisitions involve risks, including difficulties in the integration of the operations, technologies, services and products of the acquired companies and the diversion of management's attention from other business concerns. Although our management will endeavor to evaluate the risks inherent in any particular transaction, there are no assurances that we will properly ascertain all such risks. In addition, prior acquisitions have resulted, and future acquisitions could result, in the incurrence of substantial additional indebtedness and other expenses. Future acquisitions may also result in potentially dilutive issuances of equity securities. Difficulties encountered with acquisitions may have a material adverse effect on our business, financial condition and results of operations.
Product liability, insurance risks and increased insurance costs could harm our operating results.
Our business exposes us to product liability risks in the design, manufacturing and distribution of our products. In addition, certain of our products are used in hazardous environments. We currently have product liability insurance; however, we may not be able to maintain our insurance at a reasonable cost or in sufficient amounts to adequately protect us against losses. We also maintain other insurance policies, including directors' and officers' liability insurance. We believe we have adequately accrued estimated losses, principally related to deductible amounts under our insurance policies, with respect to all product liability and other claims, based upon our past experience and available facts. However, a successful product liability or other claim or series of claims brought against us could have a material adverse effect on our business, financial condition and results of operations. In addition, a significant increase in our insurance costs could have an adverse impact on our operating results.
Our operating results could be adversely affected by a reduction of business with our large customers.
In some of our businesses, we derive a significant amount of revenue from large customers. The loss or reduction of any significant contracts with any of these customers could materially reduce our revenue and cash flows. Additionally, many of our customers are government entities. In many situations, government entities can unilaterally terminate or modify our existing contracts without cause and without penalty to the government agency.
We face intense competition. If we do not compete effectively, our business may suffer.
We face intense competition from numerous competitors. Our products compete primarily on the basis of product quality, performance, innovation, technology, price, applications expertise, system and service flexibility, distribution channel access and established customer service capabilities. We may not be able to compete effectively on all of these fronts or with all of our competitors. In addition, new competitors may emerge, and product lines may be threatened by new technologies or market trends that reduce the value of these product lines. To remain competitive, we must develop new products, respond to new technologies and enhance our existing products in a timely manner. We anticipate that we may have to adjust prices to stay competitive.
Changes in the supply of, or price for, raw materials, parts and components used in our products could affect our business.
The availability and prices of raw materials, parts and components are subject to curtailment or change due to, among other things, suppliers' allocations to other purchasers, interruptions in production by suppliers, changes in exchange rates and prevailing price levels. Some high-performance components for digital imaging products may be in short supply and/or suppliers may have occasional difficulty manufacturing these components to meet our specifications. In addition, some of our products are provided by sole source suppliers. Any change in the supply of, or price for, these parts and components, as well as any increases in commodity prices, particularly copper, could affect our business, financial condition and results of operations.
Environmental compliance costs and liabilities could increase our expenses and adversely affect our financial condition.
Our operations and properties are subject to laws and regulations relating to environmental protection, including air emissions, water discharges, waste management and workplace safety. These laws and regulations can result in the imposition of substantial fines and sanctions for violations and could require the installation of pollution control equipment or operational changes to limit pollution emissions and/or decrease the likelihood of accidental hazardous substance releases. We must conform our operations and properties to these laws and adapt to regulatory requirements in the countries in which we operate as these requirements change.
We use and generate hazardous substances and wastes in our operations and, as a result, could be subject to potentially material liabilities relating to the investigation and clean-up of contaminated properties and to claims alleging personal injury. We have experienced, and expect to continue to experience, costs relating to compliance with environmental laws and regulations. In connection with our acquisitions, we may assume significant environmental liabilities, some of which we may not be aware of at the time of acquisition. In addition, new laws and regulations, stricter enforcement of existing laws and regulations, the discovery of previously unknown contamination or the imposition of new clean-up requirements could require us to incur costs or become the basis for new or increased liabilities that could have a material adverse effect on our business, financial condition and results of operations.
Some of the industries in which we operate are cyclical, and, accordingly, our business is subject to changes in the economy.
Some of the business areas in which we operate are subject to specific industry and general economic cycles. Certain businesses are subject to industry cycles, including but not limited to, the industrial and energy markets. Accordingly, a downturn in these or other markets in which we participate could materially adversely affect us. If demand changes and we fail to respond accordingly, our results of operations could be materially adversely affected. The business cycles of our different operations may occur contemporaneously. Consequently, the effect of an economic downturn may have a magnified negative effect on our business.
Our goodwill and intangible assets are valued at an amount that is high relative to our total assets, and a write-off of our intangible assets would negatively affect our results of operations and total capitalization.
Our total assets reflect substantial intangible assets, primarily goodwill. At December 31, 2016, goodwill totaled $8.6 billion compared to $5.8 billion of stockholders' equity, and represented 60% of our total assets of $14.3 billion. The goodwill results from our acquisitions, representing the excess of cost over the fair value of the net assets we have acquired. We assess at least annually whether there has been an impairment in the value of our goodwill and indefinite economic life intangible assets. If future operating performance at one or more of our business units were to fall significantly below current levels, if competing or alternative technologies emerge, if interest rates rise or if business valuations decline, we could incur a non-cash charge to operating earnings. Any determination requiring the write-off of a significant portion of goodwill or unamortized intangible assets would negatively affect our results of operations and total capitalization, the effect of which could be material.
We depend on our ability to develop new products, and any failure to develop or market new products could adversely affect our business.
The future success of our business will depend, in part, on our ability to design and manufacture new competitive products and to enhance existing products so that our products can be sold with high margins. This product development may require substantial internal investment. There can be no assurance that unforeseen problems will not occur with respect to the development, performance or market acceptance of new technologies or products or that we will otherwise be able to successfully develop and market new products. Failure of our products to gain market acceptance or our failure to successfully develop and market new products could reduce our margins, which would have an adverse effect on our business, financial condition and results of operations.
Our technology is important to our success and our failure to protect this technology could put us at a competitive disadvantage.
Many of our products rely on proprietary technology; therefore we believe that the development and protection of intellectual property rights through patents, copyrights, trade secrets, trademarks, confidentiality agreements and other contractual provisions are important to the future success of our business. Despite our efforts to protect proprietary rights, unauthorized parties or competitors may copy or otherwise obtain and use our products or technology. Actions to enforce these rights may result in substantial costs and diversion of resources and we make no assurances that any such actions will be successful.
We rely on information and technology for many of our business operations which could fail and cause disruption to our business operations.
Our business operations are dependent upon information technology networks and systems to securely transmit, process and store electronic information and to communicate among our locations around the world and with clients and vendors. A shutdown of, or inability to access, one or more of our facilities, a power outage or a failure of one or more of our information technology, telecommunications or other systems could significantly impair our ability to perform such functions on a timely basis. Computer viruses, cyberattacks, other external hazards and human error could result in the misappropriation of assets or sensitive information, corruption of data or operational disruption. If sustained or repeated, such a business interruption, system failure, service denial or data loss and damage could result in a deterioration of our ability to write and process business, provide customer service or perform other necessary business functions.
With the types of licensing vehicles we use to deliver our products to market, including subscription and on-demand pricing for our software and services, the recognition of revenue for the products and services we sell could be delayed from one period to another.
As we continue to vary the ways in which we deliver our products to the market, including expanded use of subscription, term and SaaS offerings, we may be required under existing accounting rules to defer the recognition of revenue from one period to another. The deferral of perpetual licenses revenue may result in significant timing differences between the completion of a sale and the actual recognition of the revenue related to that sale. As a result, the revenue we recognize in a particular period may not be reflective of our actual success in selling our products and solutions in the market.
Offering our products on a SaaS basis presents execution risks.
We offer a number of our products in a SaaS-based environment, and we expect to expand those offerings in the future. As more of our solutions are delivered as SaaS-based solutions, it is uncertain whether our strategies will generate the revenue required to be successful. Any significant costs we incur may reduce the operating margins we have previously achieved. Whether we are successful in this new business model depends on our execution in a number of areas, including ensuring that our SaaS-based offerings meet the performance, reliability and cost expectations of our customers and maintain the security of their data. If we are unable to execute on this strategy, our revenue or financial results may be materially adversely affected.
A breach in the security of our software could harm our reputation, result in a loss of current and potential customers, and subject us to material claims, which could materially harm our operating results and financial condition.
If our security measures are breached, an unauthorized party may obtain access to our data or our users' or customers' data. In addition, cyber-attacks and similar acts could lead to interruptions and delays in customer processing or a loss or breach of a customer's data. Because the techniques used to obtain unauthorized access, disable or degrade service, or sabotage systems change frequently and often are not recognized until launched against a target, we may be unable to anticipate these techniques or to implement adequate preventative measures. The risk that these types of events could seriously harm our business is likely to increase as we expand the number of web-based products and services we offer, and operate in more countries.
Regulatory authorities around the world are considering a number of legislative and regulatory proposals concerning data protection. In addition the interpretation and application of consumer and data protection laws in the United States, Europe and elsewhere are often uncertain and in flux. It is possible that these laws may be interpreted and applied in a manner that is inconsistent with our data practices. If so, in addition to the possibility of fines, this could result in an order requiring that we change our data practices, which could have an adverse effect on our business and results of operations.
Any security breaches for which we are, or are perceived to be, responsible, in whole or in part, could subject us to legal claims or legal proceedings, including regulatory investigations, which could harm our reputation and result in significant litigation costs and damage awards or settlement amounts. Any imposition of liability, particularly liability that is not covered by insurance or is in excess of insurance coverage, could materially harm our operating results and financial condition. Security breaches also could cause us to lose current and potential customers, which could have an adverse effect on our business. Moreover, we might be required to expend significant financial and other resources to protect further against security breaches or to rectify problems caused by any security breach.
Any business disruptions due to political instability, armed hostilities, incidents of terrorism or natural disasters could adversely impact our financial performance.
If terrorist activity, armed conflict, political instability or natural disasters occur in the U.S. or other locations, such events may negatively impact our operations, cause general economic conditions to deteriorate or cause demand for our products to decline. A prolonged economic slowdown or recession could reduce the demand for our products, and therefore, negatively affect our future sales and profits. Any of these events could have a significant impact on our business, financial condition or results of operations.
Item 1B. UNRESOLVED STAFF COMMENTS
| --- | --- |
None
Item 2. PROPERTIES
| --- | --- |
Our corporate offices, consisting of 24,000 square feet of leased space, are located at 6901 Professional Parkway East, Sarasota, Florida. We have 120 principal locations around the world to support our operations, of which 51 are manufacturing, assembly and testing facilities, and the remaining 69 locations provide sales, programming, service and administrative support functions. We consider our facilities to be in good operating condition and adequate for their present use and believe we have sufficient capacity to meet our anticipated operating requirements.
The following table summarizes the size, location and usage of our principal properties as of December 31, 2016 (amounts in thousands of square feet).
| Office | Office & Manufacturing | |||
|---|---|---|---|---|
| Segment | Region | Leased | Leased | Owned |
| Medical & Scientific Imaging | ||||
| U.S. | 309 | 298 | 127 | |
| Canada | - | 109 | - | |
| Europe | 32 | 64 | - | |
| Asia-Pacific | 21 | - | - | |
| Mexico | - | 44 | - | |
| RF Technology | ||||
| U.S. | 1,164 | 92 | 16 | |
| Canada | 27 | - | - | |
| Europe | 56 | - | 16 | |
| Asia-Pacific | 111 | - | - | |
| Industrial Technology | ||||
| U.S. | 18 | 260 | 478 | |
| Canada | 36 | - | - | |
| Europe | 13 | 136 | 43 | |
| Asia-Pacific | 23 | - | - | |
| Mexico | - | 60 | - | |
| Energy Systems & Controls | ||||
| U.S. | - | 343 | - | |
| Canada | - | 56 | - | |
| Europe | 29 | 28 | 128 | |
| Asia-Pacific | 6 | 30 | 33 |
Item 3. LEGAL PROCEEDINGS
| --- | --- |
Information pertaining to legal proceedings can be found in Note 12 to the Consolidated Financial Statements included in this Annual Report, and is incorporated by reference herein.
Item 4. MINE SAFETY DISCLOSURES | --- | --- |
None
PART II
Item 5. MARKET FOR REGISTRANT'S COMMON EQUITY, RELATED STOCKHOLDER MATTERS AND ISSUER PURCHASES OF EQUITY SECURITIES
| --- | --- |
Our common stock trades on the NYSE under the symbol "ROP". The table below sets forth the range of high and low sales prices for our common stock as reported by the NYSE as well as cash dividends declared during each of our 2016 and 2015 quarters.
| High | Low | Cash Dividends Declared | |||||||||||
|---|---|---|---|---|---|---|---|---|---|---|---|---|---|
| 2016 | 4th Quarter | $ | 188.04 | $ | 167.91 | $ | 0.35 | ||||||
| 3rd Quarter | 182.84 | 163.33 | 0.30 | ||||||||||
| 2nd Quarter | 184.66 | 164.77 | 0.30 | ||||||||||
| 1st Quarter | 187.56 | 158.89 | 0.30 | ||||||||||
| 2015 | 4th Quarter | $ | 194.83 | $ | 157.75 | $ | 0.30 | ||||||
| 3rd Quarter | 177.08 | 152.93 | 0.25 | ||||||||||
| 2nd Quarter | 177.79 | 167.08 | 0.25 | ||||||||||
| 1st Quarter | 174.02 | 145.75 | 0.25 |
Based on information available to us and our transfer agent, we believe that as of February 16, 2017 there were 143 record holders of our common stock.
Dividends – We have declared a cash dividend in each quarter since our February 1992 initial public offering and we have annually increased our dividend rate since our initial public offering. In November 2016, our Board of Directors increased the quarterly dividend paid January 23, 2017 to $0.35 per share from $0.30 per share, an increase of 17%. The timing, declaration and payment of future dividends will be at the sole discretion of our Board of Directors and will depend upon our profitability, financial condition, capital needs, future prospects and other factors deemed relevant by our Board of Directors.
Recent Sales of Unregistered Securities - In 2016, there were no sales of unregistered securities.
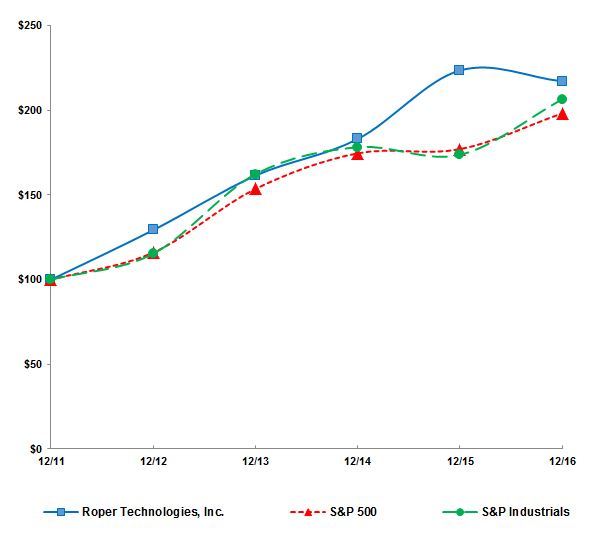
Performance Graph - This performance graph shall not be deemed "filed" for purposes of Section 18 of the Securities Exchange Act of 1934, as amended (the "Exchange Act") or otherwise subject to the liabilities under that Section and shall not be deemed to be incorporated by reference into any of our filings under the Securities Act of 1933, as amended, or under the Exchange Act.
The following graph compares, for the five year period ended December 31, 2016, the cumulative total stockholder return for our common stock, the Standard and Poor's 500 Stock Index (the "S&P 500") and the Standard and Poor's 500 Industrials Index (the "S&P 500 Industrials"). Measurement points are the last trading day of each of our fiscal years ended December 31, 2011, 2012, 2013, 2014, 2015 and 2016. The graph assumes that $100 was invested on December 31, 2011 in our common stock, the S&P 500 and the S&P 500 Industrials and assumes reinvestment of any dividends. The stock price performance on the following graph is not necessarily indicative of future stock price performance.
| 12/31/11 | 12/31/12 | 12/31/13 | 12/31/14 | 12/31/15 | 12/31/16 | ||||||||||||||||||||
|---|---|---|---|---|---|---|---|---|---|---|---|---|---|---|---|---|---|---|---|---|---|---|---|---|---|
| Roper Technologies, Inc. | 100.00 | 129.26 | 161.43 | 183.03 | 223.53 | 217.09 | |||||||||||||||||||
| S&P 500 | 100.00 | 116.00 | 153.58 | 174.60 | 177.01 | 198.18 | |||||||||||||||||||
| S&P 500 Industrials | 100.00 | 115.35 | 162.27 | 178.21 | 173.70 | 206.46 |
The information set forth in Item 12 under the heading "Securities Authorized for Issuance under Equity Compensation Plans" is incorporated herein by reference.
Item 6. SELECTED FINANCIAL DATA
| --- | --- |
You should read the table below in conjunction with "Management's Discussion and Analysis of Financial Condition and Results of Operations" and our Consolidated Financial Statements and related notes included in this Annual Report (amounts in thousands, except per share data).
| As of and for the Years ended December 31, | ||||||||||||||||||||
|---|---|---|---|---|---|---|---|---|---|---|---|---|---|---|---|---|---|---|---|---|
| 2016(1) | 2015(2) | 2014(3) | 2013(4) | 2012(5) | ||||||||||||||||
| Operations data: | ||||||||||||||||||||
| Net sales | $ | 3,789,925 | $ | 3,582,395 | $ | 3,549,494 | $ | 3,238,128 | $ | 2,993,489 | ||||||||||
| Gross profit | 2,332,410 | 2,164,646 | 2,101,899 | 1,882,928 | 1,671,717 | |||||||||||||||
| Income from operations | 1,054,563 | 1,027,918 | 999,473 | 842,361 | 757,587 | |||||||||||||||
| Net earnings | 658,645 | 696,067 | 646,033 | 538,293 | 483,360 | |||||||||||||||
| Per share data: | ||||||||||||||||||||
| Basic earnings per share | $ | 6.50 | $ | 6.92 | $ | 6.47 | $ | 5.43 | $ | 4.95 | ||||||||||
| Diluted earnings per share | 6.43 | 6.85 | 6.40 | 5.37 | 4.86 | |||||||||||||||
| Dividends declared per share | $ | 1.2500 | $ | 1.0500 | $ | 0.8500 | 0.6950 | $ | 0.5775 | |||||||||||
| Balance sheet data: | ||||||||||||||||||||
| Working capital (6) | $ | 331,229 | $ | 897,919 | $ | 884,158 | $ | 730,246 | $ | 159,887 | ||||||||||
| Total assets(7) | 14,324,927 | 10,168,365 | 8,400,185 | 8,169,120 | 7,059,975 | |||||||||||||||
| Long-term debt, net of current portion(7) | 5,808,561 | 3,264,417 | 2,190,282 | 2,437,975 | 1,492,533 | |||||||||||||||
| Stockholders' equity | 5,788,865 | 5,298,947 | 4,755,360 | 4,213,050 | 3,687,726 |
| (1) | Includes results from the acquisitions of CliniSys Group Ltd. from January 7, 2016, PCI Medical Inc. from March 17, 2016, GeneInsight Inc. from April 1, 2016, iSqFt Holdings Inc. (d/b/a ConstructConnect) from October 31, 2016, UNIConnect LC from November 10, 2016 and Deltek Inc. from December 28, 2016. |
|---|
| (2) | Includes results from the acquisitions of Strata Decision Technologies LLC from January 21, 2015, SoftWriters Inc. from February 9, 2015, Data Innovations LLC from March 4, 2015, On Center Software LLC from July 20, 2015, RF IDeas Inc. from September 1, 2015, Atlantic Health Partners LLC from September 4, 2015, Aderant Holdings Inc. from October 21, 2015, Atlas Database Software Corp. from October 26, 2015, Black Diamond Advanced Technologies through March 20, 2015 and Abel Pumps through October 2, 2015. |
|---|
| (3) | Includes results from the acquisitions of Foodlink Holdings Inc. from July 2, 2014, Innovative Product Achievements LLC from August 5, 2014, Strategic Healthcare Programs Holdings LLC from August 14, 2014. |
|---|
| (4) | Includes results from the acquisitions of Managed Health Care Associates Inc. from May 1, 2013 and Advanced Sensors Ltd. from October 4, 2013. |
|---|
| (5) | Includes results from the acquisition of Sunquest Information Systems Inc. from August 22, 2012. |
|---|
| (6) | At December 31, 2016, there were $399 million of senior notes, net of debt issuance costs, due November 15, 2017 and at December 31, 2012, there were $499 million of senior notes, net of debt issuance costs (adjusted due to the retrospective adoption of an accounting standard update which requires that our senior notes be shown net of debt issuance costs), that matured on August 15, 2013, thus requiring a classification as short-term debt, included in working capital. |
|---|
| (7) | Total assets and Long-term debt, net of current portion for 2012 through 2014 have been adjusted due to the retrospective adoption of an accounting standard update which requires that our senior notes be shown net of debt issuance costs. The adjustment amounts were $12,749, $15,861 and $10,574 for the years ended December 31, 2014, 2013 and 2012, respectively. |
|---|
Item 7. MANAGEMENT'S DISCUSSION AND ANALYSIS OF FINANCIAL CONDITION AND RESULTS OF OPERATIONS
| --- | --- |
You should read the following discussion in conjunction with "Selected Financial Data" and our Consolidated Financial Statements and related notes included in this Annual Report.
Overview
We are a diversified technology company. We operate businesses that design and develop software (both license and software-as-a-service) and engineered products and solutions for a variety of niche end markets; including healthcare, transportation, commercial construction, food, energy, water, education and academic research.
We pursue consistent and sustainable growth in earnings and cash flow by emphasizing continuous improvement in the operating performance of our existing businesses and by acquiring other carefully selected businesses. Our acquisitions have represented both additions to existing businesses and new strategic platforms.
In 2016, we acquired CliniSys Group Ltd. ("CliniSys"), PCI Medical Inc., GeneInsight Inc., iSqFt Holdings Inc. (d/b/a ConstructConnect) ("ConstructConnect"), UNIConnect LC, and Project Diamond Holdings Corp. (d/b/a Deltek Inc). The acquisitions both expanded and complemented our existing technologies.
Application of Critical Accounting Policies
Our Consolidated Financial Statements are prepared in conformity with generally accepted accounting principles in the United States ("GAAP"). A discussion of our significant accounting policies can also be found in the notes to our Consolidated Financial Statements for the year ended December 31, 2016 included in this Annual Report.
GAAP offers acceptable alternative methods for accounting for certain issues affecting our financial results, such as determining inventory cost, depreciating long-lived assets and recognizing revenue. We have not changed the application of acceptable accounting methods or the significant estimates affecting the application of these principles in the last three years in a manner that had a material effect on our financial statements.
The preparation of financial statements in accordance with GAAP requires the use of estimates, assumptions, judgments and interpretations that can affect the reported amounts of assets, liabilities, revenues and expenses, the disclosure of contingent assets and liabilities and other supplemental disclosures.
The development of accounting estimates is the responsibility of our management. Our management discusses those areas that require significant judgments with the audit committee of our Board of Directors. The audit committee has reviewed all financial disclosures in our annual filings with the SEC. Although we believe the positions we have taken with regard to uncertainties are reasonable, others might reach different conclusions and our positions can change over time as more information becomes available. If an accounting estimate changes, its effects are accounted for prospectively or through a cumulative catch up adjustment.
Our most significant accounting uncertainties are encountered in the areas of accounts receivable collectibility, inventory valuation, future warranty obligations, revenue recognition (percentage-of-completion), income taxes and goodwill and indefinite-lived asset analyses. These issues affect each of our business segments and are evaluated using a combination of historical experience, current conditions and relatively short-term forecasting.
Accounts receivable collectibility is based on the economic circumstances of customers and credits given to customers after shipment of products, including in certain cases credits for returned products. Accounts receivable are regularly reviewed to determine customers who have not paid within agreed upon terms, whether these amounts are consistent with past experiences, what historical experience has been with amounts deemed uncollectible and the impact that economic conditions might have on collection efforts in general and with specific customers. The returns and other sales credit allowance is an estimate of customer returns, exchanges, discounts or other forms of anticipated concessions and is treated as a reduction in revenue. The returns and other sales credits histories are analyzed to determine likely future rates for such credits. At December 31, 2016, our allowance for doubtful accounts receivable was $12.2 million and our allowance for sales returns and sales credits was $2.3 million, for a total of $14.5 million, or 2.3% of total gross accounts receivable. This percentage is influenced by the risk profile of the underlying receivables, and the timing of write-offs of accounts deemed uncollectible. The total allowance at December 31, 2016 was $2.1 million higher than at December 31, 2015. The allowance will continue to fluctuate as a percentage of sales based on specific identification of allowances needed due to changes in our business, the write-off of uncollectible receivables, and the addition of reserve balances at acquired businesses.
We regularly compare inventory quantities on hand against anticipated future usage, which we determine as a function of historical usage or forecasts related to specific items in order to evaluate obsolescence and excessive quantities. When we use historical usage, this information is also qualitatively compared to business trends to evaluate the reasonableness of using historical information as an estimate of future usage. At December 31, 2016, inventory reserves for excess and obsolete inventory were $37.2 million, or 17.0% of gross inventory cost, as compared to $34.0 million, or 15.2% of gross inventory cost, at December 31, 2015. The inventory reserve as a percent of gross inventory cost will continue to fluctuate based upon specific identification of reserves needed based upon changes in our business as well as the physical disposal of obsolete inventory.
Most of our sales are covered by warranty provisions that generally provide for the repair or replacement of qualifying defective items for a specified period after the time of sale, typically 12 to 24 months. Future warranty obligations are evaluated using, among other factors, historical cost experience, product evolution and customer feedback. Our expense for warranty obligations was less than 1% of net sales for each of the years ended December 31, 2016, 2015 and 2014.
Revenues related to the use of the percentage-of-completion method of accounting are dependent on total costs incurred compared with total estimated costs for a project. During the years ended December 31, 2016, 2015 and 2014 we recognized revenue of $241 million, $253 million and $266 million, respectively, using this method. Percentage-of-completion is used primarily for major turn-key, longer term toll and traffic and energy projects and installations of large software application projects. At December 31, 2016, $260 million of revenue related to unfinished percentage-of-completion contracts had yet to be recognized. Contracts accounted for under this method are generally not significantly different in profitability from revenues accounted for under other methods.
Income taxes can be affected by estimates of whether and within which jurisdictions future earnings will occur and if, how and when cash is repatriated to the U.S., combined with other aspects of an overall income tax strategy. Additionally, taxing jurisdictions could retroactively disagree with our tax treatment of certain items, and some historical transactions have income tax effects going forward. Accounting rules require these future effects to be evaluated using current laws, rules and regulations, each of which can change at any time and in an unpredictable manner. During 2016, our effective income tax rate was 30.0%, which was 60 basis points lower than the 2015 rate of 30.6%, The decrease was due to the recognition of $15.3 million in excess tax benefits in the current year in accordance with an accounting standards update related to stock compensation adopted in the first quarter of 2016 (see Note 1 of the Notes to Consolidated Financial Statements), as well as the non-recurrence of the 2015 taxable gain on the divestiture of Abel Pumps which was partially offset by discrete tax benefits from settlements of tax matters in 2015. We expect the effective tax rate for 2017 to be approximately 30%.
We account for goodwill in a purchase business combination as the excess of the cost over the estimated fair value of net assets acquired. Goodwill, which is not amortized, is tested for impairment on an annual basis in conjunction with our annual forecast process during the fourth quarter, (or an interim basis if an event occurs or circumstances change that would more likely than not reduce the fair value of a reporting unit below its carrying value).
When testing goodwill for impairment, we have the option to first assess qualitative factors to determine whether the existence of events or circumstances leads to a determination that it is more likely than not that the estimated fair value of a reporting unit is less than its carrying amount. If we elect to perform a qualitative assessment and determine that an impairment is more likely than not, we are then required to perform the two-step quantitative impairment test; otherwise, no further analysis is required. Under the qualitative assessment, we consider various qualitative factors, including macroeconomic conditions, relevant industry and market trends, cost factors, overall financial performance, other entity-specific events and events affecting the reporting unit that could indicate a potential change in the fair value of our reporting unit or the composition of its carrying values. We also consider the specific future outlook for the reporting unit.
We also may elect not to perform the qualitative assessment and, instead, proceed directly to the two-step quantitative impairment test. The first step utilizes both an income approach (discounted cash flows) and a market approach consisting of a comparable company earnings multiples methodology to estimate the fair value of a reporting unit. To determine the reasonableness of the estimated fair values, we review the assumptions to ensure that neither the income approach nor the market approach provides significantly different valuations. If the estimated fair value exceeds the carrying value, no further work is required and no impairment loss is recognized. If the carrying value exceeds the estimated fair value, the goodwill of the reporting unit is potentially impaired and then the second step would be completed to measure the impairment loss by calculating the implied fair value of goodwill by deducting the fair value of all tangible and intangible net assets (including unrecognized intangible assets) of the reporting unit from the fair value of the reporting unit. If the implied fair value of goodwill is less than the carrying value of goodwill, an impairment loss would be recognized.
Key assumptions used in the income and market approaches are updated when the analysis is performed for each reporting unit. Various assumptions are utilized including forecasted operating results, strategic plans, economic projections, anticipated future cash flows, the weighted-average cost of capital, comparable transactions, market data and earnings multiples. While we use reasonable and timely information to prepare our cash flow and discount rate assumptions, actual future cash flows or market conditions could differ significantly and could result in future non-cash impairment charges related to recorded goodwill balances.
We have 33 reporting units with individual goodwill amounts ranging from zero to $2.2 billion. In 2016, we performed our annual impairment test in the fourth quarter for all reporting units, excluding those acquired in the fourth quarter of 2016. We conducted our analysis qualitatively and assessed whether it was more likely than not that the respective fair value of these reporting units was less than the carrying amount. We determined that impairment of goodwill was not likely in 28 of our reporting units and thus we were not required to perform a quantitative analysis for these reporting units. For the remaining five reporting units we performed our quantitative analysis and concluded that the fair value of each of these five reporting units was substantially in excess of its carrying value with no impairment indicated as of December 31, 2016. Recently acquired reporting units generally represent the highest risk of impairment, which typically decreases as the businesses are integrated into our enterprise. Negative industry or economic trends, disruptions to our business, actual results significantly below projections, unexpected significant changes or planned changes in the use of the assets, divestitures and market capitalization declines may have a negative effect on the fair value of our reporting units.
Business combinations can also result in other intangible assets being recognized. Amortization of intangible assets, if applicable, occurs over their estimated useful lives. Trade names that are determined to have an indefinite useful economic life are not amortized, but separately tested for impairment during the fourth quarter of the fiscal year or on an interim basis if an event occurs that indicates the fair value is more likely than not below the carrying value. We first qualitatively assess whether the existence of events or circumstances leads to a determination that it is more likely than not that the estimated fair value of a reporting unit is less than its carrying amount. If necessary, we conduct a quantitative review using the relief-from-royalty method, which we believe to be an acceptable methodology due to its common use by valuations specialists in determining the fair value of intangible assets. This methodology assumes that, in lieu of ownership, a third party would be willing to pay a royalty in order to exploit the related benefits of these assets. The fair value of each trade name is determined by applying a royalty rate to a projection of net sales discounted using a risk-adjusted rate of capital. Each royalty rate is determined based on the profitability of the reporting unit to which it relates and observed market royalty rates. Sales growth rates are determined after considering current and future economic conditions, recent sales trends, discussions with customers, planned timing of new product launches or other variables. Reporting units resulting from recent acquisitions generally represent the highest risk of impairment, which typically decreases as the businesses are integrated into our enterprise and positioned for improved future sales growth.
The assessment of fair value for impairment purposes requires significant judgments to be made by management. Although our forecasts are based on assumptions that are considered reasonable by management and consistent with the plans and estimates management uses to operate the underlying businesses, there is significant judgment in determining the expected results attributable to the reporting units. Changes in estimates or the application of alternative assumptions could produce significantly different results. No impairment resulted from the annual reviews performed in 2016.
We evaluate whether there has been an impairment of identifiable intangible assets with definite useful economic lives, or of the remaining life of such assets, when certain indicators of impairment are present. In the event that facts and circumstances indicate that the cost or remaining period of amortization of any asset may be impaired, an evaluation of recoverability would be performed. If an evaluation is required, the estimated future gross, undiscounted cash flows associated with the asset would be compared to the asset's carrying amount to determine if a write-down to fair value or a revision in the remaining amortization period is required.
Results of Operations
The following table sets forth selected information for the years indicated. Dollar amounts are in thousands and percentages are of net sales. Percentages may not foot due to rounding.
| Years ended December 31, | ||||||||||||
|---|---|---|---|---|---|---|---|---|---|---|---|---|
| 2016 | 2015 | 2014 | ||||||||||
| Net sales: | ||||||||||||
| Medical & Scientific Imaging(1) | $ | 1,362,813 | $ | 1,215,318 | $ | 1,080,309 | ||||||
| RF Technology(2) | 1,210,264 | 1,033,951 | 950,227 | |||||||||
| Industrial Technology(3) | 706,625 | 745,381 | 827,145 | |||||||||
| Energy Systems & Controls | 510,223 | 587,745 | 691,813 | |||||||||
| Total | $ | 3,789,925 | $ | 3,582,395 | $ | 3,549,494 | ||||||
| Gross margin: | ||||||||||||
| Medical & Scientific Imaging | 73.2 | % | 74.0 | % | 72.1 | % | ||||||
| RF Technology | 56.7 | 53.4 | 52.8 | |||||||||
| Industrial Technology | 50.6 | 49.8 | 50.5 | |||||||||
| Energy Systems & Controls | 57.1 | 58.1 | 58.3 | |||||||||
| Total | 61.5 | % | 60.4 | % | 59.2 | % | ||||||
| Segment operating margin: | ||||||||||||
| Medical & Scientific Imaging | 35.0 | % | 36.4 | % | 34.8 | % | ||||||
| RF Technology | 30.8 | 30.2 | 28.5 | |||||||||
| Industrial Technology | 28.7 | 28.8 | 29.9 | |||||||||
| Energy Systems & Controls | 25.4 | 27.6 | 29.3 | |||||||||
| Total | 31.2 | % | 31.6 | % | 30.9 | % | ||||||
| Corporate administrative expenses | (3.4 | )% | (2.9 | )% | (2.8 | )% | ||||||
| Income from continuing operations | 27.8 | 28.7 | 28.2 | |||||||||
| Interest expense, net | (2.9 | ) | (2.4 | ) | (2.2 | ) | ||||||
| Other income/(expense) | (0.1 | ) | 1.6 | - | ||||||||
| Income from continuing operations before taxes | 24.8 | 28.0 | 26.0 | |||||||||
| Income taxes | (7.4 | ) | (8.5 | ) | (7.8 | ) | ||||||
| Net earnings | 17.4 | % | 19.4 | % | 18.2 | % |
| (1) | Includes results from the acquisitions of Innovative Product Achievements LLC from August 5, 2014, Strategic Healthcare Programs Holdings LLC from August 14, 2014, Strata Decision Technologies LLC from January 21, 2015, SoftWriters Inc. from February 9, 2015, Data Innovations LLC from March 4, 2015, Atlantic Health Partners LLC from September 4, 2015, Atlas Database Software Corp. from October 26, 2015, CliniSys from January 7, 2016, PCI Medical from March 17, 2016, GeneInsight from April 1, 2016 and UNIConnect from November 10, 2016. |
|---|
| (2) | Includes results from the acquisitions of Foodlink Holdings Inc. from July 2, 2014, On Center Software LLC from July 20, 2015, RF Ideas Inc. from September 1, 2015, Aderant Holdings Inc. from October 21, 2015, Black Diamond Advanced Technologies through March 20, 2015, ConstructConnect from October 31, 2016 and Deltek from December 28, 2016. |
|---|
| (3) | Includes results from Abel Pumps through October 2, 2015. |
|---|
Year Ended December 31, 2016 Compared to Year Ended December 31, 2015
Net sales for the year ended December 31, 2016 were $3.79 billion as compared to sales of $3.58 billion for the year ended December 31, 2015, an increase of 5.8%. The increase was the result of contributions from acquisitions of 6.8%, negative organic growth of 0.3% and a negative foreign exchange impact of 0.7%.
Our Medical & Scientific Imaging segment reported a $147 million or 12% increase in net sales for the year ended December 31, 2016 over the year ended December 31, 2015. Acquisitions contributed 9%, organic sales increased 4% and the negative foreign exchange impact was 1%. The increase in organic sales was due to increased sales in our medical businesses, led by NDI and Verathon. Gross margin decreased to 73.2% in the year ended December 31, 2016 from 74.0% in the year ended December 31, 2015, due primarily to product mix. Selling, general and administrative ("SG&A") expenses as a percentage of net sales increased to 38.2% in the year ended December 31, 2016 as compared to 37.7% in the year ended December 31, 2015, due to a higher SG&A structure in our medical businesses. Operating margin was 35.0% in the year ended December 31, 2016 as compared to 36.4% in the year ended December 31, 2015.
In our RF Technology segment, net sales for the year ended December 31, 2016 increased by $176 million or 17% over the year ended December 31, 2015. Acquisitions net of the divestiture of the Black Diamond Advanced Technology business added 15%, organic sales increased by 3%, and the negative foreign exchange impact was 1%. The increase in organic sales was due primarily to increased sales in our software businesses offset in part by the completion of large service contracts in our toll and traffic businesses in 2015. Gross margin was 56.7% in 2016 as compared to 53.4% in the prior year due to product mix in our toll and traffic businesses as well as an increased percentage of sales at our software businesses which have a higher gross margin. SG&A expenses as a percentage of sales in the year ended December 31, 2016 increased to 25.9%, as compared to 23.3% in the prior year due primarily to an increased percentage of sales at our software businesses which have a higher SG&A structure. Operating margin was 30.8% in 2016 as compared to 30.2% in 2015.
Net sales for our Industrial Technology segment decreased by $39 million or 5.2% for the year ended December 31, 2016 from the year ended December 31, 2015. The divestiture of the Abel Pumps business in 2015 accounted for a negative 3.1%, organic sales decreased by 1.5% and the negative foreign exhange impact was 0.6%. The decrease in organic sales was due primarily to decreased sales in those fluid handling businesses that serve oil and gas markets, offset in part by increased sales in our water metering business. Gross margin increased to 50.6% for the year ended December 31, 2016 as compared to 49.8% in the year ended December 31, 2015 due to product mix. SG&A expenses as a percentage of net sales were 21.9%, as compared to 21.0% in the prior year, due primarily to negative leverage on lower sales volume. The resulting operating margin was 28.7% in the year ended December 31, 2016 as compared to 28.8% in the year ended December 31, 2015.
In our Energy Systems & Controls segment, net sales for the year ended December 31, 2016 decreased by $78 million or 13% from the year ended December 31, 2015. Organic sales decreased by 12% due to decreased sales in oil and gas products, including safety systems and valves, and the negative foreign exchange impact was 1%. Gross margin decreased to 57.1% in the year ended December 31, 2016 as compared to 58.1% in the year ended December 31, 2015 and SG&A expenses as a percentage of net sales increased to 31.7% as compared to 30.5% in the prior year, both of which were due negative leverage on lower sales volume. Operating margin was 25.4% in the year ended December 31, 2016 as compared to 27.6% in the year ended December 31, 2015.
Corporate expenses increased by $24.7 million to $127.5 million, or 3.4% of sales, in 2016 as compared to $102.8 million, or 2.9% of sales, in 2015. The increase was due primarily to increased equity compensation costs as a result of both an increase in the number of shares granted in the current year and increases in our common stock price and increased costs related to acquisitions.
Interest expense increased $27.3 million, or 32.5%, for the year ended December 31, 2016 compared to the year ended December 31, 2015. The increase is due primarily to higher average debt balances to fund current year acquisitions as well as higher average interest rates throughout 2016.
Other expense of $1.5 million for the year ended December 31, 2016 was composed primarily of foreign exchange losses at our non-U.S. based companies, offset in part by royalty income. Other income of $58.7 million for the year ended December 31, 2015 was composed primarily of the $70.9 million gain from the divestiture of Abel Pumps (see Note 2 of the Notes to Consolidated Financial Statements included in this Annual Report), offset in part by a $9.5 million impairment charge on a minority investment.
During 2016, our effective income tax rate was 30.0%, which was 60 basis points lower than the 2015 rate of 30.6%. The decrease was due to the recognition of $15.3 million in excess tax benefits in the current year in accordance with an ASU related to stock compensation adopted in the first quarter of 2016 (see Note 1 of the Notes to Consolidated Financial Statements), as well as the non-recurrence of the 2015 taxable gain on the divestiture of Abel Pumps which was partially offset by discrete tax benefits from settlements of tax matters in 2015.
At December 31, 2016, the functional currencies of most of our non-U.S. subsidiaries were weaker, and the Canadian dollar was stronger, against the U.S. dollar compared to currency exchange rates at December 31, 2015. The net result of these changes led to a pre-tax decrease in the foreign exchange component of comprehensive earnings of $115 million in the year ended December 31, 2016. Approximately $52 million of this amount related to goodwill and is not expected to directly affect our projected future cash flows. For the entire year of 2016, operating profit decreased by less than 1% due to fluctuations in non-U.S. currencies.
The following table summarizes our net order information for the years ended December 31, 2016 and 2015 (dollar amounts in thousands).
| 2016 | 2015 | change | ||||||||||
|---|---|---|---|---|---|---|---|---|---|---|---|---|
| Medical & Scientific Imaging | $ | 1,399,007 | $ | 1,235,143 | 13.3 | % | ||||||
| RF Technology | 1,278,246 | 1,024,999 | 24.7 | |||||||||
| Industrial Technology | 704,622 | 731,810 | (3.7 | ) | ||||||||
| Energy Systems & Controls | 514,300 | 555,672 | (7.4 | ) | ||||||||
| Total | $ | 3,896,175 | $ | 3,547,624 | 9.8 | % |
The increase in orders was due to orders from acquisitions which added 8%, organic growth of 3% and a 1% negative foreign exchange impact.
The following table summarizes order backlog information at December 31, 2016 and 2015 (dollar amounts in thousands). We include in backlog only orders that are expected to be recognized as revenue within twelve months. The increase in backlog was due to acquisitions which added 37% and internal growth of 10%.
| 2016 | 2015 | change | ||||||||||
|---|---|---|---|---|---|---|---|---|---|---|---|---|
| Medical & Scientific Imaging | $ | 423,616 | $ | 373,213 | 13.5 | % | ||||||
| RF Technology | 991,212 | 538,877 | 83.9 | |||||||||
| Industrial Technology | 65,259 | 68,002 | (4.0 | ) | ||||||||
| Energy Systems & Controls | 92,309 | 90,365 | 2.2 | |||||||||
| Total | $ | 1,572,396 | $ | 1,070,457 | 46.9 | % |
Year Ended December 31, 2015 Compared to Year Ended December 31, 2014
Net sales for the year ended December 31, 2015 were $3.58 billion as compared to sales of $3.55 billion for the year ended December 31, 2014, an increase of 1%. The increase was the result of contributions from acquisitions of 4%, negative organic growth of 0.3% and a negative foreign exchange impact of 3%.
Our Medical & Scientific Imaging segment reported a $135 million or 12.5% increase in net sales for the year ended December 31, 2015 over the year ended December 31, 2014. Acquisitions contributed 11.5%, organic sales increased 3.8% and the negative foreign exchange impact was 2.8%. The increase in organic sales was due to increased sales in our medical businesses, led by Verathon and Managed Health Care Associates ("MHA"). Gross margin increased to 74.0% in the year ended December 31, 2015 from 72.1% in the year ended December 31, 2014, due primarily to additional sales from medical products which have a higher gross margin. Selling, general and administrative ("SG&A") expenses as a percentage of net sales were relatively unchanged at 37.7% in the year ended December 31, 2015 as compared to 37.4% in the year ended December 31, 2014. Operating margin was 36.4% in the year ended December 31, 2015 as compared to 34.8% in the year ended December 31, 2014.
In our RF Technology segment, net sales for the year ended December 31, 2015 increased by $84 million or 9% over the year ended December 31, 2014. Organic sales increased by 6%, acquisitions net of the divestiture of the Black Diamond Advanced Technology business added 4% and the negative foreign exchange impact was 1%. The increase in organic sales was due primarily to growth in our toll and traffic and freight matching businesses. Gross margin was 53.4% in 2015 as compared to 52.8% in the prior year due to leverage on higher sales volume and product mix. SG&A expenses as a percentage of sales in the year ended December 31, 2015 were 23.3%, a decrease from 24.3% in the prior year due to operating leverage on higher sales volume. Operating margin was 30.2% in 2015 as compared to 28.5% in 2014.
Net sales for our Industrial Technology segment decreased by $82 million or 10% for the year ended December 31, 2015 from the year ended December 31, 2014. Organic sales decreased by 4%, the negative foreign exhange impact was 4% and the divestiture of the Abel Pumps business accounted for a negative 2%. The decrease in organic sales was due primarily to decreased sales in those fluid handling businesses that serve oil and gas markets. Gross margin decreased to 49.8% for the year ended December 31, 2015 as compared to 50.5% in the year ended December 31, 2014 due to negative leverage on lower sales volume. SG&A expenses as a percentage of net sales were 21.0%, as compared to 20.5% in the prior year, due primarily to negative leverage on lower sales volume. The resulting operating margin was 28.8% in the year ended December 31, 2015 as compared to 29.9% in the year ended December 31, 2014.
In our Energy Systems & Controls segment, net sales for the year ended December 31, 2015 decreased by $104 million or 15% from the year ended December 31, 2014. Organic sales decreased by 10% due to decreased sales in oil and gas products, including safety systems and valves, and the negative foreign exchange impact was 5%. Gross margin was relatively unchanged at 58.1% in the year ended December 31, 2015, compared to 58.3% in the year ended December 31, 2014. SG&A expenses as a percentage of net sales were 30.5% as compared to 28.9% in the prior year due negative leverage on lower sales volume. Operating margin was 27.6% in the year ended December 31, 2015 as compared to 29.3% in the year ended December 31, 2014.
Corporate expenses increased by $4.6 million to $102.8 million, or 2.9% of sales, in 2015 as compared to $98.2 million, or 2.8% of sales, in 2014. The increase was due primarily to increased costs related to acquisitions.
Interest expense increased $5.6 million, or 7.1%, for the year ended December 31, 2015 compared to the year ended December 31, 2014. The increase is due primarily to higher average debt balances offset in part by lower average interest rates throughout 2015.
Other income of $58.7 million for the year ended December 31, 2015 was composed primarily of the $70.9 million gain from the divestiture of Abel Pumps (see Note 2 of the Notes to Consolidated Financial Statements included in this Annual Report), offset in part by a $9.5 million impairment charge on a minority investment. Other income of $0.6 million for the year ended December 31, 2014 was composed of royalty income and foreign exchange gains at our non-U.S. based companies, offset in part by losses from asset disposals.
During 2015, our effective income tax rate was 30.6%, which was 70 basis points higher than the 2014 rate of 29.9%. The taxable gain on the divestiture of Abel Pumps led to an increase of 130 basis points, and was offset in part by discrete tax benefits from settlements of tax matters.
At December 31, 2015, the functional currencies of most of our non-U.S. subsidiaries were weaker against the U.S. dollar compared to currency exchange rates at December 31, 2014. The net result of these changes led to a pre-tax decrease in the foreign exchange component of comprehensive earnings of $146 million in the year ended December 31, 2015. Approximately $62 million of this amount related to goodwill and is not expected to directly affect our projected future cash flows. For the entire year of 2015, operating profit decreased by approximately 2% due to fluctuations in non-U.S. currencies.
The following table summarizes our net order information for the years ended December 31, 2015 and 2014 (dollar amounts in thousands).
| 2015 | 2014 | change | ||||||||||
|---|---|---|---|---|---|---|---|---|---|---|---|---|
| Medical & Scientific Imaging | $ | 1,235,143 | $ | 1,081,190 | 14.2 | % | ||||||
| RF Technology | 1,024,999 | 955,831 | 7.2 | |||||||||
| Industrial Technology | 731,810 | 808,921 | (9.5 | ) | ||||||||
| Energy Systems & Controls | 555,672 | 692,136 | (19.7 | ) | ||||||||
| Total | $ | 3,547,624 | $ | 3,538,078 | 0.3 | % |
The increase in orders was due to orders from acquisitions which added 5%, offset by negative organic growth of 2% and a 3% negative foreign exchange impact.
The following table summarizes order backlog information at December 31, 2015 and 2014 (dollar amounts in thousands). We include in backlog only orders that are expected to be recognized as revenue within twelve months.
| 2015 | 2014 | change | ||||||||||
|---|---|---|---|---|---|---|---|---|---|---|---|---|
| Medical & Scientific Imaging | $ | 373,213 | $ | 296,098 | 26.0 | % | ||||||
| RF Technology | 538,877 | 520,727 | 3.5 | |||||||||
| Industrial Technology | 68,002 | 97,507 | (30.3 | ) | ||||||||
| Energy Systems & Controls | 90,365 | 126,838 | (28.8 | ) | ||||||||
| Total | $ | 1,070,457 | $ | 1,041,170 | 2.8 | % |
Financial Condition, Liquidity and Capital Resources
Selected cash flows for the years ended December 31, 2016, 2015 and 2014 are as follows (in millions):
| 2016 | 2015 | 2014 | ||||||||||
|---|---|---|---|---|---|---|---|---|---|---|---|---|
| Cash provided by/(used in): | ||||||||||||
| Operating activities | $ | 964 | $ | 929 | $ | 840 | ||||||
| Investing activities | (3,753 | ) | (1,698 | ) | (348 | ) | ||||||
| Financing activities | 2,805 | 996 | (298 | ) |
Operating activities - The increase in cash provided by operating activities in 2016 was primarily due to increased earnings net of non-cash charges and higher deferred revenue balances due to an increased percentage of revenue from software and other subscription based products, offset in part by income tax payments in the first quarter of 2016 related to the gain on the sale of the Abel Pumps business in the fourth quarter of 2015. The increase in cash provided by operating activities in 2015 was due to increased earnings net of intangible amortization related to acquisitions, the collection of $49 million of receivables due from the Puerto Rico Highways and Transportation Authority and higher deferred revenue balances due to an increased percentage of revenue from software and other subscription based products.
Investing activities - Cash used in investing activities during 2016, 2015 and 2014 was primarily for business acquisitions. Cash received from investing activities in 2015 was primarily proceeds from the sale of the Abel Pumps business.
Financing activities - Cash used in financing activities in all periods presented was primarily debt repayments as well as dividends paid to stockholders. Cash provided by financing activities during 2016 was primarily from the issuance of $1.2 billion of senior notes and revolving debt borrowings for acquisitions. Cash provided by financing activities during 2015 was primarily the issuance of $900 million of senior notes and revolving debt borrowings for acquisitions.
Net working capital (current assets, excluding cash, less total current liabilities, excluding debt) was a negative $25 million at December 31, 2016 compared to $126 million at December 31, 2015, due primarily to increases in deferred revenue balances due to an increased percentage of revenue from software and other subscription based products. We acquired negative net working capital of $128 million through business acquisitions during 2016. The negative acquired working capital was due primarily to $203 million in deferred revenue balances.
Total debt was $6.2 billion at December 31, 2016 (51.8% of total capital) compared to $3.3 billion at December 31, 2015 (38.3% of total capital). Our increased debt at December 31, 2016 compared to December 31, 2015 was due to debt borrowings for 2016 acquisitions.
On December 19, 2016, we completed a public offering of $500 million aggregate principal amount of 2.80% senior unsecured notes due December 15, 2021, issued at 99.843% of their principal amount, and $700 million aggregate principal amount of 3.80% senior unsecured notes due December 15, 2026, issued at 99.984% of their principal amount. Net proceeds of $1.19 billion were used in the acquisition of Deltek (see Note 2 of the Notes to Consolidated Financial Statements). The senior notes are unsecured senior obligations of the Company and rank senior in right of payment with all of our existing and future subordinated indebtedness and rank equally in right of payment with all of our existing and future unsecured senior indebtedness. The notes are effectively subordinated to any of our existing and future secured indebtedness to the extent of the value of the collateral securing such indebtedness. The notes are not guaranteed by any of our subsidiaries and are effectively subordinated to all existing and future indebtedness and other liabilities of our subsidiaries.
The notes bear interest at a fixed rate of 2.80% and 3.80% per year, respectively, payable semi-annually in arrears on June 15 and December 15 of each year, beginning June 15, 2017.
We may redeem some or all of these notes at any time or from time to time, at 100% of their principal amount, plus a make-whole premium based on a spread to U.S. Treasury securities.
On September 23, 2016, we entered into a new five-year unsecured credit facility (the "2016 Facility") with JPMorgan Chase Bank, N.A., as administrative agent, and a syndicate of lenders, which replaced our previous unsecured credit facility, dated as of July 27, 2012, as amended as of October 28, 2015 (the "2012 Facility"). The 2016 Facility comprises a five year $2.50 billion revolving credit facility, which includes availability of up to $150.0 million for letters of credit. We may also, subject to compliance with specified conditions, request term loans or additional revolving credit commitments in an aggregate amount not to exceed $500 million. We recorded as other expense a $0.9 million non-cash debt extinguishment charge in the fourth quarter related to the early termination of the 2012 Facility, which represented the unamortized fees associated with the 2012 Facility.
The 2016 Facility contains various affirmative and negative covenants which, among other things, limit our ability to incur new debt, enter into certain mergers and acquisitions, sell assets and grant liens, make restricted payments (including the payment of dividends on our common stock) and capital expenditures, or change our line of business. We also are subject to financial covenants which require us to limit our consolidated total leverage ratio and to maintain a consolidated interest coverage ratio. The most restrictive covenant is the consolidated total leverage ratio which is limited to 3.5 to 1.
On December 2, 2016, we amended the 2016 Facility to allow the consolidated total leverage ratio be increased, no more than twice during the term of the 2016 Facility, to 4.0 to 1 for a consecutive four quarter fiscal period per increase (or, for any portion of such four quarter fiscal period in which the maximum would be 4.25 to 1 pursuant to the 2016 facility amendment, 4.25 to 1). In conjunction with the Deltek acquistion (see Note 2 of the Notes to Consolidated Financial Statements), we increased the maximum consolidated total leverage ratio covenant to 4.25 to 1 through June 30, 2017 and 4.00 to 1 through December 31, 2017.
At December 31, 2016, we had $4.3 billion of senior unsecured notes and $1.93 billion of outstanding revolver borrowings. In addition, we had $3.0 million of other debt in the form of capital leases and several smaller facilities that allow for borrowings or the issuance of letters of credit in foreign locations to support our non-U.S. businesses. We had $74.1 million of outstanding letters of credit at December 31, 2016, of which $34.8 million was covered by our lending group, thereby reducing our revolving credit capacity commensurately.
We were in compliance with all debt covenants related to our credit facility throughout the years ended December 31, 2016 and 2015.
See Note 8 of the Notes to Consolidated Financial Statements included in this Annual Report for additional information regarding our credit facility and senior notes.
Cash and cash equivalents at our foreign subsidiaries at December 31, 2016 totaled $557 million. Repatriation of these funds under current regulatory and tax law for use in domestic operations would expose us to additional taxes. We consider this cash to be permanently reinvested. We expect existing cash and cash equivalents, cash generated by our U.S. operations, our unsecured credit facility, as well as our expected ability to access the capital markets, will be sufficient to fund operating requirements in the U.S. for the foreseeable future.
Capital expenditures of $37.3 million, $36.3 million and $37.6 million were incurred during 2016, 2015 and 2014, respectively. In the future, we expect capital expenditures as a percentage of sales to be between 1.0% and 1.5% of annual net sales.
Contractual Cash Obligations and Other Commercial Commitments and Contingencies
The following tables quantify our contractual cash obligations and commercial commitments at December 31, 2016 (in thousands).
| Payments Due in Fiscal Year | ||||||||||||||||||||||||||||
|---|---|---|---|---|---|---|---|---|---|---|---|---|---|---|---|---|---|---|---|---|---|---|---|---|---|---|---|---|
| Contractual Cash Obligations1 | Total | 2017 | 2018 | 2019 | 2020 | 2021 | Thereafter | |||||||||||||||||||||
| Long-term debt | $ | 6,230,003 | $ | 400,003 | $ | 800,000 | $ | 500,000 | $ | 600,000 | $ | 500,000 | $ | 3,430,000 | ||||||||||||||
| Senior note interest | 719,557 | 139,900 | 129,325 | 106,608 | 85,025 | 67,269 | 191,430 | |||||||||||||||||||||
| Capital leases | 2,986 | 1,592 | 840 | 407 | 147 | - | - | |||||||||||||||||||||
| Operating leases | 248,530 | 60,536 | 46,080 | 35,341 | 29,726 | 25,177 | 51,670 | |||||||||||||||||||||
| Total | $ | 7,201,076 | $ | 602,031 | $ | 976,245 | $ | 642,356 | $ | 714,898 | $ | 592,446 | $ | 3,673,100 |
| Amounts Expiring in Fiscal Year | ||||||||||||||||||||||||||||
|---|---|---|---|---|---|---|---|---|---|---|---|---|---|---|---|---|---|---|---|---|---|---|---|---|---|---|---|---|
| Other Commercial Commitments | Total Amount Committed | 2017 | 2018 | 2019 | 2020 | 2021 | Thereafter | |||||||||||||||||||||
| Standby letters of credit and bank guarantees | $ | 74,071 | $ | 26,223 | $ | 1,961 | $ | 428 | $ | 104 | $ | 33,642 | $ | 11,713 |
| 1 | We have excluded $29 million related to the liability for uncertain tax positions from the tables as the current portion is not material, and we are not able to reasonably estimate the timing of the long-term portion of the liability. See Note 7 of the Notes to Consolidated Financial Statements included in this Annual Report. |
|---|
As of December 31, 2016, we had $521 million of outstanding surety bonds. Certain contracts, primarily those involving public sector customers, require us to provide a surety bond as a guarantee of its performance of contractual obligations.
We believe that internally generated cash flows and the remaining availability under our credit facility will be adequate to finance normal operating requirements and future acquisition activities. Although we maintain an active acquisition program, any future acquisitions will be dependent on numerous factors and it is not feasible to reasonably estimate if or when any such acquisitions will occur and what the impact will be on our activities, financial condition and results of operations. We may also explore alternatives to attract additional capital resources.
We anticipate that our businesses will generate positive cash flows from operating activities, and that these cash flows will permit the reduction of currently outstanding debt in accordance with the repayment schedule. However, the rate at which we can reduce our debt during 2017 (and reduce the associated interest expense) will be affected by, among other things, the financing and operating requirements of any new acquisitions and the financial performance of our existing companies. None of these factors can be predicted with certainty.
Off-Balance Sheet Arrangements
At December 31, 2016 and 2015, we did not have any relationships with unconsolidated entities or financial partnerships, such as entities often referred to as structured finance or special purpose entities, which would have been established for the purpose of facilitating off-balance sheet arrangements or other contractually narrow or limited purposes.
Recently Issued Accounting Standards
See Note 1 of the Notes to Consolidated Financial Statements included in this Annual Report for information regarding the effect of new accounting pronouncements on our financial statements.
Item 7A. QUANTITATIVE AND QUALITATIVE DISCLOSURES ABOUT MARKET RISK
| --- | --- |
We are exposed to interest rate risks on our outstanding revolving credit borrowings, and to foreign currency exchange risks on our transactions denominated in currencies other than the U.S. dollar. We are also exposed to equity market risks pertaining to the traded price of our common stock.
At December 31, 2016, we had $4.3 billion of fixed rate borrowings with interest rates ranging from 1.85% to 6.25%. At December 31, 2016, the prevailing market rates for our long-term notes were between 0.9% higher and 2.9% lower than the fixed rates on our debt instruments. Our credit facility contains a $2.5 billion variable-rate revolver with $1.93 billion of outstanding borrowings at December 31, 2016.
Several of our businesses have transactions and balances denominated in currencies other than the U.S. dollar. Most of these transactions or balances are denominated in euros, Canadian dollars, British pounds or Danish kroner. Sales by companies whose functional currency was not the U.S. dollar were 20% of our total sales in 2016 and 61% of these sales were by companies with a European functional currency. If these currency exchange rates had been 10% different throughout 2016 compared to currency exchange rates actually experienced, the impact on our net earnings would have been approximately 2%.
The trading price of our common stock influences the valuation of stock award grants and the effects these grants have on our results of operations. The stock price also influences the computation of potentially dilutive common stock which includes both stock awards and the premium over the conversion price on senior subordinated convertible notes to determine diluted earnings per share. The stock price also affects our employees' perceptions of programs that involve our common stock. We believe the quantification of the effects of these changing prices on our future earnings and cash flows is not readily determinable.
Item 8. FINANCIAL STATEMENTS AND SUPPLEMENTARY DATA
| --- | --- |
INDEX TO CONSOLIDATED FINANCIAL STATEMENTS AND SUPPLEMENTARY DATA
| Page | |
|---|---|
| Consolidated Financial Statements: | |
| Report of Independent Registered Certified Public Accounting Firm (PricewaterhouseCoopers LLP) | 31 |
| Consolidated Balance Sheets as of December 31, 2016 and 2015 | 32 |
| Consolidated Statements of Earnings for the Years ended December 31, 2016 , 2015 and 2014 | 33 |
| Consolidated Statements of Comprehensive Income for the Years ended December 31, 2016 , 2015 and 2014 | 34 |
| Consolidated Statements of Stockholders' Equity for the Years ended December 31, 2016 , 2015 and 2014 | 35 |
| Consolidated Statements of Cash Flows for the Years ended December 31, 2016 , 2015 and 2014 | 36 |
| Notes to Consolidated Financial Statements | 38 |
| Supplementary Data: | |
| Schedule II - Consolidated Valuation and Qualifying Accounts for the Years ended December 31, 2016 , 2015 and 2014 | 61 |
Report of Independent Registered Certified Public Accounting Firm
To the Stockholders of Roper Technologies, Inc.:
In our opinion, the accompanying consolidated balance sheets and the related consolidated statements of earnings, of comprehensive income, of stockholders' equity, and of cash flows, present fairly, in all material respects, the financial position of Roper Technologies, Inc. and its subsidiaries (the "Company") at December 31, 2016 and December 31, 2015, and the results of their operations and their cash flows for each of the three years in the period ended December 31, 2016 in conformity with accounting principles generally accepted in the United States of America. In addition, in our opinion, the financial statement schedule listed in the index appearing under Item 15(a)(2) presents fairly, in all material respects, the information set forth therein when read in conjunction with the related consolidated financial statements. Also in our opinion, the Company maintained, in all material respects, effective internal control over financial reporting as of December 31, 2016, based on criteria established in Internal Control - Integrated Framework 2013 issued by the Committee of Sponsoring Organizations of the Treadway Commission (COSO). The Company's management is responsible for these financial statements and financial statement schedule, for maintaining effective internal control over financial reporting and for its assessment of the effectiveness of internal control over financial reporting, included in Management's Report on Internal Control over Financial Reporting appearing under Item 9A. Our responsibility is to express opinions on these financial statements, on the financial statement schedule and on the Company's internal control over financial reporting based on our integrated audits. We conducted our audits in accordance with the standards of the Public Company Accounting Oversight Board (United States). Those standards require that we plan and perform the audits to obtain reasonable assurance about whether the financial statements are free of material misstatement and whether effective internal control over financial reporting was maintained in all material respects. Our audits of the financial statements included examining, on a test basis, evidence supporting the amounts and disclosures in the financial statements, assessing the accounting principles used and significant estimates made by management, and evaluating the overall financial statement presentation. Our audit of internal control over financial reporting included obtaining an understanding of internal control over financial reporting, assessing the risk that a material weakness exists, and testing and evaluating the design and operating effectiveness of internal control based on the assessed risk. Our audits also included performing such other procedures as we considered necessary in the circumstances. We believe that our audits provide a reasonable basis for our opinions.
A company's internal control over financial reporting is a process designed to provide reasonable assurance regarding the reliability of financial reporting and the preparation of financial statements for external purposes in accordance with generally accepted accounting principles. A company's internal control over financial reporting includes those policies and procedures that (i) pertain to the maintenance of records that, in reasonable detail, accurately and fairly reflect the transactions and dispositions of the assets of the company; (ii) provide reasonable assurance that transactions are recorded as necessary to permit preparation of financial statements in accordance with generally accepted accounting principles, and that receipts and expenditures of the company are being made only in accordance with authorizations of management and directors of the company; and (iii) provide reasonable assurance regarding prevention or timely detection of unauthorized acquisition, use, or disposition of the company's assets that could have a material effect on the financial statements.
Because of its inherent limitations, internal control over financial reporting may not prevent or detect misstatements. Also, projections of any evaluation of effectiveness to future periods are subject to the risk that controls may become inadequate because of changes in conditions, or that the degree of compliance with the policies or procedures may deteriorate. As described in Management's Report on Internal Control over Financial Reporting, management has excluded acquisitions completed during 2016 from its assessment of internal control over financial reporting as of December 31, 2016 because they were acquired by the Company in purchase business combinations during 2016. We have also excluded acquisitions completed during 2016 from our audit of internal control over financial reporting. These acquisitions are wholly-owned subsidiaries whose total assets and total revenues represent 2.1% and 2.6%, respectively, of the related consolidated financial statement amounts as of and for the year ended December 31, 2016.
/s/ PricewaterhouseCoopers LLP
Tampa, Florida
February 27, 2017
ROPER TECHNOLOGIES, INC. AND SUBSIDIARIES
CONSOLIDATED BALANCE SHEETS
December 31, 2016 and 2015
(in thousands, except per share data)
| 2016 | 2015 | |||||||
|---|---|---|---|---|---|---|---|---|
| Assets | ||||||||
| Cash and cash equivalents | $ | 757,200 | $ | 778,511 | ||||
| Accounts receivable, net | 619,854 | 488,271 | ||||||
| Inventories, net | 181,952 | 189,868 | ||||||
| Income taxes receivable | 31,679 | - | ||||||
| Unbilled receivables | 129,965 | 122,042 | ||||||
| Other current assets | 55,851 | 39,355 | ||||||
| Total current assets | 1,776,501 | 1,618,047 | ||||||
| Property, plant and equipment, net | 141,318 | 105,510 | ||||||
| Goodwill | 8,647,142 | 5,824,726 | ||||||
| Other intangible assets, net | 3,655,843 | 2,528,996 | ||||||
| Deferred taxes | 30,620 | 31,532 | ||||||
| Other assets | 73,503 | 59,554 | ||||||
| Total assets | $ | 14,324,927 | $ | 10,168,365 | ||||
| Liabilities and Stockholders' Equity | ||||||||
| Accounts payable | $ | 152,067 | $ | 139,737 | ||||
| Accrued compensation | 161,730 | 119,511 | ||||||
| Deferred revenue | 488,399 | 267,030 | ||||||
| Other accrued liabilities | 219,339 | 168,513 | ||||||
| Income taxes payable | 22,762 | 18,532 | ||||||
| Current portion of long-term debt, net | 400,975 | 6,805 | ||||||
| Total current liabilities | 1,445,272 | 720,128 | ||||||
| Long-term debt, net of current portion | 5,808,561 | 3,264,417 | ||||||
| Deferred taxes | 1,178,205 |
Showing the first 8K of 120K characters. Open the full section
Item 9. CHANGES IN AND DISAGREEMENTS WITH ACCOUNTANTS ON ACCOUNTING AND FINANCIAL DISCLOSURE
| --- | --- |
There have been no changes in accountants or disagreements with accountants on accounting and financial disclosures.
Item 9A. CONTROLS AND PROCEDURES
| --- | --- |
Management's Report on Internal Control over Financial Reporting
Our management is responsible for establishing and maintaining adequate control over financial reporting, as such term is defined in Exchange Act Rules 13a-15(f) and 15d-15(f). Under the supervision and with the participation of our management, including our principal executive officer and principal financial officer, we conducted an evaluation of the effectiveness of our internal control over financial reporting based on the framework in Internal Control-Integrated Framework (2013) issued by the Committee of Sponsoring Organizations of the Treadway Commission. Based on our evaluation under the framework in Internal Control-Integrated Framework, our management concluded that our internal control over financial reporting was effective as of December 31, 2016. Our internal control over financial reporting as of December 31, 2016 has been audited by PricewaterhouseCoopers LLP, an independent registered certified public accounting firm, as stated in their report which is included herein.
Our management excluded acquisitions completed during 2016 from its assessment of internal control over financial reporting as of December 31, 2016. These acquisitions are wholly-owned subsidiaries whose excluded aggregate assets represent 2.1%, and whose aggregate total revenues represent 2.6%, of the related consolidated financial statement amounts as of and for the year ended December 31, 2016.
Evaluation of Disclosure Controls and Procedures
As required by SEC rules, we have evaluated the effectiveness of the design and operation of our disclosure controls and procedures as of the end of the period covered by this report. This evaluation was carried out under the supervision and with the participation of our management, including our principal executive officer and principal financial officer. Based on this evaluation, we have concluded that our disclosure controls and procedures were effective as of December 31, 2016; however, through an administrative oversight, we late filed a required Current Report on Form 8-K related to the closing of Deltek acquisition that was due on January 3, 2017 and have since taken appropriate steps to remediate the deficiency in our disclosure controls and procedures
Disclosure controls and procedures are our controls and other procedures designed to ensure that information required to be disclosed by us in the reports that we file or submit under the Exchange Act is recorded, processed, summarized and reported, within the time periods specified in the SEC's rules and forms. Disclosure controls and procedures include, without limitation, controls and procedures designed to ensure that information required to be disclosed by us in the reports that we file or submit under the Exchange Act are accumulated and communicated to our management, including our principal executive officer and principal financial officer, as appropriate, to allow timely decisions regarding required disclosure.
Changes in Internal Control over Financial Reporting
There was no change in our internal control over financial reporting that occurred during the fourth quarter of 2016 that has materially affected, or is reasonably likely to materially affect, our internal control over financial reporting.
Item 9B. OTHER INFORMATION
There were no disclosures of any information required to be filed on Form 8-K during the fourth quarter of 2016 that were not filed.
PART III
Except as otherwise indicated, the following information required by the Instructions to Form 10-K is incorporated herein by reference from the sections of the Roper Proxy Statement for the annual meeting of shareholders to be held on June 8, 2017 ("2017 Proxy Statement"), as specified below:
Item 10. DIRECTORS, EXECUTIVE OFFICERS AND CORPORATE GOVERNANCE
| --- | --- |
We incorporate the information required by this item by reference to our 2017 Proxy Statement.
Item 11. EXECUTIVE COMPENSATION
| --- | --- |
We incorporate the information required by this item by reference to our 2017 Proxy Statement.
Item 12. SECURITY OWNERSHIP OF CERTAIN BENEFICIAL OWNERS AND MANAGEMENT AND RELATED STOCKHOLDER MATTERS
| --- | --- |
Other than the information set forth below, we incorporate the information required by this item by reference to our 2017 Proxy Statement.
Securities Authorized for Issuance under Equity Compensation Plans
The following table provides information as of December 31, 2016 regarding compensation plans (including individual compensation arrangements) under which our equity securities are authorized for issuance.
| Plan Category | (a) Number of Securities to be Issued Upon Exercise of Outstanding Options, Warrants and Rights | (b) Weighted-Average Exercise Price of Outstanding Options, Warrants and Rights | (c) Number of Securities Remaining Available for Future Issuance Under Equity Compensation Plans (Excluding Securities Reflected in Column (a)) | |||||||||
|---|---|---|---|---|---|---|---|---|---|---|---|---|
| Equity Compensation Plans Approved by Shareholders (1) | ||||||||||||
| Stock options | 3,419,597 | $ | 121.31 | |||||||||
| Restricted stock awards(2) | 952,672 | - | ||||||||||
| Subtotal | 4,372,269 | 9,190,273 | ||||||||||
| Equity Compensation Plans Not Approved by Shareholders | - | - | - | |||||||||
| Total | 4,372,269 | $ | - | 9,190,273 |
| (1) | Consists of the Amended and Restated 2006 Incentive Plan (no additional equity awards may be granted under this plan) and the 2016 Incentive Plan. |
|---|
| (2) | The weighted-average exercise price is not applicable to restricted stock awards. |
|---|
Item 13. CERTAIN RELATIONSHIPS AND RELATED TRANSACTIONS AND DIRECTOR INDEPENDENCE
| --- | --- |
We incorporate the information required by this item by reference to our 2017 Proxy Statement.
Item 14. PRINCIPAL ACCOUNTANT FEES AND SERVICES
| --- | --- |
We incorporate the information required by this item by reference to our 2017 Proxy Statement.
PART IV
Item 15. EXHIBITS AND FINANCIAL STATEMENT SCHEDULES
| --- | --- |
| (a) | The following documents are filed as a part of this Annual Report. |
|---|
| (1) | Consolidated Financial Statements: The following consolidated financial statements are included in Part II, Item 8 of this report. |
|---|
Consolidated Balance Sheets as of December 31, 2016 and 2015
Consolidated Statements of Earnings for the Years ended December 31, 2016 , 2015 and 2014
Consolidated Statements of Comprehensive Income for the Years ended December 31, 2016 , 2015 and 2014
Consolidated Statements of Stockholders' Equity for the Years ended December 31, 2016 , 2015 and 2014
Consolidated Statements of Cash Flows for the Years ended December 31, 2016 , 2015 and 2014
Notes to Consolidated Financial Statements
| (2) | Consolidated Valuation and Qualifying Accounts for the Years ended December 31, 2016 , 2015 and 2014 |
|---|
| (b) | Exhibits |
|---|
| Exhibit No. | Description of Exhibit | |
|---|---|---|
| (a)2.1 | Agreement and Plan of Merger dated as of December 6, 2016, by and among Project Diamond Holdings Corporation, the Company, Dash I, Inc. and Thoma Bravo, LLC, as representative of the stockholders of Project Diamond Holdings Corporation and holders of outstanding options to acquire common stock of Project Diamond Holdings Corporation. | |
| (b)3.1 | Restated Certificate of Incorporation as amended through April 24, 2015. | |
| (c)3.2 | Amended and Restated By-Laws. | |
| (d)4.2 | Indenture between Registrant and SunTrust Bank, dated as of November 28, 2003. | |
| 4.3 | Form of Debt Securities (included in Exhibit 4.2). | |
| (e)4.4 | First Supplemental Indenture between Registrant and SunTrust Bank, dated as of December 29, 2003. | |
| (f)4.5 | Second Supplemental Indenture between Registrant and SunTrust Bank, dated as of December 7, 2004. | |
| (g)4.6 | Indenture between Registrant and Wells Fargo Bank, dated as of August 4, 2008. | |
| (h)4.7 | Form of Note. | |
| (i)4.8 | Form of 2.05% Senior Notes due 2018. | |
| (j)4.9 | Form of 6.25% Senior Notes due 2019. | |
| (k)4.10 | Form of 1.85% Senior Notes due 2017. | |
| 4.11 | Form of 3.125% Senior Notes due 2022 (included in Exhibit 4.10). | |
| (l)4.12 | Form of 3.00% Senior Notes due 2020. | |
| 4.13 | Form of 3.85% Senior Notes due 2025 (included in Exhibit 4.12). | |
| (m)4.14 | Form of 2.800% Senior Notes due 2021. | |
| 4.15 | Form of 3.800% Senior Notes due 2026 (included in Exhibit 4.14) | |
| (n)10.01 | Form of Amended and Restated Indemnification Agreement. † | |
| (o)10.02 | Employee Stock Purchase Plan, as amended and restated. † | |
| (p)10.03 | 2000 Stock Incentive Plan, as amended. † | |
| (p)10.04 | Non-Qualified Retirement Plan, as amended. † | |
| (q)10.05 | Brian D. Jellison Employment Agreement, dated as of December 29, 2008. † |
| (r)10.06 | Credit Agreement, dated as of September 23, 2016 among Registrant, the foreign subsidiary borrowers from time to time party thereto, the financial institutions party thereto, JPMorgan Chase Bank, N.A., as administrative agent, Wells Fargo Bank, N.A. and Bank of America, N.A. as syndication agents, and The Bank of Tokyo-Mitsubishi UFJ, Ltd. and Mizuho Bank, Ltd., PNC Bank, National Association, SunTrust Bank and TD Bank, N.A. as co-documentation agents. | |
|---|---|---|
| (s)10.07 | Amendment No. 1 to Credit Agreement dated December 2, 2016, to Credit Agreement dated as of September 23, 2016 by and among Registrant, the foreign subsidiary borrowers party thereto from time to time, the lenders party thereto from time to time, JP Morgan Chase Bank, N.A., as Administrative Agent, and the other agents and parties thereto. | |
| (t)10.08 | Form of Executive Officer Restricted Stock Award Agreement. † | |
| (t)10.09 | Brian D. Jellison Restricted Stock Unit Award Agreement. † | |
| (u)10.10 | Offer letter for John Humphrey, dated March 31, 2006. † | |
| (v)10.11 | Amended and Restated 2006 Incentive Plan. † | |
| (w)10.12 | Form of Restricted Stock Agreement for Non-Employee Directors. † | |
| (w)10.13 | Form of Restricted Stock Agreement for Employees. † | |
| (w)10.14 | Form of Non-Statutory Stock Option Agreement. † | |
| (x)10.15 | David B. Liner Retirement Agreement and General Release dated November 18, 2016. † | |
| (y)10.16 | Amendment to John Humphrey offer letter. † | |
| 10.17 | Offer letter to John K. Stipancich, filed herewith. † | |
| (z)10.18 | Form of director and officer indemnification agreement. † | |
| (aa)10.19 | 2016 Stock Incentive Plan. † | |
| 10.20 | Amendment No. 1 to the 2016 Stock Incentive Plan, filed herewith. † | |
| 10.21 | Form of Cash Settled Restricted Stock Unit Award Agreement for Non-US Employees, under the 2016 Stock Incentive Plan, filed herewith.† | |
| 10.22 | Form of Non-Statutory Stock Option Agreement, under the 2016 Stock Incentive Plan, filed herewith. † | |
| 10.23 | Form of Restricted Stock Award Agreement, under the 2016 Stock Incentive Plan, filed herewith. † | |
| (bb)10.24 | Director Compensation Plan, under 2016 Stock Incentive Plan. † | |
| 10.25 | Form of Restricted Stock Unit Award Agreement for Non-Employee Directors, under the 2016 Stock Incentive Plan (included in Exhibit 10.24). † | |
| 21.1 | List of Subsidiaries, filed herewith. | |
| 23.1 | Consent of Independent Registered Public Accountants, filed herewith. | |
| 31.1 | Rule 13a-14(a)/15d-14(a) Certification of Chief Executive Officer, filed herewith. | |
| 31.2 | Rule 13a-14(a)/15d-14(a) Certification of Chief Financial Officer, filed herewith. | |
| 32.1 | Section 1350 Certification of Chief Executive and Chief Financial Officers, filed herewith. | |
| 101.INS | XBRL Instance Document, furnished herewith. | |
| 101.SCH | XBRL Taxonomy Extension Schema Document, filed herewith. | |
| 101.CAL | XBRL Taxonomy Extension Calculation Linkbase Document, filed herewith. | |
| 101.DEF | XBRL Taxonomy Extension Definition Linkbase Document, filed herewith. | |
| 101.LAB | XBRL Taxonomy Extension Label Linkbase Document, filed herewith. | |
| 101.PRE | XBRL Taxonomy Extension Presentation Linkbase Document, filed herewith. |
| a) | Incorporated herein by reference to Exhibit 2.1 to the Company's Current Report on Form 8-K filed on December 6, 2016 (file no. 1-12273). | |
|---|---|---|
| b) | Incorporated herein by reference to Exhibit 3.1 to the Company's Current Report on Form 8-K filed on April 24, 2015 (file no. 1-12273). | |
| c) | Incorporated herein by reference to Exhibit 3.2 to the Company's Current Report on Form 8-K filed March 14, 2016 (file no. 1-12273). | |
| d) | Incorporated herein by reference to Exhibit 4.2 to the Company's Pre-Effective Amendment No. 1 to the Registration Statement on Form S-3 filed November 28, 2003 (file no. 333-110491). | |
| e) | Incorporated herein by reference to Exhibit 4.1 to the Company's Current Report on Form 8-K filed January 13, 2004 (file no. 1-12273). | |
| f) | Incorporated herein by reference to Exhibit 4.1 to the Company's Current Report on Form 8-K filed December 7, 2004 (file no. 1-12273). |
| g) | Incorporated herein by reference to Exhibit 4.2 to the Company's Quarterly Report on Form 10-Q filed on November 7, 2008 (file no. 1-12273). | |
|---|---|---|
| h) | Incorporated herein by reference to Exhibit 4.1 to the Registration Statement on Form S-3/ASR filed November 25, 2015 (file no. 333-208200). | |
| i) | Incorporated herein by reference to Exhibit 4.1 to the Company's Current Report on Form 8-K filed June 6, 2013 (file no. 1-12273). | |
| j) | Incorporated herein by reference to Exhibit 4.1 to the Company's Current Report on Form 8-K filed September 2, 2009 (file no. 1-12273). | |
| k) | Incorporated herein by reference to Exhibit 4.1 to the Company's Current Report on Form 8-K filed November 21, 2012 (file no. 1-12273). | |
| l) | Incorporated herein by reference to Exhibit 4.1 to the Company's Current Report on Form 8-K filed December 7, 2015 (file no. 1-12273). | |
| m) | Incorporated herein by reference to Exhibit 4.1 to the Company's Current Report on Form 8-K filed December 19, 2016 (file no. 1-12273). | |
| n) | Incorporated herein by reference to Exhibit 10.04 to the Company's Quarterly Report on Form 10-Q filed August 31, 1999 (file no. 1-12273). | |
| o) | Incorporated herein by reference to Exhibit 10.1 to the Company's Quarterly Report on Form 10-Q filed November 5, 2010 (file no. 1-12273). | |
| p) | Incorporated herein by reference to Exhibit 10.06 to the Company's Annual Report on Form 10-K filed March 2, 2009 (file no. 1-12273). | |
| q) | Incorporated herein by reference to Exhibit 10.07 to the Company's Annual Report on Form 10-K filed March 2, 2009 (file no. 1-12273). | |
| r) | Incorporated by reference to Exhibit 10.1 to the Company's Current Report on Form 8-K filed September 23, 2016 (file no. 1-12273). | |
| s) | Incorporated by reference to Exhibit 10.1 to the Company's Current Report on Form 8-K filed December 7, 2016 (file no. 1-12273). | |
| t) | Incorporated herein by reference to Exhibits 99.1 and 99.2 to the Company's Current Report on Form 8-K filed December 30, 2004 (file no. 1-12273). | |
| u) | Incorporated herein by reference to Exhibit 10.1 to the Company's Quarterly Report on Form 10-Q filed August 9, 2006 (file no. 1-12273). | |
| v) | Incorporated herein by reference to Appendix A to the Company's Definitive Proxy Statement on Schedule 14A filed April 30, 2012 (file no. 1-12273). | |
| w) | Incorporated herein by reference to Exhibits 10.2, 10.3 and 10.4 to the Company's Current Report on Form 8-K filed December 6, 2006 (file no. 1-12273). | |
| x) | Incorporated herein by reference to Exhibit 10.1 to the Current Report on Form 8-K filed November 23, 2016 (file no. 1-12273). | |
| y) | Incorporated herein by reference to Exhibit 10.01 to the Company's Quarterly Report on Form 10-Q filed May 7, 2009 (file no. 1-12273). | |
| z) | Incorporated herein by reference to Exhibit 10 to the Current Report on Form 8-K filed November 20, 2015 (file no. 1-12273). | |
| aa) | Incorporated by reference to Appendix B to the Company's Definitive Proxy Statement on Schedule 14A filed April 26, 2016 (file no. 1-12273). | |
| bb) | Incorporated by reference to Exhibit 10.2 to the Company's Form 10Q filed August 5, 2016 (file no. 1-12273). | |
| † | Management contract or compensatory plan or arrangement. |
Item 16. FORM 10-K SUMMARY | --- | --- | --- |
None
Signatures
Pursuant to the requirements of Section 13 or 15(d) of the Securities Exchange Act of 1934, Roper has duly caused this Report to be signed on its behalf by the undersigned, therewith duly authorized.
ROPER TECHNOLOGIES, INC.
(Registrant)
| By: | /S/ BRIAN D. JELLISON | February 27, 2017 | ||
|---|---|---|---|---|
| Brian D. Jellison, President and Chief Executive Officer |
Pursuant to the requirements of the Securities Exchange Act of 1934, this Report has been signed below by the following persons on behalf of Roper and in the capacities and on the dates indicated.
| /S/ BRIAN D. JELLISON | President, Chief Executive Officer and | ||
|---|---|---|---|
| Brian D. Jellison | Chairman of the Board of Directors | February 27, 2017 | |
| (Principal Executive Officer) | |||
| /S/ JOHN HUMPHREY | Executive Vice President, Chief Financial Officer | ||
| John Humphrey | (Principal Financial Officer) | February 27, 2017 | |
| /S/ PAUL J. SONI | Vice President and Controller | ||
| Paul J. Soni | (Principal Accounting Officer) | February 27, 2017 | |
| /S/ AMY WOODS BRINKLEY | |||
| Amy Woods Brinkley | Director | February 27, 2017 | |
| /S/ JOHN F. FORT, III | |||
| John F. Fort, III | Director | February 27, 2017 | |
| /S/ ROBERT D. JOHNSON | |||
| Robert D. Johnson | Director | February 27, 2017 | |
| /S/ ROBERT E. KNOWLING | |||
| Robert E. Knowling | Director | February 27, 2017 | |
| /S/ WILBUR J. PREZZANO | |||
| Wilbur J. Prezzano | Director | February 27, 2017 | |
| /S/ LAURA G. THATCHER | |||
| Laura G. Thatcher | Director | February 27, 2017 | |
| /S/ RICHARD F. WALLMAN | |||
| Richard F. Wallman | Director | February 27, 2017 | |
| /S/ CHRISTOPHER WRIGHT | |||
| Christopher Wright | Director | February 27, 2017 | |