 filings.tools
Item 5. MARKET FOR REGISTRANT’S COMMON EQUITY RELATED STOCKHOLDER MATTERS AND ISSUER PURCHASES OF EQUITY SECURITIES
3K characters. Original on sec.gov · Markdown
Item 5. MARKET FOR REGISTRANT’S COMMON EQUITY RELATED STOCKHOLDER MATTERS AND ISSUER PURCHASES OF EQUITY SECURITIES
Our common stock trades on the NYSE under the symbol “ROP”. Based on information available to us and our transfer agent, we believe that as of February 15, 2019 there were 145 record holders of our common stock.
Dividends – We have declared a cash dividend in each quarter since our February 1992 initial public offering and we have annually increased our dividend rate since our initial public offering. In November 2018, our Board of Directors increased the quarterly dividend paid January 23, 2019 to $0.4625 per share from $0.4125 per share, an increase of 12%. This is the twenty-sixth consecutive year in which Roper has increased its dividend. The timing, declaration and payment of future dividends will be at the sole discretion of our Board of Directors and will depend upon our profitability, financial condition, capital needs, future prospects and other factors deemed relevant by our Board of Directors.
Recent Sales of Unregistered Securities - In 2018, there were no sales of unregistered securities.
Performance Graph - This performance graph shall not be deemed “filed” for purposes of Section 18 of the Securities Exchange Act of 1934, as amended (the “Exchange Act”) or otherwise subject to the liabilities under that Section and shall not be deemed to be incorporated by reference into any of our filings under the Securities Act of 1933, as amended, or under the Exchange Act.
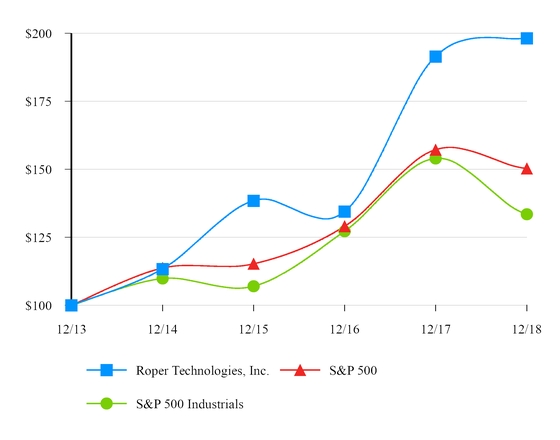
The following graph compares, for the five year period ended December 31, 2018, the cumulative total stockholder return for our common stock, the Standard and Poor’s 500 Stock Index (the “S&P 500”) and the Standard and Poor’s 500 Industrials Index (the “S&P 500 Industrials”). Measurement points are the last trading day of each of our fiscal years ended December 31, 2013, 2014, 2015, 2016, 2017 and 2018. The graph assumes that $100 was invested on December 31, 2013 in our common stock, the S&P 500 and the S&P 500 Industrials and assumes reinvestment of any dividends. The stock price performance on the following graph is not necessarily indicative of future stock price performance.
| 12/31/2013 | 12/31/2014 | 12/31/2015 | 12/31/2016 | 12/31/2017 | 12/31/2018 | ||||||||||||||||||
| Roper Technologies, Inc. | $ | 100.00 | $ | 113.39 | $ | 138.48 | $ | 134.49 | $ | 191.49 | $ | 198.22 | |||||||||||
| S&P 500 | 100.00 | 113.69 | 115.26 | 129.05 | 157.22 | 150.33 | |||||||||||||||||
| S&P 500 Industrials | 100.00 | 109.83 | 107.04 | 127.23 | 153.99 | 133.53 |
The information set forth in Item 12 under the heading “Securities Authorized for Issuance under Equity Compensation Plans” is incorporated herein by reference.
Previous: Item 4. MINE SAFETY DISCLOSURES · Next: Item 6. SELECTED FINANCIAL DATA