 filings.tools
Ross Stores (ROST) 10-K risk factor changes: FY2018 vs FY2017
The 2018-02-03 10-K against the 2017-01-28 one, compared heading by heading and sentence by sentence. One of these filings carries no fiscal year tag, so its year is the calendar year of the period end.
Item 1A23 rewritten1 added3 removed146 unchanged
All filing items631 rewritten186 added143 removed1,124 unchanged
Summary
counted, not written
- Item 1A headings could not be compared: only 0 carried over between the two years, which usually means one filing was read wrongly, so none is reported as new or removed.
- Sentence by sentence, 186 added, 143 removed, 631 rewritten and 1,124 unchanged across 15 items that differ.
Sentences by item
21 items, with every count and a link to each item that changed
Underlined words on a shaded ground are new in FY2018; struck-through words were in FY2017. Sentences that are wholly new or wholly gone are labelled rather than marked.
Item 1A. RISK FACTORS
23 rewritten, 1 added, 3 removed, 146 unchanged
Our Annual Report on Form 10-K for fiscal [removed: 2016,] [added: 2017,] and information we provide in our Annual Report to Stockholders, press releases, and other investor communications, including those on our corporate website, may contain forward-looking statements with respect to anticipated future events and our projected growth, financial performance, operations, and competitive position that are subject to risks and uncertainties that could cause our actual results to differ materially from those forward-looking statements and our prior expectations and projections.
The retail industry is highly competitive and the marketplace is highly fragmented, as many different retailers compete for market share by utilizing a variety of store and [removed: online] [added: on-line] formats and merchandising strategies.
The substantial sales growth in the e-commerce industry within the last decade has also encouraged the entry of many new competitors, new business models, and an increase in competition from established companies looking for ways to create successful [removed: online] [added: on-line] off-price shopping alternatives.
[removed: Unseasonable] [added: Adverse and/or unseasonable] weather may affect shopping patterns and consumer demand for seasonal apparel and other [removed: merchandise.][added: merchandise, and may result in temporary store closures and disruptions in deliveries of merchandise to our stores.]
As a result, [added: adverse or] unseasonable weather in any of our markets could lead to disappointing sales and increase our markdowns, which may negatively affect our sales and margins.
[removed: And maintaining] [added: Maintaining] an overall pricing differential to department and specialty stores is [added: also] key to our ability to attract customers and sustain our sales and gross margins.
Shortages or disruptions in the availability to us of high [removed: quality] [added: quality, value-priced] merchandise would likely have a material adverse effect on our sales and margins.
Information or data security breaches, including cyber-attacks on our transaction processing and computer information systems, could result in theft or unauthorized disclosure of customer, credit card, employee, or other private and valuable information that we handle in the ordinary course of our [removed: business.][added: business, disrupt our operations, damage our reputation, and increase our costs.]
Cyber criminals may attempt to penetrate our [added: point of sale and other] information systems to misappropriate customer or business information, including but not limited to credit/debit card, personnel, or trade information.
Despite security measures we have in [removed: place,] [added: place and] our [added: efforts to prevent, monitor, and mitigate attacks and errors, our] facilities and systems (or those of third-party service providers we utilize or connect to) may be vulnerable to security breaches, acts of vandalism, computer viruses, misplaced or lost data, programming and/or human errors, phishing and similar fraudulent attacks, or other similar events.
[added: The increasing sophistication of cyber criminals] and advances in computer capabilities and remote access increases these risks.
A breach of our information or data security, [added: a system shut down] or [added: other response we may take, or] our failure or delay in detecting and mitigating a loss of personal or business information, could result in damage to our reputation, loss of customer confidence, violation (or alleged violation) of applicable laws, and expose us to civil claims, litigation, and regulatory [removed: action] [added: action,] and to unanticipated costs and disruption of our operations.
Such disruptions may result from: damage or destruction to our distribution centers; weather-related events; natural disasters; trade restrictions; tariffs; third-party [removed: strikes,] [added: strikes or ineffective cross dock operations,] work stoppages or slowdowns; shipping capacity constraints; supply or shipping interruptions or costs; or other factors beyond our control.
[added: New markets may have competitive conditions, consumer tastes] and discretionary spending patterns that are more difficult to predict or satisfy than our existing markets.
An adverse outcome in various legal, regulatory, or tax matters could [added: damage our reputation or brand and] increase our costs.
A predominant portion of the apparel and other goods we sell (even when [removed: purchased] [added: we purchase it] domestically, often as excess inventory sold to us by a domestic vendor) is originally manufactured in other countries.
Although we have implemented policies and procedures to facilitate our compliance with laws and regulations relating to doing [added: business in foreign markets and importing merchandise, there can be no assurance that suppliers and other third parties with whom we do business will not violate such laws and regulations or our policies.]
The U.S. government has [added: at times] indicated [removed: an intention to review and potentially] [added: a willingness] to significantly change [removed: U.S. tax and] [added: existing] trade policies.
[removed: Potential changes may include disallowance of the tax deductions for imported merchandise or the imposition of significant tariffs on products imported into the U.S.] This exposes us to risks of disruption and cost increases in our established patterns for sourcing our merchandise, and creates increased uncertainties in planning our sourcing strategies and forecasting our margins.
Changes in U.S. tariffs, quotas, trade relationships, or tax provisions that reduce the supply or increase the relative cost of goods produced in other countries [removed: are likely to] [added: could] increase our cost of goods and/or increase our effective tax rate.
In addition to the general uncertainty and overall risk from [removed: those] potential changes in U.S. laws and policies, as we make business decisions in the face of [removed: the] uncertainty [removed: of those] [added: as to] potential changes, we may incorrectly anticipate the outcomes, miss out on business opportunities, or fail to effectively adapt our business strategies and manage the adjustments that are necessary in response to those changes.
If sales in a certain period are lower than our plans, we [removed: are generally] [added: may] not [added: be] able to adjust these operating expenses concurrently, which may impact our operating results.
Our corporate headquarters, Los Angeles buying office, three operating distribution centers, two warehouses, and approximately [removed: 24%] [added: 23%] of our stores are located in California.
In addition, an adverse outcome (or the adverse publicity from the claims) in any of these matters may harm and damage our reputation or brand.
The increasing sophistication of cyber criminals
New markets may have competitive conditions, consumer tastes
business in foreign markets and importing merchandise, there can be no assurance that suppliers and other third parties with whom we do business will not violate such laws and regulations or our policies.
Item 7. MANAGEMENT’S DISCUSSION AND ANALYSIS OF FINANCIAL CONDITION AND RESULTS OF OPERATIONS
115 rewritten, 35 added, 23 removed, 165 unchanged
Ross is the largest off-price apparel and home fashion chain in the United States with [removed: 1,340] [added: 1,409] locations in [removed: 36] [added: 37] states, the District of [removed: Columbia] [added: Columbia,] and [removed: Guam] [added: Guam,] as of [removed: January 28, 2017.][added: February 3, 2018.]
We also operate [removed: 193] [added: 213] dd’s DISCOUNTS stores in [removed: 15] [added: 16] states as of [removed: January 28, 2017] [added: February 3, 2018] that feature a more moderately-priced assortment of first-quality, in-season, name brand apparel, accessories, footwear, and home fashions for the entire family at savings of 20% to 70% off moderate department and discount store regular prices every day.
Our sales and earnings gains in [removed: 2016] [added: 2017] continued to benefit from efficient execution of our off-price model throughout all areas of our business.
We refer to our fiscal years ended [added: February 3, 2018,] January 28, 2017, [removed: January 30, 2016,] and January [removed: 31, 2015] [added: 30, 2016] as fiscal [removed: 2016,] [added: 2017,] fiscal [removed: 2015,] [added: 2016,] and fiscal [removed: 2014,] [added: 2015,] respectively.
The following table summarizes the financial results for fiscal [added: 2017,] 2016, [removed: 2015,] and [removed: 2014:][added: 2015:]
| | | [removed: 2016] [added: 2017] | | | | [removed: 2015] [added: 2016] | | | | [removed: 2014] [added: 2015] | | |
| Sales (millions) | | $ | [removed: 12,867] [added: 14,135] | | | $ | [removed: 11,940] [added: 12,867] | | | $ | [removed: 11,042] [added: 11,940] | |
| Sales growth | | [removed: 7.8] [added: 9.9] | | % | | [removed: 8.1] [added: 7.8] | | % | | [removed: 7.9] [added: 8.1] | | % |
| Comparable store sales growth [added: (52-week basis)] | | 4 | | % | | 4 | | % | | [removed: 3] [added: 4] | | % |
| Cost of goods sold | | [removed: 71.3] [added: 71.0] | | % | | [removed: 71.8] [added: 71.3] | | % | | [removed: 71.9] [added: 71.8] | | % |
| Selling, general and administrative | | [removed: 14.7] [added: 14.5] | | % | | [removed: 14.6] [added: 14.7] | | % | | 14.6 | | % |
| Interest expense, net | | 0.1 | | % | | 0.1 | | % | | [removed: 0.0] [added: 0.1] | | % |
| Earnings before taxes (as a percent of sales) | | [removed: 13.9] [added: 14.4] | | % | | [removed: 13.5] [added: 13.9] | | % | | 13.5 | | % |
| Net earnings (as a percent of sales) | | [removed: 8.7] [added: 9.6] | | % | | [removed: 8.5] [added: 8.7] | | % | | [removed: 8.4] [added: 8.5] | | % |
Total stores open at the end of fiscal [added: 2017,] 2016, [removed: 2015,] and [removed: 2014] [added: 2015] were [added: 1,622,] 1,533, [removed: 1,446,] and [removed: 1,362,] [added: 1,446,] respectively.
The number of stores at the end of fiscal [added: 2017,] 2016, [removed: 2015,] and [removed: 2014] [added: 2015] increased by 6%, 6%, and [removed: 7%] [added: 6%] from the respective prior years.
| Store Count | [removed: 2016] [added: 2017] | | | [removed: 2015] [added: 2016] | | | [removed: 2014] [added: 2015] | |
| Beginning of the period | [removed: 1,446] [added: 1,533] | | | [removed: 1,362] [added: 1,446] | | | [removed: 1,276] [added: 1,362] | |
| Opened in the period | [removed: 93] [added: 96] | | | [removed: 90] [added: 93] | | | [removed: 95] [added: 90] | |
| Closed in the period | [removed: (6] [added: (7] | ) | | (6 | ) | | [removed: (9] [added: (6] | ) |
| End of the period | [removed: 1,533] [added: 1,622] | | | [removed: 1,446] [added: 1,533] | | | [removed: 1,362] [added: 1,446] | |
| Selling square footage at the end of the period (000) | [removed: 33,300] [added: 34,700] | | | [removed: 31,900] [added: 33,300] | | | [removed: 30,400] [added: 31,900] | |
Sales for fiscal [removed: 2016] [added: 2017] increased [removed: $0.9] [added: $1.3] billion, or [removed: 7.8%,] [added: 9.9%,] compared to the prior year due to the opening of [removed: 87] [added: 89] net new stores during [removed: 2016 and] [added: 2017,] a 4% increase in comparable store sales (defined as stores that have been open for more than 14 complete [removed: months).][added: months), and the impact of the 53rd week.]
Sales for fiscal [removed: 2015] [added: 2016] increased $0.9 billion, or [removed: 8.1%,] [added: 7.8%,] compared to the prior year due to the opening of [removed: 84] [added: 87] net new stores during [removed: 2015] [added: 2016] and a 4% increase in sales from comparable stores.
Our sales mix is shown below for fiscal [added: 2017,] 2016, [removed: 2015,] and [removed: 2014:][added: 2015:]
| | | [removed: 2016] [added: 2017] | | | [removed: 2015] [added: 2016] | | | [removed: 2014] [added: 2015] | |
| Ladies | | [removed: 28] [added: 27] | % | | [removed: 29] [added: 28] | % | | 29 | % |
| Home Accents and Bed and Bath | | [removed: 25] [added: 26] | % | | 25 | % | | [removed: 24] [added: 25] | % |
| Shoes | | 13 | % | | [removed: 12] [added: 13] | % | | [removed: 13] [added: 12] | % |
Although our strategies and store expansion program contributed to sales gains in fiscal [added: 2017,] 2016, [removed: 2015,] and [removed: 2014,] [added: 2015,] we cannot be sure that they will result in a continuation of sales growth or in an increase in net earnings.
Cost of goods sold in fiscal [removed: 2015] [added: 2017] increased [removed: $638.9] [added: $868.9] million compared to the prior year mainly due to increased sales from the opening of [removed: 84] [added: 89] net new stores during the [removed: year and] [added: year,] a 4% increase in sales from comparable [removed: stores.][added: stores, and the impact of the 53rd week.]
Cost of goods sold as a percentage of sales for fiscal [removed: 2015] [added: 2017] decreased approximately [removed: five] [added: 25] basis points from the prior year primarily due to a [removed: 45] [added: 25] basis point increase in merchandise gross [removed: margin] [added: margin, a 25 basis point decrease in occupancy costs,] and [added: a] five basis [removed: points of occupancy leverage.][added: point decrease in distribution expenses.]
[removed: This improvement was] [added: These improvements were] partially offset by a [removed: 35] [added: 25] basis point increase in [removed: distribution expenses related to infrastructure investments] [added: freight costs] and higher [removed: freight] [added: buying] costs of [removed: 10] [added: five] basis points.
We cannot be sure that the gross profit margins realized in fiscal [added: 2017,] 2016, [removed: 2015,] and [removed: 2014] [added: 2015] will continue in future years.
For fiscal 2016, [removed: selling, general and administrative expenses (“SG&A”)] [added: SG&A] increased $151.7 million compared to the prior year, mainly due to increased store operating costs reflecting the opening of 87 net new stores during the year.
For fiscal [removed: 2015, SG&A] [added: 2017, selling, general and administrative expenses (“SG&A”)] increased [removed: $123.4] [added: $153.3] million compared to the prior year, mainly due to increased store operating costs reflecting the opening of [removed: 84] [added: 89] net new stores [added: during the year,] and the impact of [removed: wage rate increases during] the [removed: year.][added: 53rd week.]
SG&A as a percentage of sales for fiscal [removed: 2015] [added: 2017] decreased by approximately [removed: five] [added: 25] basis points compared to the prior year primarily due to leverage resulting from the 4% increase in comparable store sales.
In fiscal [removed: 2016,] [added: 2017,] net interest expense [removed: increased] [added: decreased] by [removed: $3.9] [added: $8.8] million primarily due to [removed: a reduction of capitalized interest partially offset by] an increase in interest income.
The table below shows the components of interest expense and income for fiscal [added: 2017,] 2016, [removed: 2015,] and [removed: 2014:][added: 2015:]
| ($000) | | [removed: 2016] [added: 2017] | | | | [removed: 2015] [added: 2016] | | | | [removed: 2014] [added: 2015] | | |
Fiscal 2017 was a 53-week year.
Fiscal 2016 and 2015 were each 52-week years.
The Tax Cuts and Jobs Act (the “Tax Act” or "tax reform") was signed into law on December 22, 2017.
The Tax Act made significant changes to U.S. corporate taxation including reducing the U.S. federal corporate income tax rate from 35% to 21% effective January 1, 2018, permitting immediate capital expensing of certain qualified property, and limiting the tax deductions available for certain executive compensation and employee fringe benefits.
U.S. GAAP requires that the impact of tax legislation be recognized in the period in which the law was enacted.
As a result, the Company applied a blended U.S. federal income tax rate of approximately 34% for fiscal 2017, due to the lower tax rate of 21% becoming effective in the last month of that fiscal year.
This reduced tax rate resulted in a tax benefit of $24.9 million.
We recorded an additional tax benefit of $55.2 million due to the remeasurement of our deferred tax assets and liabilities.
Both of these tax benefits were recorded in the fourth quarter of fiscal 2017.
Also on December 22, 2017, the SEC staff issued Staff Accounting Bulletin 118, Income Tax Accounting Implications of the Tax Cuts and Jobs Act (“SAB 118”), which provides guidance on accounting for the impact of the Tax Act.
As permitted by SAB 118, both of the tax benefits recorded by us in fiscal 2017, represent provisional amounts based on our current best estimates.
Any adjustments made to those provisional amounts will be included in income from operations and recorded as an adjustment to tax expense through the fiscal year ending February 2, 2019.
The recorded, provisional amounts reflect assumptions made based upon our current interpretation of the Tax Act, and may change as we receive additional clarification and guidance in the form of technical corrections to the Tax Act or regulations issued by the U.S. Treasury.
Diluted earnings per share in fiscal 2017 was $3.55 compared to $2.83 in the prior year, which includes a per share benefit of approximately $0.21 from the recently enacted tax reform legislation and $0.10 from the 53rd week.
The increase in capital expenditures in fiscal 2017 compared to fiscal 2016 was primarily due to information technology infrastructure investments for our stores, buying, and corporate offices.
In November 2017, we entered into a sale-leaseback transaction for one of our previously owned stores and received net cash proceeds of $16.0 million, recognized a gain on sale of $6.3 million, and deferred the residual $7.5 million gain over the remaining ten-year lease term.
In March 2018, our Board of Directors approved an increase in the stock repurchase authorization for fiscal 2018 by $200 million to $1.075 billion, up from the previously available $875 million.
| Operating leases (rent obligations) | 509,954 | | | | 970,621 | | | | 649,773 | | | | 554,783 | | | | 2,685,131 | | |
| Purchase obligations | 2,630,985 | | | | 32,976 | | | | 14,685 | | | | 2,705 | | | | 2,681,351 | | |
| Total contractual obligations | $ | 3,250,462 | | | $ | 1,041,796 | | | $ | 763,787 | | | $ | 1,763,722 | | | $ | 6,819,767 | |
We also lease three warehouse facilities and two buying offices.
The lease terms for these facilities expire in 2022 and 2020, respectively, and contain renewal provisions.
As of February 3, 2018 we had purchase obligations of approximately $2.7 billion.
Adoption will result in a change in the timing of recognizing revenue from breakage for stored value cards.
Breakage will be estimated and recognized based upon the historical pattern of redemption, rather than when redemption is considered remote.
Additionally, we will recognize allowances for estimated sales returns on a gross rather than net basis in our Consolidated Financial Statements.
The impact of recognizing sales returns on a gross basis is not expected to be material.
We plan to adopt ASC 606 under the modified retrospective method and will recognize a cumulative-effect adjustment to increase retained earnings by approximately $20 million, net of income taxes, as of February 4, 2018.
Recently adopted accounting standards.
We adopted ASU 2016-09 in the first quarter of fiscal 2017 and elected to apply this adoption prospectively, except for forfeitures which we adopted on a modified retrospective basis.
Accordingly, prior periods have not been adjusted.
As a result of adoption, for the fiscal year ended February 3, 2018, we recognized $16.3 million of excess tax benefits related to stock-based payments as a reduction to our provision for income taxes.
These items were historically recorded in additional paid-in capital.
We also presented cash flows related to excess tax benefits as an operating activity in the Consolidated Statement of Cash Flows and elected to account for forfeitures as incurred beginning on January 29, 2017.
The impact of this accounting policy election for forfeitures was a cumulative-effect adjustment to decrease retained earnings by $1.1 million, net of tax, as of January 29, 2017.
All share and per share amounts have been adjusted for the two-for-one stock split effective June 11, 2015.
As a percentage of sales, net interest expense in fiscal 2016 remained flat compared to the prior year.
Diluted earnings per share in fiscal 2015 was $2.51 compared to $2.21 in fiscal 2014.
The decrease in capital expenditures in fiscal 2015 compared to fiscal 2014 was primarily due to the purchase in September 2014 of our New York buying office and the construction of two distribution centers.
| New York buying office purchase | | — | | | | — | | | | 210.9 | | |
We had no purchases of investments in fiscal 2016 and 2014 and $0.7 million of purchases of investments in fiscal 2015.
We had proceeds from investments of $1.7 million, $1.1 million, and $12.0 million in fiscal 2016, 2015, and 2014, respectively.
In September 2014, we issued $250 million of unsecured 2024 Notes and used most of the net proceeds of approximately $246 million to purchase our New York buying office building for $222 million and the remaining $24 million for other general corporate purposes.
In April 2016, we entered into a new $600 million unsecured revolving credit facility.
an applicable margin (currently 100 basis points) and is payable quarterly and upon maturity.
The revolving credit facility may be extended, at our option, for up to two additional one year periods, subject to customary conditions.
| Operating leases (rent obligations) | 484,518 | | | | 924,319 | | | | 604,751 | | | | 504,389 | | | | 2,517,977 | | |
| Purchase obligations | 2,123,046 | | | | 15,627 | | | | 5,204 | | | | 1,957 | | | | 2,145,834 | | |
| Total contractual obligations | $ | 2,632,087 | | | $ | 1,068,568 | | | $ | 713,154 | | | $ | 1,727,809 | | | $ | 6,141,618 | |
The lease term for this facility expires in 2017 and contains renewal provisions.
As of January 28, 2017 we had purchase obligations of approximately $2,146 million.
We use historical data to estimate pre-vesting forfeitures and to recognize stock-based compensation expense.
We are currently evaluating the effect adoption of this new guidance will have on our consolidated financial statements.
ASU 2016-09 is effective for us beginning in the first quarter of 2017.
Upon adoption of ASU 2016-09, we plan to account for forfeitures as incurred and expect this adoption along with the retrospective impact on our classification of cash flows between operating and financing activities to be immaterial.
The magnitude of such impact is dependent upon our future stock price in relation to the fair value of awards on grant date and our future grants of stock-based compensation.
See Note F for disclosure of our historical accounting treatment of excess tax benefits.
The standard also requires
An excerpt. Shown here: 40 of 115 rewritten, all 35 added and all 23 removed. The counts are complete. For every sentence, read Item 7. MANAGEMENT’S DISCUSSION AND ANALYSIS OF FINANCIAL CONDITION AND RESULTS OF OPERATIONS in the FY2018 filing and the FY2017 filing.
Item 7A. QUANTITATIVE AND QUALITATIVE DISCLOSURES ABOUT MARKET RISK
4 rewritten, 0 added, 0 removed, 10 unchanged
We had no outstanding forward contracts as of [removed: January 28, 2017.][added: February 3, 2018.]
As of [removed: January 28, 2017,] [added: February 3, 2018,] we had no borrowings outstanding under our revolving credit facility.
The amount outstanding under these notes as of [removed: January 28, 2017] [added: February 3, 2018] was $150 million.
A hypothetical 100 basis point increase or decrease in prevailing market interest rates would not have a material impact on our consolidated financial position, results of operations, cash flows, or the fair values of our short- and long-term investments as of and for the year ended [removed: January 28, 2017.][added: February 3, 2018.]
Item 1. BUSINESS
17 rewritten, 2 added, 2 removed, 106 unchanged
Ross is the largest off-price apparel and home fashion chain in the United States, with [removed: 1,340] [added: 1,409] locations in [removed: 36] [added: 37] states, the District of [removed: Columbia] [added: Columbia,] and Guam, as of [removed: January 28, 2017.][added: February 3, 2018.]
We also operate [removed: 193] [added: 213] dd’s DISCOUNTS stores in [removed: 15] [added: 16] states as of [removed: January 28, 2017.][added: February 3, 2018.]
We refer to our fiscal years ended [added: February 3, 2018,] January 28, 2017, [removed: January 30, 2016,] and January [removed: 31, 2015] [added: 30, 2016] as fiscal [removed: 2016,] [added: 2017,] fiscal [removed: 2015,] [added: 2016,] and fiscal [removed: 2014, respectively, all of which were 52-week years.][added: 2015, respectively.]
Our merchandise offerings include, but are not limited to, apparel (including footwear and accessories), small furniture, home accents, bed and bath, [added: beauty,] toys, luggage, gourmet food, cookware, [removed: watches,] and [removed: sporting goods.][added: watches.]
We have a combined network of [removed: more than] [added: about] 8,000 merchandise vendors and manufacturers for both Ross and dd’s DISCOUNTS and believe we have adequate sources of first-quality merchandise to meet our requirements.
In fiscal [removed: 2016,] [added: 2017,] we continued our emphasis on this important sourcing strategy in response to compelling opportunities available in the marketplace.
Packaway accounted for approximately 49% and [removed: 47%] [added: 49%] of total inventories as of [removed: January 28, 2017] [added: February 3, 2018] and January [removed: 30, 2016,] [added: 28, 2017,] respectively.
At the end of fiscal [removed: 2016,] [added: 2017,] we had approximately [removed: 760] [added: 800] merchants for Ross and dd’s DISCOUNTS combined.
Our pricing policy is reflected on [removed: the] [added: most of our] price [removed: tag displaying] [added: tags which display] our selling price as well as the comparable value for that item in department and specialty stores for Ross merchandise, or in more moderate department and discount stores for dd’s DISCOUNTS merchandise.
This strategy enables us to offer customers [added: consistently low prices and compelling value.]
As of [removed: January 28, 2017,] [added: February 3, 2018,] we operated a total of [removed: 1,533] [added: 1,622] stores comprised of [removed: 1,340] [added: 1,409] Ross stores and [removed: 193] [added: 213] dd’s DISCOUNTS stores.
Recent initiatives include enhancements to our information and data security, merchandising, distribution, transportation, [added: store,] and [removed: store] [added: financial] systems.
[removed: Currently we] [added: We] own four and lease three other warehouse facilities for packaway storage.
We also use other third-party facilities, including two [removed: warehouses] [added: warehouses,] for storage of packaway inventory.
We utilize [added: a combination of our own and] third-party cross dock facilities to distribute merchandise to stores on a regional basis.
As of [removed: January 28, 2017,] [added: February 3, 2018,] we had approximately [removed: 78,600] [added: 82,700] total employees, which includes both full and part-time employees.
We face a challenging macro-economic and retail environment that creates intense competition for business from [added: on-line retailers,] department stores, specialty stores, discount stores, warehouse stores, other off-price retailers, and manufacturer-owned outlet stores, many of which are units of large national or regional chains that have substantially greater resources.
Fiscal 2017 was a 53-week year.
Fiscal 2016 and 2015 were each 52-week years.
consistently low prices and compelling value.
We also compete with online retailers that sell apparel and home fashions.
Item 3. LEGAL PROCEEDINGS
1 rewritten, 0 added, 0 removed, 6 unchanged
Class action litigation remains pending as of [removed: January 28, 2017.][added: February 3, 2018.]
Cover and table of contents
7 rewritten, 3 added, 1 removed, 49 unchanged
| | | For the fiscal year ended [removed: January 28, 2017] [added: February 3, 2018] | |
Indicate by check mark whether the registrant is a large accelerated filer, an accelerated filer, a non-accelerated filer, [removed: or] a smaller reporting [added: company, or emerging growth] company.
See definitions of “large accelerated filer,” “accelerated [removed: filer” and] [added: filer,”] “smaller reporting [removed: company”] [added: company,” and "emerging growth company"] in Rule 12b-2 of the Exchange Act.
Large accelerated filer X Accelerated filer Non-accelerated filer [removed: Smaller] [added: (Do not check if a smaller] reporting [removed: company][added: company)]
The aggregate market value of the voting common stock held by non-affiliates of the Registrant as of July [removed: 30, 2016] [added: 29, 2017] was [removed: $24,019,302,284,] [added: $20,709,068,267,] based on the closing price on that date as reported by the NASDAQ Global Select Market®.
The number of shares of Common Stock, with $.01 par value, outstanding on March [removed: 6, 2017] [added: 12, 2018] was [removed: 391,895,145.][added: 378,713,373.]
Portions of the Proxy Statement for the [removed: Registrant's 2017] [added: Registrant’s 2018] Annual Meeting of Stockholders, which will be filed on or before [removed: May 29, 2017,] [added: June 4, 2018,] are incorporated herein by reference into Part III.
10-K 1 rost-20180203x10k.htm 10-K
Smaller reporting company Emerging growth company
If an emerging growth company, indicate by check mark if the registrant has elected not to use the extended transition period for complying with any new or revised financial accounting standards provided pursuant to Section 13(a) of the Exchange Act.
10-K 1 rost-20170128x10k.htm 10-K
Item 2. PROPERTIES
49 rewritten, 2 added, 0 removed, 42 unchanged
At [removed: January 28, 2017,] [added: February 3, 2018,] we operated a total of [removed: 1,533] [added: 1,622] stores, of which [removed: 1,340] [added: 1,409] were Ross stores in [removed: 36] [added: 37] states, the District of [removed: Columbia] [added: Columbia,] and Guam, and [removed: 193] [added: 213] were dd’s DISCOUNTS stores in [removed: 15] [added: 16] states.
All stores are leased, with the exception of [removed: three] [added: two] locations which we own.
During fiscal [removed: 2016,] [added: 2017,] we opened [removed: 71] [added: 74] new Ross stores and closed five existing stores.
The average approximate Ross store size is [removed: 28,400] [added: 28,200] square feet.
During fiscal [removed: 2016,] [added: 2017,] we opened 22 new dd’s DISCOUNTS stores and closed [removed: one] [added: two] existing [removed: store.][added: stores.]
The average approximate dd’s DISCOUNTS store size is [removed: 23,200] [added: 23,100] square feet.
During fiscal [removed: 2016,] [added: 2017,] no one store accounted for more than 1% of our sales.
Our real estate strategy in [removed: 2017] [added: 2018] is to primarily open stores in states where we currently operate, to increase our market penetration and [removed: reduce] [added: leverage] overhead and advertising expenses as a percentage of sales in each market.
We also expect to continue our store expansion in newer markets in [removed: 2017.][added: 2018.]
The following table summarizes the locations of our stores by state/territory as of [removed: January 28, 2017] [added: February 3, 2018] and January [removed: 30, 2016.][added: 28, 2017.]
| State/Territory | | [removed: January 28, 2017] [added: February 3, 2018] | | January [removed: 30, 2016] [added: 28, 2017] |
| Alabama | | 23 | | [removed: 19] [added: 23] |
| Arizona | | [removed: 74] [added: 78] | | [removed: 71] [added: 74] |
| Arkansas | | 8 | | [removed: 6] [added: 8] |
| California | | [removed: 364] [added: 379] | | [removed: 347] [added: 364] |
| Colorado | | [removed: 33] [added: 34] | | [removed: 31] [added: 33] |
| Delaware | | 2 | | [removed: 1] [added: 2] |
| Florida | | [removed: 185] [added: 195] | | [removed: 179] [added: 185] |
| Georgia | | [removed: 56] [added: 59] | | [removed: 55] [added: 56] |
| Guam | | [removed: 1] [added: 2] | | 1 |
| Hawaii | | [removed: 17] [added: 20] | | 17 |
| Illinois | | [removed: 62] [added: 67] | | [removed: 55] [added: 62] |
| Indiana | | [removed: 9] [added: 14] | | [removed: 8] [added: 9] |
| Kansas | | [removed: 10] [added: 11] | | [removed: 7] [added: 10] |
| Kentucky | | [removed: 9] [added: 11] | | 9 |
| Louisiana | | 18 | | [removed: 17] [added: 18] |
| Maryland | | 24 | | [removed: 23] [added: 24] |
| Mississippi | | [removed: 8] [added: 9] | | 8 |
| Missouri | | [removed: 21] [added: 23] | | [removed: 17] [added: 21] |
| Nevada | | [removed: 33] [added: 37] | | [removed: 32] [added: 33] |
| New Jersey | | [removed: 13] [added: 14] | | 13 |
| New Mexico | | [removed: 12] [added: 14] | | [removed: 11] [added: 12] |
| North Carolina | | [removed: 45] [added: 46] | | [removed: 42] [added: 45] |
| North Dakota | | 1 | | [removed: 0] [added: 1] |
| Oklahoma | | [removed: 23] [added: 26] | | [removed: 22] [added: 23] |
| Oregon | | 30 | | [removed: 31] [added: 30] |
| Pennsylvania | | [removed: 44] [added: 48] | | [removed: 43] [added: 44] |
| South Carolina | | [removed: 23] [added: 24] | | [removed: 22] [added: 23] |
| South Dakota | | [removed: 1] [added: 2] | | [removed: 0] [added: 1] |
| Tennessee | | [removed: 31] [added: 32] | | [removed: 30] [added: 31] |
| Iowa | | 4 | | 0 |
| Boston, Massachusetts | | 5,000 | | | Lease |
An excerpt. Shown here: 40 of 49 rewritten, all 2 added and all 0 removed. The counts are complete. For every sentence, read Item 2. PROPERTIES in the FY2018 filing and the FY2017 filing.
Item 4. MINE SAFETY DISCLOSURES
15 rewritten, 1 added, 0 removed, 42 unchanged
| Michael Balmuth | | [removed: 66] [added: 67] | | | Executive Chairman of the Board |
| Barbara Rentler | | [removed: 59] [added: 60] | | | Chief Executive Officer |
| Bernie Brautigan | | [removed: 52] [added: 53] | | | President, Merchandising, Ross Dress for Less |
| James S. Fassio | | [removed: 62] [added: 63] | | | President and Chief Development Officer |
| Brian Morrow | | [removed: 57] [added: 58] | | | President and Chief Merchandising Officer, [removed: dd's] [added: dd’s] DISCOUNTS |
| Michael O’Sullivan | | [removed: 53] [added: 54] | | | President and Chief Operating Officer |
| Lisa Panattoni | | [removed: 54] [added: 55] | | | President, Merchandising, Ross Dress for Less |
| John G. Call | | [removed: 58] [added: 59] | | | Executive Vice President, Finance and Legal, and Corporate Secretary |
| Michael J. Hartshorn | | [removed: 49] [added: 50] | | | [removed: Group Senior] [added: Executive] Vice President, Chief Financial Officer and Principal Accounting Officer |
Mr. Brautigan has served as President, Merchandising, Ross Dress for Less since March 2016 with responsibility for the Ladies and Children’s apparel businesses, Shoes, [added: Lingerie,] and Accessories.
From 2005 to 2009, he was Executive Vice President and Chief Administrative [removed: Officer] [added: Officer,] and Senior Vice President, Strategic Planning and Marketing from 2003 to 2005.
Before joining Ross, Mr. O’Sullivan was a partner with Bain & Company, providing consulting advice to retail, consumer goods, financial [removed: services] [added: services,] and private equity clients since 1991.
Ms. Panattoni has served as President, Merchandising, Ross Dress for Less since 2014 with responsibility for all of the Home businesses, Men’s, [removed: Lingerie,] and Cosmetics.
Mr. Hartshorn has served as [removed: Group Senior] [added: Executive] Vice President, Chief Financial Officer since March [removed: 2015.][added: 2018.]
Previously, he was [added: Group] Senior Vice [added: President, Chief Financial Officer from 2015 to 2018, Senior Vice] President and Chief Financial Officer from 2014 to [removed: March] 2015, [added: and] Senior Vice President and Deputy Chief Financial Officer from 2012 to [removed: 2014, Group Vice President, Finance and Treasurer from 2011 to 2012, and Vice President, Finance and Treasurer from 2006 to 2011.][added: 2014.]
He was also Group Vice President, Finance and Treasurer from 2011 to 2012, and Vice President, Finance and Treasurer from 2006 to 2011.
Item 5. MARKET FOR REGISTRANT’S COMMON EQUITY, RELATED STOCKHOLDER MATTERS AND ISSUER PURCHASES OF EQUITY SECURITIES
16 rewritten, 19 added, 10 removed, 20 unchanged
There were [removed: 847] [added: 886] stockholders of record as of March [removed: 6, 2017] [added: 12, 2018] and the closing stock price on that date was [removed: $67.40] [added: $76.43] per share.
On [removed: February 28, 2017,] [added: March 6, 2018,] our Board of Directors declared a quarterly cash dividend of [removed: $0.1600] [added: $0.2250] per common share, payable on March [removed: 31, 2017.][added: 30, 2018.]
Our Board of Directors declared cash dividends of [removed: $0.1350] [added: $0.1600] per common share in [removed: March,] [added: February,] May, August, and November [removed: 2016,] [added: 2017,] cash dividends of [removed: $0.1175] [added: $0.1350] per common share in [removed: February,] [added: March,] May, August, and November [removed: 2015,] [added: 2016,] and cash dividends of [removed: $0.1000] [added: $0.1175] per common share in February, May, August, and November [removed: 2014.][added: 2015.]
Information regarding shares of common stock we repurchased during the fourth quarter of fiscal [removed: 2016] [added: 2017] is as follows:
| Period | | Total number of shares (or units) purchased¹ | | | Average price paid per share (or unit) | | Total number of shares (or units) purchased as part of publicly announced plans or programs | | | Maximum number (or approximate dollar value) of shares (or units) that may yet be purchased under the plans or programs ($000) | [added: |]
| November | | | | | | | | | | | [added: |]
| December | | | | | | | | | | | [added: |]
| January | | | | | | | | | | | [added: |]
| ¹ [added: All shares were repurchased under our publicly announced stock repurchase program.] We [removed: acquired 7,090] [added: did not acquire any] shares of treasury stock during the quarter ended [removed: January 28, 2017.] [added: February 3, 2018.] Treasury stock includes shares acquired from employees for tax withholding purposes related to vesting of restricted stock grants. [removed: All remaining shares were repurchased under our publicly announced stock repurchase program.] |
In February 2017, our Board of Directors approved a [removed: new,] two-year $1.75 billion stock repurchase program through fiscal 2018.
The graph below compares total stockholder returns over the last five years for our common stock with the Standard & Poor’s (“S&P”) 500 [removed: Index] [added: Index, the Dow Jones Apparel Retailers Index,] and the S&P Retailing Group.
These measurement dates are based on the historical month-end data available and [removed: may] vary slightly from our actual fiscal year-end date for each period.
Data with respect to returns for the S&P indexes [added: and the Dow Jones Apparel Retailers Index] is not readily available for periods shorter than one month.
Among Ross Stores, Inc., the S&P 500 Index, [removed: and] S&P Retailing [removed: Group][added: Group, and Dow Jones Apparel Retailers]
[removed: ][added: 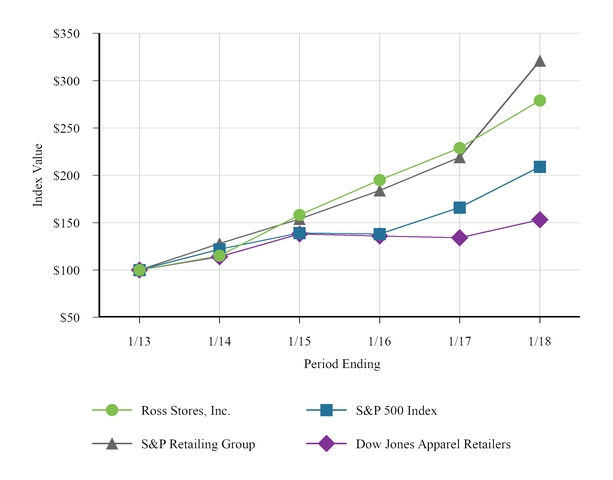]
| Company / Index | | [removed: 2012 | | |] 2013 | | | 2014 | | | 2015 | | | 2016 | | | 2017 | | [added: | 2018 | |]
| | | | | | | | | | | | |
| --- | --- | --- | --- | --- | --- | --- | --- | --- | --- | --- | --- |
| | | | | | | | | | | | |
| (10/29/2017 - 11/25/2017) | | 782,134 | | | $66.37 | | 782,134 | | | $1,049,300 | |
| (11/26/2017 - 12/30/2017) | | 1,151,156 | | | $77.30 | | 1,151,156 | | | $960,300 | |
| (12/31/2017 - 02/03/2018) | | 1,034,865 | | | $82.40 | | 1,034,865 | | | $875,000 | 2 |
| Total | | 2,968,155 | | | $76.20 | | 2,968,155 | | | $1,075,000 | 2 |
| | | | | |
| --- | --- | --- | --- | --- |
| | | | | |
| ² In March 2018, our Board of Directors approved an increase in the stock repurchase authorization for fiscal 2018 by $200 million to $1.075 billion, up from the previously available $875 million as of February 3, 2018. | | | | |
In March 2018, our Board of Directors approved an increase in the stock repurchase authorization for fiscal 2018 by $200 million to $1.075 billion, up from the previously available $875 million.
We are using the Dow Jones Apparel Retailers Index for the first time in our performance graph this year because we believe the retail companies comprising that index are more closely aligned with the segment of the retail industry in which we operate, and it provides a more relevant comparison against which to measure our stock performance.
For comparison purposes, we have also included the S&P Retailing Group in our fiscal 2017 performance graph.
We do not plan to include the S&P Retailing Group Index in next year’s performance graph.
| Ross Stores, Inc. | | 100 | | | 115 | | | 158 | | | 195 | | | 229 | | | 279 | |
| S&P 500 Index | | 100 | | | 122 | | | 139 | | | 138 | | | 166 | | | 209 | |
| S&P Retailing Group | | 100 | | | 128 | | | 154 | | | 184 | | | 219 | | | 321 | |
| Dow Jones Apparel Retailers | | 100 | | | 114 | | | 138 | | | 136 | | | 134 | | | 153 | |
| | | | | | | | | | | |
| --- | --- | --- | --- | --- | --- | --- | --- | --- | --- | --- |
| | | | | | | | | | | |
| (10/30/2016 - 11/26/2016) | | 662,860 | | | $64.23 | | 660,463 | | | $127,300 |
| (11/27/2016 - 12/31/2016) | | 1,074,861 | | | $67.66 | | 1,074,861 | | | $54,500 |
| (01/01/2017 - 01/28/2017) | | 829,184 | | | $66.15 | | 824,491 | | | $0 |
| Total | | 2,566,905 | | | $66.29 | | 2,559,815 | | | $0 |
| Ross Stores, Inc. | | 100 | | | 117 | | | 136 | | | 185 | | | 229 | | | 268 | |
| S&P 500 Index | | 100 | | | 117 | | | 142 | | | 162 | | | 161 | | | 193 | |
| S&P Retailing Group | | 100 | | | 129 | | | 163 | | | 196 | | | 231 | | | 274 | |
Item 6. SELECTED FINANCIAL DATA
39 rewritten, 1 added, 0 removed, 29 unchanged
| ($000, except per share data) | [removed: 2016] [added: 2017] | | | [added: ¹] | [removed: 2015] [added: 2016] | | | | [removed: 2014] [added: 2015] | | | | [removed: 2013] [added: 2014] | | | | [removed: 2012] [added: 2013] | | | [removed: ¹] |
| Sales | $ | [removed: 12,866,757] [added: 14,134,732] | | | $ | [removed: 11,939,999] [added: 12,866,757] | | | $ | [removed: 11,041,677] [added: 11,939,999] | | | $ | [removed: 10,230,353] [added: 11,041,677] | | | $ | [removed: 9,721,065] [added: 10,230,353] | | |
| Cost of goods sold | [removed: 9,173,705] [added: 10,042,638] | | | | [removed: 8,576,873] [added: 9,173,705] | | | | [removed: 7,937,956] [added: 8,576,873] | | | | [removed: 7,360,924] [added: 7,937,956] | | | | [removed: 7,011,428] [added: 7,360,924] | | | |
| Percent of sales | [removed: 71.3] [added: 71.0] | | % | | [removed: 71.8] [added: 71.3] | | % | | [removed: 71.9] [added: 71.8] | | % | | [removed: 72.0] [added: 71.9] | | % | | [removed: 72.1] [added: 72.0] | | % | |
| Selling, general and administrative | [removed: 1,890,408] [added: 2,043,698] | | | | [removed: 1,738,755] [added: 1,890,408] | | | | [removed: 1,615,371] [added: 1,738,755] | | | | [removed: 1,526,366] [added: 1,615,371] | | | | [removed: 1,437,886] [added: 1,526,366] | | | |
| Percent of sales | [removed: 14.7] [added: 14.5] | | % | | [removed: 14.6] [added: 14.7] | | % | | 14.6 | | % | | [removed: 14.9] [added: 14.6] | | % | | [removed: 14.8] [added: 14.9] | | % | |
| Interest expense (income), net | [added: 7,676 | | | |] 16,488 | | | | 12,612 | | | | 2,984 | | | | (247 | | ) | | [removed: 6,907 | | | |]
| Earnings before taxes | [removed: 1,786,156] [added: 2,040,720] | | | | [removed: 1,611,759] [added: 1,786,156] | | | | [removed: 1,485,366] [added: 1,611,759] | | | | [removed: 1,343,310] [added: 1,485,366] | | | | [removed: 1,264,844] [added: 1,343,310] | | | |
| Percent of sales | [removed: 13.9] [added: 14.4] | | % | | [removed: 13.5] [added: 13.9] | | % | | 13.5 | | % | | [removed: 13.1] [added: 13.5] | | % | | [removed: 13.0] [added: 13.1] | | % | |
| Provision for taxes on earnings | [removed: 668,502] [added: 677,967] | | | | [removed: 591,098] [added: 668,502] | | | | [removed: 560,642] [added: 591,098] | | | | [removed: 506,006] [added: 560,642] | | | | [removed: 478,081] [added: 506,006] | | | |
| Net earnings | $ | [removed: 1,117,654] [added: 1,362,753] | | | $ | [removed: 1,020,661] [added: 1,117,654] | | | $ | [removed: 924,724] [added: 1,020,661] | | | $ | [removed: 837,304] [added: 924,724] | | | $ | [removed: 786,763] [added: 837,304] | | |
| Percent of sales | [removed: 8.7] [added: 9.6] | | % | | [removed: 8.5] [added: 8.7] | | % | | [removed: 8.4] [added: 8.5] | | % | | [removed: 8.2] [added: 8.4] | | % | | [removed: 8.1] [added: 8.2] | | % | |
| Basic earnings per share² | $ | [removed: 2.85] [added: 3.58] | | [added: 4] | $ | [removed: 2.53] [added: 2.85] | | | $ | [removed: 2.24] [added: 2.53] | | | $ | [removed: 1.97] [added: 2.24] | | | $ | [removed: 1.80] [added: 1.97] | | |
| Diluted earnings per share² | $ | [removed: 2.83] [added: 3.55] | | [added: 4] | $ | [removed: 2.51] [added: 2.83] | | | $ | [removed: 2.21] [added: 2.51] | | | $ | [removed: 1.94] [added: 2.21] | | | $ | [removed: 1.77] [added: 1.94] | | |
| per common share² | $ | [removed: 0.540] [added: 0.640] | | | $ | [removed: 0.470] [added: 0.540] | | | $ | [removed: 0.400] [added: 0.470] | | | $ | [removed: 0.255] [added: 0.400] | | [removed: ³] | $ | [removed: 0.295] [added: 0.255] | | [added: ³] |
| ¹ Fiscal [removed: 2012] [added: 2017] was a 53-week year; all other fiscal years presented were 52 weeks. | | | | | | | | | | | | | | | | | | | | |
| ³ Dividend declaration of $0.10 per share for the fourth [removed: quarter] [added: quarter,] which historically had been declared in [removed: January] [added: January,] was declared in February 2014. | | | | | | | | | | | | | | | | | | | | |
| ($000, except per share data) | | [removed: 2016] [added: 2017] | | | [added: 1] | [removed: 2015] [added: 2016] | | | | [removed: 2014] [added: 2015] | | | | [removed: 2013] [added: 2014] | | | | [removed: 2012] [added: 2013] | | | [removed: 1] |
| Cash and cash equivalents | | $ | [removed: 1,111,599] [added: 1,290,294] | | | $ | [removed: 761,602] [added: 1,111,599] | | | $ | [removed: 696,608] [added: 761,602] | | | $ | [removed: 423,168] [added: 696,608] | | | $ | [removed: 646,761] [added: 423,168] | | |
| Merchandise inventory | | [removed: 1,512,886] [added: 1,641,735] | | | | [removed: 1,419,104] [added: 1,512,886] | | | | [removed: 1,372,675] [added: 1,419,104] | | | | [removed: 1,257,155] [added: 1,372,675] | | | | [removed: 1,209,237] [added: 1,257,155] | | | |
| Property and equipment, net | | [removed: 2,328,048] [added: 2,382,464] | | | | [removed: 2,342,906] [added: 2,328,048] | | | | [removed: 2,273,752] [added: 2,342,906] | | | | [removed: 1,875,299] [added: 2,273,752] | | | | [removed: 1,493,284] [added: 1,875,299] | | | |
| Total assets | | [removed: 5,309,351] [added: 5,722,051] | | | | [removed: 4,869,119] [added: 5,309,351] | | | | [removed: 4,687,370] [added: 4,869,119] | | | | [removed: 3,886,251] [added: 4,687,370] | | | | [removed: 3,649,782] [added: 3,886,251] | | | |
| Return on average assets | | [removed: 22] [added: 25] | | % | | [removed: 21] [added: 22] | | % | | [removed: 22] [added: 21] | | % | | 22 | | % | | [removed: 23] [added: 22] | | % | |
| Working capital | | [removed: 1,060,543] [added: 1,224,755] | | | | [removed: 769,348] [added: 1,060,543] | | | | [removed: 590,471] [added: 769,348] | | | | [removed: 463,875] [added: 590,471] | | | | [removed: 588,438] [added: 463,875] | | | |
| Current ratio | | 1.6:1 | | | | [removed: 1.5:1] [added: 1.6:1] | | | | [removed: 1.4:1] [added: 1.5:1] | | | | [removed: 1.3:1] [added: 1.4:1] | | | | [removed: 1.4:1] [added: 1.3:1] | | | |
| Long-term debt | | [removed: 396,493] [added: 396,967] | | | | [removed: 396,025] [added: 396,493] | | | | [removed: 395,562] [added: 396,025] | | | | [removed: 149,681] [added: 395,562] | | | | [removed: 149,628] [added: 149,681] | | | |
| of total capitalization | | [removed: 13] [added: 12] | | % | | [removed: 14] [added: 13] | | % | | [removed: 15] [added: 14] | | % | | [removed: 7] [added: 15] | | % | | [removed: 8] [added: 7] | | % | |
| [removed: Stockholders'] [added: Stockholders’] equity | | [removed: 2,748,017] [added: 3,049,308] | | | | [removed: 2,471,991] [added: 2,748,017] | | | | [removed: 2,279,210] [added: 2,471,991] | | | | [removed: 2,007,302] [added: 2,279,210] | | | | [removed: 1,766,863] [added: 2,007,302] | | | |
| [removed: stockholders'] [added: stockholders’] equity | | [removed: 43] [added: 47] | | % | | 43 | | % | | 43 | | % | | [removed: 44] [added: 43] | | % | | [removed: 48] [added: 44] | | % | |
| outstanding at year-end2 | | $ | [removed: 7.01] [added: 8.03] | | | $ | [removed: 6.14] [added: 7.01] | | | $ | [removed: 5.49] [added: 6.14] | | | $ | [removed: 4.70] [added: 5.49] | | | $ | [removed: 4.00] [added: 4.70] | | |
| Number of stores opened | | [removed: 93] [added: 96] | | | | [removed: 90] [added: 93] | | | | [removed: 95] [added: 90] | | | | [removed: 88] [added: 95] | | | | [removed: 82] [added: 88] | | | |
| Number of stores closed | | [removed: 6] [added: 7] | | | | 6 | | | | [removed: 9] [added: 6] | | | | [removed: 11] [added: 9] | | | | [removed: 8] [added: 11] | | | |
| Number of stores at year-end | | [removed: 1,533] [added: 1,622] | | | | [removed: 1,446] [added: 1,533] | | | | [removed: 1,362] [added: 1,446] | | | | [removed: 1,276] [added: 1,362] | | | | [removed: 1,199] [added: 1,276] | | | |
| (52-week basis) | | 4 | | % | | 4 | | % | | [removed: 3] [added: 4] | | % | | 3 | | % | | [removed: 6] [added: 3] | | % | |
| selling space (52-week basis) | | $ | [removed: 395] [added: 409] | | | $ | [removed: 383] [added: 395] | | | $ | [removed: 372] [added: 383] | | | $ | [removed: 362] [added: 372] | | | $ | [removed: 355] [added: 362] | | |
| at year-end (000) | | [removed: 33,300] [added: 34,700] | | | | [removed: 31,900] [added: 33,300] | | | | [removed: 30,400] [added: 31,900] | | | | [removed: 28,900] [added: 30,400] | | | | [removed: 27,800] [added: 28,900] | | | |
| Number of employees at year-end | | [removed: 78,600] [added: 82,700] | | | | [removed: 77,800] [added: 78,600] | | | | [removed: 71,400] [added: 77,800] | | | | [removed: 66,300] [added: 71,400] | | | | [removed: 57,500] [added: 66,300] | | | |
| of record at year-end | | [removed: 848] [added: 880] | | | | [removed: 842] [added: 848] | | | | [removed: 817] [added: 842] | | | | [removed: 823] [added: 817] | | | | [removed: 831] [added: 823] | | | |
| ¹ Fiscal [removed: 2012] [added: 2017] was a 53-week year; all other fiscal years presented were 52 weeks. | | | | | | | | | | | | | | | | | | | | | |
| 4 Includes a per share benefit of approximately $0.21 from tax reform legislation enacted in December 2017 and $0.10 from the 53rd week. | | | | | | | | | | | | | | | | | | | | |
Item 8. FINANCIAL STATEMENTS AND SUPPLEMENTARY DATA
279 rewritten, 109 added, 89 removed, 398 unchanged
| ($000, except per share data) | | [removed: January 28, 2017] [added: February 3, 2018] | | | | January [removed: 30, 2016] [added: 28, 2017] | | | | January [removed: 31, 2015] [added: 30, 2016] | | |
| Sales | | $ | [removed: 12,866,757] [added: 14,134,732] | | | $ | [removed: 11,939,999] [added: 12,866,757] | | | $ | [removed: 11,041,677] [added: 11,939,999] | |
| Cost of goods sold | | [removed: 9,173,705] [added: 10,042,638] | | | | [removed: 8,576,873] [added: 9,173,705] | | | | [removed: 7,937,956] [added: 8,576,873] | | |
| Selling, general and administrative | | [removed: 1,890,408] [added: 2,043,698] | | | | [removed: 1,738,755] [added: 1,890,408] | | | | [removed: 1,615,371] [added: 1,738,755] | | |
| Interest expense, net | | [removed: 16,488] [added: 7,676] | | | | [removed: 12,612] [added: 16,488] | | | | [removed: 2,984] [added: 12,612] | | |
| Total costs and expenses | | [removed: 11,080,601] [added: 12,094,012] | | | | [removed: 10,328,240] [added: 11,080,601] | | | | [removed: 9,556,311] [added: 10,328,240] | | |
| Earnings before taxes | | [removed: 1,786,156] [added: 2,040,720] | | | | [removed: 1,611,759] [added: 1,786,156] | | | | [removed: 1,485,366] [added: 1,611,759] | | |
| Provision for taxes on earnings | | [removed: 668,502] [added: 677,967] | | | | [removed: 591,098] [added: 668,502] | | | | [removed: 560,642] [added: 591,098] | | |
| Net earnings | | $ | [removed: 1,117,654] [added: 1,362,753] | | | $ | [removed: 1,020,661] [added: 1,117,654] | | | $ | [removed: 924,724] [added: 1,020,661] | |
| Basic | | $ | [removed: 2.85] [added: 3.58] | | | $ | [removed: 2.53] [added: 2.85] | | | $ | [removed: 2.24] [added: 2.53] | |
| Diluted | | $ | [removed: 2.83] [added: 3.55] | | | $ | [removed: 2.51] [added: 2.83] | | | $ | [removed: 2.21] [added: 2.51] | |
| Basic | | [removed: 392,124] [added: 381,174] | | | | [removed: 403,034] [added: 392,124] | | | | [removed: 413,553] [added: 403,034] | | |
| Diluted | | [removed: 394,958] [added: 384,329] | | | | [removed: 406,405] [added: 394,958] | | | | [removed: 418,077] [added: 406,405] | | |
| ($000) | [removed: | January 28,] 2017 | | | | [removed: January 30,] 2016 | | | | [removed: January 31,] 2015 | | |
| Net earnings | | $ | [removed: 1,117,654] [added: 1,362,753] | | | $ | [removed: 1,020,661] [added: 1,117,654] | | | $ | [removed: 924,724] [added: 1,020,661] | |
| Change in unrealized loss on investments, net of tax | | [removed: (91] [added: (64] | | ) | | [removed: (148] [added: (91] | | ) | | [removed: (59] [added: (148] | | ) |
| Comprehensive income | | $ | [removed: 1,117,563] [added: 1,362,689] | | | $ | [removed: 1,020,513] [added: 1,117,563] | | | $ | [removed: 924,665] [added: 1,020,513] | |
| ($000, except share data) | [removed: January 28, 2017] [added: February 3, 2018] | | | | January [removed: 30, 2016] [added: 28, 2017] | | |
| Cash and cash equivalents | $ | [removed: 1,111,599] [added: 1,290,294] | | | $ | [removed: 761,602] [added: 1,111,599] | |
| Short-term investments | [removed: —] [added: 512] | | | | [removed: 1,737] [added: —] | | |
| Accounts receivable | [removed: 75,154] [added: 87,868] | | | | [removed: 73,627] [added: 75,154] | | |
| Merchandise inventory | [removed: 1,512,886] [added: 1,641,735] | | | | [removed: 1,419,104] [added: 1,512,886] | | |
| Prepaid expenses and other | [removed: 113,410] [added: 130,748] | | | | [removed: 116,125] [added: 113,410] | | |
| Total current assets | [removed: 2,813,049] [added: 3,151,157] | | | | [removed: 2,372,195] [added: 2,813,049] | | |
| Land and buildings | [removed: 1,101,334] [added: 1,109,173] | | | | [removed: 1,084,328] [added: 1,101,334] | | |
| Fixtures and equipment | [removed: 2,421,645] [added: 2,603,318] | | | | [removed: 2,244,790] [added: 2,421,645] | | |
| Leasehold improvements | [removed: 998,508] [added: 1,093,634] | | | | [removed: 920,392] [added: 998,508] | | |
| Construction-in-progress | [removed: 69,767] [added: 102,054] | | | | [removed: 90,399] [added: 69,767] | | |
| Less accumulated depreciation and amortization | [removed: 2,263,206] [added: 2,525,715] | | | | [removed: 1,997,003] [added: 2,263,206] | | |
| Property and equipment, net | [removed: 2,328,048] [added: 2,382,464] | | | | [removed: 2,342,906] [added: 2,328,048] | | |
| Long-term investments | [removed: 1,288] [added: 712] | | | | [removed: 1,331] [added: 1,288] | | |
| Other long-term assets | [removed: 166,966] [added: 187,718] | | | | [removed: 152,687] [added: 166,966] | | |
| Total assets | $ | [removed: 5,309,351] [added: 5,722,051] | | | $ | [removed: 4,869,119] [added: 5,309,351] | |
| Accounts payable | $ | [removed: 1,021,735] [added: 1,059,844] | | | $ | [removed: 945,559] [added: 1,021,735] | |
| Accrued expenses and other | [removed: 398,126] [added: 431,706] | | | | [removed: 376,522] [added: 398,126] | | |
| Accrued payroll and benefits | [removed: 316,492] [added: 349,879] | | | | [removed: 280,766] [added: 316,492] | | |
| Income taxes payable | [removed: 16,153] [added: —] | | | | [removed: —] [added: 16,153] | | |
| Total current liabilities | [removed: 1,752,506] [added: 1,926,402] | | | | [removed: 1,602,847] [added: 1,752,506] | | |
| Long-term debt | [removed: 396,493] [added: 311,994] | | | | [removed: 396,025] [added: 396,493] | | |
| Other long-term liabilities | [removed: 290,950] [added: 348,541] | | | | [removed: 268,168] [added: 290,950] | | |
| ($000) | | February 3, 2018 | | | | January 28, 2017 | | | | January 30, 2016 | | |
| | 4,908,179 | | | | 4,591,254 | | |
| Current portion of long-term debt | 84,973 | | | | — | | |
| Net earnings | | — | | | — | | | | — | | | | — | | | | — | | | 1,362,753 | | | | 1,362,753 | | |
| Cumulative effect of adoption of | | | | | | | | | | | | | | | | | | | | | | | | | | |
| accounting standard | | — | | | — | | | | 1,789 | | | | — | | | | — | | | (1,113 | | ) | | 676 | | |
| used for tax withholding | | 1,214 | | | 12 | | | | 18,456 | | | | (45,433 | | ) | | — | | | — | | | | (26,965 | | ) |
| Common stock repurchased | | (13,489 | ) | | (135 | | ) | | (31,013 | | ) | | — | | | | — | | | (843,852 | | ) | | (875,000 | | ) |
| Balance at February 3, 2018 | | 379,618 | | | $ | 3,796 | | | $ | 1,292,364 | | | $ | (318,279 | ) | | $27 | | | $ | 2,071,400 | | | $ | 3,049,308 | |
| ($000) | | February 3, 2018 | | | | January 28, 2017 | | | | January 30, 2016 | | |
| Gain on sale of assets | | (6,328 | | ) | | — | | | | — | | |
| Proceeds from sale of property and equipment | | 15,981 | | | | — | | | | — | | |
Fiscal 2017 was a 53-week year.
Fiscal 2016 and 2015 were each 52-week years.
In fiscal 2017, the Company closed seven stores.
| February 3, 2018 | | $ | 8,406 | | | $ | 784,076 | | | $ | (782,580 | ) | | $ | 9,902 | |
| | | | | | | | | | | | | |
| | | | | | | | | | | | | |
| Shares | | 381,174 | | | | 3,155 | | | | 384,329 | | |
| Amount | | $ | 3.58 | | | $ | (0.03 | ) | | $ | 3.55 | |
Adoption will result in a change in the timing of recognizing revenue from breakage for stored value cards.
Breakage will be estimated and recognized based upon the historical pattern of redemption, rather than when redemption is considered remote.
Additionally, the Company will recognize allowances for estimated sales returns on a gross rather than net basis in its Consolidated Financial Statements.
The impact of estimating sales returns on a gross basis is not expected to be material.
The Company plans to adopt ASC 606 under the modified retrospective method and will recognize a cumulative-effect adjustment to increase retained earnings by approximately $20 million, net of income taxes as of February 4, 2018.
Recently adopted accounting standards.
The Company adopted ASU 2016-09 in the first quarter of fiscal 2017, and elected to apply this adoption prospectively, except for forfeitures which it adopted on a modified retrospective basis.
Accordingly, prior periods have not been adjusted.
As a result of adoption, for the fiscal year ended February 3, 2018, the Company recognized $16.3 million of excess tax benefits related to stock-based payments as a reduction to its provision for income taxes.
These items were historically recorded in additional paid-in capital.
The Company also presented cash flows related to excess tax benefits as an operating activity in the Consolidated Statement of Cash Flows and elected to account for forfeitures as incurred beginning on January 29, 2017.
The impact of this accounting policy election for forfeitures was a cumulative-effect adjustment to decrease retained earnings by $1.1 million, net of tax, as of January 29, 2017.
There were no transfers between Level 1 and Level 2 categories during the fiscal year ended February 3, 2018.
The tax benefits related to stock-based compensation expense for fiscal 2017, 2016, and 2015 were $29.5 million, $25.9 million, and $24.7 million, respectively.
| Total long-term debt | | $ | 396,967 | | | $ | 396,493 | |
| Less: current portion | | 84,973 | | | | — | | |
| Total due beyond one year | | $ | 311,994 | | | $ | 396,493 | |
| 2022 | | | $ | — | |
| | | | | | | | | | | | | |
| | | | | | | | | | | | | |
| | 4,591,254 | | | | 4,339,909 | | |
| Balance at February 1, 2014 | | 426,840 | | | $ | 4,268 | | | $ | 933,457 | | | $ | (121,559 | ) | | $389 | | | $ | 1,190,747 | | | $ | 2,007,302 | |
| Net earnings | | — | | | — | | | | — | | | | — | | | | — | | | 924,724 | | | | 924,724 | | |
| used for tax withholding | | 2,904 | | | 29 | | | | 21,949 | | | | (39,041 | | ) | | — | | | — | | | | (17,063 | | ) |
| Tax benefit from equity issuance | | — | | | — | | | | 29,759 | | | | — | | | | — | | | — | | | | 29,759 | | |
| Common stock repurchased | | (14,805 | ) | | (148 | | ) | | (24,559 | | ) | | — | | | | — | | | (525,293 | | ) | | (550,000 | | ) |
| | | | | | | | | | | | |
| --- | --- | --- | --- | --- | --- | --- | --- | --- | --- | --- | --- |
| | | | | | | | | | | | |
| Tax benefit from equity issuance | 23,331 | | | | 42,382 | | | | 29,759 | | |
| | | | | | | | | | | | |
| | | | | | | | | | | | |
| Excess tax benefit from stock-based compensation | 23,331 | | | | 42,302 | | | | 29,415 | | |
| Net proceeds from issuance of long-term debt | — | | | | — | | | | 245,676 | | |
| | | | | | | | | | | | |
| | | | | | | | | | | | |
| | | | | | | | | | | | |
| | | | | | | | | | | | |
Stock dividend.
In March 2015, the Company’s Board of Directors declared a two\-for-one stock split of the Company’s common stock issued in the form of a stock dividend.
Stockholders of record as of April 22, 2015 were issued one additional share of common stock on June 11, 2015 for each share held.
All share and per share amounts have been adjusted to reflect the stock split.
related ancillary costs at the time the liability is incurred.
| January 31, 2015 | | $ | 7,431 | | | $ | 717,040 | | | $ | (715,877 | ) | | $ | 8,594 | |
| 2014 | | | | | | | | | | | | |
| Shares | | 413,553 | | | | 4,524 | | | | 418,077 | | |
| Amount | | $ | 2.24 | | | $ | (0.03 | ) | | $ | 2.21 | |
The Company is currently evaluating the effect adoption of this new guidance will have on its consolidated financial statements.
ASU 2016-09 is effective for the Company beginning in the first quarter of 2017.
Upon adoption of ASU 2016-09, the Company plans to account for forfeitures as incurred and expects this adoption along with the retrospective impact on its classification of cash flows between operating and financing activities to be immaterial.
The Company believes the impact of recording excess tax benefits in income taxes in its consolidated statement of earnings may be material.
See Note F for disclosure of the Company's historical accounting treatment of excess tax benefits.
statement of cash flows.
| Level 1 | | $ | — | | | $ | 3,736 | |
| Level 2 | | $ | 3,628 | | | $ | — | |
Restricted investments in government bonds with a fair value of $3.6 million at January 28, 2017 were transferred from Level 1 into Level 2 due to the market for the identical bonds being inactive.
No stock options were granted during fiscal 2016, 2015, and 2014.
| Total | | $ | 396,493 | | | $ | 396,025 | |
In April 2016, the Company entered into a new $600 million unsecured revolving credit facility.
The revolving credit facility may be extended, at the Company’s option, for up to two additional one year periods, subject to customary conditions.
An excerpt. Shown here: 40 of 279 rewritten, 40 of 109 added and 40 of 89 removed. The counts are complete. For every sentence, read Item 8. FINANCIAL STATEMENTS AND SUPPLEMENTARY DATA in the FY2018 filing and the FY2017 filing.
Item 9A. CONTROLS AND PROCEDURES
3 rewritten, 0 added, 0 removed, 16 unchanged
Based on our evaluation under the framework in Internal Control — Integrated Framework (2013), our management concluded that our internal control over financial reporting was effective as of [removed: January 28, 2017.][added: February 3, 2018.]
Our internal control over financial reporting as of [removed: January 28, 2017] [added: February 3, 2018] has also been audited by Deloitte & Touche LLP, an independent registered public accounting firm, and their opinion as to the effectiveness of our internal control over financial reporting is stated in their report, dated [removed: March 28, 2017,] [added: April 3, 2018,] which is included in Item 8 in this Annual Report on Form 10-K.
Our management, with the participation of our Chief Executive Officer and Chief Financial Officer, also conducted an evaluation of our internal control over financial reporting to determine whether any change occurred during the fourth fiscal quarter of [removed: 2016] [added: 2017] that has materially affected, or is reasonably likely to materially affect, our internal control over financial reporting.
Item 10. DIRECTORS, EXECUTIVE OFFICERS AND CORPORATE GOVERNANCE
2 rewritten, 0 added, 0 removed, 3 unchanged
Information required by Item 401 of Regulation S-K is incorporated herein by reference to the sections entitled “Executive Officers of the Registrant” at the end of Part I of this report; and to the sections of the Ross Stores, Inc. Proxy Statement for the Annual Meeting of Stockholders to be held on Wednesday, May [removed: 17, 2017] [added: 23, 2018] (the “Proxy Statement”) entitled “Information Regarding Nominees and Incumbent Directors.” Information required by Item 405 of Regulation S-K is incorporated by reference to the Proxy Statement under the section titled “Section 16(a) Beneficial Ownership Reporting Compliance.” Since our last Annual Report on Form 10-K, we have not made any material changes to the procedures by which our stockholders may recommend nominees to the Board of Directors.
Our Board of Directors has adopted a Code of Ethics for Senior Financial Officers that applies to the [removed: Company's] [added: Company’s] Executive Chairman; Chief Executive Officer; Chief Operating Officer; Chief Merchandising Officer; [added: President, Merchandising;] Chief Development Officer; Executive Vice President, Finance and Legal; Chief Financial Officer; [removed: Group] [added: Senior] Vice President, Controller; [removed: Group] [added: Senior] Vice President, [removed: Finance and Treasurer;] [added: Finance; Group] Vice President, Accounting and Assistant Controller; Vice [removed: President] [added: President,] Finance (FP&A); [added: Group] Vice [removed: President] [added: President,] Tax; Assistant Treasurer; Investor and Media Relations personnel; and [added: successor and] other positions that may be designated by the Company.
Item 12. SECURITY OWNERSHIP OF CERTAIN BENEFICIAL OWNERS AND MANAGEMENT AND RELATED STOCKHOLDER MATTERS
4 rewritten, 3 added, 3 removed, 9 unchanged
The following table summarizes the equity compensation plans under which the Company’s common stock may be issued as of [removed: January 28, 2017:][added: February 3, 2018:]
| approved by security holders | | [removed: 49] [added: 655] | | 2 | [removed: $8.19] [added: —] | | | [removed: 17,737] [added: 17,203] | | 3 |
1 After approval by stockholders of the [removed: 2008] [added: 2017] Equity Incentive Plan in May [removed: 2008,] [added: 2017,] any shares remaining available for grant in the share reserves of [added: the 2008 Equity Incentive Plan were automatically canceled.]
3 Includes [removed: 5.6] [added: 5.3] million shares reserved for issuance under the Employee Stock Purchase Plan and [removed: 12.1] [added: 11.9] million shares reserved for issuance under the [removed: 2008] [added: 2017] Equity Incentive Plan.
| Total | | 655 | | | — | | | 17,203 | | |
2 Securities include shares underlying outstanding performance share awards where the performance measurement has occurred but that remain unsettled and unissued as of February 3, 2018.
The weighted-average exercise price in column (b) does not take these awards into account.
| Total | | 49 | | | $8.19 | | | 17,737 | | |
the 2004 Equity Incentive Plan, 1992 Stock Option Plan, the 2000 Equity Plan, the 1991 Outside Directors Stock Option Plan, and the 1988 Restricted Stock Plan were automatically canceled.
2 Represents shares reserved for options granted under the 2004 Equity Incentive Plan.
Item 15. EXHIBITS, FINANCIAL STATEMENT SCHEDULES
57 rewritten, 10 added, 12 removed, 74 unchanged
Consolidated Statements of Earnings for the years ended [added: February 3, 2018,] January 28, 2017, [removed: January 30, 2016,] and January [removed: 31, 2015.][added: 30, 2016.]
Consolidated Statements of Comprehensive Income for the years ended [added: February 3, 2018,] January 28, 2017, [removed: January 30, 2016,] and January [removed: 31, 2015.][added: 30, 2016.]
Consolidated Balance Sheets at [removed: January 28, 2017] [added: February 3, 2018] and January [removed: 30, 2016.][added: 28, 2017.]
Consolidated Statements of [removed: Stockholders'] [added: Stockholders’] Equity for the years ended [added: February 3, 2018,] January 28, 2017, [removed: January 30, 2016,] and January [removed: 31, 2015.][added: 30, 2016.]
Consolidated Statements of Cash Flows for the years ended [added: February 3, 2018,] January 28, 2017, [removed: January 30, 2016,] and January [removed: 31, 2015.][added: 30, 2016.]
| Date: | [removed: March 28, 2017] [added: April 3, 2018] | | Barbara Rentler |
| /s/Barbara Rentler | | Chief Executive Officer, Director | | [removed: March 28, 2017] [added: April 3, 2018] |
| /s/Michael J. Hartshorn | | [removed: Group Senior] [added: Executive] Vice President, Chief Financial Officer, | | [removed: March 28, 2017] [added: April 3, 2018] |
| /s/Michael Balmuth | | Executive Chairman of the Board, Director | | [removed: March 28, 2017] [added: April 3, 2018] |
| /s/K. Gunnar Bjorklund | | Director | | [removed: March 28, 2017] [added: April 3, 2018] |
| /s/Michael J. Bush | | Director | | [removed: March 28, 2017] [added: April 3, 2018] |
| /s/Norman A. Ferber | | Chairman Emeritus of the Board, Director | | [removed: March 28, 2017] [added: April 3, 2018] |
| /s/Sharon D. Garrett | | Director | | [removed: March 28, 2017] [added: April 3, 2018] |
| /s/Stephen D. Milligan | | Director | | [removed: March 28, 2017] [added: April 3, 2018] |
| /s/Michael [removed: O'Sullivan] [added: O’Sullivan] | | President and Chief Operating Officer, Director | | [removed: March 28, 2017] [added: April 3, 2018] |
| /s/Larry S. Peiros | | Director | | [removed: March 28, 2017] [added: April 3, 2018] |
| 3.1 | | [removed: Certificate] [added: [Certificate] of Incorporation of Ross Stores, Inc. as amended (Corrected First Restated Certificate of Incorporation, dated March 17, 1999, together with amendments thereto through Amendment of Certificate of Incorporation dated May 29, 2015) incorporated by reference to Exhibit 3.1 to the Form 10-Q filed by Ross Stores, Inc. for its quarter ended August 1, [removed: 2015.] [added: 2015.](http://www.sec.gov/Archives/edgar/data/745732/000074573215000022/exhibit31certificateofamen.htm)] |
| 4.1 | | [removed: Note] [added: [Note] Purchase Agreement dated October 17, 2006, incorporated by reference to Exhibit 10.2 to the Form 10-Q filed by Ross Stores, Inc. for its quarter ended October 28, 2006. [added: ](http://www.sec.gov/Archives/edgar/data/745732/000120677406002502/rs101600ex102.htm)] |
| 4.2 | | [removed: Officers’] [added: [Officers’] Certificate, dated as of September 18, 2014, establishing the terms and form of the Notes, incorporated by reference to Exhibit 4.2 to the Form 8-K filed by Ross Stores on September 18, [removed: 2014.] [added: 2014.](http://www.sec.gov/Archives/edgar/data/745732/000120677414002845/exhibit4-2.htm)] |
| 4.3 | | [removed: Form] [added: [Form] of the 3.375% Senior Notes Due 2024, included in Exhibit 4.2 and incorporated by reference to Exhibit 4.2 to the Form 8-K filed by Ross Stores on September 18, [removed: 2014.] [added: 2014.](http://www.sec.gov/Archives/edgar/data/745732/000120677414002845/exhibit4-2.htm)] |
| 4.4 | | [removed: Indenture,] [added: [Indenture,] dated as of September 18, 2014, between Ross Stores, Inc. and U.S. Bank National Association, incorporated by reference to Exhibit 4.1 to the Form 8-K filed by Ross Stores on September 18, [removed: 2014.] [added: 2014.](http://www.sec.gov/Archives/edgar/data/745732/000120677414002845/exhibit4-1.htm)] |
| 10.1 | | [removed: Revolving] [added: [Revolving] Credit Agreement dated April 1, 2016 among Ross Stores, Inc. and various lenders, incorporated by reference to Exhibit 10.2 to the Form 10-Q filed by Ross Stores, Inc. for its quarter ended April 30, [removed: 2016.] [added: 2016.](http://www.sec.gov/Archives/edgar/data/745732/000074573216000053/exhibit102revolvingcredita.htm)] |
| MANAGEMENT CONTRACTS AND COMPENSATORY PLANS (EXHIBITS [removed: 10.3] [added: 10.2] - [removed: 10.38)] [added: 10.33)] | | |
| [removed: 10.3] [added: 10.2] | | [removed: Amended] [added: [Amended] and Restated Ross Stores, Inc. Employee Stock Purchase Plan (amended and restated on March 11, 2015), incorporated by reference to Exhibit 10.1 filed by Ross Stores, Inc. for its quarter ended August 1, [removed: 2015.] [added: 2015.](http://www.sec.gov/Archives/edgar/data/745732/000074573215000022/exhibit101amendedandrestat.htm)] |
| [removed: 10.4] [added: 10.5] | | [removed: Ross Stores Executive Medical Plan,] [added: [Ross Stores, Inc. 2008 Equity Incentive Plan (as amended through May 21, 2014),] incorporated by reference to Exhibit [removed: 10.9] [added: 10.18] to the Form 10-K filed by Ross Stores, Inc. for its fiscal year ended January 30, [removed: 1999.] [added: 2016.](http://www.sec.gov/Archives/edgar/data/745732/000074573216000037/exhibit10182008equityincen.htm)] |
| [removed: 10.5] [added: 3.2] | | [added: [Amended and Restated Bylaws of] Ross [removed: Stores Executive Dental Plan,] [added: Stores, Inc. (as amended March 8, 2017),] incorporated by reference to Exhibit [removed: 10.10] [added: 3.2] to the Form 10-K filed by Ross Stores, Inc. for its fiscal year ended January [removed: 30, 1999.] [added: 28, 2017. ](http://www.sec.gov/Archives/edgar/data/745732/000074573217000009/exhibit32amendedandrestate.htm)] |
| [removed: 10.7] [added: 10.4] | | [removed: Second] [added: [Second] Amended and Restated Ross Stores, Inc. Incentive Compensation Plan (as amended effective May 18, 2016), incorporated by reference Exhibit 10.1 to the Form 10-Q filed by Ross Stores, Inc. on July 30, [removed: 2016.] [added: 2016.](http://www.sec.gov/Archives/edgar/data/745732/000074573216000059/exhibit101rossstores2ndame.htm)] |
| 10.9 | | [removed: Form] [added: [Form] of [added: Restricted] Stock [removed: Option Agreement for Non-Employee Directors for options granted pursuant to Ross Stores, Inc. 2004 Equity Incentive Plan,] [added: Agreement,] incorporated by reference to Exhibit [removed: 10.3] [added: 10.4] to the Form 10-Q filed by Ross Stores, Inc. for its quarter ended July [removed: 30, 2005.] [added: 29, 2017. ](http://www.sec.gov/Archives/edgar/data/745732/000074573217000030/exhibit104formofrestricted.htm)] |
| [removed: 10.12] [added: 10.7] | | [removed: Form] [added: [Form] of Restricted Stock Agreement, incorporated by reference to Exhibit 10.2 to the Form 10-Q filed by Ross Stores, Inc. for its quarter ended May 2, 2009. [added: ](http://www.sec.gov/Archives/edgar/data/745732/000120677409001173/exhibit10-2.htm)] |
| [removed: 10.13] [added: 10.8] | | [removed: Form] [added: [Form] of Restricted Stock Agreement, incorporated by reference to Exhibit 10.2 to the Form 10-Q filed by Ross Stores, Inc. for its quarter ended May 3, 2014. [added: ](http://www.sec.gov/Archives/edgar/data/745732/000074573214000011/exhibit102formofrestricted.htm)] |
| [removed: 10.14] [added: 10.11] | | [removed: Form] [added: [Form] of Restricted Stock Agreement for Nonemployee Director, incorporated by reference to Exhibit [removed: 10.3] [added: 10.5] to the Form 10-Q filed by Ross Stores, Inc. for its quarter ended [removed: May 2, 2009.] [added: July 29, 2017. ](http://www.sec.gov/Archives/edgar/data/745732/000074573217000030/exhibit105formofrestricted.htm)] |
| [removed: 10.15] [added: 10.13] | | [removed: Form of Notice of Grant] [added: [Form] of Performance [removed: Shares and Performance] Share [removed: Agreement under the Ross Stores, Inc. 2008 Equity Incentive Plan,] [added: Agreement,] incorporated by reference to Exhibit [removed: 10.2] [added: 10.6] to the Form 10-Q filed by Ross Stores, Inc. for its quarter ended July [removed: 30, 2011.] [added: 29, 2017. ](http://www.sec.gov/Archives/edgar/data/745732/000074573217000030/exhibit106formofperformanc.htm)] |
| [removed: 10.16] [added: 10.12] | | [removed: Form] [added: [Form] of Performance Shares Grant Agreement, incorporated by reference to Exhibit 10.1 to the Form 10-Q filed by Ross Stores, Inc. for its quarter ended May 3, 2014. [added: ](http://www.sec.gov/Archives/edgar/data/745732/000074573214000011/exhibit101forofperformance.htm)] |
| [removed: 10.17] [added: 10.14] | | [removed: Form] [added: [Form] of Indemnity Agreement between Ross Stores, Inc. for Directors and Executive Officers, incorporated by reference to Exhibit 10.26 to the Form 10-K filed by Ross Stores, Inc. for its fiscal year ended February 2, 2013. [added: ](http://www.sec.gov/Archives/edgar/data/745732/000074573213000006/exhibit1026rosstemplateind.htm)] |
| [removed: 10.18] [added: 10.15] | | [removed: Form] [added: [Forms] of Executive Employment [removed: Agreement,] [added: Agreement for Executive Officers,] incorporated by reference to Exhibit 10.3 to the Form 10-Q filed by Ross Stores, Inc. for its quarter ended [removed: May 3, 2014.] [added: April 30, 2016.](http://www.sec.gov/Archives/edgar/data/745732/000074573216000053/exhibit103formsofexecutive.htm)] |
| [removed: 10.19] [added: 10.16] | | [removed: Forms] [added: [Forms] of Executive Employment Agreement for Executive Officers, incorporated by reference to Exhibit 10.1 to the Form 10-Q filed by Ross Stores, Inc. for its quarter ended [removed: May 2, 2015.] [added: April 29, 2017. ](http://www.sec.gov/Archives/edgar/data/745732/000074573217000026/exhibit101formsofexecutive.htm)] |
| [removed: 10.20] [added: 10.26] | | [removed: Forms of] [added: [First] Amendment to [removed: Executive] Employment Agreement [removed: for Executive Officers,] [added: between Michael Balmuth and Ross Stores, Inc. dated March 15, 2015,] incorporated by reference to Exhibit 10.2 to the Form 10-Q filed by Ross Stores, Inc. for its quarter ended [removed: May 2, 2015.] [added: August 1, 2015.](http://www.sec.gov/Archives/edgar/data/745732/000074573215000022/exhibit102firstamendmentto.htm)] |
| [removed: 10.21] [added: 10.32] | | [removed: Forms of Executive Employment] [added: [Employment] Agreement [removed: for Executive Officers,] [added: effective March 16, 2017 between Michael Hartshorn and Ross Stores, Inc.,] incorporated by reference to Exhibit 10.3 to the Form 10-Q filed by Ross Stores, Inc. for its quarter ended April [removed: 30, 2016.] [added: 29, 2017. ](http://www.sec.gov/Archives/edgar/data/745732/000074573217000026/exhibit103executiveemploym.htm)] |
| [removed: 10.22] [added: 10.17] | | [removed: Amended] [added: [Amended] and Restated Independent Contractor Consultancy Agreement effective January 6, 2010 between Norman A. Ferber and Ross Stores, Inc., incorporated by reference to Exhibit 10.47 to the Form 10-K filed by Ross Stores, Inc. for its fiscal year ended January 30, 2010. [added: ](http://www.sec.gov/Archives/edgar/data/745732/000120677410000742/exhibit10-47.htm)] |
| [removed: 10.23] [added: 10.18] | | [removed: Amended] [added: [Amended] Independent Contractor Consultancy Agreement effective January 30, 2012 between Norman A. Ferber and Ross Stores, Inc., incorporated by reference to Exhibit 10.52 to the Form 10-K filed by Ross Stores, Inc. for its fiscal year ended January 28, 2012. [added: ](http://www.sec.gov/Archives/edgar/data/745732/000120677412001210/exhibit10-52.htm)] |
| /s/G. Orban | | Director | | April 3, 2018 |
| | | | | |
| | | | | |
| /s/G. L. Quesnel | | Director | | April 3, 2018 |
| 10.3 | | [Third Amended and Restated Ross Stores, Inc. Non-Qualified Deferred Compensation Plan effective December 31, 2008, as amended effective January 1, 2015 and October 1, 2017.](https://www.sec.gov/Archives/edgar/data/745732/000074573218000004/exhibit103nonqualifieddefe.htm) |
| 10.6 | | [Ross Stores, Inc. 2017 Equity Incentive Plan, incorporated by reference to Exhibit 99 to the Registration Statement on Form S-8 filed by Ross Stores, Inc. on May 17, 2017 (Registration No. 333-218052).](http://www.sec.gov/Archives/edgar/data/745732/000074573217000017/exhibit99rossstoresinc2017.htm) |
| 10.10 | | [Form of Restricted Stock Agreement for Nonemployee Director.](https://www.sec.gov/Archives/edgar/data/745732/000074573218000004/exhibit1010restrictedstock.htm) |
| 10.33 | | [Executive Employment Agreement effective March 16, 2016 between Bernard Brautigan and Ross Stores, Inc. ](https://www.sec.gov/Archives/edgar/data/745732/000074573218000004/exhibit1033executiveemploy.htm) |
| 21 | | [Subsidiaries.](https://www.sec.gov/Archives/edgar/data/745732/000074573218000004/exhibit21fy17subsidiaries.htm) |
| | | |
| /s/G. Orban | | Director | | March 28, 2017 |
| /s/G. L. Quesnel | | Director | | March 28, 2017 |
| 3.2 | | Amended and Restated Bylaws of Ross Stores, Inc. (as amended March 8, 2017). |
| 10.2 | | Underwriting Agreement, dated as of September 15, 2014, by and among Ross Stores, Inc., Merrill Lynch, Pierce, Fenner & Smith Incorporated, Wells Fargo Securities, LLC and J.P. Morgan Securities LLC, as representatives of the underwriters named therein, incorporated by reference to Exhibit 1.1 to the 8-K filed by Ross Stores on September 18, 2014. |
| 10.6 | | Third Amended and Restated Ross Stores, Inc. Non-Qualified Deferred Compensation Plan effective December 31, 2008, incorporated by reference to Exhibit 10.7 to the Form 10-Q filed by Ross Stores, Inc. for its quarter ended April 30, 2011. |
| 10.8 | | Second Amendment to the Ross Stores, Inc. 2004 Equity Incentive Plan effective March 22, 2007, incorporated by reference to Exhibit 10.7 to the Form 10-Q filed by Ross Stores, Inc. for its quarter ended May 5, 2007. |
| 10.10 | | Ross Stores, Inc. 2008 Equity Incentive Plan (as amended through May 21, 2014), incorporated by reference to Exhibit 10.18 to the Form 10-K filed by Ross Stores, Inc. for its fiscal year ended January 30, 2016. |
| 10.11 | | Form of Nonemployee Director Equity Notice of Grant of Restricted Stock Units and Restricted Stock Units Agreement under the Ross Stores, Inc. 2008 Equity Incentive Plan, incorporated by reference to Exhibit 99.3 to the Form 8-K filed by Ross Stores, Inc. on May 23, 2008. |
| 10.35 | | Executive Employment Agreement effective June 1, 2014 between Michael O'Sullivan and Ross Stores, Inc., incorporated by reference to Exhibit 10.1 to the Form 10-Q filed by Ross Stores, Inc. for its quarter ended August 2, 2014. |
| 10.37 | | Executive Employment Agreement effective March 16, 2015 between Michael Hartshorn and Ross Stores, Inc., incorporated by reference to Exhibit 10.7 to the Form 10-Q filed by Ross Stores, Inc. for its quarter ended May 2, 2015. |
| 10.38 | | Executive Employment Agreement effective December 7, 2015 between Brian Morrow and Ross Stores, Inc., incorporated by reference to Exhibit 10.1 to the Form 10-Q filed by Ross Stores, Inc. for its quarter ended April 30, 2016. |
| 21 | | Subsidiaries. |
An excerpt. Shown here: 40 of 57 rewritten, all 10 added and all 12 removed. The counts are complete. For every sentence, read Item 15. EXHIBITS, FINANCIAL STATEMENT SCHEDULES in the FY2018 filing and the FY2017 filing.