 filings.tools
Item 5. MARKET FOR REGISTRANT’S COMMON EQUITY, RELATED STOCKHOLDER MATTERS AND ISSUER PURCHASES OF EQUITY SECURITIES
7K characters. Original on sec.gov · Markdown
Item 5. MARKET FOR REGISTRANT’S COMMON EQUITY, RELATED STOCKHOLDER MATTERS AND ISSUER PURCHASES OF EQUITY SECURITIES
General information. See the information set forth under the caption “Quarterly Financial Data (Unaudited)” under Note K of Notes to Consolidated Financial Statements in Item 8 of this Annual Report on Form 10-K, which is incorporated herein by reference. Our stock is traded on The NASDAQ Global Select Market® under the symbol ROST. There were 1,014 stockholders of record as of March 8, 2021 and the closing stock price on that date was $120.37 per share.
Cash dividends. On March 2, 2021, our Board of Directors declared a quarterly cash dividend of $0.285 per common share, payable on March 31, 2021. Our Board of Directors declared a cash dividend of $0.285 per common share in March 2020. In May 2020, we temporarily suspended our quarterly dividends, due to the economic uncertainty stemming from the COVID-19 pandemic. Our Board of Directors declared cash dividends of $0.255 per common share in March, May, August, and November 2019, and cash dividends of $0.225 per common share in March, May, August, and November 2018.
Issuer purchases of equity securities. Information regarding shares of common stock we repurchased during the fourth quarter of fiscal 2020 is as follows:
| Period | Total number of shares (or units) purchased¹ | Average price paid per share (or unit) | Total number of shares (or units) purchased as part of publicly announced plans or programs | Maximum number (or approximate dollar value) of shares (or units) that may yet be purchased under the plans or programs ($000) | |||||||||||||||||||||||||||||||
| November | |||||||||||||||||||||||||||||||||||
| (11/01/2020 - 11/28/2020) | 1,381 | $94.80 | — | $1,142,533 | |||||||||||||||||||||||||||||||
| December | |||||||||||||||||||||||||||||||||||
| (11/29/2020 - 01/02/2021) | — | $0.00 | — | $1,142,533 | |||||||||||||||||||||||||||||||
| January | |||||||||||||||||||||||||||||||||||
| (01/03/2021 - 01/30/2021) | — | $0.00 | — | $1,142,533 | |||||||||||||||||||||||||||||||
| Total | 1,381 | $94.80 | — | $1,142,533 | |||||||||||||||||||||||||||||||
| ¹ We acquired 1,381 shares of treasury stock during the quarter ended January 30, 2021, which relates to shares acquired from employees for tax withholding purposes related to vesting of restricted stock grants. No shares were repurchased under our publicly announced stock repurchase program. |
In March 2019, our Board of Directors approved a two-year $2.55 billion stock repurchase program through fiscal 2020. Due to the economic uncertainty stemming from the COVID-19 pandemic and to manage liquidity, we suspended our stock repurchase program as of March 2020. We did not purchase any additional shares for the remainder of the fiscal year.
See Note H of Notes to Consolidated Financial Statements for equity compensation plan information. The information under Item 12 of this Annual Report on Form 10-K under the caption “Equity compensation plan information” is incorporated herein by reference.
Stockholder Return Performance Graph
The following information in this Item 5 shall not be deemed filed for purposes of Section 18 of the Securities Act of 1934, nor shall it be deemed incorporated by reference in any filing under the Securities Act of 1933.
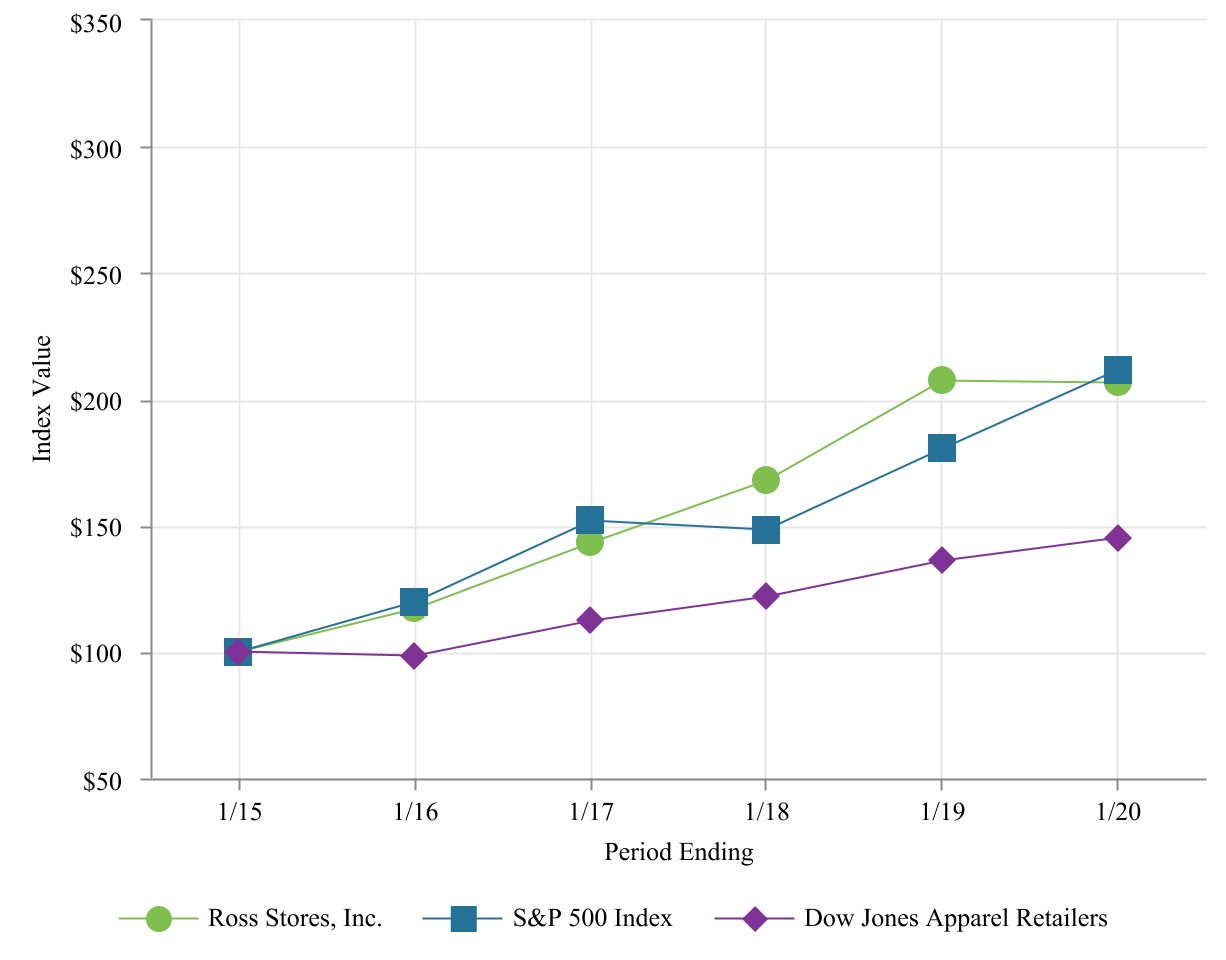
The graph below compares total stockholder returns over the last five years for our common stock to the Standard & Poor’s 500 Index (“S&P Index”) and the Dow Jones Apparel Retailers Index.
We use the Dow Jones Apparel Retailers Index in our performance graph because we believe the retail companies comprising that index are aligned with the segment of the retail industry in which we operate, and it provides a relevant comparison against which to measure our stock performance.
The cumulative total return listed below assumed an initial investment of $100 and reinvestment of dividends at each fiscal year-end, and measures the performance of this investment as of the last trading day in the month of January for each of the following five years. These measurement dates are based on the historical month-end data available and vary slightly from our actual fiscal year-end date for each period. Data with respect to returns for the S&P Index and the Dow Jones Apparel Retailers Index is not readily available for periods shorter than one month. The graph is a historical representation of past performance only and is not necessarily indicative of future performance.
COMPARISON OF 5 YEAR CUMULATIVE TOTAL RETURN
Among Ross Stores, Inc., the S&P 500 Index, and Dow Jones Apparel Retailers
| Indexed Returns for Years Ended | ||||||||||||||||||||||||||||||||||||||
| Base Period | ||||||||||||||||||||||||||||||||||||||
| Company/Index | 2015 | 2016 | 2017 | 2018 | 2019 | 2020 | ||||||||||||||||||||||||||||||||
| Ross Stores, Inc. | 100 | 117 | 143 | 168 | 207 | 207 | ||||||||||||||||||||||||||||||||
| S&P 500 Index | 100 | 120 | 152 | 148 | 180 | 211 | ||||||||||||||||||||||||||||||||
| Dow Jones Apparel Retailers | 100 | 99 | 112 | 122 | 136 | 145 |
Previous: Item 4. MINE SAFETY DISCLOSURES · Next: Item 6. SELECTED FINANCIAL DATA