 filings.tools
Item 5. Market for Registrant’s Common Equity, Related Stockholder Matters and Issuer Purchases of Equity Securities.
5K characters. Original on sec.gov · Markdown
Item 5. Market for Registrant’s Common Equity, Related Stockholder Matters and Issuer Purchases of Equity Securities.
Our common shares are listed on the New York Stock Exchange – ticker symbol SJM. There were approximately 304,821 shareholders of record as of June 12, 2020, of which approximately 35,966 were registered holders of common shares.
Purchases of Equity Securities by the Issuer and Affiliated Purchasers: The following table presents the total number of shares of common stock purchased during the fourth quarter of 2020, the average price paid per share, the number of shares that were purchased as part of a publicly announced repurchase program, if any, and the approximate dollar value of the maximum number of shares that may yet be purchased under the share repurchase program:
| Period | (a) | (b) | (c) | (d) | ||||||||||||||||||||||
| Total number of shares purchased | Average price paid per share | Total number of shares purchased as part of publicly announced plans or programs | Maximum number (or approximate dollar value) of shares that may yet be purchased under the plans or programs | |||||||||||||||||||||||
| February 1, 2020 - February 29, 2020 | 150 | $ | 108.85 | — | 3,586,598 | |||||||||||||||||||||
| March 1, 2020 - March 31, 2020 | 432 | 102.04 | — | 3,586,598 | ||||||||||||||||||||||
| April 1, 2020 - April 30, 2020 | 103 | 116.67 | — | 3,586,598 | ||||||||||||||||||||||
| Total | 685 | $ | 105.73 | — | 3,586,598 |
(a) Shares in this column include shares repurchased from stock plan recipients in lieu of cash payments.
(d) As of April 30, 2020, there were 3,586,598 common shares remaining available for future repurchase pursuant to our Board of Directors’ authorizations.
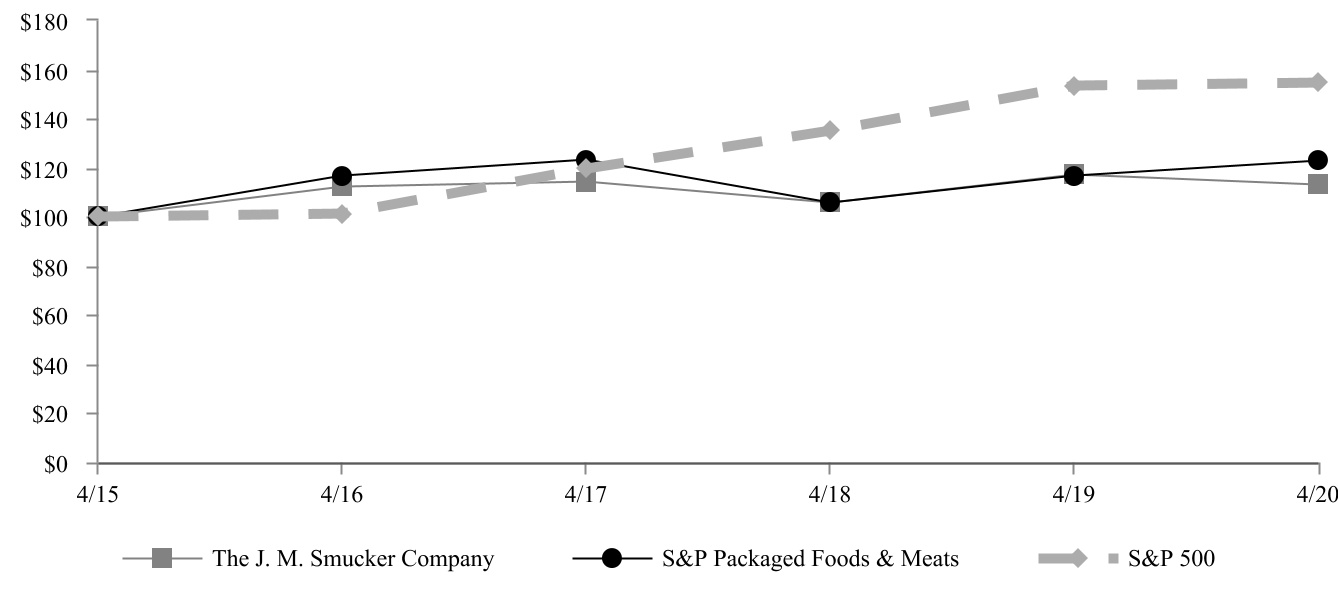
Comparison of Cumulative Total Return: The following graph compares the cumulative total shareholder return for the five years ended April 30, 2020, for our common shares, the Standard & Poor’s (“S&P”) Packaged Foods & Meats Index, and the S&P 500 Index. These figures assume all dividends are reinvested when received and are based on $100.00 invested in our common shares and the referenced index funds on April 30, 2015.
| April 30, | |||||||||||||||||||||||||||||||||||||||||||||||||||||||||||||||||
| 2015 | 2016 | 2017 | 2018 | 2019 | 2020 | ||||||||||||||||||||||||||||||||||||||||||||||||||||||||||||
| The J. M. Smucker Company | $ | 100.00 | $ | 112.05 | $ | 114.20 | $ | 105.57 | $ | 116.96 | $ | 113.04 | |||||||||||||||||||||||||||||||||||||||||||||||||||||
| S&P Packaged Foods & Meats | 100.00 | 116.53 | 123.26 | 105.60 | 116.68 | 122.62 | |||||||||||||||||||||||||||||||||||||||||||||||||||||||||||
| S&P 500 | 100.00 | 101.21 | 119.34 | 135.17 | 153.41 | 154.74 |
Copyright © 2020 Standard & Poor's, a division of S&P Global. All rights reserved.
Previous: Item 4. Mine Safety Disclosures. · Next: Item 6. Selected Financial Data.