 filings.tools
Super Micro Computer 10-K 2017-06-30
Filed 2019-05-17. 22 sections, 596K characters. Original on sec.gov · Markdown · JSON
Cover and table of contents
10-K 1 smci-2017630x10kxa.htm 10-K
UNITED STATES
SECURITIES AND EXCHANGE COMMISSION
Washington, D.C. 20549
Form 10-K
| x | ANNUAL REPORT PURSUANT TO SECTION 13 OR 15(d) OF THE SECURITIES EXCHANGE ACT OF 1934 |
For the fiscal year ended June 30, 2017
or
| ¨ | TRANSITION REPORT PURSUANT TO SECTION 13 OR 15(d) OF THE SECURITIES EXCHANGE ACT OF 1934 |
For the transition period from to
Commission File Number 001-33383
Super Micro Computer, Inc.
(Exact name of registrant as specified in its charter)
| Delaware | 77-0353939 | |
| (State or other jurisdiction of incorporation or organization) | (I.R.S. Employer Identification No.) |
980 Rock Avenue
San Jose, CA 95131
(Address of principal executive offices, including zip code)
(408) 503-8000
(Registrant’s telephone number, including area code)
Securities registered pursuant to Section 12(b) of the Act:
| Title of each class | Trading Symbol | Name of each exchange on which registered |
| Common Stock, $0.001 par value per share | SMCI | OTC |
Securities registered pursuant to section 12(g) of the Act: None
Indicate by check mark if the registrant is a well-known seasoned issuer, as defined in Rule 405 of the Securities Act. Yes ¨ No x
Indicate by check mark if the registrant is not required to file reports pursuant to Section 13 or Section 15(d) of the Act. Yes ¨ No x
Indicate by check mark whether the registrant (1) has filed all reports required to be filed by Section 13 or 15(d) of the Securities Exchange Act of 1934 during the preceding 12 months (or for such shorter period that the registrant was required to file such reports), and (2) has been subject to such filing requirements for the past 90 days. Yes ¨ No x
Indicate by check mark whether the registrant has submitted electronically and posted on its corporate Web site, if any, every Interactive Data File required to be submitted and posted pursuant to Rule 405 of Regulation S-T (§229.405 of this chapter) during the preceding 12 months (or for such shorter period that the registrant was required to submit and post such files). Yes ¨ No x
Indicate by check mark if disclosure of delinquent filers pursuant to Item 405 of Regulation S-K (§229.405 of this chapter) is not contained herein, and will not be contained, to the best of registrant’s knowledge, in definitive proxy or information statements incorporated by reference in Part III of this Form 10-K or any amendment to this Form 10-K. ¨
Indicate by check mark whether the registrant is a large accelerated filer, an accelerated filer, a non-accelerated filer, a smaller reporting company, or an emerging growth company. See the definitions of “large accelerated filer,” “accelerated filer,” “smaller reporting company,” and “emerging growth company” in Rule 12b-2 of the Exchange Act.
| Large accelerated filer x | Accelerated filer ¨ | |
| Non-accelerated filer ¨ (Do not check if a smaller reporting company) | Smaller reporting company ¨ | |
| Emerging growth company ¨ |
If an emerging growth company, indicate by check mark if the registrant has elected not to use the extended transition period for complying with any new or revised financial accounting standards provided pursuant to Section 13(a) of the Exchange Act. ¨
Indicate by check mark whether the registrant is a shell company (as defined in Rule 12b of the Exchange Act) Yes ¨ No x
The aggregate market value of the registrant’s common stock held by non-affiliates, based upon the closing price of the common stock on December 31, 2016, as reported by the Nasdaq Global Select Market, was $1,110,444,831. Shares of common stock held by each executive officer and director and by each person who owns 5% or more of the outstanding common stock, based on filings with the Securities Exchange Commission, have been excluded since such persons may be deemed affiliates. This determination of affiliate status is not necessarily a conclusive determination for other purposes.
As of March 31, 2019, there were 49,881,914 shares of the registrant’s common stock, $0.001 par value, outstanding, which is the only class of common stock of the registrant issued.
DOCUMENTS INCORPORATED BY REFERENCE
None
SUPER MICRO COMPUTER, INC.
ANNUAL REPORT ON FORM 10-K
FOR THE FISCAL YEAR ENDED JUNE 30, 2017
TABLE OF CONTENTS
Unless the context requires otherwise, the words “Super Micro,” “Supermicro,” “we,” “Company,” “us” and “our” in this document refer to Super Micro Computer, Inc. and where appropriate, our wholly owned subsidiaries. Supermicro, the Company logo and our other registered or common law trademarks, service marks, or trade names appearing in this Annual Report on Form 10-K are the property of Super Micro Computer, Inc. or its affiliates. Other trademarks, service marks, or trade names appearing in this Annual Report on Form 10-K are the property of their respective owners.
Explanatory Note
This Annual Report on Form 10-K includes restatement of: (1) our consolidated balance sheet as of June 30, 2016 and the related consolidated statements of operations, comprehensive income, stockholders’ equity, and cash flows for each of the fiscal years ended June 30, 2016 and 2015 in Part II, Item 8 of this Annual Report on Form 10-K; (2) our selected financial data as of and for our fiscal years ended June 30, 2016 and 2015 located in Part II, Item 6 of this Annual Report on Form 10-K; (3) our management’s discussion and analysis of financial condition and results of operations as of and for our fiscal years ended June 30, 2016 and 2015 contained in Part II, Item 7 of this Annual Report on Form 10-K; and (4) our quarterly financial information for the three months ended June 30, 2016 in Part II, Item 8, Note 17, “Quarterly Financial Information (Unaudited)” of the notes to the consolidated financial statements in Part II, Item 8 of this Annual Report on Form 10-K. See below and Part II, Item 8, Note 19, “Restatement of Previously Issued Consolidated Financial Statements” of the notes to the consolidated financial statements of this Annual Report on Form 10-K for a detailed discussion of the effect of the restatement.
Prior to filing this Annual Report on Form 10-K, we filed Quarterly Reports on Form 10-Q/A for the quarterly periods ended March 31, 2017, December 31, 2016, and September 30, 2016, which included restatement of the condensed consolidated financial statements (and related disclosures) for the periods described therein, as set forth in those reports.
We have not previously issued consolidated financial statements as of and for the year ended June 30, 2017, for the reasons set forth below under “Background of Restatement.” This Annual Report on Form 10-K includes our consolidated balance sheet as of June 30, 2017 and related consolidated statements of operations, comprehensive income, stockholders’ equity for the fiscal year then ended, and unaudited quarterly financial information for the quarter ended June 30, 2017.
Background of Restatement
In August 2017, prior to the issuance of our consolidated financial statements for the fiscal year ended June 30, 2017, the audit committee (the “Audit Committee”) of our Board of Directors (the “Board”) commenced an investigation (the “Investigation”) into certain accounting and internal control matters, principally focused on certain revenue recognition matters. The Investigation was conducted with the assistance of outside counsel, which retained forensic accountants to assist them in their work. Following the conclusion of the Investigation, the Audit Committee directed its outside counsel and its forensic accountants to conduct additional procedures on an expanded scope of revenue recognition matters. Concurrent with these additional procedures, new members of our management, under the direction of the Audit Committee, performed a thorough analysis of our historical financial statements, accounting policies and financial reporting, as well as our disclosure controls and procedures and our internal control over financial reporting. During the course of the Investigation, the further procedures by outside counsel and the management analysis (collectively, the “Investigation, Procedures and Analysis”), the Audit Committee and management determined certain employees had violated our Code of Business Conduct and Ethics and discovered accounting and financial reporting errors and certain irregularities. On November 14, 2018, the Board, upon the recommendation, and with the concurrence of the Audit Committee and new members of management, concluded that certain previously filed consolidated financial statements and related financial information should no longer be relied upon.
The Investigation, Procedures and Analysis identified certain material weaknesses in our internal control over financial reporting. See Part II, Item 9A, “Controls and Procedures” of this Annual Report on Form 10-K for the conclusions of our Chief Executive Officer and Chief Financial Officer regarding disclosure controls and procedures and our internal control over financial reporting.
SPECIAL NOTE REGARDING FORWARD-LOOKING STATEMENTS
This Annual Report on Form 10-K contains “forward-looking statements” within the meaning of Section 27A of the Securities Act of 1933 and Section 21E of the Securities Exchange Act of 1934, as amended that involve risks and uncertainties. These statements relate to future events or our future financial performance. In some cases, you can identify forward-looking statements by terminology including “would,” “could,” “may,” “will,” “should,” “expect,” “intend,” “plan,” “anticipate,” “believe,” “estimate,” “predict,” “potential,” or “continue,” the negative of these terms or other comparable terminology. In evaluating these statements, you should specifically consider various factors, including the risks described below, under Part I, Item 1A, “Risk Factors”, and in other parts of this Form 10-K as well as in our other filings with the SEC. Moreover, we operate in a very competitive and rapidly changing environment. New risks emerge from time to time. It is not possible for our management to predict all risks, nor can we assess the impact of all factors on our business or the extent to which any factor, or combination of factors, may cause actual results to differ materially from those contained in any forward-looking statements we may make. In light of these risks, uncertainties and assumptions, the future events and trends discussed in this Annual Report on Form 10-K may not occur and actual results could differ materially and adversely from those anticipated or implied in the forward-looking statements.
We undertake no obligation to publicly update or revise any forward-looking statements, whether as a result of new information, future events or otherwise, except as required by law. We cannot guarantee future results, levels of activity, performance or achievements. Given these risks and uncertainties, readers are cautioned not to place undue reliance on such forward-looking statements.
PART I
Item 1. Business
Overview
We are a Silicon Valley founded, headquartered and operated provider of application optimized high performance and high efficiency server and storage systems. We develop and provide end-to-end green computing solutions to the cloud computing, data center, enterprise, artificial intelligence and machine learning, big data, hyper-converged, OEM, high performance computing ("HPC"), and Internet of Things ("IoT")/embedded markets. Our solutions range from complete server, storage, blade and workstations to full racks, networking devices, server management software and global support and services. We offer our customers a high degree of flexibility and customization by providing a broad array of server configurations from which they can choose the optimal solutions to fit their computing needs. Our server systems, subsystems and accessories are architecturally designed to provide high levels of reliability, quality, configurability and scalability, thereby enabling our customers to benefit from improvements in compute performance, density, thermal management and power efficiency, which lead to lower total cost of ownership.
We perform the majority of our research and development efforts in-house, at our San Jose, California headquarters, which we believe increases the efficiency of communication and collaboration between design teams, streamlines the development process and reduces time-to-market. We have developed a set of design principles which allow us to aggregate individual industry standard components and materials to develop optimized products, such as serverboards, chassis, power supplies, and networking and storage devices. This building block approach allows us to provide a broad range of products, and enables us to build and deliver application-optimized solutions based upon customers’ requirements.
Core to our business is our focus on green computing. We are committed to leveraging the best new and emerging technologies and designs to reduce the environmental impact of the systems we deliver to market. Building these higher efficiency resource optimized systems brings a dual benefit to our customers of lower acquisition and operating costs while at the same time reducing the energy consumption and eWaste.
We conduct our operations principally from our Silicon Valley headquarters in California and subsidiaries in Taiwan and the Netherlands. We sell through our direct sales force as well as through distributors, including value added resellers and system integrators, and OEMs who develop their products on our systems. During fiscal year 2017, our products were purchased by over 900 customers in 110 countries. We commenced operations in 1993 and have been profitable every year since inception. For fiscal years 2017, 2016 and 2015, our net sales were $2,484.9 million, $2,225.0 million and $1,954.4 million, respectively, and our net income was $66.9 million, $72.1 million and $92.6 million, respectively.
The Supermicro Solution
We develop and manufacture high performance server solutions based upon an innovative, modular and open architecture. Our primary competitive advantages are the breadth of our product portfolio that can better match exact customer requirements and our ability to deliver new technologies to market faster. Our competitive advantages arise from how we combine our integrated internal research and development resources with our deep understanding of complex computing requirements to develop the intellectual property used in our server solutions. These competitive advantages have enabled us to develop a set of design principles and performance specifications that meet industry standard Server System Infrastructure ("SSI") requirements and also incorporate the advanced functionality and capabilities required by our customers. We believe that our approach provides us with greater flexibility to quickly and efficiently develop new server solutions that are optimized for our customers' specific application requirements.
Flexible and Customizable Server Solutions
We provide a broad portfolio of flexible and customizable server solutions to better address the specific application needs of our customers. Our design principles allow us to aggregate industry standard components and materials to develop optimized server subsystems and accessories, such as serverboards, mid/backplanes, chassis and power supplies to deliver a broad range of products with superior features. This building block approach allows us to provide a broad range of optimized solution SKUs.
Rapid Time-to-Market
We are able to reduce the design and development time required to incorporate the latest technologies into the next generation of application optimized server solutions. Our in-house design competencies, control of the design of many of the components used within our server systems and our building block architecture enable us to rapidly develop, build and test server systems, subsystems and accessories with unique configurations. As a result, when new technologies are brought to market, we are generally able to quickly design, integrate and assemble solutions with little need to re-engineer other portions of our solution. Our efficient design capabilities allow us to offer our customers server solutions incorporating the latest technology with a better price-to-performance ratio. We work closely with the leading microprocessor, GPU, memory, disk/flash, and interconnect vendors and other hardware and software suppliers to coordinate the design of our new products with their product release schedules, thereby enhancing our ability to rapidly introduce new products incorporating the latest technology.
Improved Power Efficiency and Thermal Management
We leverage advanced technology and system design expertise to reduce the power consumption of our server, blade, workstation and storage systems. We believe that we are an industry leader in power saving technology. Our server solutions include many design innovations to optimize power consumption and manage heat dissipation. We have designed flexible power management systems which customize or eliminate components in an effort to reduce overall power consumption. We have developed proprietary power supplies that can be integrated across a wide range of server system form factors which can significantly enhance power efficiency. We have also developed technologies that are specifically designed to reduce the effects of heat dissipation from our servers. Our thermal management technology allows our products to achieve a better price-to-performance ratio while minimizing energy costs and reducing the risk of server malfunction caused by overheating. We have also developed power management software that controls power consumption of server clusters by policy-based administration.
High Density Servers
Our servers are designed to enable customers to maximize computing power while minimizing the physical space utilized, which allows our customers to efficiently deploy our server systems in scale-out configurations. Through our industry-leading technology, our systems offer significantly more memory, hard drive storage and expansion slots than traditional server systems with a comparable server form factor. For example, our BigTwin solutions contain two or four full feature dual processor hot-pluggable compute nodes with All-Flash Non-Volatile Memory express (“NVMe”) support in a 2 rack unit (“2U”) server. This high density design is well suited for our customers that require highly space-efficient solutions and delivers higher efficiency through sharing resources across systems.
Strategy
Our objective is to be the world’s leading provider of application optimized, high performance server, storage and networking solutions. Achieving this objective requires continuous development and innovation of our solutions with better price performance and architectural advantages compared with our prior generation of solutions and with solutions offered by our competitors. We believe that many of these product innovations are gaining momentum based on the strong year-over-year
revenue growth across these next-generation products. We believe that our strategy and our ability to innovate and execute will enable us to maintain our relative competitive position in many of our product areas and improve our competitive position in others, while providing us with additional long-term growth opportunities. Key elements of our strategy include maintaining our time-to-market advantage, enhancing our software management solutions, expand our service and support offerings, further optimize our global operating structure and deepen our relationships with suppliers and manufacturers.
Maintain Our Time-to-Market Advantage
We believe one of our major competitive advantages is our ability to rapidly incorporate the latest computing innovations into our products. We intend to maintain our time-to-market advantage by continuing our investment in our research and development efforts to rapidly develop new proprietary server, storage and networking solutions based on industry standard components. We plan to continue to work closely with technology partners such as Intel Corporation ("Intel"), Nvidia Corporation ("Nvidia") and Advanced Micro Devices, Inc. ("AMD"), to develop products that are compatible with the latest generation of industry standard technologies. We believe these efforts will allow us to continue to offer products that lead in price for performance as each generation of computing innovations becomes available.
Enhance Our Software Management Solutions
We have introduced and plan to continue developing additional server, storage and networking management software capabilities and partnering with certain software suppliers for software solutions that are integrated with our server products. This will enable our customers to simplify and automate the large scale deployment, configuration and monitoring of our servers.
Expand Our Service & Support Offerings
We intend to continue to expand our global customer service and support offerings and enable our customers to purchase service and support together with our complete server systems as total solution packages around the world. Our service and support is designed to help our customers improve uptime, reduce costs and enhance the productivity of their investment in our products. We believe that continued enhancement of these offerings will support the continued growth of our business and increase our penetration with enterprise customers.
Further Optimize Our Global Operating Structure
We plan to continue to increase our worldwide manufacturing capacity and logistics capabilities in the US, Netherlands and Taiwan in order to more efficiently serve our customers and lower our manufacturing costs. We continue to assess the efficiency of our global tax structure to manage our tax costs. Within our global operating structure, we employ stringent due diligence and qualification processes to select our contract manufacturers, which we regularly audit for process, quality and control. Our global manufacturing process is designed to ensure the end-to-end security of our products.
Deepen Our Relationships with Suppliers and Manufacturers
Our efficient supply chain and combined internal and outsourced manufacturing allow us to build customized systems to order, while minimizing costs. We plan to continue leveraging our relationships with suppliers and contract manufacturers in order to maintain and improve our cost structure as we benefit from economies of scale. We intend to continue to source non-core products from external suppliers.
Products and Services
We offer a broad range of application-optimized server solutions, including storage, rackmount and blade server systems and subsystems and accessories, which can be used to build complete server systems serving a variety of markets including cloud computing, data center, enterprise, big data, HPC, deep learning and IoT embedded. The percentage of our net sales represented by sales of server systems increased to 70.0% in fiscal year 2017 from 68.9% in fiscal year 2016 and from 60.7% in fiscal year 2015, and the percentage of our net sales represented by sales of subsystems and accessories was 30.0% in fiscal year 2017, 31.1% in fiscal year 2016 and 39.3% in fiscal year 2015.
Server Systems
We sell server systems in rackmount, blade, Twin and multi-node form factors, which support single, dual and multiprocessor architectures. A summary of our server systems and their markets are listed below.
Our SuperBlade® and MicroBlade™ system families are each designed to share common computing resources, thereby saving space and power over standard rackmount servers. We believe that our SuperBlade and MicroBlade servers, with our unique disaggregated resource-saving architectures that enable the independent upgrade of compute modules and other Blade resources, offer a unique value to our customers. They provide industry-leading density, price-to-performance per square foot and energy savings to reduce data center total cost of ownership ("TCO").
Our SuperStorage systems in 2U, 3 rack unit (“3U”) and 4 rack unit (“4U”) platforms provide high density storage while leveraging high- efficiency power to maximize performance-per-watt savings to reduce TCO for Enterprise Data Centers, Big Data and other high performance applications. For example, our All-Flash NVMe systems that deliver better performance and efficiency than traditional storage solutions and our Simply Double SuperStorage systems that include twice the number of hot-swap bays as 2U industry standard systems, offer up to twice the storage capacity and input/output operations per second in the same amount of space.
Our Twin family of multi-node server systems including 1U and 2U Twin™, 2U Twin²™, 1U and 2U TwinPro™, 4U FatTwin™, and new 2U BigTwin™ are optimized for density, performance and efficiency for customers' storage, HPC, Hyper-converged infrastructure (HCI) and cloud computing requirements. The new 2U four node BigTwin delivers double the density of traditional rackmounts while supporting max performance and functionality with up to 205 watt Intel Xeon Scalable Processors, 24 DIMMS and All-Flash NVMe.
Our Ultra Server systems in 1U and 2U platforms are designed to deliver performance, flexibility, scalability, and serviceability that are ideal for demanding enterprise workloads. They allow enterprise IT professionals the ability to select a single server platform that can easily be reconfigured for many applications, to reduce qualification time and to manage the need for excessive spares inventories.
Our GPU or Accelerated Computing server systems in 1U, 2U, 4U, 7U and blade platforms achieve higher parallel processing capability with advanced GPU designs, and provide high performance in calculation-intensive applications. We have introduced a complete portfolio of Xeon Phi and Nvidia Pascal based systems.
Our MP product line supports four and eight socket configurations for high performance memory intensive enterprise applications with 96 DIMMS for up to 12 terabytes memory capacity and 23 PCI-E expansion slots. We recently expanded the offerings to support SAP Hana in-memory databases with optimal performance.
Our Data Center Optimized ("DCO") server systems deliver superior performance-per-watt to optimize data center TCO with an improved thermal architecture utilizing power efficient components and offset processors to help eliminate CPU preheating and support a 5+ year product life cycle.
Our MicroCloud server systems are high density, multi-node UP servers with up to 24 hot-pluggable nodes in a compact 3U form factor. MicroCloud integrates advanced technologies within a compact functional design to deliver high performance in environments with space and power constraints. These combined features provide a cost-effective solution for IT professionals implementing new hosting architectures for SMB and Public/Private Cloud Computing applications.
Our IoT/embedded server systems are compact, smart and secure products that reside on the edge of the network, connecting smart sensors and devices to the cloud over wireless or local networks (for example, 5G, LAN, WiFi, Zigbee and RF). These server systems are built on open architecture to ensure interoperability between systems, for ease of services deployment, and to enable a broad ecosystem of solution providers. The IoT/embedded server systems empower users to securely aggregate, share, and filter data for analysis. These server systems help ensure that data generated by devices can travel securely and safely from the edge to the cloud and back - without replacing existing infrastructure.
Our internally developed switch products 1G/10G/40G/100G Ethernet, InfiniBand and Omni Path switches for rack-mount servers help us to offer more complete solutions for our customers.
Our SuperRack total server solutions offer a wide range of flexible accessory options including front, rear and side expansion units to provide modular solutions for system configuration. Data center, Cloud, HPC computing and server farm customers can use us as a one-stop shop for all of their IT hardware needs. Our SuperRack total solutions offer easy installation and rear access with no obstructions for hot-swap devices, user-friendly cabling and cable identification, and effortless integration of our high density server, storage and blade systems.
Server Software Management Solutions
Our remote system management solutions, such as our Server Management suite ("SSM"), including Supermicro Power Management software ("SPM"), Supermicro Update Manager ("SUM") and SuperDoctor 5 ("SD5"), have been designed to manage large-scale heterogeneous hyper scale data center environments. SPM is designed specifically for HPC/Data Center cluster deployment and management. We have also partnered with certain software suppliers for software solutions that are integrated with our server systems.
Server Subsystems and Accessories
We offer a large array of modular server subsystems and accessories. These components are the foundation of our server solutions and span product offerings from the entry-level single and dual processor server segment to the high-end multi-processor market. The majority of the subsystems and accessories we sell individually are optimized to work together and are ultimately integrated into complete server systems.
Serverboards
We design our serverboards with the latest hardware technologies and infrastructure software. Each serverboard is designed and optimized to adhere to specific physical, electrical and design requirements in order to work with certain combinations of chassis and power supplies and achieve maximum functionality. For our rackmount server systems, we not only adhere to SSI specifications, but our customized specifications provide an advanced set of features that increase the functionality and flexibility of our products.
Chassis and Power Supplies
Our chassis are designed to efficiently house our servers while maintaining interoperability, adhering to industry standards and increasing output efficiency through power supply design. We believe that our latest generation of power supplies achieves the maximum power efficiency available in the industry. Our Battery Backup Power ("BBP") Module provides backup power to systems during an electricity outage and provides flexible backup power capability and reduces total cost of ownership. Our server chassis come with hot-plug, heavy-duty fans, fan speed control and an advanced air shroud design to maximize airflow redundancy. Our Powerstick design provides the slim form factor of a redundant power supply that increases system computing and storage density across our multiple product lines.
Supermicro Global Services
Our Supermicro Global Services are comprised of customer support services and hardware enhanced services. Both customer support services and hardware enhanced services develop and implement services solutions for our direct and OEM customers as well as our distributors. Services are provided to our customers directly or through approved distributors and third-party partners.
Support Services: Our customer support services offer market competitive warranties, generally from one to three years, and warranty extension options for products sold by our direct sales team and approved distributors. Our customer support team provides ongoing maintenance and technical support for our products through our website and 24-hour continuous direct phone based support.
Hardware Enhanced Services: Our strategic direct and OEM customers may purchase a variety of on-site support service plans. Our service plans vary depending on specific services, response times, coverage hours and duration, repair priority levels, spare parts requirements, logistics, data privacy and security needs. Our hardware enhanced services team provides help desk services and product on-site support for our server systems.
Our services include server system integration, configuration and software upgrades and updates. We also identify service requirements, create and execute project plans, conduct verification testing and training and provide technical documentation.
Research and Development
We perform the majority of our research and development activities in-house in San Jose, California, increasing the communication and collaboration between design teams to streamline the development process and reducing time-to-market. We believe that the combination of our focus on internal research and development activities, our close working relationships with customers and vendors and our modular design approach allows us to minimize time-to-market. We continue to invest in
reducing our design and manufacturing costs and improving the performance, cost-effectiveness and thermal and space-efficiency of our solutions.
Our research and development teams focus on the development of new and enhanced products that can support emerging innovations while highly optimizing the overall system performance. Much of our research and development activity relates to the new product cycles of leading processor vendors. We work closely with Intel, Nvidia, and AMD among others, to develop products that are compatible with the latest generation of industry standard technologies under development. Our collaborative approach with these vendors allows us to coordinate the design of our new products with their product release schedules, thereby enhancing our ability to rapidly introduce new products incorporating the latest technology. We work closely with their respective development teams to optimize system performance and reduce system level issues. Similarly, we work very closely with our customers to identify their needs and develop our new product plans accordingly.
As of June 30, 2017, we had 1,254 employees and 14 engineering consultants dedicated to research and development. Our total research and development expenses were $144.0 million, $124.2 million, and $101.4 million for fiscal years 2017, 2016 and 2015, respectively.
Customers
For fiscal year 2017, our products were purchased by over 900 customers, in 110 countries. These customers represent a diverse set of market verticals including cloud computing, data center, enterprise, artificial intelligence and machine learning, big data, HPC and IoT/embedded. In fiscal year 2017, no customer represented greater than 10% of our total net sales. In fiscal years 2016 and 2015, sales to SoftLayer, a division of IBM Corporation, represented 11.4% and 10.4%, respectively, of our total net sales.
Sales and Marketing
Our sales and marketing activities are conducted through a combination of our direct sales force and indirect sales channels. As of June 30, 2017, our sales and marketing team consisted of 358 employees and 37 independent sales representatives in 23 locations worldwide.
Our direct sales force is focused on selling complete systems and solutions, including management software and global services to large scale cloud service, enterprise and OEM customers.
We work with distributors, resellers, system integrators, and OEMs to market and sell customized solutions to their end customers. We provide sales and marketing assistance and training to our distributors and OEMs, who in turn provide service and support to end customers. We leverage our relationships with key distributors and OEMs, to penetrate select industry segments where our products can provide a superior alternative to existing solutions.
We maintain close contact with our distributors and end customers. We often collaborate during the sales process with our distributors and the customer’s technical point of contact to help determine the optimal system configuration for the customer’s needs. Our interaction with distributors and end customers allows us to monitor customer requirements and develop new products to better meet their needs.
International Sales
Our international sales efforts are supported both by our international offices in the Netherlands, Taiwan, United Kingdom, China and Japan as well as by our United States sales team. Product fulfillment and first level support for our international customers are provided by Supermicro Global Services and our distributors and OEMs. Sales to customers located outside of the United States represented 42.8%, 36.7% and 41.2% of net sales in fiscal years 2017, 2016 and 2015, respectively. Our long-lived assets located outside of the United States represented 22.1%, 24.0% and 23.8% of total long-lived assets in fiscal years 2017, 2016 and 2015, respectively. See Part II, Item 8, Note 16, “Segment Reporting” to the consolidated financial statements in this Annual Report on Form 10-K for a summary of international net sales and long-lived assets by geographic region.
Marketing
Our marketing programs are designed to create global awareness for our company, understanding of the unique value we bring to customers, and inform existing and potential customers, the trade press, distributors and OEMs about the capabilities and benefits of using our products and solutions. Our marketing efforts support the sale and distribution of our
products through direct sales and distribution channels. We rely on a variety of marketing vehicles, including advertising, public relations, web, social media, participation in industry trade shows and conferences to help gain market acceptance. We provide funds for cooperative marketing to our distributors and partners to scale the reach of our marketing efforts. We also utilize our suppliers’ cooperative marketing programs and jointly benefit from their marketing development funds.
Intellectual Property
We seek to protect our intellectual property rights with a combination of patents, trademarks, copyrights, trade secret laws and disclosure restrictions. We rely primarily on trade secrets, technical know-how and other unpatented proprietary information relating to our design and product development activities. We also enter into confidentiality and proprietary rights agreements with our employees, consultants and other third parties and control access to our designs, documentation and other proprietary information.
Manufacturing and Quality Control
We manufacture the majority of our systems at our San Jose, California headquarters. We believe we are the only major Server and Storage vendor that designs, develops and manufactures the majority of their systems in the United States. Global assembly, test and quality control of our servers are performed at our manufacturing facilities in San Jose, California, the Netherlands and Taiwan. Each of our facilities has been certified by Quality / Environmental Management System or, Q/EMS, according to ISO 9001, ISO 14001 and ISO 13485 standards. Our suppliers and contract manufacturers are required to support the same standards in order to maintain consistent product and service quality and continuous improvement of quality and environmental performance.
We use several third-party suppliers and contract manufacturers for materials and sub-assemblies, such as serverboards, chassis, disk drives, power supplies, fans and computer processors. We believe that selectively using outsourced manufacturing services allows us to focus on our core competencies in product design and development and increases our operational flexibility. We believe our manufacturing strategy allows us to adjust manufacturing capacity in response to changes in customer demand and to rapidly introduce new products to the market. We use Ablecom Technology, Inc. (“Ablecom”) and its affiliate Compuware Technology, Inc. ("Compuware"), both of which are related parties, for contract design and manufacturing coordination support. We work with Ablecom to optimize modular designs for our chassis and certain of our other components. Ablecom also coordinates the manufacturing of chassis for us. In addition to providing a large volume of contract manufacturing services for us, Ablecom warehouses for us a number of components and subassemblies manufactured by multiple suppliers prior to shipment to our facilities in the United States, Europe and Asia. We also have a series of agreements with Compuware, including multiple product development, production and service agreements, product manufacturing agreements, and lease agreements for office space.
We monitor our inventory on a continuous basis in order to be able to meet customer orders and to avoid inventory obsolescence. Due to our modular designs, our inventory can generally be used with multiple different products, further reducing the risk of inventory write-downs.
Competition
The market for our products is highly competitive, rapidly evolving and subject to new technological developments, changing customer needs and new product introductions. In particular, in recent years the market has been subject to substantial change. We compete primarily with large vendors of X86 general purpose servers and components. In addition, we also compete with a number of smaller vendors that specialize in the sale of server components and systems. Over the last several years, we have experienced increased competition from Original Design Manufacturers ("ODMs") that benefit from very low cost manufacturing and are increasingly offering their own branded products. We believe our principal competitors include:
| • | Global technology vendors such as Cisco, Dell, Hewlett-Packard Enterprise, IBM, Inspur, Lenovo, and Huawei; and |
| • | ODMs, such as Quanta Computer, Inc. and Asus Tek Computer, Inc. |
The principal competitive factors in our market include the following:
| • | First to market with new emerging technologies; |
| • | High product performance, efficiency and reliability; |
| • | Early identification of emerging opportunities; |
| • | Cost-effectiveness; |
| • | Interoperability of products; |
| • | Scalability; and |
| • | Localized and responsive customer support on a worldwide basis. |
We believe that we compete favorably with respect to most of these factors. However, most of our competitors have longer operating histories, significantly greater resources, greater name recognition and deeper market penetration. They may be able to devote greater resources to the development, promotion and sale of their products than we can, which could allow them to respond more quickly to new technologies and changes in customer needs. See also the risk factor in Part I, Item IA, titled “The market in which we participate is highly competitive, and if we do not compete effectively, we may not be able to increase our market penetration, grow our net sales or improve our gross margins.”
Employees
As of June 30, 2017, we employed 2,996 full time employees, consisting of 1,254 employees in research and development, 358 employees in sales and marketing, 296 employees in general and administrative and 1,088 employees in manufacturing. Of these employees, 1,943 employees are based in our Silicon Valley facilities. We consider our highly qualified and motivated employees to be a key factor in our business success. Our employees are not represented by any collective bargaining organization and we have never experienced a work stoppage. We believe that our relations with our employees are good.
Corporate Information
Supermicro was founded, and maintains our worldwide headquarters and the majority of our employees, at our Green Computing Park facility in San Jose, California. We are one of the largest employers in the City of San Jose and an active member of the San Jose and Silicon Valley community.
We were incorporated in California in September 1993. We reincorporated in Delaware in March 2007. Our common stock is quoted on the OTC Markets under the symbol "SMCI." Our principal executive offices are located at 980 Rock Avenue, San Jose, CA 95131 and our telephone number is (408) 503-8000. Our website address is www.supermicro.com.
Financial Information about Segments and Geographic Areas
Please see Part II, Item 8, Note 16, “Segment Reporting” to the consolidated financial statements in this Annual Report on Form 10-K for information regarding our international operations, and see Part II, Item 1A, “Risk Factors” for further information on risks attendant to our international operations.
Working Capital
We focus considerable attention on managing our inventories and other working-capital-related items. We manage inventories by communicating with our customers and partners and then using our industry experience to forecast demand. We then place manufacturing orders for our products that are based on forecasted demand. We generally maintain substantial inventories of our products because the computer server industry is characterized by short lead time orders and quick delivery schedules.
Available Information
Our Annual Report on Form 10-K, Quarterly Reports on Form 10-Q, Current Reports on Form 8-K and amendments to reports filed or furnished pursuant to Sections 13(a) and 15(d) of the Securities Exchange Act of 1934, as amended (the “Exchange Act”) are available free of charge, on or through our website at www.supermicro.com, as soon as reasonably practicable after we electronically file such reports with, or furnish those reports to, the SEC. Information contained on our website is not incorporated by reference in, or made part of this Annual Report on Form 10-K or our other filings with or reports furnished to the SEC. The SEC also maintains a website that contains our SEC filings. The address of the site is www.sec.gov. Further, a copy of this Annual Report on Form 10-K is located at the SEC’s Public Reference Room at 100 F Street, NE, Washington, D.C. 20549. Information on the operation of the Public Reference Room can be obtained by calling the SEC at 1-800-SEC-0330.
Item 1A. Risk Factors
Risks Related to Our Investigation, Procedures and Analysis, Consolidated Financial Statements, Internal Control Over Financial Reporting and Related Matters
We face risks related to being delinquent in our SEC reporting obligations if we are unable to resume a timely filing schedule.
Due to the circumstances discussed in the Explanatory Note and in Part II, Item 8, Note 19, “Restatement of Previously Issued Consolidated Financial Statements” to the consolidated financial statements in this Annual Report on Form 10-K and “Financial Statements and Supplementary Data” contained elsewhere in this Annual Report on Form 10-K, our SEC filings, including this Annual Report on Form 10-K, our Quarterly Reports on Form 10-Q for the quarterly periods ended September 30, 2017, December 31, 2017, and March 31, 2018 (the “2018 Form 10-Qs”), our Annual Report on Form 10-K for the fiscal year ended June 30, 2018 (the “2018 Form 10-K”), and our Quarterly Reports on Form 10-Q for the quarterly periods ended September 30, 2018, December 31, 2018 and March 31, 2019 (the “2019 Form 10-Qs”, and collectively with the 2018 Form 10-Qs and the 2018 Form 10-K, the “Delinquent Reports”) are delinquent. We cannot ensure when we will file our Delinquent Reports and resume a timely filing schedule with respect to our future SEC reports. We expect to continue to face many of the risks and challenges related to the Investigation, Procedures and Analysis, including the following:
| • | We may fail to remediate material weaknesses in our internal control over financial reporting and other material weaknesses may be identified in the future, which would adversely affect the accuracy and timing of our financial reporting; |
| • | Failure to timely file our SEC reports and make our current financial information available, has placed, and will continue to place, downward pressure on our stock price and result in the continued inability of our employees to sell the shares of our common stock underlying their awards granted pursuant to our equity compensation plans, which has adversely affected, and may continue adversely affect, hiring and employee retention; |
| • | Further delay in filing our SEC reports will delay our ability to seek the relisting of our common stock on a national securities exchange, and as a result, may continue to reduce the liquidity of our common stock; |
| • | Litigation and claims as well as regulatory examinations, investigations, proceedings and orders arising out of our failure to file SEC reports on a timely basis, including the reasons and causes for such failure to file, will continue to divert management attention and resources from the operation of our business; |
| • | We may not be able to recapture lost business or business opportunities due to ongoing reputational harm; |
| • | Noncompliance with the covenants in our revolving credit facility will prohibit us from borrowing under the facility unless we are able to obtain additional amendments to the facility or waivers of the covenants from the lender; and |
| • | Negative reports or actions on our commercial credit ratings would increase our costs of, or reduce our access to, future commercial credit arrangements and limit our ability to refinance existing indebtedness. |
If one or more of the foregoing risks or challenges persist, our business, operations and financial condition are likely to be materially and adversely affected.
We have identified material weaknesses in our internal control over financial reporting, which could, if not remediated, adversely affect our ability to report our financial condition and results of operations in a timely and accurate manner.
We have concluded that our internal control over financial reporting was not effective as of June 30, 2017 due to the existence of material weaknesses in such controls, and we have also concluded that our disclosure controls and procedures were not effective as of June 30, 2017 due to material weaknesses in our internal control over financial reporting, all as described in Part II, Item 9A, “Controls and Procedures” of this Annual Report on Form 10-K. While having initiated remediation measures to address the identified weaknesses, we cannot provide assurance that our remediation efforts will be adequate to allow us to conclude that such controls will be effective in the future. In addition, because we are a large accelerated filer, we are required to file disclosure and financial statements sooner than companies that are non-accelerated filers, accelerated filers or smaller reporting companies, which gives us less time to fully remediate our material weaknesses by the filing deadlines. We also cannot assure you that additional material weaknesses in our internal control over financial reporting will not arise or be identified in the future. We intend to continue our control remediation activities and to continue to improve our overall control environment and our operational, information technology, financial systems, and infrastructure procedures and controls, as well as to continue to train, retain and manage our personnel who are essential to effective internal controls. In doing so, we will continue to incur expenses and expend management time on compliance-related issues. In addition, we previously identified a material weakness in our internal control over financial reporting related to the revenue recognition of contracts with extended product warranties that impacted prior periods. If we are unable to successfully complete our remediation efforts or favorably
assess the effectiveness of our internal control over financial reporting, our operating results, financial position, ability to accurately report our financial results and timely file our SEC reports, and stock price could be adversely affected.
Moreover, because of the inherent limitations of any control system, material misstatements due to error or fraud may not be prevented or detected on a timely basis, or at all. If we are unable to provide reliable and timely financial reports in the future, our business and reputation may be further harmed. Restated financial statements and failures in internal controls may also cause us to fail to meet reporting obligations, negatively affect investor and customer confidence in our management and the accuracy of our financial statements and disclosures, or result in adverse publicity and concerns from investors and customers, any of which could have a negative effect on the price of our common stock, subject us to further regulatory investigations and penalties or stockholder litigation, and have a material adverse impact on our business and financial condition.
The subject matters of the Investigation, Procedures and Analysis and the findings thereof have caused substantial delays in filing this Annual Report on Form 10-K and the Delinquent Reports, which may result in future delays in our SEC reporting.
Our ability to resume a timely filing schedule with respect to our SEC reporting is subject to a number of contingencies, including whether and how quickly we are able to effectively remediate the identified material weaknesses in our internal control over financial reporting. It is uncertain when we will resume a timely filing schedule with respect to our future SEC reporting requirements, including our Delinquent Reports. It is likely that future reports will become delinquent until the Delinquent Reports are filed with the SEC.
Investors will need to evaluate certain decisions with respect to our common stock in light of a lack of current financial information. Accordingly, any investment in our common stock involves a greater degree of risk. Our lack of current public information may have an adverse impact on investor confidence, which could lead to a red
Showing the first 8K of 99K characters. Open the full section
Item 1B. Unresolved Staff Comments
None.
Item 2. Properties
As of June 30, 2017, we owned approximately 1,408,000 square feet and leased approximately 558,000 square feet of office and manufacturing space.
Our principal executive offices, research and development center and production operations are located in San Jose, California where we own approximately 1,197,000 square feet of office and manufacturing space which is subject to existing term loans and revolving line of credit with $123.2 million outstanding as of June 30, 2017. We lease approximately 246,000 square feet of warehouse space in Fremont, California under a lease that expires in July 2020, lease approximately 46,000 square feet of office space in San Jose, California under a lease that expires in January 2022, and lease approximately 5,000 square feet of office in Jersey City, New Jersey under a lease that expires in July 2020. Our European headquarters for manufacturing and service operations is located in Den Bosch, the Netherlands where we lease approximately 124,000 square feet of office and manufacturing space under two leases, which expire in July 2025 and June 2026. In Asia, our manufacturing facilities are located in Taoyuan County, Taiwan where we own approximately 211,000 square feet of office and manufacturing space on 7.0 acres of land. These manufacturing facilities are subject to an existing term loan with $19.7 million remaining outstanding as of June 30, 2017. Our research and development center and service operations in Asia are located in an approximately 131,000 square feet facility in Taipei, Taiwan under eleven leases that expire at various dates ranging from May 2019 through January 2022. We lease approximately 3,000 square feet of office space in Shanghai and Beijing, China for sales and service operations under two leases that expire in April 2020 and August 2020, respectively. In addition, we lease approximately 2,000 square feet of office space in Japan under one lease, which expires in January 2020.
Additionally, we own 36 acres of land in San Jose, California that would allow us to expand our Green Computing Park. We remodeled one warehouse with approximately 310,000 square feet of storage space and completed the construction of a new manufacturing and warehouse building with approximately 182,000 square feet of manufacturing space in August 2015. In fiscal year 2017, we continued to engage several contractors for the development and construction of improvements on the property. We completed the construction of a second new manufacturing and warehouse building in the first quarter of fiscal year 2018. We financed this development through our operating cash flows and additional borrowings from banks. See Part II, Item 8, Note 9, “Short-term and Long-term Obligations” to the consolidated financial statements in this Annual Report on Form 10-K for a discussion of our company’s short-term and long-term obligations.
We believe that our existing properties, including both owned and leased, are in good condition and are suitable for the conduct of our business.
Item 3. Legal Proceedings
From time to time, we have been involved in various legal proceedings arising from the normal course of business activities. In management’s opinion, the resolution of any matters will not have a material adverse effect on our consolidated financial condition, results of operations or liquidity.
On September 4, 2015, a complaint was filed against us, our CEO, and our former CFO in the U.S. District Court for the Northern District of California (Deason v. Super Micro Computer, Inc., et al., No. 15-cv-04049). The complaint claimed that the defendants violated Section 10(b) of the Securities Exchange Act of 1934 because of alleged misrepresentations and/or omissions in public statements which supposedly were revealed when we announced on August 31, 2015 that the filing of our Annual Report on Form 10-K for fiscal 2015 would be delayed to allow us to complete an investigation into certain marketing expenses. On January 12, 2018, after an initial round of successful motion to dismiss briefing leading to Plaintiff filing an amended complaint, we and the named individual defendants filed another motion to dismiss on the grounds that the amended complaint failed to state a claim because it did not plead falsity or scienter. On June 27, 2018, the Court granted our motion to dismiss without leave to amend and entered judgment in favor of us and the other defendants. On July 24, 2018, Plaintiff filed a notice of appeal to the 9th Circuit Court of Appeals; however, Plaintiff subsequently filed a voluntary notice dismissing the appeal and, thus, ending the litigation on November 1, 2018.
On February 8, 2018, two putative class action complaints were filed against us, our CEO, and our former CFO in the U.S. District Court for the Northern District of California (Hessefort v. Super Micro Computer, Inc., et al., No. 18-cv-00838 and United Union of Roofers v. Super Micro Computer, Inc., et al., No. 18-cv-00850). The complaints contain similar allegations, claiming that the defendants violated Section 10(b) of the Securities Exchange Act due to alleged misrepresentations and/or omissions in public statements regarding recognition of revenue. The court subsequently appointed New York Hotel Trades Council & Hotel Association of New York City, Inc. Pension Fund as lead plaintiff and it filed an amended complaint naming our Senior Vice President of Investor Relations, as an additional defendant. The court approved the parties’ agreement to permit a further amendment of the complaint, which was filed on January 22, 2019. We believe the allegations filed are without merit, and intend to vigorously defend against the lawsuit.
Between late 2015 and 2017, we cooperated with the SEC in its investigation of marketing expenses that contained certain irregularities discovered by our management, which irregularities were disclosed on August 31, 2015. In addition, we have received subpoenas from the SEC in connection with the matters underlying our inability to timely file our Form 10-K for the fiscal year ending June 30, 2017. We also received a subpoena from the SEC following the false and widely-discredited reporting in October 2018 by Bloomberg Businessweek concerning our products. We are cooperating fully to comply with these government requests.
Due to the inherent uncertainties of legal proceedings, we cannot predict the outcome of these proceedings at this time, and we can give no assurance that they will not have a material adverse effect on our financial position or results of operations.
Item 4. Mine Safety Disclosures
Not applicable.
PART II
Item 5. Market for Registrant's Common Equity, Related Stockholder Matters and Issuer Purchases of Equity Securities
Market Information
Effective at the open of business on August 23, 2018, our common stock was suspended from trading on the Nasdaq Global Select Market. Effective March 22, 2019, our common stock was delisted from the Nasdaq Global Select Market. Since the date our common stock was suspended from trading on the Nasdaq Global Select Market, our common stock has been quoted on the OTC Market and is currently traded under the symbol “SMCI.” Prior to the suspension, we had traded on the Nasdaq Global Select Market since March 29, 2007, and prior to that time there was no public market for our common stock.
The following table sets forth, for the periods indicated, the high and low sales closing prices of our Common Stock as reported by The Nasdaq Global Select Market. On March 31, 2019, the last reported bid price of our common stock on the OTC Markets was $21.13 per share. The OTC Markets quotations reflect inter-dealer prices, without retail mark-up, mark down or commission and may not represent actual transactions.
| High | Low | ||||||
| Fiscal Year 2016: | |||||||
| First Quarter | $ | 30.25 | $ | 24.24 | |||
| Second Quarter | $ | 31.82 | $ | 22.32 | |||
| Third Quarter | $ | 34.08 | $ | 21.52 | |||
| Fourth Quarter | $ | 34.49 | $ | 23.78 | |||
| High | Low | ||||||
| Fiscal Year 2017: | |||||||
| First Quarter | $ | 26.34 | $ | 19.02 | |||
| Second Quarter | $ | 29.00 | $ | 21.37 | |||
| Third Quarter | $ | 28.85 | $ | 24.60 | |||
| Fourth Quarter | $ | 25.25 | $ | 23.60 |
Holders
As of March 31, 2019, there were 31 registered stockholders of record of our common stock. Because most of our shares are held by brokers and other institutions on behalf of stockholders, we are unable to estimate the total number of beneficial stockholders represented by these holders of record.
Dividend Policy
We have never declared or paid cash dividends on our capital stock. We intend to retain any future earnings and do not expect to pay any dividends in the foreseeable future. Under the terms of the credit agreement with Bank of America, dated April 19, 2018, we cannot pay any dividends.
Equity Compensation Plan
Please see Part III, Item 12, “Security Ownership of Certain Beneficial Owners and Management and Related Stockholder Matters” of this report for disclosure relating to our equity compensation plans.
Stock Performance Graph
This performance graph shall not be deemed “soliciting material” or to be "filed" with the SEC for purposes of Section 18 of the Exchange Act, or otherwise subject to the liabilities under that Section, and shall not be deemed to be incorporated by reference into any filing of Super Micro Computer, Inc. under the Securities Act of 1933, as amended, or the Exchange Act.
The following graph compares our cumulative five-year total stockholder return on our common stock with the cumulative return of the Nasdaq Computer Index and the Nasdaq Composite Index, which both included our common stock, for the comparable period.
The graph reflects an investment of $100 (with reinvestment of all dividends, if any) in our common stock, the Nasdaq Computer Index and the Nasdaq Composite Index, on June 30, 2012 and our relative performance tracked through June 30, 2017. The stockholder return shown on the graph below is not necessarily indicative of future performance, and we do not make or endorse any predictions as to future stockholder returns.
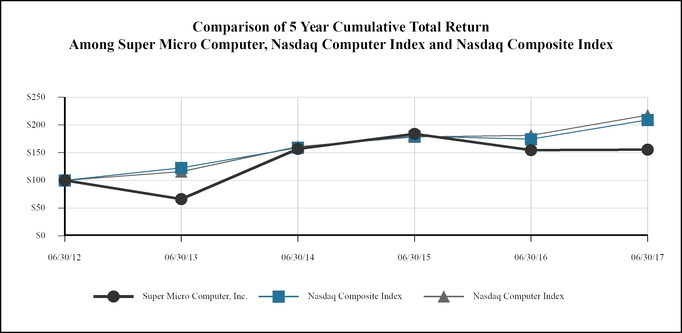
| 6/30/2012 | 6/30/2013 | 6/30/2014 | 6/30/2015 | 6/30/2016 | 6/30/2017 | |||||||||||||
| Super Micro Computer, Inc. | 100.00 | 67.09 | 159.33 | 186.51 | 156.68 | 155.42 | ||||||||||||
| Nasdaq Composite Index | 100.00 | 115.95 | 150.19 | 169.91 | 164.99 | 209.21 | ||||||||||||
| Nasdaq Computer Index | 100.00 | 102.24 | 142.18 | 157.55 | 159.77 | 217.77 |
Recent Sales of Unregistered Securities
None.
Issuer Purchases of Equity Securities
None.
Item 6. Selected Financial Data
The following selected consolidated financial data is qualified by reference to, and should be read in conjunction with, our consolidated financial statements and notes thereto in Part II, Item 8, "Financial Statements and Supplementary Data" and “Management’s Discussion and Analysis of Financial Condition and Results of Operations” in Part II, Item 7, of this Annual Report on Form 10-K.
| Fiscal Years Ended June 30, | Fiscal Years Ended June 30, | Fiscal Years Ended June 30, | |||||||||||||||||||||||||||||
| 2017 | 2016 | 2015 | 2014 | 2013 | |||||||||||||||||||||||||||
| (As Revised) (1) | (As Revised) (1) | As Reported | Adjustments (2) | As Adjusted | As Reported | Adjustments (2) | As Adjusted | ||||||||||||||||||||||||
| (in thousands, except per share data) | |||||||||||||||||||||||||||||||
| Consolidated Statements of Operations Data: | |||||||||||||||||||||||||||||||
| Net sales | $ | 2,484,929 | $ | 2,225,022 | $ | 1,954,353 | $ | 1,467,202 | $ | (17,037 | ) | $ | 1,450,165 | $ | 1,162,561 | $ | (15,332 | ) | $ | 1,147,229 | |||||||||||
| Cost of sales | 2,134,971 | 1,894,521 | 1,647,769 | 1,241,657 | (10,610 | ) | 1,231,047 | 1,002,508 | (12,488 | ) | 990,020 | ||||||||||||||||||||
| Gross profit | 349,958 | 330,501 | 306,584 | 225,545 | (6,427 | ) | 219,118 | 160,053 | (2,844 | ) | 157,209 | ||||||||||||||||||||
| Operating expenses: | |||||||||||||||||||||||||||||||
| Research and development | 143,992 | 124,223 | 101,402 | 84,257 | 917 | 85,174 | 75,208 | 60 | 75,268 | ||||||||||||||||||||||
| Sales and marketing | 66,445 | 58,338 | 47,496 | 38,012 | 264 | 38,276 | 33,785 | 108 | 33,893 | ||||||||||||||||||||||
| General and administrative | 44,646 | 40,449 | 25,040 | 23,017 | (192 | ) | 22,825 | 23,902 | 4 | 23,906 | |||||||||||||||||||||
| Total operating expenses | 255,083 | 223,010 | 173,938 | 145,286 | 989 | 146,275 | 132,895 | 172 | 133,067 | ||||||||||||||||||||||
| Income from operations | 94,875 | 107,491 | 132,646 | 80,259 | (7,416 | ) | 72,843 | 27,158 | (3,016 | ) | 24,142 | ||||||||||||||||||||
| Other income (expense), net | (1,287 | ) | 1,507 | 956 | 92 | — | 92 | 48 | — | 48 | |||||||||||||||||||||
| Interest expense | (2,300 | ) | (1,594 | ) | (965 | ) | (757 | ) | — | (757 | ) | (610 | ) | — | (610 | ) | |||||||||||||||
| Income before income tax provision | 91,288 | 107,404 | 132,637 | 79,594 | (7,416 | ) | 72,178 | 26,596 | (3,016 | ) | 23,580 | ||||||||||||||||||||
| Income tax provision | 24,434 | 35,323 | 40,082 | 25,437 | (1,342 | ) | 24,095 | 5,317 | (473 | ) | 4,844 | ||||||||||||||||||||
| Net income | $ | 66,854 | $ | 72,081 | $ | 92,555 | $ | 54,157 | $ | (6,074 | ) | $ | 48,083 | $ | 21,279 | $ | (2,543 | ) | $ | 18,736 | |||||||||||
| Net income per common share: | |||||||||||||||||||||||||||||||
| Basic | $ | 1.38 | $ | 1.50 | $ | 1.99 | $ | 1.24 | $ | 1.10 | $ | 0.50 | $ | 0.45 | |||||||||||||||||
| Diluted | $ | 1.29 | $ | 1.39 | $ | 1.85 | $ | 1.16 | $ | 1.03 | $ | 0.48 | $ | 0.43 | |||||||||||||||||
| Shares used in per share calculation: | |||||||||||||||||||||||||||||||
| Basic | 48,383 | 47,917 | 46,434 | 43,599 | 43,599 | 41,992 | 41,992 | ||||||||||||||||||||||||
| Diluted | 51,679 | 51,836 | 50,094 | 46,512 | 46,512 | 43,907 | 43,907 | ||||||||||||||||||||||||
| Stock-based compensation: | |||||||||||||||||||||||||||||||
| Cost of sales | $ | 1,382 | $ | 1,157 | $ | 962 | $ | 941 | $ | (21 | ) | $ | 920 | $ | 953 | $ | (21 | ) | $ | 932 | |||||||||||
| Research and development | 12,559 | 10,651 | 9,195 | 6,783 | 147 | 6,930 | 6,527 | (144 | ) | 6,383 | |||||||||||||||||||||
| Sales and marketing | 2,144 | 1,934 | 1,601 | 1,260 | (26 | ) | 1,234 | 1,541 | (34 | ) | 1,507 | ||||||||||||||||||||
| General and administrative | 3,580 | 3,188 | 2,678 | 2,078 | (100 | ) | 1,978 | 2,340 | (52 | ) | 2,288 | ||||||||||||||||||||
| Total stock-based compensation | $ | 19,665 | $ | 16,930 | $ | 14,436 | $ | 11,062 | $ | — | $ | 11,062 | $ | 11,361 | $ | (251 | ) | $ | 11,110 |
(1) See Part II, Item 8, Note 19, "Restatement of Previously Issued Consolidated Financial Statements", in our notes to the consolidated financial statements.
(2) The adjustments are similar in nature to those discussed in Part II, Item 8, Note 19, "Restatement of Previously Issued Consolidated Financial Statements", in our notes to the consolidated financial statements.
| As of June 30, | |||||||||||||||||||||||||||||||
| 2017 | 2016 | 2015 | 2014 | 2013 | |||||||||||||||||||||||||||
| (As Revised) (1) | (As Revised) (2) | As Reported | Adjustments (2) | As Adjusted | As Reported | Adjustments (2) | As Adjusted | ||||||||||||||||||||||||
| (in thousands) | |||||||||||||||||||||||||||||||
| Consolidated Balance Sheet Data: | |||||||||||||||||||||||||||||||
| Cash and cash equivalents | $ | 110,606 | $ | 178,820 | $ | 92,920 | $ | 96,872 | $ | (1,390 | ) | $ | 95,482 | $ | 93,038 | $ | (1,306 | ) | $ | 91,732 | |||||||||||
| Working capital | 588,636 | 544,698 | 438,144 | 343,195 | (14,255 | ) | 328,940 | 281,528 | (9,437 | ) | 272,091 | ||||||||||||||||||||
| Total assets | 1,515,130 | 1,191,483 | 1,122,031 | 796,325 | 29,970 | 826,295 | 632,257 | 38,412 | 670,669 | ||||||||||||||||||||||
| Long-term obligations | 68,754 | 85,200 | 26,062 | 16,208 | 4,710 | 20,918 | 16,869 | 2,121 | 18,990 | ||||||||||||||||||||||
| Total stockholders’ equity | 773,846 | 696,653 | 593,585 | 469,231 | (17,072 | ) | 452,158 | 373,724 | (10,999 | ) | 362,725 |
| (1) | See Part II, Item 8, Note 19, "Restatement of Previously Issued Consolidated Financial Statements", in our notes to the consolidated financial statements. |
| (2) | The adjustments are similar in nature to those discussed in Part II, Item 8, Note 19, "Restatement of Previously Issued Consolidated Financial Statements", in our notes to the consolidated financial statements. |
Item 7. Management's Discussion and Analysis of Financial Condition and Results of Operations
The following discussion should be read in conjunction with the consolidated financial statements and related notes which appear elsewhere in this Annual Report on Form 10-K. This discussion contains forward-looking statements that involve risks and uncertainties. Our actual results could differ materially from those anticipated in these forward-looking statements as a result of various factors, including those discussed below and elsewhere in this Annual Report on Form 10-K, particularly under the heading "Risk Factors." The following discussion gives effect to the restatement discussed in Part II, Item 8, Note 19, “Restatement of Previously Issued Consolidated Financial Statements” to the consolidated financial statements of this Annual Report on Form 10-K. See related discussion in the Explanatory Note.
Background of Investigation, Procedures and Analysis
See "Explanatory Note" to this Annual Report on Form-10K.
Nasdaq Delisting of our Common Stock
As a result of the delay in filing our periodic reports with the SEC and failure to hold an annual meeting, we were unable to comply with the Nasdaq listing standards and our common stock was suspended from trading on the Nasdaq Global Select Market effective August 23, 2018 and formally delisted effective March 22, 2019. Following the suspension of trading, our common stock has been quoted on the OTC Market and is currently traded under the symbol “SMCI.” For further information regarding trading in our common stock, refer to Part II, Item 5, “Market for Registrant's Common Equity, Related Stockholder Matters and Issuer Purchases of Equity Securities” in this Annual Report on Form 10-K.
Overview
We are a global leader in high performance, high efficiency server technology and innovation. We develop and provide end-to-end green computing solutions to the cloud computing, data center, enterprise, big data, high performance computing ("HPC" and internet of things ("IoT")/embedded markets. Our solutions range from complete server, storage, blade and workstations to full racks, networking devices, server management software and technology support and services.
We commenced operations in 1993 and have been profitable every year since inception. For fiscal years 2017, 2016 and 2015, our net income was $66.9 million, $72.1 million and $92.6 million, respectively. In order to increase our sales and profits, we believe that we must continue to develop flexible and customizable server solutions and be among the first to market with new features and products. We must also continue to expand our software and customer service and support offerings, particularly as we increasingly focus on larger enterprise sales. We measure our financial success based on various indicators, including growth in net sales, gross profit margin and operating margin as key measures of profitability, and cash conversion cycle as a key measure of working capital management. Among the key non-financial indicators of our success is our ability to rapidly introduce new products and deliver the latest application optimized server solutions. In this regard, we work closely with microprocessor and other component vendors to take advantage of new technologies as they are introduced. Historically, our ability to introduce new products rapidly has allowed us to benefit from the introduction of new microprocessors and as a result we monitor the introduction cycles of Intel Corporation, Advanced Micro Devices, Inc., and Nvidia Corporation carefully. This also impacts our research and development expenditures as we continue to invest more in our current and future product development efforts.
Financial Highlights
The following is a summary of other financial highlights of fiscal year 2017:
| • | Net sales increased by 11.7% as compared to fiscal year 2016 primarily due to increased unit shipments, reflecting the successful execution of our strategy to ship more complete systems, which increased by 13.5% as compared to fiscal year 2016. |
| • | Gross margin declined to 14.1% from 14.9% in fiscal year 2016 primarily due to increased component prices for memory and storage relative to our ability to pass cost increases to our customers as well as increased sales where pricing is typically more competitive and lower total capacity utilization while we ramp up use of our new facilities. |
| • | Operating expenses increased by 14.4% as compared to fiscal year 2016, but remained approximately 10% of sales as we continued to increase our human talent, primarily with respect to further investments in research and development. |
| • | Net income declined to $66.9 million as compared to $72.1 million in fiscal 2016, which was primarily due to a $16.1 million decline in income before taxes, which was partially offset by a reduction in our effective tax rate to 26.8% as compared to 32.9% in fiscal 2016. |
| • | Our cash and cash equivalents were $110.6 million at the end of fiscal year 2017, compared with $178.8 million at the end of fiscal year 2016. The decrease in our cash and cash equivalents at the end of fiscal year 2017 was primarily due to $96.2 million of cash used in our operating activities and $29.4 million of purchases of property, plant and equipment, of which $16.1 million was related to property and equipment in connection with the construction of buildings at our Green Computing Park in San Jose, California, partially offset by $66.6 million of borrowings, net of repayments. |
| • | The cash conversion cycle is the sum of days of sales outstanding (“DSO”) and days of inventory outstanding (“DIO”), less days of purchases outstanding (“DPO”). Cash conversion cycle at the end of fiscal year 2017 was 86 days compared with 76 at the end of fiscal year 2016. DSO and DIO at the end of fiscal year 2017 were 3 days higher and 6 days higher, respectively, than at the end of fiscal year 2016. DPO at the end of fiscal year 2017 was 1 day lower than at the end of fiscal year 2016. |
| • | Our inventory balance was $736.7 million at the end of fiscal year 2017, compared with $516.8 million at the end |
of fiscal year 2016. The increase in inventory was to meet current demand and expected future sales volume growth.
| • | Our purchase commitments with contract manufacturers and suppliers were $309.1 million at the end of fiscal year 2017 and $334.0 million at the end of fiscal year 2016. |
Subsequent Events
For details, see Part II, Item 8, Note 18, “Subsequent Events” in our notes to the consolidated financial statements in this Annual Report on Form 10-K.
Fiscal Year
Our fiscal year ends on June 30. References to fiscal year 2017, for example, refer to the fiscal year ended June 30, 2017.
Critical Accounting Policies
General
Our discussion and analysis of our financial condition and results of operations are based upon our consolidated financial statements, which have been prepared in accordance with accounting principles generally accepted in the United States. The preparation of these financial statements requires us to make estimates and judgments that affect the reported amount of assets, liabilities, revenues and expenses. We evaluate our estimates on an on-going basis, including those related to allowances for doubtful accounts and sales returns, inventory valuation, useful lives of property, plant and equipment, product warranty accruals, stock-based compensation, impairment of investments and long-lived assets, and income taxes. We base our estimates on historical experience and on various other assumptions that we believe to be reasonable under the circumstances, the results of which form the basis for making the judgments we make about the carrying values of assets and liabilities that are not readily apparent from other sources. Because these estimat
Showing the first 8K of 71K characters. Open the full section
Item 7A. Quantitative and Qualitative Disclosure About Market Risk
Interest Rate Risk
The primary objectives of our investment activities are to preserve principal, provide liquidity and maximize income without significantly increasing the risk. Some of the securities we invest in are subject to market risk. This means that a change in prevailing interest rates may cause the fair value of the investment to fluctuate. To minimize this risk, we maintain our portfolio of cash equivalents and short-term investments in money market funds and certificates of deposit. Our long-term investments include auction rate securities, which have been classified as long-term due to the lack of a liquid market for these securities. Since our results of operations are not dependent on investments, the risk associated with fluctuating interest rates is limited to our investment portfolio, and we believe that a 10% change in interest rates would not have a significant impact on our results of operations. As of June 30, 2017, our investments were in money market funds, certificates of deposits and auction rate securities.
We are exposed to changes in interest rates as a result of our borrowings under our term loan and revolving lines of credit. The interest rates for the term loans and the revolving lines of credit ranged from 0.93% to 2.46% at June 30, 2017 and 0.90% to 1.96% at June 30, 2016. Based on the outstanding principal indebtedness of $161.4 million under our credit facilities as of June 30, 2017, we believe that a 10% change in interest rates would not have a significant impact on our results of operations.
Foreign Currency Risk
To date, our international customer and supplier agreements have been denominated primarily in U.S. dollars and accordingly, we have limited exposure to foreign currency exchange rate fluctuations from customer agreements, and do not currently engage in foreign currency hedging transactions. The functional currency of our subsidiaries in the Netherlands and Taiwan is the U.S. dollar. However, certain transactions in these entities are denominated in a currency other than the U.S. dollar, and thus we are subject to foreign currency exchange rate fluctuations associated with re-measurement to U.S. dollars. Such fluctuations have not been significant historically. Foreign exchange gain (loss) for fiscal years 2017, 2016 and 2015 was $(1.3) million, $1.3 million and $0.8 million, respectively.
Item 8. Financial Statements and Supplementary Data
INDEX TO CONSOLIDATED FINANCIAL STATEMENTS*
*The consolidated financial statements for the fiscal years ended June 30, 2016 and 2015 have been restated as further discussed in Note 19, "Restatement of Previously Issued Consolidated Financial Statements."
REPORT OF INDEPENDENT REGISTERED PUBLIC ACCOUNTING FIRM
To the Board of Directors and Stockholders of
Super Micro Computer, Inc.
San Jose, California
We have audited the accompanying consolidated balance sheets of Super Micro Computer, Inc. and subsidiaries (the “Company”) as of June 30, 2017 and 2016, and the related consolidated statements of operations, comprehensive income, stockholders’ equity, and cash flows for each of the three years in the period ended June 30, 2017. These financial statements are the responsibility of the Company's management. Our responsibility is to express an opinion on these financial statements based on our audits.
We conducted our audits in accordance with the standards of the Public Company Accounting Oversight Board (United States). Those standards require that we plan and perform the audit to obtain reasonable assurance about whether the financial statements are free of material misstatement. An audit includes examining, on a test basis, evidence supporting the amounts and disclosures in the financial statements. An audit also includes assessing the accounting principles used and significant estimates made by management, as well as evaluating the overall financial statement presentation. We believe that our audits provide a reasonable basis for our opinion.
In our opinion, such consolidated financial statements present fairly, in all material respects, the financial position of Super Micro Computer, Inc. and subsidiaries as of June 30, 2017 and 2016, and the results of their operations and their cash flows for each of the three years in the period ended June 30, 2017, in conformity with accounting principles generally accepted in the United States of America.
As discussed in Note 19 to the consolidated financial statements, the accompanying 2016 and 2015 consolidated financial statements have been restated to correct misstatements.
As discussed in Note 11 to the consolidated financial statements, the Company has significant purchases from and sales to two related parties.
We have also audited, in accordance with the standards of the Public Company Accounting Oversight Board (United States), the Company's internal control over financial reporting as of June 30, 2017, based on the criteria established in Internal Control -Integrated Framework (2013) issued by the Committee of Sponsoring Organizations of the Treadway Commission and our report dated May 16, 2019 expressed an adverse opinion on the Company's internal control over financial reporting because of material weaknesses.
/s/ Deloitte & Touche LLP
San Jose, California
May 16, 2019
SUPER MICRO COMPUTER, INC.
CONSOLIDATED BALANCE SHEETS
(in thousands, except share and per share amounts)
| June 30, | June 30, | ||||||
| 2017 | 2016 | ||||||
| (As Restated- see Note 19) | |||||||
| ASSETS | |||||||
| Current assets: | |||||||
| Cash and cash equivalents | $ | 110,606 | $ | 178,820 | |||
| Accounts receivable, net of allowances of $2,699 and $2,413 at June 30, 2017 and 2016, respectively (including amounts receivable from related parties of $6,877 and $49 at June 30, 2017 and 2016, respectively) | 324,004 | 174,933 | |||||
| Inventories | 736,668 | 516,807 | |||||
| Prepaid income taxes | 675 | 4,341 | |||||
| Prepaid expenses and other current assets (including receivables from related parties of $13,327 and $9,622 at June 30, 2017 and 2016, respectively) | 89,213 | 79,427 | |||||
| Total current assets | 1,261,166 | 954,328 | |||||
| Investment in equity investee | 6,067 | — | |||||
| Long-term investments | 2,625 | 2,643 | |||||
| Property, plant and equipment, net | 195,576 | 187,949 | |||||
| Deferred income taxes, net | 39,119 | 33,678 | |||||
| Other assets | 10,577 | 12,885 | |||||
| Total assets | $ | 1,515,130 | $ | 1,191,483 | |||
| LIABILITIES AND STOCKHOLDERS’ EQUITY | |||||||
| Current liabilities: | |||||||
| Accounts payable (including amounts due to related parties of $55,928 and $44,941 at June 30, 2017 and 2016, respectively) | $ | 396,895 | $ | 267,391 | |||
| Accrued liabilities (including amounts due to related parties of $8,450 and $5,354 at June 30, 2017 and 2016, respectively) | 112,824 | 83,596 | |||||
| Income taxes payable | 1,364 | 5,054 | |||||
| Short-term debt and current portion of long-term debt, net of debt issuance costs | 161,447 | 53,589 | |||||
| Total current liabilities | 672,530 | 409,630 | |||||
| Long-term debt | — | 40,000 | |||||
| Other long-term liabilities (including related party balance of $4,900 and $0 at June 30, 2017 and 2016, respectively) | 68,754 | 45,200 | |||||
| Total liabilities | 741,284 | 494,830 | |||||
| Commitments and contingencies (Note 14) | |||||||
| Stockholders’ equity: | |||||||
| Common stock and additional paid-in capital, $0.001 par value | |||||||
| Authorized shares: 100,000,000 | |||||||
| Issued shares: 50,273,527 and 48,999,717 at June 30, 2017 and 2016, respectively | 308,271 | 279,465 | |||||
| Treasury stock (at cost), 1,333,125 and 445,028 shares at June 30, 2017 and 2016, respectively | (20,491 | ) | (2,030 | ) | |||
| Accumulated other comprehensive loss | (77 | ) | (85 | ) | |||
| Retained earnings | 485,973 | 419,119 | |||||
| Total Super Micro Computer, Inc. stockholders’ equity | 773,676 | 696,469 | |||||
| Noncontrolling interest | 170 | 184 | |||||
| Total stockholders’ equity | 773,846 | 696,653 | |||||
| Total liabilities and stockholders’ equity | $ | 1,515,130 | $ | 1,191,483 |
See accompanying notes to consolidated financial statements.
SUPER MICRO COMPUTER, INC.
CONSOLIDATED STATEMENTS OF OPERATIONS
(in thousands, except per share amounts)
| Years Ended June 30, | |||||||||||
| 2017 | 2016 | 2015 | |||||||||
| (As Restated- see Note 19) | (As Restated- see Note 19) | ||||||||||
| Net sales (including related party sales of $33,821, $29,110 and $47,684 in fiscal years 2017, 2016 and 2015, respectively) | $ | 2,484,929 | $ | 2,225,022 | $ | 1,954,353 | |||||
| Cost of sales (including related party purchases of $236,062, $242,638 and $227,661 in fiscal years 2017, 2016 and 2015, respectively) | 2,134,9 |
Showing the first 8K of 192K characters. Open the full section
Item 9. Changes in and Disagreements with Accountants on Accounting and Financial Disclosure
None.
Item 9A. Controls and Procedures
Background
In August 2017, prior to the issuance of the Company’s consolidated financial statements for the fiscal year ended June 30, 2017, the audit committee (the “Audit Committee”) of the Company’s Board of Directors (the “Board”) commenced an investigation (the “Investigation”) into certain accounting and internal control matters at the Company, principally focused on certain revenue recognition matters. The Investigation was conducted with the assistance of outside counsel, which retained forensic accountants to assist them in their work. Following the conclusion of the Investigation, the Audit Committee directed its outside counsel and its forensic accountants to conduct additional procedures on an expanded scope of revenue recognition matters. Concurrently with these additional procedures, new members of the Company’s management, under the direction of the Audit Committee, performed a thorough analysis of the Company’s historical financial statements, accounting policies and financial reporting, as well as the Company’s disclosure controls and procedures and its internal control over financial reporting. During the course of the Investigation, the further procedures by outside counsel and the management analysis (collectively, the “Investigation, Procedures and Analysis”), the Audit Committee and management discovered accounting and financial reporting errors and certain irregularities.
The Audit Committee and management also discovered internal control deficiencies and determined that certain employees had violated the Company’s Code of Business Conduct and Ethics (“Code of Conduct”). In connection with the preparation and filing of this Annual Report on Form 10-K, we have conducted the requisite evaluations of the effectiveness of our disclosure controls and procedures and of our internal control over financial reporting both as of June 30, 2017. These conclusions are explained below.
Evaluation of Disclosure Controls and Procedures
Under the supervision, and with the participation, of our current management, including our CEO and CFO, we evaluated the effectiveness of our disclosure controls and procedures as defined in Rules 13a-15(e) and 15d-15(e) under the Securities Exchange Act of 1934, as amended (the “Exchange Act”), as of June 30, 2017. Based on this evaluation of our disclosure controls and procedures, our CEO and CFO have concluded that our disclosure controls and procedures were not effective as of June 30, 2017 because of certain material weaknesses in our internal control over financial reporting, as further described below.
Notwithstanding the conclusion by our CEO and CFO that our disclosure controls and procedures as of June 30, 2017 were not effective, and notwithstanding the material weaknesses in our internal control over financial reporting described below, management believes that the consolidated financial statements and related financial information included in this Annual Report on Form 10-K fairly present in all material respects our financial condition, results of operations and cash flows as of the dates presented, and for the periods ended on such dates, in conformity with accounting principles generally accepted in the United States of America (“U.S. GAAP”).
Management’s Report on Internal Control Over Financial Reporting
Management is responsible for establishing and maintaining adequate internal control over financial reporting, as such term is defined in Exchange Act Rules 13a-15(f) and 15d-15(f).
Internal control over financial reporting is a process designed by, or under the supervision of, our CEO and CFO to provide reasonable assurance regarding the reliability of financial reporting and the preparation of our consolidated financial statements for external purposes in accordance with U.S. GAAP. Management’s internal control over financial reporting includes those policies and procedures that (i) pertain to the maintenance of records that, in reasonable detail, accurately and fairly reflect the transactions and dispositions of our assets, (ii) provide reasonable assurance that transactions are appropriately recorded to permit preparation of financial statements in accordance with U.S. GAAP and that our receipts and expenditures are made only in accordance with authorizations of management, acting under authority delegated to them by the Board, and (iii) provide reasonable assurance regarding prevention or timely detection of unauthorized acquisition, use or disposition of our assets that could have a material effect on our financial statements.
Management, including our CEO and CFO, assessed our internal control over financial reporting as of June 30, 2017. In making this assessment, management used the criteria set forth by the Committee of Sponsoring Organizations of the Treadway Commission in Internal Control - Integrated Framework (2013) (the “COSO Framework”). Based on this assessment, management has determined that we did not maintain effective internal control over financial reporting as of June 30, 2017 because of the material weaknesses described below.
A material weakness in internal controls is a deficiency, or a combination of deficiencies, in internal control over financial reporting, such that there is a reasonable possibility that a material misstatement of our annual or interim financial statements will not be prevented or detected on a timely basis. Because of its inherent limitations, even appropriate internal control over financial reporting may not prevent or detect misstatements.
In connection with management’s assessment of the Company’s internal control over financial reporting described above, management has identified the deficiencies described below that constituted material weaknesses in our internal control over financial reporting as of June 30, 2017. These deficiencies led to material errors in our previously issued financial statements, which in turn led to the restatement of those previously issued financial statements, as described in Note 19 to our consolidated financial statements included in this Annual Report on Form 10-K.
Control Environment
We have identified deficiencies in the control environment component of the COSO Framework that constitute material weaknesses, either individually or in the aggregate. These deficiencies related to all the principles associated with the control environment component of the COSO Framework. Contributing factors include:
| • | We had a culture of aggressively focusing on quarterly revenue without sufficient focus on compliance. Senior management did not establish and promote a control environment with an appropriate tone of compliance and control consciousness throughout the entire Company. The Company did not sufficiently promote, monitor or enforce adherence to the Code of Conduct. In the pursuit of quarterly revenue, certain of our sales, finance and operations personnel, including officers and managers, were aware of, condoned or were involved in actions that reflected an inappropriate tone at the top, that violated our Code of Conduct and our accounting policies and procedures, and that were inconsistent with a commitment to integrity and ethical values. These actions included (i) shipping products in advance of customer requested delivery dates, (ii) shipping products to storage facilities at the end of a quarter for later delivery to customers, (iii) in certain cases entering into side agreements with customers, (iv) in certain cases, shipping products before manufacturing was completed, (v) altering source documents related to some sales transactions and (vi) failing to disclose or obscuring material facts about sales transactions. As a result of those actions, we recognized revenue from numerous sales transactions in the incorrect period, although these valid sales transactions were recognized in one or more subsequent quarters in the aforementioned restatement. Some employees, including officers and managers, also failed to raise issues with material accounting consequences to the Audit Committee and our external auditors, and with respect to one transaction, appear to have attempted to minimize material facts about a sales transaction to, or obscure those facts from, the Audit Committee and our external auditors. Finally, we did not, on a consistent basis, (i) timely and thoroughly detect and address failures to comply with the Code of Conduct and (ii) train employees adequately to identify and report issues to management and the Audit Committee. |
| • | The Company did not maintain a sufficient complement of management, accounting, financial reporting, sales, operations, engineering and information technology personnel who had appropriate levels of knowledge, experience, and training in accounting and internal control matters commensurate with the nature, growth and complexity of our business. The lack of sufficient appropriately skilled and trained personnel contributed to our failure to (i) adequately identify potential risks, (ii) include in the scope of our internal controls framework certain systems relevant to financial reporting and the preparation of our consolidated financial statements, (iii) design and implement certain risk-mitigating internal controls and (iv) consistently operate certain of our internal controls. The lack of sufficient appropriately skilled and trained personnel also contributed to deficiencies in establishing and maintaining policies and procedures, establishing and enforcing standards for maintaining documents for revenue recognition purposes and establishing accountability for internal controls across the entire Company. |
Due to the interdependencies between the COSO Framework components, the weaknesses in our control environment contributed to other material weaknesses within our system of internal control over financial reporting.
Risk Assessment
We have identified deficiencies in the risk assessment component of the COSO Framework that aggregate to a material weakness. These deficiencies related to the principles associated with the risk assessment component of the COSO Framework, specifically principles within the component related to: (i) identifying, assessing, and communicating appropriate control objectives, (ii) identifying and analyzing risks to achieve these objectives, (iii) contemplating fraud risks, and (iv) identifying and assessing changes in the business that could impact our system of internal controls.
Control Activities
We have identified deficiencies in the control activities component of the COSO Framework that aggregate to a material weakness. These deficiencies related to principles associated with the control activities component of the COSO Framework, specifically principles within the component related to (i) selecting and developing control activities that mitigate risks (ii) selecting and developing general controls over technology and (iii) deploying control activities through policies that establish what is expected and procedures that put policies into action. We did not design or operate certain control activities to sufficiently respond to potential risks of material misstatement in the area of revenue recognition. We did not effectively select and develop certain information technology (“IT”) general controls and we also had control deficiencies at both the IT administrator and end-user levels across multiple applications relevant to financial reporting. We also had deficiencies related to segregation of duties. Deficiencies in control activities contributed to material accounting errors, and the potential for there to have been material accounting errors, in substantially all financial statements account balances and disclosures.
Information and Communication
We have identified deficiencies in the information and communication component of the COSO Framework that aggregate to a material weakness. These deficiencies related to principles associated with the information and communications component of the COSO Framework, specifically principles within the component related to (i) generating and using relevant quality information, (ii) internally communicating information, including objectives and responsibilities for internal control, necessary to support the functioning of internal control and (iii) communicating with external parties regarding matters affecting the functioning of internal control. We rely on manual business processes to compensate for a lack of extensive integration in our information systems. We also rely heavily on each of our various functions, such as sales, operations, accounting, legal and management, to communicate to the other functions information that the entire organization needs to operate an effective internal control environment. In certain areas, our control activity deficiencies resulted from insufficient communication of information among our internal functions as well as from officers and managers to both the Audit Committee and our external auditors.
Monitoring of Controls
We have identified deficiencies in the monitoring of controls component of the COSO Framework that aggregate to a material weakness. There were deficiencies related to principles associated with the monitoring of controls component of the COSO Framework, specifically principles within the component related to (i) selecting, developing and performing ongoing and/or separate evaluations and (ii) evaluating and communicating deficiencies in a timely manner. We lacked controls (i) to determine whether components of internal control were present and functioning, (ii) to mitigate the risk of management overriding internal controls and (iii) to detect incorrect accounting practices. Consequently, we did not identify internal control deficiencies, or did not raise such deficiencies in a timely manner to those parties responsible for internal controls. In addition, we did not always ensure that these deficiencies were remediated thoroughly and timely.
The material weaknesses noted above contributed to the following additional material weaknesses:
Revenue Recognition Accounting
We have identified deficiencies in revenue recognition accounting controls that resulted in material errors constituting material weaknesses, either individually or in the aggregate, as we did not appropriately design, or effectively operate, internal controls over certain aspects of accurate recording, presentation, and disclosure of revenue and related costs. The following were contributing factors to the material weaknesses in revenue recognition accounting:
| • | The Company’s internal controls did not consistently identify and properly account for key non-standard contract or arrangement terms for sales transactions that involved multiple elements (such as when the price of a system includes an extended warranty period and/or our agreement to provide services to our customer). Specifically, the Company’s internal controls failed to identify, accumulate and assess the accounting impact of situations in which we recognized revenue before all the elements necessary to establish “delivery” had occurred. |
| • | With respect to sales transactions near quarter-end, our internal controls failed to consistently identify transactions where the terms of the sales arrangements with our customers were not properly documented in a form that fully reflected the final understanding between the parties as to the specific nature and terms of the agreed-upon transaction. |
| • | Our internal controls failed to consistently identify, resolve, document in our accounting system and allow for proper accounting where there were inconsistencies among the various documents underlying our sales transactions, and we did not always communicate the existence or resolution of those inconsistencies to our accounting organization to enable the proper recognition of revenue. |
| • | We lacked a control to ensure a consistent approach for reviewing our pricing and establishing supportable estimates of best estimated selling prices in allocating revenue between multiple elements. Consequently, we did not always correctly calculate the portions of the total revenue recognized from sales transactions allocated among the various elements. |
Information Technology General Controls
We have identified deficiencies related to IT general controls that represent a material weakness, either individually or in the aggregate. The following were contributing factors:
| • | We have a decentralized approach to developing IT policies and practices and to monitoring our IT controls. As a result, our internal procedures for granting and monitoring employee access, and managing changes to various applications and infrastructure layers relevant to our financial reporting are not consistent across those applications and infrastructure layers. In addition, some of our internally-developed applications relevant to financial reporting lack logging capabilities to monitor access changes or application changes. We have also authorized certain users with broad access, both as a user and as an administrator, to all parts of our primary accounting system without adequate monitoring or recording of how they used that access. As a result of these factors, we have material weaknesses related to access controls and change management. The fact that we had material weaknesses related to access controls and change management means that it is possible that our business process controls that depend on the affected information systems, or that depend on data or financial reports generated from affected information systems, could be adversely affected due to the access control and change management issues, although we have identified no instances of any adverse effect due to these deficiencies. |
The effectiveness of our internal control over financial reporting as of June 30, 2017 has been audited by Deloitte & Touche LLP, our independent registered public accounting firm, as stated in its report that is included herein.
Remediation Plan and Status
Our management is committed to remediating identified control deficiencies (including both those that rise to the level of a material weakness and those that do not), fostering continuous improvement in our internal controls and enhancing our overall internal controls environment. Our management believes that these remediation actions, along with additional actions, when fully implemented, will remediate the material weaknesses we have identified and strengthen our internal control over financial reporting. We are committed to improving our internal control processes and intend to continue to review and improve our financial reporting controls and procedures. As we continue to evaluate and work to improve our internal control over financial reporting, we may take additional measures to address control deficiencies with the overall objective to design and operate internal controls that mitigate identified risks and enable an effective system of internal control over external financial reporting.
To date, we have taken the following remediation actions:
| • | Restructured our sales organization, which resulted in the resignations of the Senior Vice President of International Sales, the Senior Vice President of Worldwide Sales, the Vice President, Strategic Accounts, the Vice President, Strategic Sales, the Vice President, Business Development and certain other sales personnel. |
| • | Appointed experienced professionals to key accounting and finance and compliance leadership positions, including the appointments of a new Chief Financial Officer and a new Corporate Controller in January 2018, and the creation of, and appointments to, two newly established roles of Chief Compliance Officer and Vice President of Internal Audit in May 2018 and August 2018, respectively. |
| • | Reviewed and amended our Code of Conduct to align with the organizational changes described above and to strengthen certain provisions regarding compliance and reporting. |
| • | Adopted an Internal Audit Charter setting forth the responsibilities of the internal audit function and establishing that the Vice President of Internal Audit reports directly to the Audit Committee and that the Audit Committee has authority to provide adequate funding for this function. |
| • | Changed our organizational structure to narrow the scope of responsibilities of certain of our senior executives and to revise various reporting relationships, which included the appointment of a new Senior Vice President of Worldwide Sales, and a new Senior Vice President of Operations. |
| • | Conducted training in the following areas: |
| − | Revenue recognition training for our global sales force, various operations personnel, and certain senior executives, including our CEO, which included detailed examples of acceptable and unacceptable sales practices, |
| − | Reviewing with our senior management team our amended Code of Conduct, |
− Reviewing with our CEO enhanced processes for periodic evaluations by the CEO and the CFO of the effectiveness of our disclosure controls and procedures, and the periodic assessments by the CEO and the CFO of the effectiveness of our internal control over financial reporting, and other compliance matters, and
− Shipping and cut-off training for accounting and operations personnel that included new requirements for quarter-end procedures.
| • | Upgraded our accounting department to include the new roles of Senior Director of Tax, Financial Audit Director and Information Technology Audit Director, as well as replaced certain of our accounting personnel with more experienced individuals, including rebuilding and expanding our revenue recognition team. |
| • | Enhanced the sales sub-certification document that supports our CEO’s and CFO’s financial statement certifications and expanded the sub-certification participation population to the global sales force. |
Our management believes that meaningful progress has been made on the remaining remediation efforts. Although timetables vary, management regards successful completion of our remaining remediation actions as an important priority. Some of the more significant remaining remediation activities include:
| • | Developing and implementing an ongoing compliance training program regarding significant accounting and financial reporting matters, as well as broad compliance matters, for accounting, financial reporting, sales and operations personnel, as well as for our CEO, our other corporate executives and the Board. |
| • | Integrating the responsibility for internal controls across business functions to ensure accountability for internal controls beyond the accounting and finance team. |
| • | Continuing to assess current staffing levels and competencies to ensure the optimal complement of personnel with appropriate qualifications and skill sets. |
| • | Reevaluating and revising our Sarbanes-Oxley compliance program (our “SOX Program”), and making improvements to our SOX Program governance, risk assessment processes, testing methodologies and corrective action mechanisms. |
| • | Redesigning and implementing necessary changes to the existing system of internal controls in the context of the revised and more comprehensive risk assessment. |
| • | Assigning accountability for certain internal controls to our Compliance Department, such as our organizational-wide quarterly sales certification process. |
| • | Reevaluating the boundary applications that interface with our primary accounting and reporting application and redesigning logical access and program change controls to enhance the reliability of information used to conduct other internal controls. |
| • | Continuing to re-assess risks and controls related to the accurate recording, presentation, and disclosure of revenue and related costs |
Changes in Internal Control Over Financial Reporting
There were no changes in our internal control over financial reporting identified in connection with the evaluation required by Rule 13a-15(d) and 15d-15(d) of the Exchange Act that occurred during the three months ended June 30, 2017 that have materially affected, or are reasonably likely to materially affect, our internal control over financial reporting.
REPORT OF INDEPENDENT REGISTERED PUBLIC ACCOUNTING FIRM
To the Board of Directors and Stockholders of
Super Micro Computer, Inc.
San Jose, California
We have audited the internal control over financial reporting of Super Micro Computer, Inc. and subsidiaries (the “Company”) as of June 30, 2017, based on criteria established in Internal Control - Integrated Framework (2013) issued by the Committee of Sponsoring Organizations of the Treadway Commission (“COSO”). The Company’s management is responsible for maintaining effective internal control over financial reporting and for its assessment of the effectiveness of internal control over financial reporting, included in the accompanying Management’s Report on Internal Control Over Financial Reporting. Our responsibility is to express an opinion on the Company’s internal control over financial reporting based on our audit.
We conducted our audit in accordance with the standards of the Public Company Accounting Oversight Board (United States). Those standards require that we plan and perform the audit to obtain reasonable assurance about whether effective internal control over financial reporting was maintained in all material respects. Our audit included obtaining an understanding of internal control over financial reporting, assessing the risk that a material weakness exists, testing and evaluating the design and operating effectiveness of internal control based on the assessed risk, and performing such other procedures as we considered necessary in the circumstances. We believe that our audit provides a reasonable basis for our opinion.
A company’s internal control over financial reporting is a process designed by, or under the supervision of, the company's principal executive and principal financial officers, or persons performing similar functions, and effected by the company’s board of directors, management, and other personnel to provide reasonable assurance regarding the reliability of financial reporting and the preparation of financial statements for external purposes in accordance with generally accepted accounting principles. A company’s internal control over financial reporting includes those policies and procedures that (1) pertain to the maintenance of records that, in reasonable detail, accurately and fairly reflect the transactions and dispositions of the assets of the company; (2) provide reasonable assurance that transactions are recorded as necessary to permit preparation of financial statements in accordance with generally accepted accounting principles, and that receipts and expenditures of the company are being made only in accordance with authorizations of management and directors of the company; and (3) provide reasonable assurance regarding prevention or timely detection of unauthorized acquisition, use, or disposition of the company’s assets that could have a material effect on the financial statements.
Because of the inherent limitations of internal control over financial reporting, including the possibility of collusion or improper management override of controls, material misstatements due to error or fraud may not be prevented or detected on a timely basis. Also, projections of any evaluation of the effectiveness of the internal control over financial reporting to future periods are subject to the risk that the controls may become inadequate because of changes in conditions, or that the degree of compliance with the policies or procedures may deteriorate.
A material weakness is a deficiency, or a combination of deficiencies, in internal control over financial reporting, such that there is a reasonable possibility that a material misstatement of the company’s annual or interim financial statements will not be prevented or detected on a timely basis. The following material weaknesses have been identified and included in management's assessment:
Control Environment - The Company identified deficiencies in the control environment component of the COSO framework that constitute material weaknesses, either individually or in the aggregate. These deficiencies related to all the principles associated with the control environment component of the COSO framework, and contributing factors include:
| • | The Company had a culture of aggressively focusing on quarterly revenue without sufficient focus on compliance. Senior management, did not establish and promote a control environment with an appropriate tone of compliance and control consciousness throughout the entire Company. The Company did not sufficiently promote, monitor or enforce adherence to the Code of Business Conduct and Ethics (“Code of Conduct”). In the pursuit of quarterly revenue, certain sales, finance and operations personnel, including officers and managers, were aware of, condoned or were involved in actions that reflected an inappropriate tone at the top, that violated the Code of Conduct and accounting policies and procedures, and that were inconsistent with a commitment to integrity and ethical values. As a result of those actions, the Company recognized revenue from numerous sales transactions in the incorrect period. Some Company employees, including officers and managers, also failed to raise issues with material accounting consequences to the Audit Committee and to us, as its external auditors, and with respect to one transaction, appear to have attempted to minimize material facts about a sales transaction to, or obscure those facts from, the Audit Committee and us, as its external auditors. Finally, the Company did not, on a consistent basis, (i) timely and thoroughly detect and address failures to comply with the Code of Conduct and (ii) train employees adequately to identify and report issues to management and the Audit Committee. |
| • | The Company did not maintain a sufficient complement of management, accounting, financial reporting, sales, operations, engineering and information technology personnel who had appropriate levels of knowledge, experience, and training in accounting and internal control matters. The lack of sufficient appropriately skilled and trained personnel also contributed to deficiencies in establishing and maintaining policies and procedures, establishing and enforcing standards for maintaining documents for revenue recognition purposes and establishing accountability for internal controls across the entire Company. |
Due to the interdependencies between the COSO framework components, the material weaknesses in the control environment contributed to other material weaknesses within the Company’s system of internal control over financial reporting.
Risk Assessment - The Company identified deficiencies in the risk assessment component of the COSO framework that aggregate to a material weakness. These deficiencies related to the principles associated with the risk assessment component of the COSO framework, specifically principles within the component related to: (i) identifying, assessing, and communicating appropriate control objectives, (ii) identifying and analyzing risks to achieve these objectives, (iii) contemplating fraud risks, and (iv) identifying and assessing changes in the business that could impact the system of internal controls.
Control Activities - The Company identified deficiencies in the control activities component of the COSO framework that aggregate to a material weakness. These deficiencies related to principles associated with the control activities component of the COSO framework, specifically principles within the component related to (i) selecting and developing control activities that mitigate risks (ii) selecting and developing general controls over technology and (iii) deploying control activities through policies that establish what is expected and procedures that put policies into action. The Company did not design or operate certain control activities to sufficiently respond to potential risks of material misstatement in the area of revenue recognition. The Company had deficiencies related to segregation of duties. Deficiencies in control activities contributed to material accounting errors, and the potential for there to have been material accounting errors, in substantially all financial statements account balances and disclosures.
Information and Communication - The Company identified deficiencies in the information and communication component of the COSO framework that aggregate to a material weakness. These deficiencies related to principles associated with the information and communications component of the COSO framework, specifically principles within the component related to (i) generating and using relevant quality information and (ii) internally communicating information, including objectives and responsibilities for internal control, necessary to support the functioning of internal control and (iii) communicating with external parties regarding matters affecting the functioning of internal control. In certain areas, the Company’s control activity deficiencies resulted from insufficient communication of information among its internal functions as well as from officers and managers to both the Audit Committee and to us, as its external auditors.
Monitoring of Controls - The Company identified deficiencies in the monitoring of controls component of the COSO framework that aggregate to a material weakness. There were deficiencies related to principles associated with the monitoring of controls component of the COSO framework, specifically principles within the component related to (i) selecting, developing and performing ongoing and/or separate evaluations and (ii) evaluating and communicating deficiencies in a timely manner. The Company lacked controls (i) to determine whether components of internal control were present and functioning, (ii) to mitigate the risk of management overriding internal controls and (iii) to detect incorrect accounting practices. Consequently, the Company did not identify internal control deficiencies, or did not raise such deficiencies in a timely manner to those parties responsible for internal controls. In addition, the Company did not always ensure that these deficiencies were remediated thoroughly and timely.
The material weaknesses noted above contributed to the following additional material weaknesses:
Revenue Recognition Accounting - The Company identified deficiencies in revenue recognition accounting controls that resulted in material errors constituting material weaknesses, either individually or in the aggregate, as the Company did not appropriately design, or effectively operate, internal controls over certain aspects of accurate recording, presentation, and disclosure of revenue and related costs. The following were contributing factors to the material weaknesses in revenue recognition accounting:
| • | The Company’s internal controls did not consistently identify and properly account for key non-standard contract or arrangement terms for sales transactions that involved multiple elements (such as when the price of a system includes an extended warranty period and/or the Company’s agreement to provide services to its customer). Specifically, the Company’s internal controls failed to identify, accumulate and assess the accounting impact of situations in which they recognized revenue before all the elements necessary to establish “delivery” had occurred. |
| • | With respect to sales transactions near quarter-end, the Company’s internal controls failed to consistently identify transactions where the terms of the sales arrangements with its customers were not properly documented in a form that fully reflected the final understanding between the parties as to the specific nature and terms of the agreed-upon transaction. |
| • | The Company’s internal controls failed to consistently identify, resolve, document in its accounting system and allow for proper accounting where there were inconsistencies among the various documents underlying its sales transactions, and the Company did not always communicate the existence or resolution of those inconsistencies to its accounting organization to enable the proper recognition of revenue. |
| • | The Company lacked a control to ensure a consistent approach for reviewing its pricing and establishing supportable estimates of best estimated selling prices in allocating revenue between multiple elements. Consequently, the Company did not always correctly calculate the portions of the total revenue recognized from sales transactions allocated among the various elements. |
Information Technology General Controls - The Company identified deficiencies related to information technology (“IT”) general controls that represent a material weakness, either individually or in the aggregate. The following were contributing factors:
| • | Procedures for granting and monitoring employee access to, and managing changes to, various applications and infrastructure layers relevant to financial reporting were not consistent across those applications and infrastructure layers. In addition, some internally-developed applications relevant to financial reporting lacked logging capabilities to monitor access changes or application changes. Also, certain users were authorized to have broad access, both as a user and as an administrator, to all parts of primary accounting system without adequate monitoring or recording of how they used that access. As a result of these factors, the Company has material weaknesses related to access controls and change management. The fact that the Company had material weaknesses related to access controls and change management means that it is possible that its business process controls that depend on the affected information systems, or that depend on data or financial reports generated from affected information systems, could be adversely affected due to the access control and change management issues. |
These material weaknesses were considered in determining the nature, timing, and extent of audit tests applied in our audit of the consolidated financial statements as of and for the year ended June 30, 2017, of the Company and this report does not affect our report on such financial statements.
In our opinion, because of the effect of the material weaknesses identified above on the achievement of the objectives of the control criteria, the Company has not maintained effective internal control over financial reporting as of June 30, 2017, based on the criteria established in Internal Control - Integrated Framework (2013) issued by the Committee of Sponsoring Organizations of the Treadway Commission.
We have also audited, in accordance with the standards of the Public Company Accounting Oversight Board (United States), the consolidated financial statements as of and for the year ended June 30, 2017, of the Company and our report dated May 16, 2019 expressed an unqualified opinion on those financial statements and included explanatory paragraphs regarding
the accompanying 2016 and 2015 consolidated financial statements, which have been restated to correct misstatements, and significant purchases from and sales to two related parties.
/s/ Deloitte & Touche LLP
San Jose, California
May 16, 2019
Item 9B. Other Information
None.
PART III
Item 10. Directors, Executive Officers, and Corporate Governance
Executive Officers and Directors
The following table sets forth information regarding our current directors and executive officers and their ages as of March 31, 2019:
| Name | Age | Position(s) | ||
| Charles Liang | 61 | President, Chief Executive Officer and Chairman of the Board | ||
| Kevin Bauer | 59 | Senior Vice President, Chief Financial Officer | ||
| Don Clegg | 60 | Senior Vice President of Worldwide Sales | ||
| George Kao | 58 | Senior Vice President of Operations | ||
| David Weigand | 60 | Senior Vice President, Chief Compliance Officer | ||
| Sara Liu | 57 | Co-Founder, Senior Vice President and Director | ||
| Laura Black(1)(4) | 57 | Director | ||
| Michael S. McAndrews(1)(4) | 66 | Director | ||
| Hwei-Ming (Fred) Tsai(1)(2)(3)(4) | 63 | Director | ||
| Saria Tseng(2)(3)(4) | 48 | Director | ||
| Sherman Tuan(2)(3)(4) | 65 | Director | ||
| Tally Liu(1)(4) | 68 | Director |
| (1) | Member of the Audit Committee |
| (2) | Member of the Compensation Committee |
| (3) | Member of the Nominating and Corporate Governance Committee |
| (4) | Determined by the Board of Directors to be “independent” |
Executive Officers and Management Directors
Charles Liang founded Super Micro and has served as our President, Chief Executive Officer and Chairman of the Board since our inception in September 1993. Mr. Liang has been developing server system architectures and technologies for the past two decades. From July 1991 to August 1993, Mr. Liang was President and Chief Design Engineer of Micro Center Computer Inc., a high-end motherboard design and manufacturing company. From January 1988 to April 1991, Mr. Liang was Senior Design Engineer and Project Leader for Chips & Technologies, Inc., a chipset technology company, and Suntek Information International Group, a system and software development company. Mr. Liang has been granted many server technology patents. Mr. Liang holds an M.S. in Electrical Engineering from the University of Texas at Arlington and a B.S. in Electrical Engineering from National Taiwan University of Science & Technology in Taiwan. Our Nominating and Corporate Governance Committee (“Governance Committee”) concluded that Mr. Liang should serve on the Board based on his skills, experience and qualifications in managing technology businesses, his technical expertise, and his long familiarity with our company’s business.
Kevin Bauer has served as our Senior Vice President, Chief Financial Officer since January 2018 and previously served as our Senior Vice President, Corporate Development and Strategy beginning January 2017. Prior to his employment with our company, Mr. Bauer was the Senior Vice President and Chief Financial Officer of Pericom Semiconductor Corporation, a semiconductor company, from February 2014 until its sale to Diodes, Incorporated in November 2015 and, thereafter, assisted Diodes with the integration of Pericom until November 2016. Prior to that he was Chief Financial Officer of Exar Corporation, a semiconductor manufacturer, from June 2009 through December 2012, Corporate Controller from August 2004 to June 2009 and Operations Controller from February 2001 to August 2004. Previously, Mr. Bauer was Operations Controller at WaferTech LLC (a subsidiary of Taiwan Semiconductor Manufacturing Company Limited) from July 1997 to February 2001. Prior to WaferTech, he was at VLSI Technology for ten years where he held a variety of increasingly more
senior finance roles culminating in his position as Director and Group Controller. Mr. Bauer received an M.B.A. from Santa Clara University and a B.S. in Business Administration from California Lutheran University.
Don Clegg serves as our Senior Vice President of Worldwide Sales. He previously served as our Vice President of Marketing and Worldwide Business Development. Mr. Clegg has been an employee since April 2006 and has held various senior sales and marketing roles with the Company during that time. Mr. Clegg started his career as a Design Engineer and evolved from Engineer to Vice President of Sales and Marketing working at several established and startup Silicon Valley system and semiconductor companies. Mr. Clegg graduated with high honors from Brigham Young University, where he earned a B.S. in Electrical Engineering.
George Kao serves as our Senior Vice President of Operations and previously served as our Vice President of Operations. Mr. Kao joined the Company in October 2016. Mr. Kao was Vice President of Operations of Pericom Semiconductor Corp. from October 2006 to September 2016. Mr. Kao served as a Chief Operating Officer of Orient Semiconductor Electronics Philippines, Inc., a subsidiary of Orient Semiconductor Electronics Ltd., from September 2003 to March 2006. Mr. Kao joined Orient Semiconductor Electronics Philippines, Inc. from Santa Clara-based Foveon after a 20-year career in technology in the United States that began at National Semiconductor. Mr. Kao holds a B.S. in Electrical Engineering from California State Polytechnic University.
David Weigand has served as our Senior Vice President, Chief Compliance Officer since May 2018. Prior to his employment with our company, Mr. Weigand was a Vice President at Hewlett Packard Enterprise (HPE) from November 2016 until April 2018 and served as Vice President, Tax at Silicon Graphics International, Inc., from September 2013 until its acquisition by HPE in November 2016. Prior to that he was Vice President, Chief Financial Officer of Renesas Electronics America, a semiconductor company formed by the merger of the semiconductor businesses of NEC Corporation, Hitachi and Mitsubishi Electric from October 2010 until April 2013, and Vice President, Controller of NEC Electronics America from October 2004 until September 2010. Mr. Weigand holds a M.S. degree in Taxation from the University of Hartford and a B.S. degree in Accounting from San Jose State University and is a Certified Public Accountant in California (Inactive).
Sara Liu co-founded Super Micro in September 1993, has been a member of our Board of Directors since March 2007 and currently serves as our Co-Founder, Senior Vice President, and a director. She has held a variety of positions with the Company, including Treasurer from inception to May 2019, Senior Vice President of Operations from May 2014 to February 2018, and Chief Administrative Officer from October 1993 to May 2019. From 1985 to 1993, Ms. Liu held accounting and operational positions for several companies, including Micro Center Computer Inc. Ms. Liu holds a B.S. in Accounting from Providence University in Taiwan. Ms. Liu is married to Mr. Charles Liang, our Chairman, President and Chief Executive Officer. Our Governance Committee concluded that Ms. Liu should serve on the Board based on her skills, experience, her general expertise in business and operations and her long familiarity with our company’s business.
Non-Management Directors
Laura Black has been a member of our Board of Directors since April 2012. Since March 1999, she has served as a Managing Director of Needham & Company, LLC, a full-service investment banking firm. At Needham, she has raised public and private equity capital for numerous technology companies and served as strategic financial advisor on multiple M&A transactions. From July 1995 to February 1999, she served as a Managing Director and Corporate Finance at Black & Company, a regional investment bank subsequently acquired by Wells Fargo Van Kasper. From July 1993 to June 1995, Ms. Black served as a Director for TRW Avionics & Surveillance Group where she evaluated acquisition candidates, managed direct investments and raised venture capital to back spin-off companies. From August 1983 to August 1992, she worked at TRW as an electrical engineer designing spread spectrum communication systems. Ms. Black holds a BSEE from University of California at Davis, a MSEE from Santa Clara University and a MS Management from Stanford. Our Governance Committee concluded that Ms. Black should serve on the Board based on her skills, experience and qualifications in capital finance, her financial literacy and her familiarity with technology businesses.
Michael S. McAndrews has been a member of our Board of Directors since February 2015. Mr. McAndrews has served as a Principal of Abbott, Stringham & Lynch, an accounting firm serving the Silicon Valley, since September 2013. From June 2002 to June 2013, he served as a Partner at PricewaterhouseCoopers LLP, a multinational professional services network, where he provided tax planning and consulting services to multinational public companies, private companies and their owners and emerging businesses in a variety of industries including high-technology, manufacturing, food processing and wholesale/retail distribution. From November 1979 to June 2002, he worked for Arthur Andersen and Company, a global professional services firm. He served as Partner from 1993 to 2002 where he focused primarily on providing tax planning and compliance services to high technology companies ranging in size from start-ups to large multinational public companies. Mr. McAndrews is a certified public accountant with an active license in California and holds a Bachelor of Science in Commerce, Accounting
degree from Santa Clara University. Our Governance Committee concluded that Mr. McAndrews should serve on the Board based on his skills, experience, his financial literacy and his familiarity with technology businesses.
Hwei-Ming (Fred) Tsai has been a member of our Board of Directors since August 2006. Mr. Tsai served as an independent director of ANZ Bank (Taiwan) Limited, a wholly owned subsidiary of Australia and New Zealand Banking Group Limited from September 2013 to April 2019. Mr. Tsai has also served as an independent director of Dynapack International Technology Corporation, a public company in Taiwan, since June 2017. Mr. Tsai has been an independent business consultant since January 2010. Mr. Tsai served as Executive Vice President and Chief Financial Officer of SinoPac Bancorp, a financial holding company based in Los Angeles, California from February 2001 and August 2005, respectively, to December 2009. He also served as Senior Executive Vice President of Far East National Bank, a commercial bank that is held by SinoPac Bancorp from December 2002 to December 2009. Mr. Tsai holds a Master in Professional Accounting from the University of Texas at Austin and a B.A. in Accounting from National Taiwan University in Taiwan. Our Governance Committee concluded that Mr. Tsai should serve on the Board based on his skills, experience and qualifications in capital finance, his financial literacy and his familiarity with our company’s business.
Saria Tseng has been a member of our Board of Directors since November 2016. Ms. Tseng has served as Vice President of Strategic Corporate Development, General Counsel and Secretary of Monolithic Power Systems, Inc. a fabless manufacturer of high-performance analog and mixed-signal semiconductors since 2004. From 2001 to 2004, Ms. Tseng served as Vice President, General Counsel and Corporate Secretary of MaXXan Systems, an enterprise class storage network system. Previously, Ms. Tseng was an attorney at Gray Cary (now DLA Piper) and Jones Day. Ms. Tseng is a member of the state bar in both California and New York and is a member of the bar association of the Republic of China, Taiwan. She holds Master of Law degrees from the University of California at Berkeley and the Chinese Culture University in Taipei. Our Governance Committee concluded that Ms. Tseng should serve on the Board based on her skills, experience and qualifications in business and corporate law, her legal expertise and her familiarity with technology business.
Sherman Tuan has been a member of our Board of Directors since February 2007. Mr. Tuan is founder of PurpleComm, Inc. (doing business as 9x9.tv), a platform for connected TV, where he has served as Chief Executive Officer since January 2005 and Chairman of the Board since June 2003. From September 1999 to May 2002, he was director of Metromedia Fiber Network, Inc., a fiber optical networking infrastructure provider. Mr. Tuan was co-founder of AboveNet Communications, Inc., an internet connectivity solutions provider, where he served as President from March 1996 to January 1998, Chief Executive Officer from March 1996 to May 2002 and director from March 1996 to September 1999. Mr. Tuan holds a degree in Electrical Engineering from Feng-Chia University in Taiwan. Our Governance Committee concluded that Mr. Tuan should serve on the Board based on his skills, experience and qualifications in managing technology businesses, his technical expertise, and his familiarity with our company’s business.
Tally Liu was appointed to our Board of Directors and our Audit Committee on January 30, 2019. Mr. Liu has been retired since 2015. Prior to his retirement, Mr. Liu was Chief Executive Officer of Wintec Industries, a supply chain solutions company for high-tech manufacturers, from 2012 to 2015. Prior to Wintec, Mr. Liu served as Chairman of the Board and Chief Executive Officer of Newegg, Inc., an internet consumer technology retailer, from 2008 to 2010, and as President of Newegg in 2008. Prior to Newegg, Mr. Liu held various positions with Knight Ridder Inc., including Vice President, Finance & Advance Technology and Vice President of Internal Audit. Mr. Liu served as President of the International Newspapers Financial Executives (INFE) for one year before it merged with other media associations. A Certified Public Accountant from 1982-2007, Mr. Liu is a member of the American Institute of Certified Public Accountants (AICPA) with retired status, and was previously a member of the Florida Institute of Certified Public Accountants (FICPA). Mr. Liu is also a Certified Information System Auditor (CISA) and Certified Information Security Manager (CISM), with non-practice status, with the Information Systems Audit and Control Association (ISACA) and has also been certified in Control Self-assessment (CCSA) by the Institute of Internal Auditors (IIA). After earning his BA of Commerce from National Chengchi University, Taipei, Taiwan, and MBA from Florida Atlantic University, Mr. Liu received executive leadership training at the Stanford Advanced Finance Program in 1986 and at Harvard Business School in the Advanced Management Program (AMP) in 1998. Mr. Liu is not related to any member of our Board of Directors or any of our officers.
Except for Mr. Charles Liang and Ms. Sara Liu who are married, there are no other family relationships among any of our directors or executive officers.
Composition of the Board
Our authorized number of directors is eight. There are currently eight directors. Our amended and restated certificate of incorporation provides for a classified Board of Directors divided into three classes. The members of each class are elected
to serve a term expiring at the third succeeding annual meeting of stockholders after such election. Vacancies may be filled by a majority of the directors then in office, although less than a quorum, or by a sole remaining director. Alternatively, the Board of Directors, at its option, may reduce the number of directors, provided that no decrease in the number of directors constituting the Board of Directors shall shorten the term of any incumbent director.
The current composition of the Board of Directors is:
| Class I Directors (terms expiring at the 2019 annual meeting) | Charles Liang Sherman Tuan Tally Liu |
| Class II Directors (1) | Laura Black Michael S. McAndrews |
| Class III Directors (1) | Sara Liu Hwei-Ming (Fred) Tsai Saria Tseng |
(1) Because we did not, prior to the filing of this Annual Report on Form 10-K, file our Annual Reports on Form 10-K for fiscal years 2017 and 2018, we were unable to hold our 2017 and 2018 annual meetings. We are not able to hold an annual meeting until such time as we have filed all delinquent Annual Reports on Form 10-K and our Annual Report on Form 10-K for the most recently completed fiscal year. As such, while the Class II Directors’ terms were originally to expire at the 2017 annual meeting and the Class III Directors’ terms were originally to expire at the 2018 annual meeting, we expect that the Class II Directors and Class III Directors will not come up for election until the 2019 annual meeting.
CORPORATE GOVERNANCE
Corporate Governance Guidelines
We have adopted “Corporate Governance Guidelines” to help ensure that the Board of Directors is independent from management, appropriately performs its function as the overseer of management, and that the interests of the Board of Directors and management align with the interests of the stockholders. The “Corporate Governance Guidelines” are available at www.Supermicro.com by first clicking on “About Us” and then “Investor Relations” and then “Corporate Governance.”
Code of Ethics
We have adopted a “Code of Business Conduct and Ethics” that is applicable to all directors, executive officers and employees and embodies our principles and practices relating to the ethical conduct of our business and our long-standing commitment to honesty, fair dealing and full compliance with all laws affecting our business. The “Code of Business Conduct and Ethics” is available at www.Supermicro.com by first clicking on “About Us” and then “Investor Relations” and then “Corporate Governance.” Any substantive amendment or waiver of the Code relating to executive officers or directors will be made only after approval by our Board of Directors and will be promptly disclosed on our website within four business days.
Director Independence
Although our common stock is not currently listed on Nasdaq, we have endeavored to continue to operate in accordance with Nasdaq listing standards with respect to director independence requirements. The rules of Nasdaq generally require that a majority of the members of a listed company's board of directors be independent. In addition, the listing rules generally require that, subject to specified exceptions, each member of a listed company's audit committee, compensation committee, and nominating and corporate governance committees be independent. Audit Committee members must also satisfy the independence criteria set forth in Rule 10A-3 under the Securities Exchange Act of 1934, as amended (the "Exchange Act") and the listing requirements of The Nasdaq Stock Market. In addition, compensation committee members must satisfy the independence criteria set forth in Rule 10C-1 under the Exchange Act and the listing requirements of The Nasdaq Stock Market.
The Board affirmatively determines the independence of each director and nominee for election as a director in accordance with Nasdaq listing standards.
Based on these standards, our Board of Directors has determined that five of its current eight members, Laura Black, Michael S. McAndrews, Hwei-Ming (Fred) Tsai, Saria Tseng, Sherman Tuan and Tally Liu, are "independent directors" under the applicable rules and regulations of the SEC and the listing requirements and rules of The Nasdaq Stock Market.
Executive Sessions
Non-management directors meet in executive session without management present each time the Board holds its regularly scheduled meetings.
Communications with the Board of Directors
The Board of Directors welcomes the submission of any comments or concerns from stockholders or other interested parties. If you wish to send any communications to the Board of Directors, you may use one of the following methods:
| • | Write to the Board at the following address: |
Board of Directors
Super Micro Computer, Inc.
c/o General Counsel
980 Rock Avenue
San Jose, California 95131
| • | E-mail the Board of Directors at BODInquiries@supermicro.com |
Communications that are intended specifically for the independent directors or non-management directors should be sent to the e-mail address or street address noted above, to the attention of the "Independent Directors."
MEETINGS AND COMMITTEES OF THE BOARD
Board Meetings
Each director is expected to devote sufficient time, energy and attention to ensure diligent performance of his or her duties and to attend all Board and committee meetings. We encourage, but do not require, each Board member to attend our annual meeting of stockholders. Four of our directors attended our annual meeting of stockholders held during fiscal 2017. The Board of Directors held four meetings during fiscal year 2017, each of which were regularly scheduled meetings. The Board of Directors also acted by written consent one time during fiscal year 2017. All directors attended at least 75% of the meetings of the Board of Directors and of the committees on which they served during the time they served as a director in fiscal year 2017.
Board Leadership Structure
Our Chairman, Charles Liang, is also our Chief Executive Officer. The Board and our Nominating and Corporate Governance Committee (the "Governance Committee") believe that it is appropriate for Mr. Liang to serve as both the Chief Executive Officer and Chairman due to the relatively small size of our Board, and the fact that Mr. Liang is the founder of our company with extensive experience in our industry. We do not currently have a lead independent director.
Board Role in the Oversight of Risk
Our Board exercises oversight over our risk management activities, requesting and receiving reports from management. The Board of Directors exercises this oversight responsibility directly and through its committees. Our Board has delegated primary responsibility for oversight of risks relating to financial controls and reporting to our Audit Committee, which in turn reports to the full Board on such matters as appropriate. The Audit Committee also assists the Board in oversight of certain risks, particularly in the areas of internal controls over financial reporting, financial reporting and review of related party transactions.
Our management with oversight from our Compensation Committee has reviewed its compensation policies and practices with respect to risk-taking incentives and risk management and does not believe that potential risks arising from its compensation polices or practices are reasonably likely to have a material adverse effect on our company.
Committees of the Board of Directors
The Board has three standing committees to facilitate and assist the Board of Directors in discharging its responsibilities: the Audit Committee, the Compensation Committee and the Governance Committee. In accordance with applicable Nasdaq listing standards, each of these committees is comprised solely of non-employee, independent directors. The charter for each committee is available at www.Supermicro.com by first clicking on “About Us” and then “Investor Relations” and then “Corporate Governance.” In January 2019, the Board of Directors approved amendments to the charters for each of the Audit Committee, the Compensation Committee and the Governance Committee, which amendments are reflected in the descriptions contained herein. The charter of each committee also is available in print to any stockholder who requests it. The following table sets forth the current members of each of the standing Board committees:
| Audit Committee | Compensation Committee | Nominating and Corporate Governance Committee | ||
| Laura Black (1) | Sherman Tuan (1) | Sherman Tuan | ||
| Michael S. McAndrews | Hwei-Ming (Fred) Tsai | Hwei-Ming (Fred) Tsai (1) | ||
| Hwei-Ming (Fred) Tsai | Saria Tseng | Saria Tseng | ||
| Tally Liu |
| (1) | Committee Chairperson |
Audit Committee
The Audit Committee has four members. The Audit Committee met nine times in fiscal year 2017, four of which were regularly scheduled meetings and five of which were special meetings. Our Board has determined that each member of our Audit Committee meets the requirements for independence under the applicable listing standards of Nasdaq and the rules of the SEC. Our Board of Directors has also determined that each member of our Audit Committee is an “audit committee financial expert” as defined under applicable SEC rules.
As outlined more specifically in the Audit Committee charter, the Audit Committee has, among other duties, the following responsibilities:
| • | The appointment, compensation and retention of our independent auditors, and the review and evaluation of the auditors’ qualifications, independence and performance; |
| • | Oversees the auditors’ audit work and reviews and pre-approves all audit and non-audit services that may be performed by them; |
| • | Discusses with the independent auditor any audit problems or difficulties and management’s response; |
| • | Reviews and discusses with management press releases regarding our financial results, as well as financial information and earnings guidance provided to securities analysts and rating agencies; |
| • | Reviews and approves the planned scope of our annual audit; |
| • | Monitors the rotation of partners of the independent auditors on our engagement team as required by law; |
| • | Reviews our financial statements and discusses with management and the independent auditors the results of the annual audit and the review of our quarterly financial statements; |
| • | Reviews our critical accounting policies and estimates; |
| • | Oversees the adequacy of our financial controls; |
| • | Periodically reviews with management our disclosure controls and procedures and internal control over financial reporting; |
| • | Reviews and approves the internal audit function’s (i) audit plan, (ii) all major changes to the audit plan, (iii) the scope, progress and results of executing the internal audit plan, and (iv) the annual performance of the internal audit function |
| • | Reviews and approves all related party transactions; |
| • | Establishes and oversees procedures for the receipt, retention and treatment of complaints regarding accounting, internal controls or auditing matters and oversees enforcement, compliance and remedial measures under our Code of Business Conduct and Ethics; |
| • | Initiate investigations and hire legal, accounting and other outside advisors or experts to assist the Audit Committee, as it deems necessary to fulfill its duties; |
| • | Periodically discusses with management our major financial risk exposures and steps management has taken to monitor and control the exposures, including our risk assessment and risk management guidelines and policies; and |
| • | Reviews and evaluates, at least annually, the adequacy of the Audit Committee charter and recommends any proposed changes to the Board of Directors for approval. |
Compensation Committee
The Compensation Committee has three members and met four times in fiscal year 2017. The Compensation Committee is comprised solely of non-employee directors. Our Board has determined that each member of our Compensation Committee meets the requirements for independence under the applicable Nasdaq listing standards.
As outlined more specifically in the Compensation Committee charter, the Compensation Committee has, among other duties, the following responsibilities:
| • | Periodically reviews and advises our Board concerning our overall compensation philosophy, policies and plans, including a review and approval of a group of companies for executive compensation competitive comparisons, approval of target pay and performance objectives against this group, and monitoring of our executive compensation levels and their performance relative to this group; |
| • | Reviews and approves corporate goals and objectives relevant to compensation of the Chief Executive Officer and other executive officers; |
| • | Evaluates the performance of the Chief Executive Officer and other executive officers in light of those goals and objectives, including against the performance of executive officers at comparable companies, all while taking into account our risk management policies and practices; |
| • | Reviews and approves the compensation of the Chief Executive Officer and other executive officers; |
| • | Oversees the evaluation of our executive officers other than the Chief Executive Officer; |
| • | Reviews and approves the establishment and terms of our incentive compensation plans and equity compensation plans; |
| • | Monitors and assesses risks associated with our compensation policies, including whether such policies could lead to unnecessary risk-taking behavior, and consults with management regarding such risks; |
| • | Administers the issuance of restricted stock grants, stock options and other awards to executive officers, directors and other eligible individuals under our stock plans; and |
| • | Reviews and evaluates, at least annually, the performance of the compensation committee and its members, including compliance of the compensation committee with its charter and the adequacy of the compensation committee charter. |
Nominating and Corporate Governance Committee
The Governance Committee has three members and met four times in fiscal year 2017. The Governance Committee is comprised solely of non-employee directors. Our Board has determined that each member of our Governance Committee meets the requirements for independence under the applicable Nasdaq listing standards.
As outlined more specifically in the Governance Committee charter, the Governance Committee has, among other duties, the following responsibilities:
| • | Identifies individuals qualified to become directors; |
| • | Evaluates and selects, or recommends to our Board of Directors, director nominees for each election of directors; |
| • | Develops and recommends to our Board of Directors criteria for selecting qualified director candidates in the context of the current make-up of the Board of Directors; |
| • | Considers any nominations of director candidates validly made by our stockholders; |
| • | Reviews committees’ structures and compositions and recommends to our Board of Directors concerning qualifications, appointment and removal of committee members; |
| • | Develops, recommends for approval by the Board of Directors and reviews on an ongoing basis the adequacy of the corporate governance principles applicable us; |
| • | Develops and recommends to our Board of Directors our Corporate Governance Guidelines; |
| • | Reviews, on a periodic basis, the adequacy of our Corporate Governance Guidelines and recommends any proposed changes to our Board of Directors; |
| • | Oversees compliance with our Corporate Governance Guidelines and reports on such compliance to our Board of Directors; |
| • | Assists the Board of Directors in the evaluation of our Board of Directors and each committee; |
and
| • | Periodically reviews the scope of responsibilities of the Governance Committee and the committee's performance of its duties. |
Section 16(a) Beneficial Ownership Reporting Compliance
The members of our Board of Directors, our executive officers and persons who hold more than 10% of our outstanding common stock are subject to the reporting requirements of Section 16(a) of the Exchange Act, which require them to file reports with respect to their ownership of our common stock and their transactions in our common stock. Based upon (i) the copies of Section 16(a) reports that we received from such persons for their fiscal year 2017 transactions in our common stock and their common stock holdings and (ii) the written representations received from one or more of such persons that no annual Form 5 reports were required to be filed by them for fiscal year 2017, we believe that all reporting requirements under Section 16(a) were met in a timely manner by the persons who were executive officers, members of the Board of Directors or greater than 10% stockholders during such fiscal year, other than one late report made by each of Howard Hideshima, Phidias Chou, Sherman Tuan and Yih-Shyan (Wally) Liaw in each case with respect to one transaction except for Phidias Chou who had two transactions, and two late reports made by Charles Liang and Sara Liu, in each case with respect to one transaction.
Item 11. Executive Compensation
EXECUTIVE COMPENSATION
Compensation Discussion and Analysis
In this section we provide an explanation and analysis of the material elements of the compensation provided to our Chief Executive Officer, Chief Financial Officer and other three most highly compensated executive officers who were serving as executive officers at the end of our fiscal year 2017 (collectively referred to as our “named executive officers”). Those named executive officers and their positions during the fiscal year 2017 were:
| Charles Liang | President, Chief Executive Officer and Chairman of the Board |
| Howard Hideshima | Former Senior Vice President, Chief Financial Officer |
| Phidias Chou | Former Senior Vice President, Worldwide Sales |
| Yih-Shyan (Wally) Liaw | Former Senior Vice President of International Sales, Corporate Secretary and Director |
| Sara Liu | Senior Vice President of Operations, Chief Administrative Officer, Treasurer and Director |
Messrs. Hideshima, Chou and Liaw resigned effective January 30, 2018. They did not receive any severance or other enhanced benefits in connection with their terminations of employment.
Process Overview
The Compensation Committee of the Board of Directors discharges the Board of Directors’ responsibilities relating to compensation of all of our executive officers. The Compensation Committee is comprised of three non-employee directors, all of whom are independent pursuant to the applicable listing rules of NASDAQ, Rule 16b-3 under the Exchange Act, and Section 162(m) of the Internal Revenue Code (“Code”).
The agenda for meetings is determined by the Chair of the Compensation Committee with the assistance of our Chief Financial Officer. Committee meetings are regularly attended by our Chief Financial Officer and our General Counsel. However, our Chief Financial Officer does not attend the portion of meetings during which his own performance or compensation is being discussed. Our Chief Financial Officer and General Counsel support the Compensation Committee in its work by providing information relating to our financial plans, performance assessments of our executive officers and other personnel-related data. In addition, the Compensation Committee has the authority under its charter to hire, terminate and approve fees for advisors, consultants and agents as it deems necessary to assist in the fulfillment of its responsibilities. In August 2016, as part of making an overall assessment of each individual’s role and performance, and structuring our compensation programs for fiscal year 2017, the Compensation Committee reviewed recommendations of management as well as publicly available peer group compensation data.
Compensation Philosophy and Objectives
It is the Compensation Committee’s philosophy to link the named executive officers’ compensation to corporate performance. The base salary, quarterly bonuses and equity award grants of the named executive officers are determined in part by the Compensation Committee reviewing data on prevailing compensation practices of comparable technology companies with whom we compete for executive talent, and evaluating such information in connection with our corporate goals and compensation practices. Our compensation philosophy has been unchanged over the last several years.
The Compensation Committee considers various sources of competitive data when determining executive compensation levels, including compensation data from a sampling of public companies and public compensation surveys obtained from Radford, an Aon Hewitt company. For fiscal year 2017 compensation decisions, the sample of companies consisted of the following, which were the same companies in our peer group for fiscal year 2016 compensation decisions:
| Brocade Communications Systems, Inc. | Infinera Corporation |
| Cray, Inc. | NetApp, Inc. |
| Extreme Networks, Inc. | Netgear, Inc. |
In selecting the companies for inclusion in the sample, the following factors were considered: industry, net revenues, operating income and whether the company may compete against us for executive talent. These companies ranged in annual revenue from approximately $528.4 million to $5.5 billion. For fiscal years 2017 and 2016, our net sales were $2.5 billion and $2.2 billion, respectively.
The Compensation Committee does not seek to specifically benchmark compensation based upon the sample companies reviewed nor does the Compensation Committee employ any other formulaic process in making compensation decisions. Rather, the Compensation Committee uses its subjective judgment based upon a review of all information, including an annual review for each officer of his or her level of responsibility, contributions to our financial results and our overall performance. The Compensation Committee makes a generalized assessment of these factors and this information is not weighted in any specific manner.
The compensation arrangements for several of our named executive officers, including our Chief Executive Officer, were significantly below median compensation levels for similar positions at comparable companies. This is principally due to the high level of stock ownership held by such persons. In the future, we may need to increase our recruiting of new executives from outside of our company. This in turn may require us to pay higher compensation closer to or in excess of that typically paid by comparable companies.
Finally, we believe that creating stockholder value requires not only managerial talent but active participation by all employees. In recognition of this, we try to minimize the number of compensation arrangements that are distinct or exclusive to our named executive officers. We currently provide base salary, quarterly bonuses and long-term equity incentive compensation to a considerable number of our domestic employees and international employees, in addition to our executive officers.
The Role of Stockholder Say-on-Pay Votes
Our Board of Directors, the Compensation Committee and our management value the opinions of our stockholders. At our annual meeting of stockholders held on March 1, 2017 (the "2016 Annual Meeting"), we provided our stockholders the opportunity to vote to approve, on an advisory basis, the compensation of our named executive officers as disclosed in the proxy statement for our 2016 Annual Meeting. At the meeting, 40,503,998 shares or approximately 99.2% of the stockholders who were present and entitled to vote on this “say-on-pay” proposal approved the compensation of our named executive officers, while only 41,966 or approximately 0.1% voted against (with approximately 280,370 shares or approximately 0.7% abstaining). 5,961,842 shares held by brokers were not entitled to vote with respect to this proposal. Although the advisory stockholder vote on named executive officer compensation is non-binding, the Compensation Committee has considered and expects to continue to consider the outcome of the vote when making future compensation decisions for named executive officers. In determining executive compensation for fiscal year 2017, our Compensation Committee took into account the results of the 2016 Annual Meeting stockholder advisory vote to approve executive compensation, particularly the strong support expressed by our stockholders, as one of the many factors considered in deciding that our compensation policies and procedures for 2017 should largely remain consistent with our policies and procedures in prior years. 40.5 million shares for 0.3 million abstention 6.0 million non-votes.
Role of Executive Officers in the Compensation Process
Management provides recommendations to the Compensation Committee on issues such as compensation program design, and evaluations of executive and our performance. In fiscal year 2017, the Compensation Committee also had access to competitive data collected by management. While the Compensation Committee carefully considers all recommendations made by members of management, ultimate authority for all compensation decisions regarding our executive officers rests with the Compensation Committee and the Board.
Fiscal Year 2017 Named Executive Officer Compensation Components
For fiscal year 2017, the principal components of compensation for our executive officers were:
| • | Base salary; |
| • | Quarterly bonus; and |
| • | Equity-based incentive compensation. |
Base Salary. Base salaries for our executive officers other than the Chief Executive Officer are determined annually by the Compensation Committee based upon recommendations by our Chief Executive Officer, taking into account such factors as salary norms in comparable companies and publicly available data regarding compensation increases in the industry, a subjective assessment of the nature of the position and an annual review of the contribution and experience of each executive officer. For the Chief Executive Officer, the Compensation Committee considers substantially the same type of information, as well as our size and the Chief Executive Officer’s overall stock ownership.
In August 2016, the Compensation Committee met to review the base salaries of our named executive officers for fiscal year 2017. In determining base salaries for fiscal year 2017, the Compensation Committee decided to provide no base salary adjustments for our named executive officers.
| Principal Position During Fiscal Year 2017 | Fiscal 2016 Base Salary Rate | Fiscal 2017 Base Salary Rate | Base Salary % Change | |||||||||
| Charles Liang | President, Chief Executive Officer and Chairman of the Board | $ | 365,160 | $ | 365,160 | — | % | |||||
| Howard Hideshima | Former Senior Vice President and Chief Financial Officer | $ | 322,023 | $ | 322,023 | — | % | |||||
| Phidias Chou | Former Senior Vice President, Worldwide Sales | $ | 287,317 | $ | 287,317 | — | % | |||||
| Yih-Shyan (Wally) Liaw | Former Senior Vice President, International Sales, Corporate Secretary and Director | $ | 233,327 | $ | 233,327 | — | % | |||||
| Sara Liu | Senior Vice President of Operations, Chief Administrative Officer, Treasurer and Director | $ | 238,156 | $ | 238,156 | — | % |
Quarterly Bonus. Our quarterly cash bonus program seeks to motivate executive officers to work effectively to achieve our financial performance objectives and to reward them when such objectives are met. Quarterly bonuses for executive officers are subject to approval by the Compensation Committee. Bonuses are not awarded based upon any specific plan or formula, but are subjectively determined based upon our performance during the quarter and the individual’s contributions. Historically these bonuses have ranged from zero to an amount equal to two weeks of base salary. For fiscal year 2017, approximately two weeks of base salary ($10,000) was granted to Mr. Chou in the aggregate as a one-time bonus in recognition of him reaching his first quarter 2017 sales target. None of the other named executive officers received any quarterly bonuses for fiscal 2017.
Other Bonus. Year-end gifting bonuses of $650 were granted to each named executive officer under a company-wide program that all employees participated in.
Equity-Based Incentive Compensation. Stock options and other equity-based awards are an important component of the total compensation of executive officers. We believe that equity-based awards align the interests of each executive with those of our stockholders. They also provide executive officers a significant, long-term interest in our success and help retain key executive officers in a competitive market for executive talent. Our 2016 Equity Incentive Plan authorizes the Compensation Committee to grant stock options and other equity-based awards to executive officers. The number of shares owned by, or subject to equity-based awards held by, each executive officer is periodically reviewed and additional awards are considered based upon a generalized assessment of past performance of the executive and the relative holdings of other executive officers. The stock options and restricted stock unit awards granted to executive officers by the Compensation Committee generally vest over periods of four years subject to continued service with our company, and stock options expire no later than ten years from the date of
grant. The stock options and restricted stock unit awards vest as to 25% of the shares on the first anniversary of the vesting commencement date and as to 1/16th of the shares per quarter thereafter.
The Compensation Committee has historically granted equity awards to employees on a two-year cycle. In August 2016, the Compensation Committee approved a grant of 12,500 stock options and 5,630 RSUs to Mr. Hideshima, based on the Compensation Committee’s review of all employee grant levels and on the recommendation of the Chief Executive Officer. No equity grants were made to any other named executive officer in fiscal year 2017 as none of the other named executive officers were eligible for a two-year refresh grant in fiscal year 2017.
Stock Ownership Guidelines
Other than as discussed below under “Stock Retention Policy,” we currently do not require our directors or executive officers to own a particular amount of our common stock. The Compensation Committee is satisfied that stock and option holdings among our directors and executive officers are sufficient at this time to provide motivation and to align this group’s interests with those of our stockholders. Our insider trading policy prohibits any of our directors, executive officers, employees or contractors from engaging in any transactions in publicly-traded options, such as puts and calls, and other derivative securities, including any hedging or similar transaction, with respect to our common stock.
Stock Retention Policy
We have adopted a stock retention policy which requires that our Chief Executive Officer hold a significant portion of the shares of our common stock acquired under our equity incentive plan for at least 36 months. Under the policy, the Chief Executive Officer must retain at least 50% of all “net” shares received (“net” shares mean those shares remaining after the sale or withholding of shares in payment of the exercise price, if applicable, and withholding taxes) for at least 36 months following the date on which an equity award is vested, settled or exercised.
Recoupment Policy
We established a Recoupment Policy that is applicable to our executive officers. Under the policy, if we are required to prepare an accounting restatement due to material noncompliance with the financial reporting requirements under United States securities laws, the Compensation Committee shall be entitled to recover from any current or former executive officer any excess incentive-based compensation received by such person during the three-year period prior to the date on which we are required to prepare the restatement. This policy applies to both equity-based and cash-based incentive compensation awards. The “excess incentive-based compensation” is the difference between the actual amount that was paid, and the amount that would have been paid under the restated financial results.
As indicated in the Explanatory Note, the consolidated financial statements included in this Annual Report on Form 10-K have been restated. The Board of Directors intends to undertake an analysis of whether any excess incentive-based compensation was paid to any of our executive officers or former executive officers. If the Board of Directors determine that any excess incentive-based compensation was paid to executives, the recoupment of the incentive-based compensation would be immaterial.
Other Benefits
Health and Welfare Benefits
Our executive officers receive the same health and welfare benefits as are offered to our other employees, including medical, dental, vision, life, accidental death and dismemberment, disability, flexible spending accounts and holiday pay. The same contribution amounts, percentages and plan design provisions are applicable to all employees.
Retirement Program
Our executive officers may participate in the same tax-qualified, employee-funded 401(k) plan that is offered to all our other employees. We do not maintain a supplemental executive retirement plan, nor do we offer any defined benefit retirement plans to our executive officers.
Perquisites
We do not provide special benefits or other perquisites to any of our named executive officers.
Employment Arrangements, Severance and Change of Control Benefits
We have not entered into employment agreements with any of our named executive officers. Messrs. Hideshima, Chou and Liaw had, and Ms. Liu currently has, a signed offer letter which provides for at-will employment. The offer letter provides for salary, stock options and right to participate in our employee benefit plans. We do not have any written employment arrangements with Mr. Liang. We do not have any arrangements with any of our executive officers that provide for any severance or other benefits in the event of termination or change of control of our company.
Tax and Accounting Treatment of Compensation
In our review and establishment of compensation programs and payments, we consider, but do not place great emphasis on, the anticipated accounting and tax treatment of our compensation programs to us and our executive officers. While we may consider accounting and tax treatment, these factors alone are not dispositive. Among other factors that receive greater consideration are the net costs to us and our ability to effectively administer executive compensation in the short and long-term interests of stockholders.
Section 162(m) of the U.S. Internal Revenue Code of 1986, as amended (the “Code”), generally limits a company’s ability to deduct for tax purposes compensation in excess of $1.0 million paid in any single tax year to certain executive officers (and, beginning in 2018, certain former executive officers). Prior to what is referred to as the 2017 Tax Reform Act, compensation deemed to be performance-based in accordance with Section 162(m) could be exempt from this $1.0 million limitation, and compensation paid to the chief financial officer was not subject to the deductibility limitation of Section 162(m). We continue to evaluate the impact of the 2017 Tax Reform Act for its potential impact on our company. Regardless of that impact, however, we will continue to design and maintain executive compensation arrangements that we believe will attract and retain the executive talent that we need to compete successfully, even if in certain cases such compensation is not deductible for federal income tax purposes. In addition, because of the uncertainties associated with the application and interpretation of Section 162(m) and the regulations issued thereunder, there can be no assurance that compensation intended to satisfy the requirements for deductibility under Section 162(m), as in effect prior to 2018, will in fact be deductible.
We account for equity compensation paid to our employees in accordance with Financial Accounting Standards Board Accounting Standards Codification Topic 718, Stock-Compensation (“ASC Topic 718”), which requires us to estimate and record expenses for each award of equity compensation over the service period of the award.
We intend that our plans, arrangements and agreements will be structured and administered in a manner that complies with (or is exempt from) the requirements of Section 409A of the Code. Participation in, and compensation paid under, our plans, arrangements and agreements may, in certain instances, result in the deferral of compensation that is subject to the requirements of Section 409A. If our plans, arrangements and agreements as administered fail to meet certain requirements under or exemptions from Section 409A, compensation earned thereunder may be subject to immediate taxation and tax penalties.
Summary
The Committee believes that our compensation philosophy and programs are designed to foster a performance-oriented culture that aligns our executive officers’ interests with those of our stockholders. The Committee also believes that the compensation of our executive officers is both appropriate and responsive to the goal of building stockholder value.
Compensation Committee Report
The Compensation Committee has reviewed and discussed the Compensation Discussion and Analysis (“CD&A”) with our management. Based on this review and these discussions, the Compensation Committee recommended to the Board of Directors that the CD&A be included in this Annual Report on Form 10-K.
This report has been furnished by the Compensation Committee.
Sherman Tuan, Chair
Hwei-Ming (Fred) Tsai
Saria Tseng
Fiscal Year 2017 Summary Compensation Table
The following table sets forth information concerning the compensation earned during the fiscal years ended 2017, 2016 and 2015 of each person who was a named executive officer during fiscal year 2017.
FISCAL YEAR 2017 SUMMARY COMPENSATION TABLE
| Name and Principal Position During Fiscal Year 2017 | Year | Salary ($)(1) | Bonus ($)(2) | Stock Awards ($)(3) | Option Awards ($)(4) | Non-Equity Incentive Plan Compensation ($) | Change in Pension Value and Nonqualified Deferred Compensation Earnings ($) | All Other Compensation ($)(5) | Total ($) | |||||||||||||||||||||||||
| Charles Liang | 2017 | 386,212 | $ | 650 | $ | — | $ | — | $ | — | $ | — | $ | — | $ | 386,862 | ||||||||||||||||||
| President, Chief Executive Officer and Chairman of the Board | 2016 | 363,776 | — | — | — | — | — | — | 363,776 | |||||||||||||||||||||||||
| 2015 | 367,528 | 7,607 | — | 2,607,616 | — | — | — | 2,982,751 | ||||||||||||||||||||||||||
| Howard Hideshima | 2017 | 330,681 | 650 | 115,640 | 116,092 | — | — | 1,500 | 564,563 | |||||||||||||||||||||||||
| Senior Vice President and Chief Financial Officer | 2016 | 322,646 | — | — | — | — | — | — | — | 322,646 | ||||||||||||||||||||||||
| 2015 | 315,816 | 6,990 | — | 403,580 | — | — | — | 726,386 | ||||||||||||||||||||||||||
| Phidias Chou | 2017 | 299,461 | 10,650 | — | — | — | — | — | 310,111 | |||||||||||||||||||||||||
| Senior Vice President, Worldwide Sales | 2016 | 286,747 | 3,416 | 137,160 | 138,000 | — | — | — | 565,323 | |||||||||||||||||||||||||
| 2015 | 300,278 | 6,446 | — | — | — | — | — | 306,724 | ||||||||||||||||||||||||||
| Yih-Shyan (Wally) Liaw | 2017 | 246,105 | 650 | — | — | — | — | — | 246,755 | |||||||||||||||||||||||||
| Senior Vice President, International Sales, Corporate Secretary and Director | 2016 | 232,864 | — | 109,959 | 105,089 | — | — | — | 447,912 | |||||||||||||||||||||||||
| 2015 | 247,271 | 5,422 | — | — | — | — | — | 252,693 | ||||||||||||||||||||||||||
| Sara Liu | 2017 | 244,558 | 650 | — | — | — | — | — | 245,208 | |||||||||||||||||||||||||
| Senior Vice President and Chief Administrative Officer, Treasurer and Director | 2016 | 237,253 | — | 110,484 | 113,961 | — | — | — | 461,698 | |||||||||||||||||||||||||
| 2015 | 230,546 | 5,309 | — | — | — | — | — | 235,855 |
| (1) | Amounts disclosed under "Salary" includes leave pay earned by the named executive officers. |
| (2) | Amounts disclosed under “Bonus” reflect the discretionary cash bonuses earned by the named executive officers. |
| (3) | Amounts represent the grant date fair value of restricted stock unit awards calculated in accordance with ASC Topic 718, and are based on the closing market price of our common stock on the date of grant. |
| (4) | Amounts represent the grant date fair value of each stock option award calculated in accordance with ASC Topic 718, using the Black Scholes option-pricing model. Assumptions used in the calculation of these amounts are included in Part II, Item 8, "Financial Statements and Supplementary Data", and Part II, Item 8, Note 12 “Stock-based Compensation and Stockholders’ Equity” to our consolidated financial statements for the fiscal year 2017 included in this Annual Report on Form 10-K. |
| (5) | Amounts disclosed under “All Other Compensation” reflect payments made by our company in connection with medical and dental benefit waivers. |
Fiscal Year 2017 Grants of Plan-Based Awards
The following table provides information concerning all plan-based awards granted during fiscal year 2017 to each person who was a named executive officer during fiscal year 2017. Except for Mr. Hideshima, no other named executive officer received a plan-based award during fiscal year 2017.
FISCAL YEAR 2017 GRANTS OF PLAN-BASED AWARDS
| Name | Grant Date | All Other Stock Awards: Number of Shares of Stock or Units (#) | All Other Option Awards: Number of Securities Underlying Options (#) | Exercise or Base Price of Option Awards ($/Sh) | Grant Date Fair Value of Stock and Option Awards ($)(1) | |||||||||||
| Charles Liang | — | — | — | $ | — | $ | — | |||||||||
| Howard Hideshima | 8/3/2016 | 5,630 | (2) | — | $ | — | $ | 115,640 | ||||||||
| 8/3/2016 | — | 12,500 | (3) | 20.54 | 116,092 | |||||||||||
| Phidias Chou | — | — | — | $ | — | — | ||||||||||
| Yih-Shyan (Wally) Liaw | — | — | — | $ | — | — | ||||||||||
| Sara Liu | — | — | — | $ | — | — |
| (1) | Represents the fair value of each stock option and restricted stock unit awards as of the date of grant, computed in accordance with ASC Topic 718. |
| (2) | These time-based restricted stock units generally vest at the rate of 25% on May 22, 2017 and 1/16th per quarter thereafter, such that the underlying shares are expected to be fully vested on May 22, 2020. Any unvested equity awards were forfeited upon termination of employment on January 30, 2018. |
| (3) | This stock option generally vests at the rate of 25% on May 8, 2017 and 1/16th per quarter thereafter, such that the awards are expected to be fully vested on May 8, 2020. Any unvested equity awards were forfeited upon termination of employment on January 30, 2018. |
Outstanding Equity Awards at Fiscal Year-End 2017
The following table provides information concerning the outstanding equity-based awards as of June 30, 2017, held by each person who was a named executive officer for fiscal year 2017, including with respect to stock options, the option exercise price and expiration dates for each award.
| Option Awards | Stock Awards | |||||||||||||||
| Name | Number of Securities Underlying Unexercised Options (#) Exercisable | Number of Securities Underlying Unexercised Options (#) Unexercisable | Option Exercise Price ($) | Option Expiration Date | Number of Shares or Units of Stock That Have Not Vested (#) | Market Value of Shares or Units of Stock That Have Not Vested ($)(1) | ||||||||||
| Charles Liang | 720,000 | — | $ | 10.66 | 3/4/2019 | |||||||||||
| 132,000 | — | $ | 18.59 | 4/25/2021 | ||||||||||||
| 231,260 | — | $ | 20.70 | 1/21/2023 | ||||||||||||
| 104,218 | (2) | 62,532 | (2) | $ | 35.07 | 1/19/2025 | ||||||||||
| Howard Hideshima | 10,886 | — | $ | 13.61 | 8/2/2020 | |||||||||||
| 56,614 | — | $ | 13.61 | 8/2/2020 | ||||||||||||
| 8,690 | — | $ | 12.50 | 8/6/2022 | ||||||||||||
| 37,810 | — | $ | 12.50 | 8/6/2022 | ||||||||||||
| 5,445 | (3) | 1,815 | (3) | $ | 26.75 | 8/4/2024 | ||||||||||
| 20,055 | (4) | 6,685 | (4) | $ | 26.75 | 8/4/2024 | ||||||||||
| 1,669 | (5) | 5,010 | (5) | $ | 20.54 | 8/3/2026 | ||||||||||
| 1,455 | (6) | 4,366 | (6) | $ | 20.54 | 8/3/2026 | ||||||||||
| 4,223 | (7) | 104,097 | ||||||||||||||
| Phidias Chou | 6,500 | — | $ | 5.53 | 4/29/2019 | |||||||||||
| 18,970 | — | $ | 8.36 | 10/26/2019 | ||||||||||||
| 31,030 | — | $ | 8.36 | 10/26/2019 | ||||||||||||
| 6,150 | — | $ | 15.22 | 10/24/2021 | ||||||||||||
| 32,850 | — | $ | 15.22 | 10/24/2021 | ||||||||||||
| 16,150 | (8) | 1,077 | (8) | $ | 14.23 | 10/21/2023 | ||||||||||
| 15,724 | (9) | 1,049 | (9) | $ | 14.23 | 10/21/2023 | ||||||||||
| 2,129 | (10) | 2,741 | (10) | $ | 25.40 | 10/21/2025 | ||||||||||
| 3,118 | (11) | 4,012 | (11) | $ | 25.40 | 10/21/2025 | ||||||||||
| 3,375 | (12) | 83,194 | ||||||||||||||
| Yih-Shyan (Wally) Liaw | 10,635 | — | $ | 7.46 | 4/28/2018 | |||||||||||
| 10,275 | — | $ | 7.46 | 4/28/2018 | ||||||||||||
| 10,079 | — | $ | 13.61 | 8/2/2020 | ||||||||||||
| 7,671 | — | $ | 13.61 | 8/2/2020 | ||||||||||||
| 8,687 | — | $ | 17.29 | 4/23/2022 | ||||||||||||
| 18,313 | — | $ | 17.29 | 4/23/2022 | ||||||||||||
| 6,127 | (13) | 1,415 | (13) | $ | 18.93 | 4/21/2024 | ||||||||||
| 12,559 | (14) | 2,899 | (14) | $ | 18.93 | 4/21/2024 | ||||||||||
| 1,596 | (15) | 3,514 | (15) | $ | 28.71 | 4/27/2026 | ||||||||||
| 1,058 | (16) | 2,332 | (16) | $ | 28.71 | 4/27/2026 | ||||||||||
| 2,873 | (17) | 70,819 | ||||||||||||||
| Sara Liu | 19,615 | — | $ | 11.81 | 1/25/2020 | |||||||||||
| 16,285 | — | $ | 11.81 | 1/25/2020 | ||||||||||||
| 29,000 | — | $ | 17.09 | 1/23/2022 | ||||||||||||
| 20,125 | (18) | 2,875 | (18) | $ | 17.96 | 1/20/2024 | ||||||||||
| 3,375 | (19) | 5,625 | (19) | $ | 27.28 | 1/27/2026 | ||||||||||
| 2,785 | (20) | 68,650 |
| (1) | Represents the closing stock price per share of our common stock as of June 30, 2017 ($24.65) multiplied by the number of shares underlying RSUs that had not vested as of June 30, 2017. |
| (2) | Option generally vested at the rate of 25% on November 1, 2015 and 1/16th per quarter thereafter, such that the award is expected to be fully vested on November 1, 2018. |
| (3) | Option (ISO) generally vested at the rate of 25% on May 8, 2015 and 1/16th per quarter thereafter, such that the award is expected to be fully vested on May 8, 2018. Any unvested equity awards were forfeited upon termination of employment on January 30, 2018. |
| (4) | Option (NQ) generally vested at the rate of 25% on May 8, 2015 and 1/16th per quarter thereafter, such that the award is expected to be fully vested on May 8, 2018. Any unvested equity awards were forfeited upon termination of employment on January 30, 2018. |
| (5) | Option (ISO) generally vested at the rate of 25% on May 8, 2017 and 1/16th per quarter thereafter, such that the award is expected to be fully vested on May 8, 2020. Any unvested equity awards were forfeited upon termination of employment on January 30, 2018. |
| (6) | Option (NQ) generally vested at the rate of 25% on May 8, 2017 and 1/16th per quarter thereafter, such that the award is expected to be fully vested on May 8, 2020. Any unvested equity awards were forfeited upon termination of employment on January 30, 2018. |
| (7) | RSUs generally vested at the rate of 25% on May 22, 2017 and 1/16th per quarter thereafter, such that the underlying shares are expected to be fully vested on May 22, 2020. |
| (8) | Option (ISO) generally vested at the rate of 25% on September 13, 2014 and 1/16th per quarter thereafter, such that the award is expected to be fully vested on September 13, 2017. |
| (9) | Option (NQ) generally vested at the rate of 25% on September 13, 2014 and 1/16th per quarter thereafter, such that the award is expected to be fully vested on September 13, 2017. |
| (10) | Option (ISO) generally vested at the rate of 25% on September 13, 2016 and 1/16th per quarter thereafter, such that the award is expected to be fully vested on September 13, 2019. Any unvested equity awards were forfeited upon termination of employment on January 30, 2018. |
| (11) | Option (NQ) generally vested at the rate of 25% on September 13, 2016 and 1/16th per quarter thereafter, such that the award is expected to be fully vested on September 13, 2019. Any unvested equity awards were forfeited upon termination of employment on January 30, 2018. |
| (12) | RSUs generally vested at the rate of 25% on November 10, 2016 and 1/16th per quarter thereafter, such that the underlying shares are expected to be fully vested on November 10, 2019. |
| (13) | Option (ISO) generally vested at the rate of 25% on March 30, 2015 and 1/16th per quarter thereafter, such that the award is expected to be fully vested on March 30, 2018. Any unvested equity awards were forfeited upon termination of employment on January 30, 2018. |
| (14) | Option (NQ) generally vested at the rate of 25% on March 30, 2015 and 1/16th per quarter thereafter, such that the award is expected to be fully vested on March 30, 2018. Any unvested equity awards were forfeited upon termination of employment on January 30, 2018. |
| (15) | Option (ISO) generally vested at the rate of 25% on March 29, 2017 and 1/16th per quarter thereafter, such that the award is expected to be fully vested on March 29, 2020. Any unvested equity awards were forfeited upon termination of employment on January 30, 2018. |
| (16) | Option (NQ) generally vested at the rate of 25% on March 29, 2017 and 1/16th per quarter thereafter, such that the award is expected to be fully vested on March 29, 2020. Any unvested equity awards were forfeited upon termination of employment on January 30, 2018. |
| (17) | RSUs generally vested at the rate of 25% on May 10, 2017 and 1/16th per quarter thereafter, such that the underlying award is expected to be fully vested on May 10, 2020. |
| (18) | Option generally vested at the rate of 25% on December 12, 2014 and 1/16th per quarter thereafter, such that the award is expected to be fully vested on December 12, 2017. |
| (19) | Option generally vested at the rate of 25% on December 12, 2016 and 1/16th per quarter thereafter, such that the award is expected to be fully vested on December 12, 2019. |
| (20) | RSUs generally vested at the rate of 25% on February 10, 2017 and 1/16th per quarter thereafter, such that the award is expected to be fully vested on February 10, 2020. |
Option Exercises and Stock Vested During Fiscal Year 2017
The following table sets forth the dollar amounts realized by each person who was a named executive officer during fiscal year 2017 pursuant to the exercise or vesting of equity-based awards during fiscal year 2017.
| Option Awards | Stock Awards | ||||||||||||
| Name | Number of Shares Acquired on Exercise (#) | Value Realized on Exercise ($)(1) | Number of Shares Acquired on Vesting (#) | Value Realized on Vesting ($)(2) | |||||||||
| Charles Liang | — | $ | — | — | $ | — | |||||||
| Howard Hideshima | 63,126 | $ | 749,544 | 1,407 | $ | 34,260 | |||||||
| Phidias Chou | 11,000 | $ | 212,554 | 2,025 | $ | 49,392 | |||||||
| Sara Liu | 25,000 | $ | 500,871 | 1,265 | $ | 33,029 | |||||||
| Yih-Shyan (Wally) Liaw | 20,000 | $ | 281,000 | 957 | $ | 23,112 |
| (1) | Based on the difference between the sales price of our common stock at the time of exercise and the exercise price. |
| (2) | The value is the closing price of our common stock on the date of vesting, multiplied by the number of shares vested. |
Pension and Nonqualified Deferred Compensation
We do not provide any nonqualified deferred compensation arrangements or pension plans. As such, the Pension Benefits disclosure and Nonqualified Deferred Compensation disclosure are omitted from this Annual Report on Form 10-K.
Potential Payments Upon Termination or Change of Control
We do not currently and did not during fiscal year 2017 have any arrangements with any of our executive officers that provide for any severance or other benefits in the event of termination or change of control of our company.
Director Compensation
Under our director compensation policy in effect for fiscal year 2017, we reimburse non-employee directors for reasonable expenses in connection with attendance at Board and committee meetings. Our non-employee directors receive an annual retainer of $40,000, payable quarterly. In addition, the Chairperson of our Audit Committee receives an additional annual retainer of $25,000, the Chairperson of each of our Compensation Committee and Nominating and Corporate Governance Committee receives an additional annual retainer of $5,000 and each director serving in a non-chairperson capacity on our standing Board committees receives an additional annual retainer of $2,500 per committee, payable quarterly.
Non-employee directors also are eligible to receive stock options under our 2016 Equity Incentive Plan. Under the policy, non-employee directors are granted an initial option to purchase 18,000 shares upon first becoming a member of our Board of Directors. A non-employee director serving as Chairperson of the Audit Committee receives an additional initial grant of an option to purchase 12,000 shares. Non-employee directors serving as Chairperson of the Compensation or Nominating and Corporate Governance Committees receive an additional initial grant of an option to purchase 2,000 shares. Each of these initial options generally vests and becomes exercisable over four years, with the first 25% of the shares subject to each initial option generally vesting on the first anniversary of the date of grant and the remainder generally vesting quarterly thereafter. Immediately after each of our annual meetings of stockholders, each non-employee director is granted an option to purchase 4,500 shares of our common stock, the Audit Committee Chairperson is granted an additional annual option to purchase 3,000 shares of our common stock and the Chairperson of each of the Compensation and Nominating and Corporate Governance Committees is granted an additional annual option to purchase 500 shares of our common stock. These options will vest and become exercisable generally on the first anniversary of the date of grant or immediately prior to our annual meeting of stockholders, if earlier.
The options granted to non-employee directors have a per share exercise price equal to 100% of the fair market value of the underlying shares on the date of grant, and will become fully vested if we undergo a change of control. Annual grants will be reduced proportionally if the person does not serve for the full year after the annual grant.
The following table shows for the fiscal year ended June 30, 2017 certain information with respect to the compensation of all of our non-employee directors who served in such capacity during the fiscal year ended June 30, 2017:
FISCAL YEAR 2017 DIRECTOR COMPENSATION
| Name | Fees Earned or Paid in Cash ($)(1) | Stock Awards ($) | Option Awards ($)(2) | Total ($) | ||||||||||
| Laura Black | $ | 65,000 | — | $ | 83,700 | $ | 148,700 | |||||||
| Michael McAndrews | $ | 42,500 | — | $ | 50,220 | $ | 92,720 | |||||||
| Hwei-Ming (Fred) Tsai | $ | 50,000 | — | $ | 55,800 | $ | 105,800 | |||||||
| Saria Tseng | $ | 33,750 | — | $ | 229,049 | $ | 262,799 | |||||||
| Sherman Tuan | $ | 47,500 | — | $ | 55,800 | $ | 103,300 |
| (1) | This column represents annual director fees, non-employee committee chairman fees and other committee member fees earned in fiscal year 2017. |
| (2) | The dollar amount in this column represents the aggregate grant date fair value of the awards calculated in accordance with FASB ASC Topic 718, using the Black Scholes option-pricing model. On March 1, 2017 each of Ms. Black and Messrs. McAndrews, Tsai and Tuan were granted options to purchase 7,500, 4,500, 5,000 and 5,000 shares, respectively, with the grant date fair values set forth in the table above. In connection with her initial appointment to the Board, on November 4, 2016, Ms. Tseng received an initial option to purchase 18,000 shares with a grant date fair value of $9.93 and on March 1, 2017 she received an additional option to purchase 4,500 shares with a grant date fair value of $11.16. Assumptions used in the calculation of the grant date fair value amounts are included in Part II, Item 8, "Financial Statements and Supplementary Data", and Item II, Part 8, Note 12, “Stock-based Compensation and Stockholders’ Equity” to our consolidated financial statements for the fiscal year 2017 included in this Annual Report on Form 10-K. |
The table below sets forth the aggregate number of shares underlying option awards held by our non-employee directors as of June 30, 2017. None of the non-employee directors held any unvested stock awards as of June 30, 2017.
| Name | Option Awards | |
| Laura Black | 31,500 | |
| Michael McAndrews | 27,000 | |
| Hwei-Ming (Fred) Tsai | 50,000 | |
| Saria Tseng | 22,500 | |
| Sherman Tuan | 51,500 |
Compensation Committee Interlocks and Insider Participation
None of the members of the Compensation Committee is a current or former officer or employee of our company or had any relationship with our company requiring disclosure. In addition, during fiscal year 2017, none of our executive officers served as a member of the Board of Directors or Compensation Committee of any other entity that has one or more executive officers who served on our Board of Directors or Compensation Committee. Saria Tseng, Hwei-Ming (Fred) Tsai and Sherman Tuan served on the Compensation Committee in fiscal year 2017.
Compensation Program Risk Assessment
We have assessed our compensation programs and have concluded that risks arising from our compensation policies and practices are not reasonably likely to have a material adverse effect on us. We concluded that our compensation policies and practices do not encourage excessive or inappropriate risk-taking. We believe our programs are appropriately designed to encourage our employees to make decisions that result in positive short-term and long-term results for our business and our shareholders.
Item 12. Security Ownership of Certain Beneficial Owners and Management and Related Stockholder Matters
Security Ownership of Certain Beneficial Owners and Management
The following table sets forth certain information known to us regarding beneficial ownership of our common stock as of March 31, 2019 by:
| • | Each of the named executive officers during Fiscal Year 2017; |
| • | Each of our directors; |
| • | All directors and executive officers as a group; and |
| • | All person known to us beneficially own 5% or more of our outstanding common stock. |
| Name and Address of Beneficial Owner(1) | Amount and Nature of Beneficial Ownership(2) | Percent of Common Stock Outstanding(3) | |||
| Executive Officers and Directors: | |||||
| Charles Liang(4) | 8,330,684 | 16.5 | % | ||
| Howard Hideshima(5) | 149,655 | * | |||
| Phidias Chou(6) | 136,247 | * | |||
| Sara Liu(7) | 8,330,684 | 16.5 | % | ||
| Yih-Shyan (Wally) Liaw(8) | 1,721,895 | 3.4 | % | ||
| Laura Black(9) | 31,500 | * | |||
| Michael S. McAndrews(10) | 27,000 | * | |||
| Hwei-Ming (Fred) Tsai(11) | 290,000 | * | |||
| Saria Tseng(12) | 15,750 | * | |||
| Sherman Tuan(13) | 47,650 | * | |||
| All directors and executive officers as a group (13 persons)(14) | 10,802,799 | 21.1 | % | ||
| 5% Holders Not Listed Above: | |||||
| Dimensional Fund Advisors (15) | 3,355,723 | 6.7 | % |
*Represents beneficial ownership of less than one percent of the outstanding shares of common stock
| (1) | Except as otherwise indicated, to our knowledge the persons named in this table have sole voting and investment power with respect to all shares of Common Stock shown as beneficially owned by them, subject to community property laws applicable and to the information contained in the footnotes to this table. |
| (2) | Under the SEC rules, a person is deemed to be the beneficial owner of shares that can be acquired by such person within 60 days upon the exercise of options or RSUs subject to vesting. |
| (3) | Calculated on the basis of 49,881,914 shares of common stock outstanding as of March 31, 2019, provided that any additional shares of Common Stock that a stockholder has the right to acquire within 60 days after March 31, 2019 are deemed to be outstanding for the purposes of calculating that stockholder’s percentage of beneficial ownership. |
| (4) | Includes 612,614 options exercisable within 60 days after March 31, 2019. Also includes 3,175,002 shares jointly held by Mr. Liang and Sara Liu, his spouse, 472,425 shares held directly by Ms. Liu and 95,465 options exercisable or restricted stock units subject to vesting, both within 60 days after March 31, 2019. See footnote 8. |
| (5) | Includes 148,435 shares issuable upon the exercise of options exercisable within 60 days after March 31, 2019. |
| (6) | Includes 136,427 shares issuable upon the exercise of options exercisable within 60 days after March 31, 2019. |
| (7) | Includes 95,465 options exercisable or restricted stock units subject to vesting, both within 60 days after March 31, 2019. Also includes 3,175,002 shares jointly held by Ms. Liu and Mr. Liang, her spouse, 3,969,793 shares held by Charles Liang, Ms. Liu’s spouse and 612,614 shares issuable upon the exercise of options held by Mr. Liang and exercisable within 60 days after March 31, 2019. See footnote 4. |
| (8) | Includes 70,027 shares issuable upon the exercise of options exercisable within 60 days after March 31, 2019. 1,582,597 shares held by Liaw Family Trust, for which Mr. Liaw and his spouse serve as trustees, 24,256 shares held by Mr. Liaw’s daughters and 44,177 shares held by Mrs. Liaw. |
| (9) | Includes 31,500 shares issuable upon the exercise of options exercisable within 60 days after March 31, 2019. |
| (10) | Includes 27,000 shares issuable upon the exercise of options exercisable within 60 days after March 31, 2019. |
| (11) | Includes 40,000 shares issuable upon the exercise of options exercisable within 60 days after March 31, 2019. |
| (12) | Includes 15,750 shares issuable upon the exercise of options exercisable within 60 days after March 31, 2019. |
| (13) | Includes 40,000 shares issuable upon the exercise of options exercisable within 60 days after March 31, 2019. |
| (14) | Includes 10,795,299 options exercisable or restricted stock units subject to vesting, both within 60 days after March 31, 2019. |
| (15) | The information with respect to the holdings of Dimensional Fund Advisors LP ("Dimensional Fund Advisors") is |
based solely on Schedule 13G filed on February 8, 2019 by Dimensional Fund Advisors. Dimensional Fund Advisors
has the sole power to dispose or to direct the disposition of all of such shares. Dimensional Fund Advisors has the sole
power to direct the vote of 3,355,723 of such shares. The address for Dimensional Fund Advisors is Building One,
6300 Bee Cave Road, Austin, Texas 78746.
Equity Compensation Plan Information
We currently maintain two compensation plans that provide for the issuance of our Common Stock to officers and other employees, directors and consultants. These consist of the 2006 Equity Incentive Plan and the 2016 Equity Incentive Plan, both of which have been approved by our stockholders. We no longer grant any equity-based awards under the 2006 Equity Incentive Plan. The following table sets forth information regarding outstanding options and RSUs and shares reserved and remaining available for future issuance under the foregoing plans as of June 30, 2017:
| Plan Category | Number of securities to be issued upon exercise of outstanding options, warrants and rights (a)(1) | Weighted-average exercise price of outstanding options, warrants and rights (b)(2)(3) | Number of securities remaining available for future issuance under equity compensation plans (excluding securities reflected in column (a)) (c) | ||||||
| Equity compensation plans approved by security holders | 9,602,016 | $ | 17.19 | 2,785,792 | |||||
| Equity compensation plans not approved by security holders | — | — | — | ||||||
| Total | 9,602,016 | $ | 17.19 | 2,785,792 |
| (1) | This number includes 8,375,659 shares subject to outstanding options and 1,226,357 shares subject to outstanding RSU awards. |
| (2) | The weighted average exercise price is calculated based solely on the exercise prices of the outstanding options and does not reflect the shares that will be issued upon the vesting of outstanding awards of RSUs, which have no exercise price. |
| (3) | The weighted-average remaining contractual term of our outstanding options as of June 30, 2017 was 4.37 years. |
Item 13. Certain Relationships and Related Transactions and Director Independence
CERTAIN RELATIONSHIPS AND RELATED TRANSACTIONS AND DIRECTOR INDEPENDENCE
Procedures for Approval of Related Person Transactions
Pursuant to our Audit Committee charter, the Audit Committee has the responsibility for the review and approval of any related person transactions; provided that if the matter or transaction involves employment or compensation terms for services to our company, including retention or payment provisions relating to expert services, then it is presented to the Compensation Committee. In approving or rejecting a proposed transaction, or a relationship that encompasses many similar transactions, our Audit Committee will consider the relevant facts and circumstances available and deemed relevant, including but not limited to the risks, costs and benefits to us, the terms of the transaction, the availability of other sources for comparable services or products, and, if applicable, the impact on a director’s independence. Our Audit Committee approves only those transactions that, in light of known circumstances are not inconsistent with our best interests, as the Audit Committee determines in the good faith exercise of its discretion. In addition, we annually require each of our directors and executive officers to complete a directors’ and officers’ questionnaire that elicits information about related party transactions as such term is defined by SEC rules and regulations. These procedures are intended to determine whether any such related party transaction impairs the independence of a director or presents a conflict of interest on the part of a director, employee or officer.
Transactions with Related Parties, Promoters and Certain Control Persons
Director and Officer Indemnification
We have entered into agreements to indemnify our directors and executive officers to the fullest extent permitted under Delaware law. In addition, our certificate of incorporation contains provisions limiting the liability of our directors and our bylaws contain provisions requiring us to indemnify our officers and directors.
Equity-Based Awards
Please see the “Grants of Plan-Based Awards” table and the “Director Compensation” table above for information on stock option and restricted stock unit grants to our directors and named executive officers in fiscal year 2017.
Employment Relationships
Hung-Fan (Albert) Liu, who is a brother of Sara Liu, our Co-Founder and Senior Vice President and a director, was employed in our operations organization in San Jose, California. Mr. Liu received a total compensation of approximately $262,000 in fiscal year 2017. The total compensation includes salary, bonus and equity awards.
Shao Fen (Carly) Kao, who is a sister-in-law of Sara Liu, our Co-Founder and Senior Vice President and a director, was employed in our finance and accounting organization in San Jose, California. Ms. Kao received total compensation of approximately $122,000 in fiscal year 2017. The total compensation includes salary, bonus and equity awards.
Transactions with Ablecom and Compuware
We have entered into a series of agreements with Ablecom Technology Inc. ("Ablecom"), a Taiwan corporation, and one of its affiliates, Compuware Technology, Inc ("Compuware"). Ablecom’s ownership of Compuware is below 50% but Compuware remains a related party as Ablecom still has significant influence over the operations. Ablecom’s Chief Executive Officer, Steve Liang, is the brother of Charles Liang, our President, Chief Executive Officer and Chairman of the Board of Directors, and owns approximately 0.4% of our common stock. Charles Liang served as a Director of Ablecom during our fiscal 2006, but is no longer serving in such capacity. In addition, Charles Liang and Sara Liu, his spouse, who is also an officer and director of ours, collectively own approximately 10.5% of Ablecom’s capital stock, while Steve Liang and other family members owned approximately 36.0% and 36.0% of Ablecom at June 30, 2017 and 2016, respectively. Bill Liang, a brother of both Charles Liang and Steve Liang, also is a member of the Board of Directors of Ablecom. Bill Liang is also the Chief Executive Officer of Compuware, a member of Compuware’s Board of Directors and a holder of a significant equity interest in Compuware. Steve Liang is also a member of Compuware’s Board of Directors and is an equity holder of Compuware. None of the Company, Charles Liang or Sara Liu own any capital stock of Compuware.
We have a series of agreements with Ablecom, including multiple product development, production and service agreements, product manufacturing agreements, manufacturing services agreements and lease agreements for warehouse space.
Under these agreements, we outsource a portion of our design activities and a significant part of our manufacturing of components such as server chassis to Ablecom. Ablecom agrees to design products according to our specifications. Additionally, Ablecom agrees to build the tools needed to manufacture the products. We have agreed to pay for the cost of chassis and related product tooling and engineering services and will pay for those items when the work has been completed.
We entered into a distribution agreement with Compuware, under which we appointed Compuware as a non-exclusive distributor of our products in Taiwan, China and Australia. We believe that the pricing and terms under the distribution agreement are similar to the pricing and terms of distribution arrangements we have with similar third-party distributors.
We have also entered into a series of agreements with Compuware, including a multiple product development, production and service agreements, product manufacturing agreements, and lease agreements for office space. Under these agreements, we outsource to Compuware a portion of our design activities and a significant part of our manufacturing of components, particularly power supplies. With respect to design activities, Compuware generally agrees to design certain agreed-upon products according to our specifications, and further agrees to build the tools needed to manufacture the products. We pay Compuware for the design and engineering services, and further agree to pay Compuware for the tooling.
We retain full ownership of any intellectual property resulting from the design of these products and tooling. With respect to the manufacturing aspects of the relationship, Compuware purchases most of materials needed to manufacture the power supplies from outside markets and uses these materials to manufacture the products and then sell to us. We review and frequently negotiate with Compuware the prices of the power supplies the we purchase from Compuware. Compuware also manufactures motherboards, backplanes and other components used on our printed circuit boards. We sell to Compuware most of the components needed to manufacture the above products. Compuware uses these components to manufacture and then sells back the products to us at a purchase price equal to the price at which we sold the components to Compuware, plus a “manufacturing value added” fee and other miscellaneous material charges and costs. We frequently review and negotiate with Compuware the amount of the “manufacturing value added” fee that will be included in the price of the products we purchase from Compuware.
Ablecom’s sales to us comprise a substantial majority of Ablecom’s net sales. For fiscal years ended June 30, 2017, 2016 and 2015, we purchased products from Ablecom totaling $118.5 million, $117.6 million and $123.1 million, respectively. Amounts owed to Ablecom by us as of June 30, 2017 and 2016, were $30.8 million and $29.8 million, respectively. For the fiscal years ended June 30, 2017, 2016 and 2015, we paid Ablecom $5.2 million, $7.8 million and $4.9 million, respectively, for design services, tooling assets and miscellaneous costs.
Compuware’s sales of our products to others comprise a majority of Compuware’s net sales. For fiscal years ended June 30, 2017, 2016 and 2015, we sold products to Compuware totaling $23.0 million, $29.1 million and $47.6 million, respectively. Amounts owed to us by Compuware as of June 30, 2017 and 2016, were $7.9 million and $3.7 million, respectively. The price at which Compuware purchases the products from us is at a discount from our standard price for purchasers who purchase specified volumes from us. In exchange for this discount, Compuware assumes the responsibility to install our products at the site of the end customer and administers first-level customer support. For the fiscal years ended June 30, 2017, 2016 and 2015, we purchased products from Compuware totaling $117.5 million, $125.0 million and $104.6 million, respectively. Amounts we owed to Compuware as of June 30, 2017 and 2016, were $32.2 million and $20.5 million, respectively. For the fiscal years ended June 30, 2017, 2016 and 2015, we paid Compuware $1.4 million, $1.1 million and $0.8 million, respectively, for design services, tooling assets and miscellaneous costs.
Our exposure to financial loss as a result of our involvement with Ablecom is limited to potential losses on our purchase orders in the event of an unforeseen decline in the market price and/or demand for our products such that we incur a loss on the sale or cannot sell the products. Our outstanding purchase orders to Ablecom were $23.5 million and $22.8 million at June 30, 2017 and 2016, respectively, representing the maximum exposure to financial loss. We do not directly or indirectly guarantee any obligations of Ablecom, or any losses that the equity holders of Ablecom may suffer.
Our exposure to financial loss as a result of our involvement with Compuware is limited to potential losses on our purchase orders in the event of an unforeseen decline in the market price and/or demand for our products such that we incur a loss on the sale or cannot sell the products. Our outstanding purchase orders to Compuware were $56.4 million and $40.0 million at June 30, 2017 and 2016, respectively, representing the maximum exposure to financial loss. We do not directly or indirectly guarantee any obligations of Compuware, or any losses that the equity holders of Compuware may suffer.
Item 14. Principal Accounting Fees and Services
The Audit Committee appointed Deloitte & Touche LLP as our independent registered public accounting firm for the fiscal year 2017.
Independent Registered Public Accounting Firm Fees and Services
The following table sets forth the aggregate audit fees billed to us by our independent registered public accounting firm, Deloitte & Touche LLP, the member firms of Deloitte Touche Tohmatsu, and their respective affiliates (collectively, “Deloitte”), and fees paid to Deloitte for services in the fee categories indicated below for the fiscal years 2017 and 2016. The Audit Committee has considered the scope and fee arrangements for all services provided by Deloitte, taking into account whether the provision of non-audit services is compatible with maintaining Deloitte’s independence, and has pre-approved the services described below.
| Fiscal Year Ended | |||||||
| June 30, 2017 | June 30, 2016 | ||||||
| Audit Fees(1) | $ | 22,259,000 | $ | 2,427,000 | |||
| Audit-Related Fees | — | — | |||||
| Tax Fees | — | — | |||||
| All Other Fees | 2,000 | — | |||||
| Total | $ | 22,261,000 | $ | 2,427,000 |
| (1) | Audit fees consist of the aggregate fees for professional services rendered for the audit of our consolidated financial statements, review of interim condensed consolidated financial statements and certain statutory audits. |
Audit Committee Pre-Approval Policies and Procedures
The Audit Committee has determined that all services performed by Deloitte & Touche LLP are compatible with maintaining the independence of Deloitte & Touche LLP. The Audit Committee’s policy on approval of services performed by the independent registered public accounting firm is to pre-approve all audit and permissible non-audit services to be provided by the independent registered public accounting firm during the fiscal year. The Audit Committee reviews each non-audit service to be provided and assesses the impact of the service on the firm’s independence.
PART IV
Item 15. Exhibits and Financial Statement Schedules
(a) 1. Financial Statements
See Index to consolidated financial statements in Part II, Item 8 of this Annual Report on Form 10-K, which is incorporated herein by reference.
- Financial Statement Schedules
All financial statement schedules have been omitted because they are either not applicable or the required information is shown in the consolidated financial statements or notes thereto.
- Exhibits
See the Exhibit Index which precedes the signature page of this Annual Report on Form 10-K, which is incorporated herein by reference.
(b) Exhibits
See Item 15(a)(3) above.
(c) Financial Statement Schedules
See Item 15(a)(2) above.
EXHIBIT INDEX
| + | Filed herewith |
| (1) | Incorporated by reference to the same number exhibit filed with the Registrant’s Registration Statement on Form S-1 (Registration No. 333-138370), declared effective by the Securities and Exchange Commission on March 28, 2007. |
| (2) | Incorporated by reference to the Company’s Registration Statement on Form S-8 (Commission File No. 333-142404) filed with the Securities and Exchange Commission on April 27, 2007. |
| (3) | Incorporated by reference to Exhibit 10.1 from the Company’s Current Report on Form 8-K (Commission File No. 001-33383) filed with the Securities and Exchange Commission on June 29, 2007. |
| (4) | Incorporated by reference to the Company’s Annual Report on Form 10-K (Commission File No. 001-33383) filed with the Securities and Exchange Commission on September 2, 2008. |
| (5) | Incorporated by reference to the Company’s Current Report on Form 8-K (Commission File No. 001-33383) filed with the Securities and Exchange Commission on December 2, 2008. |
| (6) | Incorporated by reference to the Company’s Quarterly Report on Form 10-Q (Commission File No. 001-33383) filed with the Securities and Exchange Commission on May 7, 2010. |
| (7) | Incorporated by reference to Exhibit 10.34 from the Company’s Annual Report on Form 10-K (Commission File No. 001-33383) filed with the Securities and Exchange Commission on September 7, 2010. |
| (8) | Incorporated by reference to Appendix A from the Company’s Definitive Proxy Statement on Schedule 14A (Commission File No. 001-33383) filed with the Securities and Exchange Commission on January 18, 2011. |
| (9) | Incorporated by reference to the Company's Quarterly Report on Form 10-Q (Commission File No. 001-33383) filed with the Securities and Exchange Commission on November 7, 2011. |
| (10) | Incorporated by reference to the Company's Current Report on Form 8-K (Commission File No. 001-33383) filed with the Securities and Exchange Commission on September 24, 2013. |
| (11) | Incorporated by reference to the Company’s Quarterly Report on Form 10-Q (Commission File No. 001-33383) filed with the Securities and Exchange Commission on November 7, 2013. |
| (12) | Incorporated by reference to the Company’s Quarterly Report on Form 10-Q (Commission File No. 001-33383) filed with the Securities and Exchange Commission on February 9, 2015. |
| (13) | Incorporated by reference to the Company’s Annual Report on Form 10-K (Commission File No. 001-33383) filed with the Securities and Exchange Commission on September 10, 2015. |
| (14) | Incorporated by reference to the Company’s Quarterly Report on Form 10-Q (Commission File No. 001-33383) filed with the Securities and Exchange Commission on November 16, 2015. |
| (15) | Incorporated by reference to the Company’s Quarterly Report on Form 10-Q (Commission File No. 001-33383) filed with the Securities and Exchange Commission on February 4, 2016. |
| (16) | Incorporated by reference to the Company's Current Report on Form 8-K (Commission File No. 001-33383) filed with the Securities and Exchange Commission on March 14, 2016. |
| (17) | Incorporated by reference to the Company's Form S-8 (Commission File No.333-210881) filed with the Securities and Exchange Commission on April 22, 2016. |
| (18) | Incorporated by reference to the Company’s Quarterly Report on Form 10-Q (Commission File No. 001-33383) filed with the Securities and Exchange Commission on May 6, 2016. |
| (19) | Incorporated by reference to the Company’s Annual Report on Form 10-K (Commission File No. 001-33383) filed with the Securities and Exchange Commission on August 26, 2016. |
| (20) | Incorporated by reference to the Company’s Quarterly Report on Form 10-Q (Commission File No. 001-33383) filed with the Securities and Exchange Commission on May 10, 2017. |
| (21) | Incorporated by reference to Exhibit 10.1 from the Company’s Current Report on 8-K (Commission File No. 001-33383) filed with the Securities and Exchange Commission on October 31, 2017. |
| (22) | Incorporated by reference to Exhibit 10.1 from the Company’s Current Report on 8-K (Commission File No. 001-33383) filed with the Securities and Exchange Commission on January 17, 2018. |
| (23) | Incorporated by reference to Exhibit 10.1 from the Company’s Current Report on 8-K (Commission File No. 001-33383) filed with the Securities and Exchange Commission on March 13, 2018. |
| (24) | Incorporated by reference to Exhibit 10.1 from the Company’s Current Report on 8-K (Commission File No. 001-33383) filed with the Securities and Exchange Commission on September 12, 2018. |
| (25) | Incorporated by reference to Exhibit 10.1 from the Company’s Current Report on 8-K (Commission File No. 001-33383) filed with the Securities and Exchange Commission on February 5, 2019. |
| (26) | The certifications attached as Exhibit 32.1 and 32.2 accompany the Annual Report on Form 10-K pursuant to Section 906 of the Sarbanes-Oxley Act of 2002 and shall not be deemed “filed” by Super Micro Computer, Inc. for purposes of Section 18 of the Securities Exchange Act of 1934, as amended. |
| * | Management contract, or compensatory plan or arrangement |
Item 16. Form 10-K Summary
None.
SIGNATURES
Pursuant to the requirements of Section 13 or 15(d) of the Securities Exchange Act of 1934, the registrant has duly caused this report to be signed on its behalf by the undersigned, thereunto duly authorized.
SUPER MICRO COMPUTER, INC.
| Date: | May 16, 2019 | /s/ CHARLES LIANG | |
| Charles Liang President, Chief Executive Officer and Chairman of the Board (Principal Executive Officer) |
POWER OF ATTORNEY
KNOW ALL PERSONS BY THESE PRESENTS, that each person whose signature appears below constitutes and appoints Charles Liang and Kevin Bauer, jointly and severally, his attorney-in-fact, each with the full power of substitution, for such person, in any and all capacities, to sign any and all amendments to this Annual Report on Form 10-K, and to file the same, with all exhibits thereto and other documents in connection therewith, with the Securities and Exchange Commission, granting unto said attorney-in-fact and agent full power and authority to do and perform each and every act and thing requisite and necessary to be done in connection therewith, as fully to all intents and purposes as he might do or could do in person hereby ratifying and confirming all that each of said attorneys-in-fact and agents, or his substitute, may do or cause to be done by virtue hereof.
Pursuant to the requirements of the Securities Exchange Act of 1934, this report has been signed below by the following persons on behalf of the registrant and in the capacities indicated and on the dates indicated.
| Signature | Title | Date | ||
| /s/ CHARLES LIANG | President, Chief Executive Officer and Chairman of the Board (Principal Executive Officer) | May 16, 2019 | ||
| Charles Liang | ||||
| /s/ KEVIN BAUER | Senior Vice President, Chief Financial Officer (Principal Financial and Accounting Officer) | May 16, 2019 | ||
| Kevin Bauer | ||||
| /s/ SARA LIU | Director | May 16, 2019 | ||
| Sara Liu | ||||
| /s/ LAURA BLACK | Director | May 16, 2019 | ||
| Laura Black | ||||
| /s/ MICHAEL S. MCANDREWS | Director | May 16, 2019 | ||
| Michael S. McAndrews | ||||
| /s/ HWEI-MING (FRED) TSAI | Director | May 16, 2019 | ||
| Hwei-Ming (Fred) Tsai | ||||
| /s/ SARIA TSENG | Director | May 16, 2019 | ||
| Saria Tseng | ||||
| /s/ SHERMAN TUAN | Director | May 16, 2019 | ||
| Sherman Tuan | ||||
| /s/ TALLY LIU | Director | May 16, 2019 | ||
| Tally Liu |