 filings.tools
Snap-on 10-K 2015-01-03
Filed 2015-02-12. 21 sections, 479K characters. Original on sec.gov · Markdown · JSON
Cover and table of contents
10-K 1 d829867d10k.htm FORM 10-K
Table of Contents
UNITED STATES
SECURITIES AND EXCHANGE COMMISSION
Washington, D.C. 20549
FORM 10-K
| x | ANNUAL REPORT PURSUANT TO SECTION 13 OR 15(d) OF THE SECURITIES EXCHANGE ACT OF 1934 |
|---|
For the fiscal year ended January 3, 2015, or
| ¨ | TRANSITION REPORT PURSUANT TO SECTION 13 OR 15(d) OF THE SECURITIES EXCHANGE ACT OF 1934 |
|---|
Commission File Number 1-7724

(Exact name of registrant as specified in its charter)
| Delaware | 39-0622040 | |
| (State of incorporation) | (I.R.S. Employer Identification No.) |
| 2801 80th Street, Kenosha, Wisconsin | 53143 | |
| (Address of principal executive offices) | (Zip code) |
(262) 656-5200
(Registrant’s telephone number, including area code)
Securities registered pursuant to Section 12(b) of the Act:
| Title of each class | Name of each exchange on which registered | |
| Common stock, $1.00 par value | New York Stock Exchange |
Securities registered pursuant to Section 12(g) of the Act: None
Indicate by check mark if the registrant is a well-known seasoned issuer, as defined in Rule 405 of the Securities Act. Yes x No ¨
Indicate by check mark if the registrant is not required to file reports pursuant to Section 13 or 15(d) of the Act. Yes ¨ No x
Indicate by check mark whether the registrant (1) has filed all reports required to be filed by Section 13 or 15(d) of the Securities Exchange Act of 1934 during the preceding 12 months (or for such shorter period that the registrant was required to file such reports), and (2) has been subject to such filing requirements for the past 90 days. Yes x No ¨
Indicate by check mark whether the registrant has submitted electronically and posted on its corporate Web site, if any, every Interactive Data File required to be submitted and posted pursuant to Rule 405 of Regulation S-T (§232.405 of this chapter) during the preceding 12 months (or for such shorter period that the registrant was required to submit and post such files). Yes x No ¨
Indicate by check mark if disclosure of delinquent filers pursuant to Item 405 of Regulation S-K (§229.405 of this chapter) is not contained herein, and will not be contained, to the best of registrant’s knowledge, in a definitive proxy or information statement incorporated by reference in Part III of this Form 10-K or any amendment to this Form 10-K. x
Indicate by check mark whether the registrant is a large accelerated filer, an accelerated filer, a non-accelerated filer, or a smaller reporting company. See the definitions of “large accelerated filer,” “accelerated filer” and “smaller reporting company” in Rule 12b-2 of the Exchange Act.
Large accelerated filer x Accelerated filer ¨ Non-accelerated filer ¨ Smaller reporting company ¨
Indicate by check mark whether the registrant is a shell company (as defined in Rule 12b-2 of the Exchange Act). Yes ¨ No x
The aggregate market value of voting and non-voting common equity held by non-affiliates (excludes 382,563 shares held by directors and executive officers) computed by reference to the price ($118.65) at which common equity was last sold as of the last business day of the registrant’s most recently completed second fiscal quarter (June 27, 2014) was $6.8 billion.
The number of shares of Common Stock ($1.00 par value) of the registrant outstanding as of February 6, 2015, was 58,124,176 shares.
DOCUMENTS INCORPORATED BY REFERENCE
Part III of this Annual Report on Form 10-K incorporates by reference certain information that will be set forth in Snap-on’s Proxy Statement, which is expected to first be mailed to shareholders on or about March 12, 2015, prepared for the Annual Meeting of Shareholders scheduled for April 30, 2015.
Table of Contents
TABLE OF CONTENTS
| 2 | SNAP-ON INCORPORATED |
Table of Contents
PART I
Safe Harbor
Statements in this document that are not historical facts, including statements that (i) are in the future tense; (ii) include the words “expects,” “plans,” “targets,” “estimates,” “believes,” “anticipates,” or similar words that reference Snap-on Incorporated (“Snap-on” or “the company”) or its management; (iii) are specifically identified as forward-looking; or (iv) describe Snap-on’s or management’s future outlook, plans, estimates, objectives or goals, are forward-looking statements within the meaning of the Private Securities Litigation Reform Act of 1995. Snap-on cautions the reader that any forward-looking statements included in this document that are based upon assumptions and estimates were developed by management in good faith and are subject to risks, uncertainties or other factors that could cause (and in some cases have caused) actual results to differ materially from those described in any such statement. Accordingly, forward-looking statements should not be relied upon as a prediction of actual results or regarded as a representation by the company or its management that the projected results will be achieved. For those forward-looking statements, Snap-on cautions the reader that numerous important factors, such as those listed below, as well as those factors discussed in this Annual Report on Form 10-K, particularly those in “Item 1A: Risk Factors,” could affect the company’s actual results and could cause its actual consolidated results to differ materially from those expressed in any forward-looking statement made by, or on behalf of, Snap-on.
These risks and uncertainties include, without limitation, uncertainties related to estimates, statements, assumptions and projections generally, and the timing and progress with which Snap-on can attain value through its Snap-on Value Creation Processes, including its ability to realize efficiencies and savings from its rapid continuous improvement and other cost reduction initiatives, improve workforce productivity, achieve improvements in the company’s manufacturing footprint and greater efficiencies in its supply chain, and enhance machine maintenance, plant productivity and manufacturing line set-up and change-over practices, any or all of which could result in production inefficiencies, higher costs and/or lost revenues. These risks also include uncertainties related to Snap-on’s capability to implement future strategies with respect to its existing businesses, its ability to refine its brand and franchise strategies, retain and attract franchisees, further enhance service and value to franchisees and thereby help improve their sales and profitability, introduce successful new products, successfully pursue, complete and integrate acquisitions, as well as its ability to withstand disruption arising from natural disasters, planned facility closures or other labor interruptions, the effects of external negative factors, including adverse developments in world financial markets, weakness in certain areas of the global economy, and significant changes in the current competitive environment, inflation, interest rates and other monetary and market fluctuations, changes in tax rates and regulations, and the impact of energy and raw material supply and pricing, including steel and gasoline, the amount, rate and growth of Snap-on’s general and administrative expenses, including health care and postretirement costs (resulting from, among other matters, U.S. health care legislation and its implementation), continuing and potentially increasing required contributions to pension and postretirement plans, the impacts of non-strategic business and/or product line rationalizations, and the effects on business as a result of new legislation, regulations or government-related developments or issues, risks associated with data security and technological systems and protections, and other world or local events outside Snap-on’s control, including terrorist disruptions. Snap-on disclaims any responsibility to update any forward-looking statement provided in this document, except as required by law.
In addition, investors should be aware that generally accepted accounting principles in the United States of America (“U.S. GAAP”) prescribe when a company should reserve for particular risks, including litigation exposures. Accordingly, results for a given reporting period could be significantly affected if and when a reserve is established for a major contingency. Reported results, therefore, may appear to be volatile in certain accounting periods.
Snap-on’s fiscal year ends on the Saturday that is on or nearest to December 31. Unless otherwise indicated, references in this document to “fiscal 2014” or “2014” refer to the fiscal year ended January 3, 2015; references to “fiscal 2013” or “2013” refer to the fiscal year ended December 28, 2013; and references to “fiscal 2012” or “2012” refer to the fiscal year ended December 29, 2012. Snap-on’s 2014 fiscal year contained 53 weeks of operating results, with the extra week occurring in the fourth quarter; Snap-on’s 2013 and 2012 fiscal years each contained 52 weeks of operating results. References in this document to 2014, 2013 and 2012 year end refer to January 3, 2015, December 28, 2013, and December 29, 2012, respectively.
| 2014 ANNUAL REPORT | 3 |
Table of Contents
Item 1. Business
Snap-on was incorporated under the laws of the state of Wisconsin in 1920 and reincorporated under the laws of the state of Delaware in 1930. Snap-on is a leading global innovator, manufacturer and marketer of tools, equipment, diagnostics, repair information and systems solutions for professional users performing critical tasks. Products and services include hand and power tools, tool storage, diagnostics software, information and management systems, shop equipment and other solutions for vehicle dealerships and repair centers, as well as for customers in industries, including aviation and aerospace, agriculture, construction, government and military, mining, natural resources, power generation and technical education. Snap-on also derives income from various financing programs designed to facilitate the sales of its products.
Snap-on markets its products and brands through multiple sales distribution channels in more than 130 countries. Snap-on’s largest geographic markets include the United States, the United Kingdom, Canada, Germany, Australia, Japan, France, Italy, Sweden, Spain, China, Brazil, the Netherlands, Saudi Arabia, Mexico, Argentina, Denmark, Norway, India, the Russian Federation, Finland and Indonesia. Snap-on reaches its customers through the company’s franchisee, company-direct, distributor and internet channels. Snap-on originated the mobile tool distribution channel in the automotive repair market.
The company began with the development of the original Snap-on interchangeable socket set in 1920 and subsequently pioneered mobile tool distribution in the automotive repair market, where fully stocked vans sell to professional vehicle technicians at their place of business. For many decades, the company was viewed primarily as a hand tool company selling through vans to vehicle technicians. Today, Snap-on defines its value proposition more broadly, extending its reach “beyond the garage” to deliver a broad array of unique solutions that make work easier for serious professionals performing critical tasks. Building upon capabilities already demonstrated in the automotive repair arena, the company’s “coherent growth” strategy focuses on developing and expanding its professional customer base in adjacent markets, additional geographies and other areas, including in critical industries, where the cost and penalties for failure can be high. In addition to its coherent growth strategy, Snap-on is committed to its “Value Creation Processes” – a set of strategic principles and processes designed to create value and employed in the areas of (i) safety; (ii) quality; (iii) customer connection; (iv) innovation; and (v) rapid continuous improvement (“RCI”).
Snap-on’s primary customer segments include: (i) commercial and industrial customers, including professionals in critical industries and emerging markets; (ii) professional vehicle repair technicians who purchase products through the company’s worldwide mobile tool distribution network; and (iii) other professional customers related to vehicle repair, including owners and managers of independent and original equipment manufacturer (“OEM”) dealership service and repair shops (“OEM dealerships”). Snap-on’s Financial Services customer segment includes: (i) franchisees’ customers and Snap-on’s industrial and other customers who require financing for the purchase or lease of tools and diagnostics and equipment products on an extended-term payment plan; and (ii) franchisees who require financing for business loans and vehicle leases.
Snap-on’s business segments are based on the organization structure used by management for making operating and investment decisions and for assessing performance. Snap-on’s reportable business segments are: (i) the Commercial & Industrial Group; (ii) the Snap-on Tools Group; (iii) the Repair Systems & Information Group; and (iv) Financial Services. The Commercial & Industrial Group consists of business operations serving a broad range of industrial and commercial customers worldwide, primarily through direct and distributor channels. The Snap-on Tools Group consists of business operations primarily serving vehicle service and repair technicians through the company’s worldwide mobile tool distribution channel. The Repair Systems & Information Group consists of business operations serving other professional vehicle repair customers worldwide, primarily owners and managers of independent repair shops and OEM dealerships, through direct and distributor channels. Financial Services consists of the business operations of Snap-on Credit LLC (“SOC”), the company’s financial services business in the United States, and Snap-on’s other financial services subsidiaries in those international markets where Snap-on has franchise operations. See Note 18 to the Consolidated Financial Statements for information on business segments and foreign operations.
Snap-on evaluates the performance of its operating segments based on segment revenues, including both external and intersegment net sales, and segment operating earnings. Snap-on accounts for intersegment sales and transfers based primarily on standard costs with reasonable mark-ups established between the segments. Identifiable assets by segment are those assets used in the respective reportable segment’s operations. Corporate assets consist of cash and cash equivalents (excluding cash held at Financial Services), deferred income taxes and certain other assets. All significant intersegment amounts are eliminated to arrive at Snap-on’s consolidated financial results.
On May 28, 2014, Snap-on acquired substantially all of the assets of Pro-Cut International, Inc. (“Pro-Cut”) for a cash purchase price of $41.3 million. Pro-Cut designs, manufactures and distributes on-car brake lathes, related equipment
| 4 | SNAP-ON INCORPORATED |
Table of Contents
and accessories used in brake servicing by automotive repair facilities. The acquisition of the Pro-Cut product line complemented and increased Snap-on’s existing undercar equipment product offering, broadened its established capabilities in serving vehicle repair facilities and expanded the company’s presence with repair shop owners and managers. For segment reporting purposes, the results of operations and assets of Pro-Cut have been included in the Repair Systems & Information Group since the date of acquisition. Pro forma financial information has not been presented as the net effects of the Pro-Cut acquisition were neither significant nor material to Snap-on’s results of operations or financial position.
On May 13, 2013, Snap-on acquired Challenger Lifts, Inc. (“Challenger”) for a cash purchase price of $38.2 million. Challenger designs, manufactures and distributes a comprehensive line of vehicle lifts and accessories to a diverse customer base in the automotive repair sector. The acquisition of the Challenger vehicle lift product line complemented and increased Snap-on’s existing undercar equipment product offering, broadened its established capabilities in serving vehicle repair facilities and expanded the company’s presence with repair shop owners and managers. For segment reporting purposes, the results of operations and assets of Challenger have been included in the Repair Systems & Information Group since the date of acquisition. Pro forma financial information has not been presented as the net effects of the Challenger acquisition were neither significant nor material to Snap-on’s results of operations or financial position.
Information Available on the Company’s Website
Additional information regarding Snap-on and its products is available on the company’s website at www.snapon.com. Snap-on is not including the information contained on its website as a part of, or incorporating it by reference into, this Annual Report on Form 10-K. Snap-on’s Annual Reports on Form 10-K, Quarterly Reports on Form 10-Q, Proxy Statements on Schedule 14A and Current Reports on Form 8-K, as well as any amendments to those reports, are made available to the public at no charge, other than an investor’s own internet access charges, through the Investor Information section of the company’s website at www.snapon.com. Snap-on makes such material available on its website as soon as reasonably practicable after it electronically files such material with, or furnishes it to, the Securities and Exchange Commission (“SEC”). Copies of any materials the company files with the SEC can also be obtained free of charge through the SEC’s website at www.sec.gov. The SEC’s Public Reference Room can be contacted at 100 F Street, N.E., Washington, D.C. 20549, or by calling 1-800-732-0330. In addition, Snap-on’s (i) charters for the Audit, Corporate Governance and Nominating, and Organization and Executive Compensation Committees of the company’s Board of Directors; (ii) Corporate Governance Guidelines; and (iii) Code of Business Conduct and Ethics are available on the company’s website. Snap-on will also post any amendments to these documents, or information about any waivers granted to directors or executive officers with respect to the Code of Business Conduct and Ethics, on the company’s website at www.snapon.com.
Products and Services
Tools, Diagnostics and Repair Information, and Equipment
Snap-on offers a broad line of products and complementary services that are grouped into three product categories: (i) tools; (ii) diagnostics and repair information; and (iii) equipment. Further product line information is not presented as it is not practicable to do so. The following table shows the consolidated net sales of these product categories for the last three years:
| Net Sales | ||||||||||||
| (Amounts in millions) | 2014 | 2013 | 2012 | |||||||||
| Product Category: | ||||||||||||
| Tools | $ | 1,868.5 | $ | 1,743.3 | $ | 1,729.4 | ||||||
| Diagnostics and repair information | 689.5 | 652.0 | 619.8 | |||||||||
| Equipment | 719.7 | 661.2 | 588.7 | |||||||||
| $ | 3,277.7 | $ | 3,056.5 | $ | 2,937.9 | |||||||
The tools product category includes hand tools, power tools and tool storage products. Hand tools include wrenches, sockets, ratchet wrenches, pliers, screwdrivers, punches and chisels, saws and cutting tools, pruning tools, torque measuring instruments and other similar products. Power tools include cordless (battery), pneumatic (air), hydraulic and corded (electric) tools, such as impact wrenches, ratchets, chisels, drills, sanders, grinders, polishers and similar products. Tool storage includes tool chests, roll cabinets, tool control systems and other similar products. The majority of products are manufactured by Snap-on and, in completing the product offering, other items are purchased from external manufacturers.
| 2014 ANNUAL REPORT | 5 |
Table of Contents
The diagnostics and repair information product category includes handheld and PC-based diagnostic products, service and repair information products, diagnostic software solutions, electronic parts catalogs, business management systems and services, point-of-sale systems, integrated systems for vehicle service shops, OEM purchasing facilitation services, and warranty management systems and analytics to help OEM dealerships manage and track performance.
The equipment product category includes solutions for the diagnosis and service of vehicles and industrial equipment. Products include wheel alignment equipment, wheel balancers, tire changers, vehicle lifts, test lane systems, collision repair equipment, air conditioning service equipment, brake service equipment, fluid exchange equipment, transmission troubleshooting equipment, safety testing equipment, battery chargers and hoists.
Snap-on supports the sale of its diagnostics and vehicle service shop equipment by offering training programs as well as after-sales support for its customers, primarily focusing on the technologies and the application of specific products developed and marketed by Snap-on.
Products are marketed under a number of brand names and trademarks, many of which are well known in the vehicle service and industrial markets served. Some of the major trade names and trademarks and the products and services with which they are associated include the following:
| Names | Products and Services | |
| Snap-on | Hand tools, power tools, tool storage products (including tool control software and hardware), diagnostics, certain equipment and related accessories, mobile tool stores, websites, electronic parts catalogs, warranty analytics solutions, business management systems and services, OEM specialty tools and equipment development and distribution, and OEM facilitation services | |
| ATI | Aircraft hand tools and machine tools | |
| BAHCO | Saw blades, cutting tools, pruning tools, hand tools, power tools and tool storage | |
| Blackhawk | Collision repair equipment | |
| Blue-Point | Hand tools, power tools, tool storage, diagnostics, certain equipment and related accessories | |
| Cartec | Safety testing, brake testers, test lane equipment, dynamometers, suspension testers, emission testers and other equipment | |
| CDI | Torque tools | |
| Challenger | Vehicle lifts | |
| Fish and Hook | Saw blades, cutting tools, pruning tools, hand tools, power tools and tool storage | |
| Hofmann | Wheel balancers, vehicle lifts, tire changers, wheel aligners, brake testers and test lane equipment | |
| Irimo | Saw blades, cutting tools, hand tools, power tools and tool storage | |
| John Bean | Wheel balancers, vehicle lifts, tire changers, wheel aligners, brake testers and test lane equipment | |
| Lindström | Hand tools | |
| Mitchell1 | Repair and service information, shop management systems and business services | |
| Nexiq | Diagnostic tools, information and program distributions for fleet and heavy duty equipment | |
| Pro-Cut | On-car brake lathes, related equipment and accessories | |
| Sandflex | Hacksaw blades, band saws, saw blades, hole saws and reciprocating saw blades | |
| ShopKey | Repair and service information, shop management systems and business services | |
| Sioux | Power tools | |
| Sun | Diagnostic tools, wheel balancers, vehicle lifts, tire changers, wheel aligners, air conditioning products and emission testers | |
| Williams | Hand tools, tool storage, certain equipment and related accessories |
| 6 | SNAP-ON INCORPORATED |
Table of Contents
Financial Services
Snap-on also generates revenue from various financing programs that include: (i) installment sales and lease contracts arising from franchisees’ customers and Snap-on’s industrial and other customers for the purchase or lease of tools, including tool storage, and diagnostic and equipment products on an extended-term payment plan; and (ii) business loans and vehicle leases to franchisees. The decision to finance through Snap-on or another financing entity is solely at the customer’s election. When assessing customers for potential financing, Snap-on considers various factors including financial condition, collateral, debt-servicing ability, past payment experience and credit bureau information.
United States
In the United States, Snap-on offers financing through SOC and provides financing for new contracts originated by SOC. Financing revenue from contract originations owned by SOC is recognized by SOC over the life of the contracts, with interest computed on the average daily balances of the underlying contracts.
International
Snap-on also offers financing to its franchisees and customer networks through its international finance subsidiaries located in Canada, the United Kingdom, Australia and New Zealand. Snap-on offers financing to its franchisees and customer networks in Ireland, the Netherlands and Germany through its U.K. finance subsidiary. Snap-on offers financing to its franchisees and customer network in Puerto Rico through SOC. Snap-on’s international finance subsidiaries own and service the receivables originated through their financing programs. Financing revenue from these contracts is recognized over the life of the contracts, with interest computed on the average daily balances of the underlying contracts.
Other
Franchise fee revenue, including nominal, non-refundable initial and ongoing monthly fees (primarily for sales and business training, and marketing and product promotion programs), is recognized as the fees are earned. Franchise fee revenue totaled $12.1 million, $11.9 million and $9.9 million in fiscal 2014, 2013 and 2012, respectively.
Sales and Distribution
Snap-on markets and distributes its products and related services principally to professional tool and equipment users around the world. The two largest market sectors are the vehicle service and repair sector and the industrial sector.
Vehicle Service and Repair Sector
The vehicle service and repair sector has three main customer groups: (i) professional technicians who purchase tools and diagnostic and equipment products for themselves; (ii) other professional customers related to vehicle repair, including owners and managers of independent repair shops and OEM dealerships who purchase tools and diagnostic and equipment products for use by multiple technicians within a service or repair facility; and (iii) OEMs.
Snap-on provides innovative tool, equipment and business solutions, as well as technical sales support and training, designed to meet technicians’ evolving needs. Snap-on’s mobile tool distribution system offers technicians the convenience of purchasing quality tools at their place of business with minimal disruption of their work routine. Snap-on also provides owners and managers of repair shops, where technicians work, with tools, diagnostic equipment, and repair and service information, including electronic parts catalogs and shop management products. Snap-on’s OEM facilitation business provides OEMs with products and services including tools, consulting and facilitation services, which include product procurement, distribution and administrative support to customers for their dealership equipment programs.
The vehicle service and repair sector is characterized by an increasing rate of technological change within motor vehicles, vehicle population growth and increasing vehicle life, and the resulting effects of these changes on the businesses of both our suppliers and customers. Snap-on believes it is a meaningful participant in the vehicle service and repair market sector.
Industrial Sector
Snap-on markets its products and services globally to a broad cross-section of commercial and industrial customers, including maintenance and repair operations; manufacturing and assembly facilities; various government agencies, facilities and operations, including military operations; vocational and technical schools; aviation and aerospace operations; OEM and service and repair customers; oil and gas developers; mining operations; energy and power
| 2014 ANNUAL REPORT | 7 |
Table of Contents
generation, equipment fabricators and operators; railroad manufacturing and maintenance; customers in agriculture; infrastructure construction companies; and other customers that require instrumentation, service tools and/or equipment for their product and business needs.
The industrial sector for Snap-on focuses on providing value-added products and services to an increasingly expanding global base of customers in critical industries, particularly those in the market segments of natural resources, aerospace, government and technical education. Through its experienced and dispersed sales organization, industrial “solutioneers” develop unique and highly valued productivity solutions for customers worldwide that leverage Snap-on’s product, service and development capabilities.
The industrial sector is characterized by a highly competitive, cost-conscious environment, and a trend toward customers making many of their tool and equipment purchases through one integrated supplier. Snap-on believes it is a meaningful participant in the industrial tools and equipment market sector.
Distribution Channels
Snap-on serves customers primarily through the following channels of distribution: (i) the mobile van channel; (ii) company direct sales; (iii) distributors; and (iv) e-commerce. The following discussion summarizes Snap-on’s general approach for each channel, and is not intended to be all-inclusive.
Mobile Van Channel
In the United States, a significant portion of sales to the vehicle service and repair sector is conducted through Snap-on’s mobile franchise van channel. Snap-on’s franchisees primarily serve vehicle repair technicians and vehicle service shop owners, generally providing weekly contact at the customer’s place of business. Franchisees’ sales are concentrated in hand and power tools, tool storage products, shop equipment, and diagnostic and repair information products, which can easily be transported in a van and demonstrated during a brief sales call. Franchisees purchase Snap-on’s products at a discount from suggested list prices and resell them at prices established by the franchisee. U.S. franchisees are provided a list of calls that serves as the basis of the franchisee’s sales route.
Snap-on also provides certain franchisees the opportunity to add vans to their franchise or to add a limited number of additional franchises. Snap-on charges nominal initial and ongoing monthly franchise fees. Since 1991, written franchise agreements have been entered into with all new U.S. franchisees.
Snap-on previously offered an option termed the “Gateway Franchise Program” to certain potential U.S. franchisees, including those that did not meet the standard franchise qualification requirements. Gateway Franchise Program participants had less upfront investment and were provided an initial base level of consigned inventory from Snap-on to assist them in gaining experience and building equity toward the future purchase of a standard franchise. Snap-on ceased offering new Gateway franchises in February 2013 and anticipates not having any remaining Gateway franchises by the end of February 2015. As of 2014 year end, five of Snap-on’s U.S. franchised routes were operated as Gateway franchises.
Snap-on also has a company-owned van program in the United States that is designed to: (i) provide another pool of potential franchisees and field organization personnel; (ii) service customers in select new and/or open routes not currently serviced by franchisees; and (iii) allow Snap-on to pilot new sales and promotional ideas prior to introducing them to franchisees. As of 2014 year end, company-owned vans comprised approximately 5% of the total U.S. van population; Snap-on may elect to increase or reduce the number of company-owned vans in the future.
In addition to its mobile van channel in the United States, Snap-on has replicated its U.S. franchise distribution model in certain other countries including Australia, Canada, Germany, Japan, the United Kingdom, the Netherlands, South Africa, New Zealand, Belgium and Ireland. In many of these markets, as in the United States, purchase decisions are generally made or influenced by professional vehicle service technicians as well as repair shop owners and managers. As of 2014 year end, Snap-on’s worldwide mobile van count was approximately 4,800 vans, including approximately 3,500 vans in the United States.
Through SOC, financing is available to U.S. franchisees, including financing for van leases, working capital loans and loans to help enable new franchisees to fund the purchase of the franchise. In many international markets, Snap-on offers a variety of financing options to its franchisees and/or customer networks through its international finance subsidiaries. The decision to finance through Snap-on or another financing entity is solely at the customer’s election.
| 8 | SNAP-ON INCORPORATED |
Table of Contents
Snap-on supports its franchisees with a field organization of regional offices, franchise performance teams, Diagnostic Sales Developers (“DSDs”), customer care centers and distribution centers. Snap-on also provides sales and business training, and marketing and product promotion programs, as well as customer and franchisee financing programs through SOC and the company’s international finance subsidiaries, all of which are designed to strengthen franchisee sales. In North America, the United States National Franchise Advisory Council and the Canadian National Franchise Advisory Council, both of which are composed primarily of franchisees that are elected by franchisees, assist Snap-on in identifying and implementing enhancements to the franchise program.
In the United States, franchisees work closely with DSDs. The DSDs train franchisees on the sale of higher-price-point diagnostics and demonstrate and sell vehicle service shop management and information systems. DSDs work independently and with franchisees to identify and generate sales among vehicle service technicians and repair shop owners and managers. DSDs are Snap-on employees who are compensated through a combination of base salary and commission; a franchisee receives a brokerage fee from certain sales made by the DSDs to the franchisee’s customers. Most products sold through franchisees and DSDs are sold under the Snap-on, Blue-Point and ShopKey brand names.
Company Direct Sales
A significant proportion of shop equipment sales in North America under the John Bean, Hofmann, Blackhawk, Challenger and Pro-Cut brands, diagnostic products under the Snap-on brand and information products under the Mitchell1 brand are made by direct and independent sales forces that have responsibility for national and other accounts. As the vehicle service and repair sector consolidates (with more business conducted by national chains and franchised service centers), Snap-on believes these larger organizations can be serviced most effectively by sales people who can demonstrate and sell the full line of diagnostic and equipment products and services. Snap-on also sells these products and services directly to OEMs and their franchised dealers.
Snap-on brand tools and equipment are marketed to industrial and governmental customers in the United States through both industrial sales representatives, who are employees, and independent industrial distributors. Outside of the United States, industrial sales are also conducted through other independent distributors. Sales representatives focus on industrial customers whose main purchase criteria are quality and integrated solutions. As of 2014 year end, Snap-on had industrial sales representatives in the United States (including Puerto Rico), Australia, Canada, Japan, Mexico and various European, Asian, Latin American, Middle Eastern and African countries, with the United States representing the majority of Snap-on’s total industrial sales.
Snap-on also sells software, services and solutions to the automotive, commercial, agriculture, power equipment and power sports segments. Products and services are marketed to targeted groups, including OEMs and their dealerships, fleets, and individual repair shops. To effectively reach OEMs, which frequently have a multi-national presence, Snap-on has deployed focused business teams globally.
Distributors
Sales of certain tools and equipment are made through independent distributors who purchase the items from Snap-on and resell them to end users. Hand tools under the BAHCO, Fish and Hook, Lindström and Williams brands and trade names, for example, are sold through distributors in Europe, North and South America, Asia and certain other parts of the world. Wheel service and other vehicle service equipment are sold through distributors primarily under brands including Hofmann, John Bean, Challenger, Pro-Cut, Cartec and Blackhawk. Diagnostic and equipment products are marketed through distributors in South America and Asia, and through both a direct sales force and distributors in Europe under the Snap-on, Sun, BAHCO and Blue-Point brands.
E-commerce
Snap-on’s e-commerce development initiatives allow Snap-on to combine the capabilities of the internet with Snap-on’s existing brand sales and distribution strengths to reach new and under-served customer segments. Snap-on offers current and prospective customers online, around-the-clock access to research and purchase products through its public internet website at www.snapon.com. The site features an online catalog of Snap-on hand tools, power tools, tool storage units and diagnostic equipment available to customers in the United States, the United Kingdom, Canada and Australia. E-commerce and certain other system enhancement initiatives are designed to improve productivity and further leverage the one-on-one relationships and service Snap-on has with its current and prospective customers. Sales through the company’s e-commerce distribution channel were not significant in any of the last three years.
| 2014 ANNUAL REPORT | 9 |
Table of Contents
Competition
Snap-on competes on the basis of its product quality and performance, product line breadth and depth, service, brand awareness and imagery, technological innovation and availability of financing (through SOC or its international finance subsidiaries). While Snap-on does not believe that any single company competes with it across all of its product lines and distribution channels, various companies compete in one or more product categories and/or distribution channels.
Snap-on believes it is a leading manufacturer and distributor of professional tools, tool storage, diagnostic and equipment products, and repair software and solutions, offering a broad line of these products to both vehicle service and industrial marketplaces. Various competitors target and sell to professional technicians in the vehicle service and repair sector through the mobile tool distribution channel; Snap-on also competes with companies that sell tools and equipment to vehicle service and repair technicians through retail stores and online, vehicle parts supply outlets, and tool supply warehouses/distributorships. Within the power tools category and the industrial sector, Snap-on has various other competitors, including companies with offerings that overlap with other areas discussed herein. Major competitors selling diagnostics, shop equipment and information to vehicle dealerships and independent repair shops include OEMs and their proprietary electronic parts catalogs, as well as diagnostics and information systems, and other companies that offer products serving this sector.
Raw Materials and Purchased Product
Snap-on’s supply of raw materials and purchased components are generally and readily available from numerous suppliers. Snap-on believes it has secured an ample supply of both bar and coil steel for the near future to ensure stable supply to meet material demands. The company does not currently anticipate experiencing any significant impact in 2015 from steel pricing or availability issues.
Patents, Trademarks and Other Intellectual Property
Snap-on vigorously pursues and relies on patent protection to protect its intellectual property and position in its markets. As of 2014 year end, Snap-on and its subsidiaries held approximately 700 active and pending patents in the United States and approximately 1,500 active and pending patents outside of the United States. Sales relating to any single patent did not represent a material portion of Snap-on’s revenues in any of the last three years.
Examples of products that have features or designs that benefit from patent protection include wheel alignment systems, wheel balancers, tire changers, vehicle lifts, test lanes, brake lathes, sealed ratchets, electronic torque instruments, ratcheting screwdrivers, emissions-sensing devices and diagnostic equipment.
Much of the technology used in the manufacture of vehicle service tools and equipment is in the public domain. Snap-on relies primarily on trade secret protection to protect proprietary processes used in manufacturing. Methods and processes are patented when appropriate. Copyright protection is also utilized when appropriate.
Trademarks used by Snap-on are of continuing importance to Snap-on in the marketplace. Trademarks have been registered in the United States and more than 120 other countries, and additional applications for trademark registrations are pending. Snap-on vigorously polices proper use of its trademarks. Snap-on’s right to manufacture and sell certain products is dependent upon licenses from others; however, these products under license do not represent a material portion of Snap-on’s net sales.
Domain names have become a valuable corporate asset for companies around the world, including Snap-on. Domain names often contain a trademark or service mark or even a corporate name and are often considered intellectual property. The recognition and value of the Snap-on name, trademark and domain name are core strengths of the company.
Snap-on strategically licenses the Snap-on brand to carefully selected manufacturing and distribution companies for items such as apparel, work boots, lighting and a variety of other goods, in order to further build equity and market presence for the company’s strongest brand.
| 10 | SNAP-ON INCORPORATED |
Table of Contents
Environmental
Snap-on is subject to various environmental laws, ordinances, regulations, and other requirements of government authorities in the United States and other nations. At Snap-on, these environmental liabilities are managed through the Snap-on Environmental, Health and Safety Management System (“EH & SMS”), which is applied worldwide. The system is based upon continual improvement and is certified to ISO 14001:2004 and OHSAS 18001:2007, verified through Det Norske Veritas (DNV) Certification, Inc.
Snap-on believes that it complies with applicable environmental control requirements in its operations. Expenditures on environmental matters through EH & SMS have not had, and Snap-on does not for the foreseeable future expect them to have, a material effect upon Snap-on’s capital expenditures, earnings or competitive position.
Employees
Snap-on employed approximately 11,400 people at the end of January 2015; Snap-on employed approximately 11,300 people at the end of January 2014.
Approximately 2,600 employees, or 23% of Snap-on’s worldwide workforce, are represented by unions and/or covered under collective bargaining agreements. The number of covered union employees whose contracts expire over the next five years approximates 1,250 employees in 2015; 400 employees in 2016; and 600 employees in 2017; there are no contracts currently scheduled to expire in 2018 or 2019. In recent years, Snap-on has not experienced any significant work slowdowns, stoppages or other labor disruptions.
There can be no assurance that these and other future contracts with Snap-on’s unions will be renegotiated upon terms acceptable to Snap-on.
Working Capital
Most of Snap-on’s businesses are not seasonal and their inventory needs are relatively constant. Snap-on did not have a significant backlog of orders at 2014 year end. In recent years, Snap-on has been using its working capital to fund, in part, the continued growth of the company’s financial services portfolio.
Snap-on’s liquidity and capital resources and use of working capital are discussed herein in “Part II, Item 7, Management’s Discussion and Analysis of Financial Condition and Results of Operations.”
As of 2014 year end, neither Snap-on nor any of its segments depend on any single customer, small group of customers or government for any material part of its revenues.
Item 1A. Risk Factors
In evaluating the company, careful consideration should be given to the following risk factors, in addition to the other information included in this Annual Report on Form 10-K, including the Consolidated Financial Statements and the related notes. Each of these risk factors could adversely affect the company’s business, operating results, cash flows and/or financial condition, as well as adversely affect the value of an investment in the company’s common stock.
Economic conditions and world events could affect our operating results.
We, our franchisees and our customers, may be adversely affected by changing economic conditions, including conditions that may particularly impact specific regions. These conditions may result in reduced consumer and investor confidence, instability in the credit and financial markets, volatile corporate profits, and reduced business and consumer spending. We, our franchisees and our customers, and the economy as a whole, also may be affected by future world or local events outside our control, such as acts of terrorism, developments in the war on terrorism, conflicts in international situations and natural disasters, as well as government-related developments or issues. These factors may affect our results of operations by reducing our sales, margins and/or net earnings as a result of a slowdown in customer orders or order cancellations, impact the availability of raw materials and/or the supply chain, and could potentially lead to future impairment of our intangible assets. In addition, political and social turmoil related to international conflicts and terrorist acts may put pressure on economic conditions abroad. Unstable political, social and economic conditions may make it difficult for our franchisees, customers, suppliers and us to accurately forecast and plan future business activities. If such conditions persist, our business, financial condition, results of operations and cash flows could be negatively affected.
| 2014 ANNUAL REPORT | 11 |
Table of Contents
Raw material and energy price fluctuations and shortages (including steel and various fuel sources) could adversely affect the ability to obtain needed manufacturing materials and could adversely affect our results of operations.
The principal raw material used in the manufacture of our products is steel, which we purchase in competitive, price-sensitive markets. To meet Snap-on’s high quality standards, our steel needs range from specialized alloys, which are available only from a limited group of approved suppliers, to commodity types of alloys. These raw materials have historically exhibited price and demand cyclicality. Some of these materials have been, and in the future may be, in short supply, particularly in the event of mill shutdowns or production cut backs. As some steel alloys require specialized manufacturing procedures, we could experience inventory shortages if we were required to use an alternative manufacturer on short notice. Additionally, unexpected price increases for raw materials could result in higher prices to our customers or an erosion of the margins on our products.
We believe our ability to sell our products is also dependent on the number of vehicles on the road, the number of miles driven and the general aging of vehicles. These factors affect the frequency, type and amount of service and repair performed on vehicles by technicians, and therefore affect the demand for the number of technicians, the prosperity of technicians and, consequently, the demand technicians have for our tools, other products and services, and the value technicians place on those products and services. To the extent that the prices of gasoline and other petroleum-based fuels increase, as they have at times in recent years, consumers may turn to other methods of transportation, including more frequent use of public transportation, which could result in a decrease in the use of privately operated vehicles. A decrease in the use of privately operated vehicles may lead to fewer repairs and less demand for our products.
We use various energy sources to transport, produce and distribute products, and some of our products have components that are petroleum based. Petroleum and energy prices have periodically increased significantly over short periods of time; further volatility and changes may be caused by market fluctuations, supply and demand, currency fluctuation, production and transportation disruption, world events and changes in governmental programs. Energy price increases raise both our operating costs and the costs of our materials, and we may not be able to increase our prices enough to offset these costs. Higher prices also may reduce the level of future customer orders and our profitability.
The performance of Snap-on’s mobile tool distribution business depends on the success of its franchisees.
Approximately 42% of our 2014 revenues were generated by the Snap-on Tools Group, which consists of Snap-on’s business operations serving the worldwide mobile tool distribution channel. Except in limited circumstances, each of our mobile tool vans is operated by a franchisee pursuant to a franchise agreement. Snap-on’s success is dependent on its relationships with franchisees, individually and collectively, as they are the primary sales and service link between the company and vehicle service and repair technicians, who are an important class of end users for Snap-on’s products and services. If our franchisees are not successful, or if we do not maintain an effective relationship with our franchisees, the delivery of products, the collection of receivables and/or our relationship with end users could be adversely affected and thereby negatively impact our business, financial condition, results of operations and cash flows.
In addition, if we are unable to maintain effective relationships with franchisees, Snap-on or the franchisees may choose to terminate the relationship, which may result in (i) open routes, in which end-user customers are not provided reliable service; (ii) litigation resulting from termination; (iii) reduced collections or increased write-offs of franchisee receivables owed to Snap-on; and/or (iv) reduced collections or increased write-offs of extended credit contracts.
New and stricter legislation and regulations may affect our business, reputation, results of operations and financial condition.
Increased legislative and regulatory activity and burdens, and a more stringent manner in which they are applied, could significantly impact our business and the economy as a whole. For example, the Affordable Care Act (the “ACA”), which was adopted in 2010 and is being phased in over several years, significantly affects the provision of both health care services and benefits in the United States; the ACA may impact our cost of providing our employees and retirees with health insurance and/or benefits, and may also impact various other aspects of our business. The ACA did not have a material impact on our fiscal 2014, 2013 or 2012 financial results; however, we are continuing to assess the impact of the ACA on our health care benefit costs.
Financial services businesses of all kinds are subject to increasing regulation and enforcement. In addition to potentially increasing the costs of doing business due to compliance obligations, new laws and regulations, or changes to existing
| 12 | SNAP-ON INCORPORATED |
Table of Contents
laws and regulations, as well as the enforcement thereof, may affect the relationships between creditors and debtors, inhibit the rights of creditors to collect amounts owed to them, expand liability for certain actions or inactions, or limit the types of financial products or services offered, any or all of which could have a material adverse effect on our financial condition, results of operations and cash flows. Failure to comply with any of these laws or regulations could also result in penalties and damage to our reputation, and/or the incurrence of remediation costs.
These developments, and other potential future legislation and regulations, as well as the increasingly strict regulatory environment, may also adversely affect the customers to which, and the markets into which, we sell our products, and increase our costs and otherwise negatively affect our business, reputation, results of operations and financial condition, including in ways that cannot yet be foreseen.
Exposure to credit risks of customers and resellers may make it difficult to collect receivables and could adversely affect operating results and financial condition.
A decline in industry and/or economic conditions could have the potential to weaken the financial position of some of our customers. If circumstances surrounding our customers’ ability to repay their credit obligations were to deteriorate and result in the write-down or write-off of such receivables, it would negatively affect our operating results for the period in which they occur and, if large, could have a material adverse effect on our business, financial condition, results of operations and cash flows.
Our inability to provide acceptable financing alternatives to end-user customers and franchisees could adversely impact our operating results.
An integral component of our business and profitability is our ability to offer competitive financing alternatives to end-user customers and franchisees. The lack of our ability to obtain capital resources or other financing to support our receivables on terms that we believe are attractive, whether resulting from the state of the financial markets, our own operating performance, or other factors, would negatively affect our operating results and financial condition. Adverse fluctuations in interest rates and/or our ability to provide competitive financing programs could also have an adverse impact on our revenue and profitability.
Failure to achieve expected investment returns on pension plan assets, as well as changes in interest rates or plan demographics, could adversely impact our results of operations, financial condition and cash flows.
Snap-on sponsors various defined benefit pension plans (the “pension plans”). The assets of the pension plans are broadly diversified in an attempt to mitigate the risk of a large loss. The assets are invested in equity securities, debt securities, hedge funds, real estate and other real assets, insurance contracts, and cash and cash equivalents. Required funding for the company’s domestic defined benefit pension plans is determined in accordance with guidelines set forth in the federal Employee Retirement Income Security Act (“ERISA”); foreign defined benefit pension plans are funded in accordance with local statutes or practice. Additional contributions to enhance the funded status of the pension plans can be made at the company’s discretion. However, there can be no assurance that the value of the pension plan assets, or the investment returns on those plan assets, will be sufficient to meet the future benefit obligations of such plans. In addition, during periods of adverse investment market conditions and declining interest rates, the company may be required to make additional cash contributions to the pension plans that could reduce our financial flexibility. Changes in plan demographics, including an increase in the number of retirements or changes in life expectancy assumptions, may also increase the costs and funding requirements of the obligations related to the company’s pension plans.
Our pension plan obligations are affected by changes in market interest rates. Significant fluctuations in market interest rates have added, and may further add, volatility to our pension plan obligations. In periods of declining market interest rates, our pension plan obligations generally increase; in periods of increasing market interest rates, our pension plan obligations generally decrease. While our plan assets are broadly diversified, there are inherent market risks associated with investments; if adverse market conditions occur, our plan assets could incur significant or material losses. Since we may need to make additional contributions to address changes in obligations and/or a loss in plan assets, the combination of declining market interest rates, past or future plan asset investment losses, and/or changes in plan demographics could adversely impact our results of operations, financial condition and cash flows.
The company’s pension plan expense is comprised of the following factors: (i) service cost; (ii) interest on projected benefit obligations; (iii) the expected return on plan assets; (iv) the amortization of prior service costs and credits; (v) the effects of actuarial gains and losses; and (vi) settlement/curtailment costs, when applicable. The accounting for pensions
| 2014 ANNUAL REPORT | 13 |
Table of Contents
involves the estimation of a number of factors that are highly uncertain. Certain factors, such as the interest on projected benefit obligations and the expected return on pension plan assets, are impacted by changes in market interest rates and the value of plan assets. A significant decrease in market interest rates and a decrease in the fair value of pension plan assets would increase net pension expense and may adversely affect the company’s future results of operations. See Note 11 to the Consolidated Financial Statements for further information on the company’s pension plans.
Adverse developments in the credit and financial markets could negatively impact the availability of credit that we and our customers need to operate our businesses.
We depend upon the availability of credit to operate our business, including the financing of receivables from end-user customers that are originated by our financial services businesses. Our end-user customers, franchisees and suppliers also require access to credit for their businesses. At times in recent years, world financial markets have been unstable and subject to uncertainty. Adverse developments in the credit and financial markets, or unfavorable changes in Snap-on’s credit rating, could negatively impact the availability of future financing and the terms on which it might be available to Snap-on, its end-user customers, franchisees and suppliers. Inability to access credit or capital markets, or a deterioration in the terms on which financing might be available, could have an adverse impact on our business, financial condition, results of operations and cash flows.
Increasing our financial leverage could affect our operations and profitability.
The maximum available credit under our multi-currency revolving credit facility is $700 million. The company’s leverage ratio may affect both our availability of additional capital resources as well as our operations in several ways, including:
| • | The terms on which credit may be available to us could be less attractive, both in the economic terms of the credit and the covenants stipulated by the credit terms; |
|---|
| • | The possible lack of availability of additional credit; |
|---|
| • | The potential for higher levels of interest expense to service or maintain our outstanding debt; |
|---|
| • | The possibility of additional borrowings in the future to repay our indebtedness when it comes due; and |
|---|
| • | The possible diversion of capital resources from other uses. |
|---|
While we believe we will have the ability to service our debt and obtain additional resources in the future if and when needed, that will depend upon our results of operations and financial position at the time, the then-current state of the credit and financial markets, and other factors that may be beyond our control. Therefore, we cannot give assurances that credit will be available on terms that we consider attractive, or at all, if and when necessary or beneficial to us.
Data security and information technology infrastructure and security are critical to supporting business objectives; failure of our systems to operate effectively could adversely affect our business and reputation.
We depend heavily on information technology infrastructure to achieve our business objectives and to protect sensitive information, and continually invest in improving such systems. Problems that impair or compromise this infrastructure, including due to natural disasters, security breaches or malicious attacks, or during system upgrades and/or new system implementations, could impede our ability to record or process orders, manufacture and ship in a timely manner, account for and collect receivables, protect sensitive data of the company, our customers, our suppliers and business partners, or otherwise carry on business in the normal course. Any such events, if significant, could cause us to lose customers and/or revenue and could require us to incur significant expense to remediate, including as a result of legal or regulatory claims or proceedings, and could also damage our reputation.
In association with initiatives to better integrate business units, rationalize operating footprint and improve responsiveness to franchisees and customers, Snap-on is continually replacing and enhancing its global Enterprise Resource Planning (ERP) management information systems. As we integrate, implement and deploy new information technology processes and a common information infrastructure across our global operations, we could experience disruptions in our business that could have an adverse effect on our business, financial condition, results of operations and cash flows.
Failure to maintain effective distribution of products and services could adversely impact revenue, gross margin and profitability.
| 14 | SNAP-ON INCORPORATED |
Table of Contents
We use a variety of distribution methods to sell our products and services. Successfully managing the interaction of our distribution efforts to reach various potential customer segments for our products and services is a complex process. Moreover, since each distribution method has distinct risks, costs and gross margins, our failure to implement the most advantageous balance in the delivery model for our products and services could adversely affect our revenue and gross margins and therefore our profitability.
Risks associated with the disruption of manufacturing operations could adversely affect profitability or competitive position.
We manufacture a significant portion of the products we sell. Any prolonged disruption in the operations of our existing manufacturing facilities, whether due to technical or labor difficulties, facility consolidation or closure actions, lack of raw material or component availability, destruction of or damage to any facility (as a result of natural disasters, use and storage of hazardous materials or other events), or other reasons, could have a material adverse effect on our business, financial condition, results of operations and cash flows.
The inability to continue to introduce new products that respond to customer needs and achieve market acceptance could result in lower revenues and reduced profitability.
Sales from new products represent a significant portion of our net sales and are expected to continue to represent a significant component of our future net sales. We may not be able to compete effectively unless we continue to enhance existing products or introduce new products to the marketplace in a timely manner. Product improvements and new product introductions require significant financial and other resources, including significant planning, design, development, and testing at the technological, product and manufacturing process levels. Our competitors’ new products may beat our products to market, be more effective with more features, be less expensive than our products, and/or render our products obsolete. Any new products that we develop may not receive market acceptance or otherwise generate any meaningful net sales or profits for us relative to our expectations based on, among other things, existing and anticipated investments in manufacturing capacity and commitments to fund advertising, marketing, promotional programs and research and development.
The global tool, equipment, and diagnostics and repair information industries are competitive.
We face strong competition in all of our market segments. Price competition in our various industries is intense and pricing pressures from competitors and customers are increasing. In general, as a manufacturer and marketer of premium products and services, the expectations of Snap-on’s customers and its franchisees are high and continue to increase. Any inability to maintain customer satisfaction could diminish Snap-on’s premium image and reputation and could result in a lessening of our ability to command premium pricing. We expect that the level of competition will remain high in the future, which could limit our ability to maintain or increase market share or profitability.
Product liability claims and litigation could affect our business, reputation, financial condition, results of operations and cash flows.
The products that we design and/or manufacture, and/or the services we provide, can lead to product liability claims or other legal claims being filed against us. To the extent that plaintiffs are successful in showing either that defects in the design or manufacture of our products led to personal injury or property damage, or that our provision of services resulted in similar injury or damage, we may be subject to claims for damages. Although we are insured for damages above a certain amount, we bear the costs and expenses associated with defending claims, including frivolous lawsuits, and are responsible for damages below the insurance retention amount. As a manufacturer, we can be subject to the costs and potential negative publicity of product recalls, which could impact our results.
The recognition of impairment charges on goodwill or other intangible assets would adversely impact our future financial condition and results of operations.
We have a substantial amount of goodwill and purchased intangible assets, almost all of which are booked in the Commercial & Industrial Group and in the Repair Systems & Information Group. We are required to perform impairment tests on our goodwill and other intangibles annually or at any time when events occur that could impact the value of our business segments. Our determination of whether impairment has occurred is based on a comparison of each of our reporting units’ fair market value with its carrying value. Significant and unanticipated changes in circumstances, such as significant and long-term adverse changes in business climate, adverse actions by regulators, unanticipated competition,
| 2014 ANNUAL REPORT | 15 |
Table of Contents
the loss of key customers, and/or changes in technology or markets, could require a provision for impairment in a future period that could substantially impact our reported earnings and reduce our consolidated net worth and shareholders’ equity. Should the economic environment in these markets deteriorate, our results of operations and financial position could be materially impacted, including as a result of the effects of potential impairment write-downs of goodwill and/or other intangible assets related to these businesses.
Failure to adequately protect intellectual property could adversely affect our business.
Intellectual property rights are an important and integral component of our business. We attempt to protect our intellectual property rights through a combination of patent, trademark, copyright and trade secret laws, as well as licensing agreements and third-party nondisclosure and assignment agreements. Adverse determinations in a judicial or administrative proceeding could prevent us from manufacturing and selling our products or prevent us from stopping others from manufacturing and selling competing products. Failure to obtain or maintain adequate protection of our intellectual property rights for any reason could have a material adverse effect on our business.
Foreign operations are subject to political, economic, currency exchange and other risks that could adversely affect our business, financial condition, results of operations and cash flows.
Approximately 34% of our revenues in 2014 were generated outside of the United States. Future growth rates and success of our business depends in large part on continued growth in our non-U.S. operations, including growth in emerging markets and critical industries. Numerous risks and uncertainties affect our non-U.S. operations. These risks and uncertainties include political, economic and social instability, such as acts of war, civil disturbance or acts of terrorism, local labor conditions, changes in government policies and regulations, including imposition or increases in withholding and other taxes on remittances and other payments by international subsidiaries, as well as the exposure to liabilities under anti-corruption laws in various countries, such as the U.S. Foreign Corrupt Practices Act, currency instability, transportation delays or interruptions, sovereign debt uncertainties and difficulties in enforcement of contract and intellectual property rights, as well as natural disasters. Should the economic environment in our non-U.S. markets deteriorate from current levels, our results of operations and financial position could be materially impacted, including as a result of the effects of potential impairment write-downs of goodwill and/or other intangible assets related to these businesses.
The reporting currency for Snap-on’s consolidated financial statements is the U.S. dollar. Certain of the company’s assets, liabilities, expenses and revenues are denominated in currencies other than the U.S. dollar. In preparing Snap-on’s Consolidated Financial Statements, those assets, liabilities, expenses and revenues are translated into U.S. dollars at applicable exchange rates. Increases or decreases in exchange rates between the U.S. dollar and other currencies affect the U.S. dollar value of those items, as reflected in the Consolidated Financial Statements. Substantial fluctuations in the value of the U.S. dollar could have a significant impact on the company’s financial condition and results of operations.
We are also affected by changes in inflation rates and interest rates. Additionally, cash generated in non-U.S. jurisdictions may be difficult to repatriate to the United States in a tax-efficient manner. Our foreign operations are also subject to other risks and challenges, such as the need to staff and manage diverse workforces, respond to the needs of multiple national and international marketplaces, and differing business climates and cultures in various countries.
| 16 | SNAP-ON INCORPORATED |
Table of Contents
Our operations expose us to the risk of environmental liabilities, costs, litigation and violations that could adversely affect our financial condition, results of operations and reputation.
Certain of our operations are subject to environmental laws and regulations in the jurisdictions in which they operate, which impose limitations on the discharge of pollutants into the ground, air and water and establish standards for the generation, treatment, use, storage and disposal of hazardous wastes. We must also comply with various health and safety regulations in the United States and abroad in connection with our operations. Failure to comply with any of these laws could result in civil and criminal, monetary and non-monetary penalties and damage to our reputation. In addition, we may incur costs related to remedial efforts or alleged environmental damage associated with past or current waste disposal practices. Legislation has been proposed, and governmental regulatory action has been both proposed and taken, that may significantly impact environmental compliance in the United States; these actions could increase our costs of production by raising the cost of energy as well as by further restricting emissions or other processes that we currently use in our operations. We cannot provide assurance that our costs of complying with current or future environmental protection and health and safety laws will not exceed our estimates.
Legal disputes could adversely affect our business, reputation, financial condition, results of operations and cash flows.
From time to time we are subject to legal disputes that are being litigated and/or settled in the ordinary course of business. Disputes or future lawsuits could result in the diversion of management’s time and attention away from business operations. Additionally, negative developments with respect to legal disputes and the costs incurred in defending ourselves could have an adverse impact on the company and its reputation. Adverse outcomes or settlements could also require us to pay damages, potentially in excess of amounts reserved, or incur liability for other remedies that could have a material adverse effect on our business, reputation, financial condition, results of operations and cash flows.
The inability to successfully defend claims from taxing authorities could adversely affect our financial condition, results of operations and cash flows.
We conduct business in many countries, which requires us to interpret the income tax laws and rulings in each of those taxing jurisdictions. Due to the subjectivity of tax laws between those jurisdictions, as well as the subjectivity of factual interpretations, our estimates of income tax liabilities may differ from actual payments or assessments. Claims from taxing authorities related to these differences could have an adverse impact on our financial condition, results of operations and cash flows.
Compliance with regulations related to conflict minerals could increase costs and affect the manufacturing and sale of our products.
Public companies are required to disclose the use of tin, tantalum, tungsten and gold (collectively, “conflict minerals”) mined from the Democratic Republic of the Congo and adjoining countries (the “covered countries”) if a conflict mineral(s) is necessary to the functionality of a product manufactured, or contracted to be manufactured, by the company.
We may determine, as part of our compliance efforts, that certain products or components we obtain from our suppliers contain conflict minerals. If we are unable to conclude that all our products are free from conflict minerals originating from covered countries, this could have a negative impact on our business, reputation and/or results of operations. We may also encounter challenges to satisfy customers who require that our products be certified as conflict free, which could place us at a competitive disadvantage if we are unable to substantiate such a claim. Compliance with these rules could also affect the sourcing and availability of some of the minerals used in the manufacture of products or components we obtain from our suppliers, including our ability to obtain products or components in sufficient quantities and/or at competitive prices.
| 2014 ANNUAL REPORT | 17 |
Table of Contents
The accounting for certain stock-based compensation awards and stock-based deferred compensation liabilities could adversely affect our results of operations.
Certain stock-based compensation awards granted by the company are subject to mark-to-market accounting treatment, which requires us to recognize changes in the fair value of these awards each period based on the company’s period-end stock price. Volatility in the company’s stock price, including as a result of macro-economic conditions and other factors beyond our control, could increase or decrease this expense in future periods. While we have entered into prepaid equity forward agreements to manage a portion of the market risk associated with stock-based deferred compensation liabilities, depending on changes in the company’s period-end stock price, the application of mark-to-market accounting on certain of our other stock-based compensation awards and stock-based deferred compensation liabilities could have an adverse effect, or favorable benefit, on our financial condition and results of operations in certain periods.
Failure to attract and retain qualified personnel could lead to a loss of revenue and/or profitability.
Snap-on’s success depends, in part, on the efforts and abilities of its senior management team and other key employees. Their skills, experience and industry contacts significantly benefit our operations and administration. The failure to attract and retain members of our senior management team and other key employees could have a negative effect on our operating results. In addition, transitions of important responsibilities to new individuals inherently include the possibility of disruptions to our business and operations, which could negatively affect our business, financial condition, results of operations and cash flows.
The steps taken to restructure operations, rationalize operating footprint, lower operating expenses and achieve greater efficiencies in the supply chain could disrupt business.
We have taken steps in the past, and expect to take additional steps in the future, intended to improve customer service and drive further efficiencies and reduce costs, some of which could be disruptive to our business. These actions, collectively across our operating groups, are focused on the following:
| • | Continuing to invest in initiatives focused on building a strong sales and operating presence in emerging growth markets; |
|---|
| • | Continuing to enhance service and value to our franchisees and customers; |
|---|
| • | Continuing to implement efficiency and productivity initiatives throughout the company to drive further efficiencies and reduce costs; |
|---|
| • | Continuing on the company’s existing path to improve and transform global manufacturing and the supply chain into a market-demand-based replenishment system with lower costs; |
|---|
| • | Continuing to invest in developing and marketing new, innovative, higher-value-added products and advanced technologies; |
|---|
| • | Extending our products and services into additional and/or adjacent markets or to new customers; and |
|---|
| • | Continuing to provide financing for, and grow our portfolio of, receivables within our financial services businesses. |
|---|
A failure to succeed in the implementation of any or all of these actions could result in an inability to achieve our financial goals and could be disruptive to the business.
In addition, any future reductions to headcount and other cost reduction measures may result in the loss of technical expertise and could adversely affect our research and development efforts as well as our ability to meet product development schedules. Efforts to reduce components of expense could result in the recording of charges for inventory and technology-related write-offs, workforce reduction costs or other charges relating to the consolidation or closure of facilities. If we were to incur a substantial charge to further these efforts, our earnings per share would be adversely affected in such period. If we are unable to effectively manage our cost reduction and restructuring efforts, our business, financial condition, results of operations and cash flows could be negatively affected.
| 18 | SNAP-ON INCORPORATED |
Table of Contents
We may not successfully integrate businesses we acquire, which could have an adverse impact on our business, financial condition, results of operations and cash flows.
The pursuit of growth through acquisitions, including participation in joint ventures, involves significant risks that could have a material adverse effect on our business, financial condition, results of operations and cash flows. These risks include:
| • | Loss of the acquired businesses’ customers; |
|---|
| • | Inability to integrate successfully the acquired businesses’ operations; |
|---|
| • | Inability to coordinate management and integrate and retain employees of the acquired businesses; |
|---|
| • | Difficulties in implementing and maintaining consistent standards, controls, procedures, policies and information systems; |
|---|
| • | Failure to realize anticipated synergies, economies of scale or other anticipated benefits, or to maintain operating margins; |
|---|
| • | Strain on our personnel, systems and resources, and diversion of attention from other priorities; |
|---|
| • | Incurrence of additional debt and related interest expense; |
|---|
| • | The dilutive effect of the issuance of additional equity securities; |
|---|
| • | Unforeseen or contingent liabilities of the acquired businesses; and |
|---|
| • | Large write-offs or write-downs, or the impairment of goodwill or other intangible assets. |
|---|
Item 1B. Unresolved Staff Comments
None.
Item 2. Properties
Snap-on maintains leased and owned manufacturing (including software products), warehouse, distribution, research and development and office facilities throughout the world. Snap-on believes that its facilities currently in use are suitable and have adequate capacity to meet its present and foreseeable future demand. Snap-on’s facilities in the United States occupy approximately 3.3 million square feet, of which 75% is owned, including its corporate and general office facility located in Kenosha, Wisconsin. Snap-on’s facilities outside the United States occupy approximately 3.8 million square feet, of which approximately 74% is owned. Certain Snap-on facilities are leased through operating and capital lease agreements. See Note 15 to the Consolidated Financial Statements for information on the company’s operating and capital leases. Snap-on management continually monitors the company’s capacity needs and makes adjustments as dictated by market and other conditions.
| 2014 ANNUAL REPORT | 19 |
Table of Contents
The following table provides information about our corporate headquarters and financial services operations, and each of Snap-on’s principal active manufacturing locations and distribution centers (exceeding 50,000 square feet) as of 2014 year end:
| Location | Principal Property Use | Owned/Leased | Segment* | |||
| U.S. Locations: | ||||||
| Elkmont, Alabama | Manufacturing | Owned | SOT | |||
| Conway, Arkansas | Manufacturing | Owned | RS&I | |||
| City of Industry, California | Manufacturing | Leased | C&I | |||
| Poway, California | Manufacturing and distribution | Leased | RS&I | |||
| San Jose, California | Manufacturing and distribution | Leased | RS&I | |||
| Columbus, Georgia | Distribution | Owned | C&I | |||
| Crystal Lake, Illinois | Distribution | Owned | SOT | |||
| Libertyville, Illinois | Financial services | Leased | FS | |||
| Algona, Iowa | Manufacturing and distribution | Owned | SOT | |||
| Louisville, Kentucky | Manufacturing and distribution | Leased | RS&I | |||
| Olive Branch, Mississippi | Distribution | Owned | SOT | |||
| Carson City, Nevada | Distribution | Owned and leased | SOT | |||
| Murphy, North Carolina | Manufacturing and distribution | Owned | C&I | |||
| Richfield, Ohio | Manufacturing and distribution | Owned | RS&I | |||
| Robesonia, Pennsylvania | Distribution | Owned | SOT | |||
| Elizabethton, Tennessee | Manufacturing | Owned | SOT | |||
| Kenosha, Wisconsin | Distribution and corporate | Owned | SOT, C&I, RS&I | |||
| Milwaukee, Wisconsin | Manufacturing | Owned | SOT | |||
| Non-U.S. Locations: | ||||||
| Santo Tome, Argentina | Manufacturing | Owned | C&I | |||
| New South Wales, Australia | Distribution and financial services | Leased | SOT, FS | |||
| Minsk, Belarus | Manufacturing | Owned | C&I | |||
| Santa Bárbara d’Oeste, Brazil | Manufacturing and distribution | Owned | RS&I | |||
| Calgary, Canada | Distribution | Leased | SOT | |||
| Mississauga, Canada | Manufacturing and distribution | Leased | SOT, RS&I | |||
| Kunshan, China | Manufacturing | Owned | C&I | |||
| Xiaoshan, China | Manufacturing | Owned | C&I | |||
| Bramley, England | Manufacturing | Leased | C&I | |||
| Kettering, England | Distribution and financial services | Owned | SOT, C&I, FS | |||
| Sopron, Hungary | Manufacturing | Owned | RS&I | |||
| Correggio, Italy | Manufacturing | Owned | RS&I | |||
| Tokyo, Japan | Distribution | Leased | C&I | |||
| Helmond, the Netherlands | Distribution | Owned | C&I | |||
| Vila do Conde, Portugal | Manufacturing | Owned | C&I | |||
| Irun, Spain | Manufacturing | Owned | C&I | |||
| Placencia, Spain | Manufacturing | Owned | C&I | |||
| Vitoria, Spain | Manufacturing and distribution | Owned | C&I | |||
| Bollnäs, Sweden | Manufacturing | Owned | C&I | |||
| Edsbyn, Sweden | Manufacturing | Owned | C&I | |||
| Lidköping, Sweden | Manufacturing | Owned | C&I |
| * | Segment abbreviations: |
|---|
C&I – Commercial & Industrial Group
SOT – Snap-on Tools Group
RS&I – Repair Systems & Information Group
FS – Financial Services
| 20 | SNAP-ON INCORPORATED |
Table of Contents
Item 3. Legal Proceedings
Snap-on is involved in various legal matters that are being litigated and/or settled in the ordinary course of business. Although it is not possible to predict the outcome of these legal matters, management believes that the results of these legal matters will not have a material impact on Snap-on’s consolidated financial position, results of operations or cash flows.
Item 4. Mine Safety Disclosures
Not applicable.
PART II
Item 5. Market for Registrant’s Common Equity, Related Stockholder Matters and Issuer Purchases of Equity Securities
Snap-on had 58,113,447 shares of common stock outstanding as of 2014 year end. Snap-on’s stock is listed on the New York Stock Exchange under the ticker symbol “SNA.” At February 6, 2015, there were 5,440 registered holders of Snap-on common stock.
The high and low closing prices of Snap-on’s common stock during each quarter for the last two years were as follows:
| Common Stock High/Low Prices | ||||||||||||||||
| 2014 | 2013 | |||||||||||||||
| Quarter | High | Low | High | Low | ||||||||||||
| First | $ | 114.18 | $ | 97.23 | $ | 82.70 | $ | 77.06 | ||||||||
| Second | 119.46 | 109.36 | 92.92 | 80.88 | ||||||||||||
| Third | 127.01 | 117.84 | 100.98 | 90.50 | ||||||||||||
| Fourth | 139.35 | 113.28 | 108.88 | 95.63 |
Snap-on has paid consecutive quarterly cash dividends, without interruption or reduction, since 1939. Quarterly dividends in 2014 were $0.53 per share in the fourth quarter and $0.44 per share in each of the first three quarters ($1.85 per share for the year). Quarterly dividends in 2013 were $0.44 per share in the fourth quarter and $0.38 per share in each of the first three quarters ($1.58 per share for the year). Quarterly dividends in 2012 were $0.38 per share in the fourth quarter and $0.34 per share in each of the first three quarters ($1.40 per share for the year). Cash dividends paid in 2014, 2013 and 2012 totaled $107.6 million, $92.0 million and $81.5 million, respectively. Snap-on’s Board of Directors (the “Board”) monitors and evaluates the company’s dividend practice quarterly and the Board may elect to increase, decrease or not pay a dividend on Snap-on common stock based upon the company’s financial condition, results of operations, cash requirements and future prospects of Snap-on and other factors deemed relevant by the Board.
See Note 13 to the Consolidated Financial Statements for information on securities authorized for issuance under equity compensation plans.
| 2014 ANNUAL REPORT | 21 |
Table of Contents
Issuer Purchases of Equity Securities
The following chart discloses information regarding the shares of Snap-on’s common stock repurchased by the company during the fourth quarter of fiscal 2014, all of which were purchased pursuant to the Board’s authorizations that the company has publicly announced. Snap-on has undertaken stock repurchases from time to time to offset dilution created by shares issued for employee and franchisee stock purchase plans, stock options and other corporate purposes, as well as to repurchase shares when the company believes market conditions are favorable. The repurchase of Snap-on common stock is at the company’s discretion, subject to prevailing financial and market conditions.
| Period | Shares purchased | Average price per share | Shares purchased as part of publicly announced plans or programs | Approximate value of shares that may yet be purchased under publicly announced plans or programs * | ||||
| 09/28/14 to 10/25/14 | 13,385 | $ 126.24 | 13,385 | $ 203.8 million | ||||
| 10/26/14 to 11/22/14 | 69,615 | $ 133.97 | 69,615 | $ 201.8 million | ||||
| 11/23/14 to 01/03/15 | 6,000 | $ 134.70 | 6,000 | $ 210.9 million | ||||
| Total/Average | 89,000 | $ 132.86 | 89,000 | N/A | ||||
N/A: Not applicable
| * | Subject to further adjustment pursuant to the 1996 Authorization described below, as of January 3, 2015, the approximate value of shares that may yet be purchased pursuant to the three outstanding Board authorizations discussed below is $210.9 million. |
|---|
| • | In 1996, the Board authorized the company to repurchase shares of the company’s common stock from time to time in the open market or in privately negotiated transactions (“the 1996 Authorization”). The 1996 Authorization allows the repurchase of up to the number of shares issued or delivered from treasury from time to time under the various plans the company has in place that call for the issuance of the company’s common stock. Because the number of shares that are purchased pursuant to the 1996 Authorization will change from time to time as (i) the company issues shares under its various plans; and (ii) shares are repurchased pursuant to this authorization, the number of shares authorized to be repurchased will vary from time to time. The 1996 Authorization will expire when terminated by the Board. When calculating the approximate value of shares that the company may yet purchase under the 1996 Authorization, the company assumed a price of $128.24, $135.72 and $136.29 per share of common stock as of the end of the fiscal 2014 months ended October 25, 2014, November 22, 2014, and January 3, 2015, respectively. |
|---|
| • | In 1998, the Board authorized the repurchase of an aggregate of $100 million of the company’s common stock (“the 1998 Authorization”). The 1998 Authorization will expire when the aggregate repurchase price limit is met, unless terminated earlier by the Board. |
|---|
| • | In 1999, the Board authorized the repurchase of an aggregate of $50 million of the company’s common stock (“the 1999 Authorization”). The 1999 Authorization will expire when the aggregate repurchase price limit is met, unless terminated earlier by the Board. |
|---|
| 22 | SNAP-ON INCORPORATED |
Table of Contents
Other Purchases or Sales of Equity Securities
The following chart discloses information regarding shares of Snap-on’s common stock that were sold by Citibank, N.A. (“Citibank”) during the fourth quarter of 2014 pursuant to a prepaid equity forward agreement (the “Agreement”) with Citibank that is intended to reduce the impact of market risk associated with the stock-based portion of the company’s deferred compensation plans. The company’s stock-based deferred compensation liabilities, which are impacted by changes in the company’s stock price, increase as the company’s stock price rises and decrease as the company’s stock price declines. Pursuant to the Agreement, Citibank may purchase or sell shares of the company’s common stock (for Citibank’s account) in the market or in privately negotiated transactions. The Agreement has no stated expiration date and does not provide for Snap-on to purchase or repurchase its shares.
Citibank Sales of Snap-on Stock
| Period | Shares sold | Average price per share | ||||||
| 09/28/14 to 10/25/14 | 2,000 | $ | 126.87 | |||||
| 10/26/14 to 11/22/14 | 4,000 | $ | 130.29 | |||||
| 11/23/14 to 01/03/15 | – | – | ||||||
| Total/Average | 6,000 | $ | 129.15 | |||||
| 2014 ANNUAL REPORT | 23 |
Table of Contents
Five-year Stock Performance Graph
The graph below illustrates the cumulative total shareholder return on Snap-on common stock since December 31, 2009, assuming that dividends were reinvested. The graph compares Snap-on’s performance to that of the Standard & Poor’s 500 Stock Index (“S&P 500”) and a Peer Group.
Snap-on Incorporated Total Shareholder Return (1)
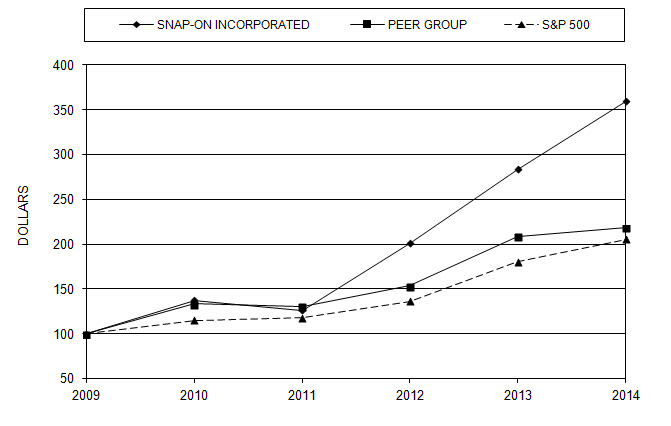
| Fiscal Year Ended (2) | Snap-on Incorporated | Peer Group (3) | S&P 500 | |||||||||
| December 31, 2009 | $ | 100.00 | $ | 100.00 | $ | 100.00 | ||||||
| December 31, 2010 | 137.56 | 133.17 | 115.06 | |||||||||
| December 31, 2011 | 126.03 | 130.40 | 117.49 | |||||||||
| December 31, 2012 | 200.91 | 153.34 | 136.30 | |||||||||
| December 31, 2013 | 283.41 | 208.84 | 180.44 | |||||||||
| December 31, 2014 | 359.27 | 218.47 | 205.14 |
| (1) | Assumes $100 was invested on December 31, 2009, and that dividends were reinvested quarterly. |
|---|
| (2) | The company’s fiscal year ends on the Saturday that is on or nearest to December 31 of each year; for ease of calculation, the fiscal year end is assumed to be December 31. |
|---|
| (3) | The Peer Group consists of: Stanley Black & Decker, Inc., Danaher Corporation, Emerson Electric Co., Genuine Parts Company, Newell Rubbermaid Inc., Pentair plc, SPX Corporation and W.W. Grainger, Inc. |
|---|
| 24 | SNAP-ON INCORPORATED |
Table of Contents
Item 6. Selected Financial Data
The selected financial data presented below has been derived from, and should be read in conjunction with, the respective historical consolidated financial statements of the company, including the notes thereto, and “Part II, Item 7, Management’s Discussion and Analysis of Financial Condition and Results of Operations.”
| Five-year Data | ||||||||||||||||||||
| (Amounts in millions, except per share data) | 2014 | 2013 | 2012 | 2011 | 2010 | |||||||||||||||
| Results of Operations | ||||||||||||||||||||
| Net sales | $ | 3,277.7 | $ | 3,056.5 | $ | 2,937.9 | $ | 2,854.2 | $ | 2,619.2 | ||||||||||
| Gross profit | 1,584.3 | 1,472.9 | 1,390.0 | 1,337.9 | 1,211.1 | |||||||||||||||
| Operating expenses | 1,048.7 | 1,012.4 | 980.3 | 953.7 | 894.1 | |||||||||||||||
| Operating earnings before financial services | 535.6 | 460.5 | 409.7 | 384.2 | 317.0 | |||||||||||||||
| Financial services revenue | 214.9 | 181.0 | 161.3 | 124.3 | 62.3 | |||||||||||||||
| Financial services expenses | 65.8 | 55.3 | 54.6 | 51.4 | 47.9 | |||||||||||||||
| Financial services – arbitration settlement gain | – | – | – | 18.0 | – | |||||||||||||||
| Operating earnings from financial services | 149.1 | 125.7 | 106.7 | 90.9 | 14.4 | |||||||||||||||
| Operating earnings | 684.7 | 586.2 | 516.4 | 475.1 | 331.4 | |||||||||||||||
| Interest expense | 52.9 | 56.1 | 55.8 | 61.2 | 54.8 | |||||||||||||||
| Earnings before income taxes and equity earnings | 630.9 | 526.2 | 460.2 | 412.9 | 277.4 | |||||||||||||||
| Income tax expense | 199.5 | 166.7 | 148.2 | 133.7 | 87.6 | |||||||||||||||
| Earnings before equity earnings | 431.4 | 359.5 | 312.0 | 279.2 | 189.8 | |||||||||||||||
| Equity earnings, net of tax | 0.7 | 0.2 | 2.6 | 4.6 | 3.2 | |||||||||||||||
| Net earnings | 432.1 | 359.7 | 314.6 | 283.8 | 193.0 | |||||||||||||||
| Net earnings attributable to noncontrolling interests | (10.2) | (9.4) | (8.5) | (7.5) | (6.5) | |||||||||||||||
| Net earnings attributable to Snap-on | 421.9 | 350.3 | 306.1 | 276.3 | 186.5 | |||||||||||||||
| Financial Position | ||||||||||||||||||||
| Cash and cash equivalents | $ | 132.9 | $ | 217.6 | $ | 214.5 | $ | 185.6 | $ | 572.2 | ||||||||||
| Trade and other accounts receivable – net | 550.8 | 531.6 | 497.9 | 463.5 | 443.3 | |||||||||||||||
| Finance receivables – net (current) | 402.4 | 374.6 | 323.1 | 277.2 | 215.3 | |||||||||||||||
| Contract receivables – net (current) | 74.5 | 68.4 | 62.7 | 49.7 | 45.6 | |||||||||||||||
| Inventories – net | 475.5 | 434.4 | 404.2 | 386.4 | 329.4 | |||||||||||||||
| Property and equipment – net | 404.5 | 392.5 | 375.2 | 352.9 | 344.0 | |||||||||||||||
| Long-term finance receivables – net | 650.5 | 560.6 | 494.6 | 431.8 | 345.7 | |||||||||||||||
| Long-term contract receivables – net | 242.0 | 217.1 | 194.4 | 165.1 | 119.3 | |||||||||||||||
| Total assets | 4,310.1 | 4,110.0 | 3,902.3 | 3,672.9 | 3,729.4 | |||||||||||||||
| Notes payable and current maturities of long-term debt | 56.6 | 113.1 | 5.2 | 16.2 | 216.0 | |||||||||||||||
| Accounts payable | 145.0 | 155.6 | 142.5 | 124.6 | 146.1 | |||||||||||||||
| Long-term debt | 862.7 | 858.9 | 970.4 | 967.9 | 954.8 | |||||||||||||||
| Total debt | 919.3 | 972.0 | 975.6 | 984.1 | 1,170.8 | |||||||||||||||
| Total shareholders’ equity attributable to Snap-on | 2,207.8 | 2,113.2 | 1,802.1 | 1,530.9 | 1,388.5 | |||||||||||||||
| Common Share Summary | ||||||||||||||||||||
| Weighted-average shares outstanding – diluted | 59.1 | 59.1 | 58.9 | 58.7 | 58.4 | |||||||||||||||
| Net earnings per share attributable to Snap-on | ||||||||||||||||||||
| Basic | $ | 7.26 | $ | 6.02 | $ | 5.26 | $ | 4.75 | $ | 3.22 | ||||||||||
| Diluted | 7.14 | 5.93 | 5.20 | 4.71 | 3.19 | |||||||||||||||
| Cash dividends paid per share | 1.85 | 1.58 | 1.40 | 1.30 | 1.22 | |||||||||||||||
| Shareholders’ equity per basic share | 38.00 | 36.31 | 30.96 | 26.30 | 23.94 |
| • | In 2011, Snap-on settled a dispute with its former financial services joint venture partner and recorded an $18.0 million pretax arbitration settlement gain ($11.1 million after tax or $0.19 per diluted share). |
|---|
| 2014 ANNUAL REPORT | 25 |
Table of Contents
Management’s Discussion and Analysis of Financial Condition and Results of Operations
Item 7. Management’s Discussion and Analysis of Financial Condition and Results of Operations
Management Overview
We believe our broad-based organic sales growth in 2014 affirms Snap-on’s unique capabilities in providing repeatability and reliability to a wide range of professional customers performing critical tasks in workplaces of consequence. Leveraging capabilities already demonstrated in the automotive repair arena, our “coherent growth” strategy focuses on developing and expanding our professional customer base, not only in automotive repair, but in adjacent markets, additional geographies and other areas, including in critical industries, where the cost and penalties for failure can be high.
We believe our 2014 operating results also provide continued evidence that Snap-on’s value proposition of making work easier for serious professionals in workplaces of consequence is an ongoing strength as we move forward along our runways for coherent growth: enhancing the franchise network, expanding in the vehicle repair garage, extending to critical industries and building in emerging markets. We also believe our year-over-year improvement in operating margin further evidences the potential of our Snap-on Value Creation Processes – our suite of strategic principles and processes we employ every day designed to create value and employed in the areas of safety, quality, customer connection, innovation and rapid continuous improvement.
In 2014, we continued to invest in our most important strategic growth initiatives aimed at enhancing the franchisee network, expanding in the vehicle repair garage, extending in critical industries and building in emerging markets. Recent examples of our continued investment and expansion initiatives include the May 2014 acquisition of Pro-Cut International, Inc. (“Pro-Cut”) and the May 2013 acquisition of Challenger Lifts, Inc. (“Challenger”), which are further discussed in “Results of Operations” below. The acquisitions of both the Pro-Cut and Challenger product lines complemented and increased our existing undercar equipment product offering, broadened our established capabilities in serving vehicle repair facilities and expanded our presence with repair shop owners and managers.
Our global financial services operations continue to serve a significant strategic role in providing financing options for our franchisees, for their customers, and for customers in other parts of our business. We expect that our global financial services business, which includes both Snap-on Credit LLC (“SOC”) in the United States and our other international finance subsidiaries, will continue to be a meaningful contributor to our operating earnings.
Consolidated net sales of $3,277.7 million in 2014 increased $221.2 million, or 7.2%, from 2013 levels, including $37.0 million of acquisition-related sales and an unfavorable $25.3 million impact from foreign currency translation. Organic sales (excluding acquisition-related sales and foreign currency translation impacts) increased $209.5 million or 6.9%. Operating earnings before financial services of $535.6 million in 2014 were up $75.1 million, or 16.3%, from 2013 levels, reflecting contributions from higher sales and improved operating margins, including contributions from ongoing efficiency and productivity initiatives, as well as benefits from restructuring actions (collectively, “Rapid Continuous Improvement” or “RCI initiatives”). Operating earnings of $684.7 million in 2014 increased $98.5 million, or 16.8%, from operating earnings of $586.2 million last year. In 2014, net earnings attributable to Snap-on Incorporated were $421.9 million or $7.14 per diluted share. Net earnings attributable to Snap-on Incorporated in 2013 were $350.3 million or $5.93 per diluted share.
In the Commercial & Industrial Group, segment net sales of $1,174.8 million in 2014 increased $83.8 million, or 7.7%, from 2013 levels. Excluding $18.2 million of unfavorable foreign currency translation, organic sales in 2014 increased $102.0 million, or 9.5%, primarily due to higher sales to customers in critical industries and in the segment’s European-based hand tools business. Operating earnings of $158.6 million in 2014 increased $21.3 million, or 15.5%, from 2013 levels primarily as a result of the higher sales and the savings from RCI initiatives.
| 26 | SNAP-ON INCORPORATED |
Table of Contents
The Commercial & Industrial Group intends to continue building on the following strategic priorities in 2015:
| • | Investing in emerging market growth initiatives, including in China, India, Eastern Europe, the Middle East and Latin America; |
|---|
| • | Expanding our business with existing customers and reach new customers in critical industries and other market segments; |
|---|
| • | Broadening our product offering and engineered solutions designed particularly for critical industry segments; |
|---|
| • | Increasing our customer-connection-driven understanding of work across multiple industries; |
|---|
| • | Investing in innovation that, guided by that understanding of work, delivers an ongoing stream of productivity-enhancing solutions; and |
|---|
| • | Continuing to reduce structural and operating costs through RCI and restructuring initiatives. |
|---|
In the Snap-on Tools Group, segment net sales of $1,455.2 million in 2014 increased $96.8 million, or 7.1%, from 2013 levels; excluding $6.3 million of unfavorable foreign currency translation, organic sales in 2014 increased $103.1 million, or 7.6%, reflecting higher sales in both the company’s U.S. and international franchise operations. Operating earnings of $223.1 million in 2014 increased $28.5 million, or 14.6%, from 2013 levels, primarily as a result of the higher sales and savings from RCI initiatives.
The Snap-on Tools Group made continued progress in 2014 on its fundamental, strategic initiatives to strengthen the group and enhance franchisee profitability. In 2015, the Snap-on Tools Group intends to further build on the progress made in 2014, with specific initiatives focused on the following:
| • | Continuing to improve franchisee productivity, profitability, satisfaction and commercial health; |
|---|
| • | Developing new programs and products to expand market coverage, reaching new technicians and increasing penetration with existing customers; |
|---|
| • | Continuing to invest in new product innovation and development; and |
|---|
| • | Increasing operational flexibility in back office support functions, manufacturing and the supply chain through RCI initiatives and investment. |
|---|
By focusing on these areas, we believe that Snap-on, as well as our franchisees, will have the opportunity to continue to serve customers more effectively, more profitably and with improved satisfaction.
In the Repair Systems & Information Group, segment net sales of $1,095.2 million in 2014 increased $85.6 million, or 8.5%, from 2013 levels. Excluding $37.0 million of acquisition-related sales and $0.5 million of unfavorable foreign currency translation, organic sales increased $49.1 million or 4.9%. The organic sales increase primarily reflects higher sales to original equipment manufacturer (“OEM”) dealership service and repair shops (“OEM dealerships”), as well as increased sales to independent repair shop owners and managers, including higher sales of diagnostic and repair information products and increased sales of undercar equipment. Operating earnings of $251.2 million in 2014 increased $19.3 million, or 8.3%, from 2013 levels, primarily due to higher sales, including acquisition-related sales, and savings from RCI initiatives.
The Repair Systems & Information Group intends
Showing the first 8K of 132K characters. Open the full section
Item 7A. Quantitative and Qualitative Disclosures About Market Risk
Market, Credit and Economic Risks
Market risk is the potential economic loss that may result from adverse changes in the fair value of financial instruments. Snap-on is exposed to market risk from changes in foreign currency exchange rates and interest rates. Snap-on is also exposed to market risk associated with the stock-based portion of its deferred compensation plans. Snap-on monitors its exposure to these risks and attempts to manage the underlying economic exposures through the use of financial instruments such as foreign currency forward contracts, interest rate swap agreements, treasury lock agreements and prepaid equity forward agreements (“equity forwards”). Snap-on does not use derivative instruments for speculative or trading purposes. Snap-on’s broad-based business activities help to reduce the impact that volatility in any particular area or related areas may have on its operating earnings as a whole. Snap-on’s management takes an active role in the risk management process and has developed policies and procedures that require specific administrative and business functions to assist in the identification, assessment and control of various risks.
Foreign Currency Risk Management
Snap-on has significant international operations and is subject to certain risks inherent with foreign operations that include currency fluctuations. Foreign exchange risk exists to the extent that Snap-on has payment obligations or receipts denominated in currencies other than the functional currency, including intercompany loans denominated in foreign currencies. To manage these exposures, Snap-on identifies naturally offsetting positions and then purchases hedging instruments to protect the residual net exposures. See Note 10 to the Consolidated Financial Statements for information on foreign currency risk management.
Interest Rate Risk Management
Snap-on aims to control funding costs by managing the exposure created by the differing maturities and interest rate structures of Snap-on’s borrowings through the use of interest rate swap agreements. Treasury lock agreements are used from time to time to manage potential changes in interest rates in anticipation of the issuance or sale of certain financial instruments. See Note 10 to the Consolidated Financial Statements for information on interest rate risk management.
Snap-on utilizes a Value-at-Risk (“VAR”) model to determine the potential one-day loss in the fair value of its interest rate and foreign exchange-sensitive financial instruments from adverse changes in market factors. The VAR model estimates were made assuming normal market conditions and a 95% confidence level. Snap-on’s computations are based on the inter-relationships among movements in various currencies and interest rates (variance/co-variance technique). These inter-relationships were determined by observing interest rate and foreign currency market changes over the preceding quarter.
The estimated maximum potential one-day loss in fair value, calculated using the VAR model, as of 2014 and 2013 year end was $1.2 million and $1.0 million, respectively, on interest rate-sensitive financial instruments, and $0.4 million and $0.5 million, respectively, on foreign currency-sensitive financial instruments. The VAR model is a risk management tool and does not purport to represent actual losses in fair value that will be incurred by Snap-on, nor does it consider the potential effect of favorable changes in market factors.
Stock-based Deferred Compensation Risk Management
Snap-on aims to manage market risk associated with the stock-based portion of its deferred compensation plans through the use of equity forwards. Equity forwards are used to aid in offsetting the potential mark-to-market effect on stock-based deferred compensation from changes in Snap-on’s stock price. Since stock-based deferred compensation liabilities increase as the company’s stock price rises and decrease as the company’s stock price declines, the equity forwards are intended to mitigate the potential impact on compensation expense that may result from such mark-to-market changes. See Note 10 to the Consolidated Financial Statements for additional information on stock-based deferred compensation risk management.
| 2014 ANNUAL REPORT | 53 |
Table of Contents
Credit Risk
Credit risk is the possibility of loss from a customer’s failure to make payments according to contract terms. Prior to extending credit, each customer is evaluated, taking into consideration the customer’s financial condition, collateral, debt-servicing ability, past payment experience, credit bureau information, and other financial and qualitative factors that may affect the customer’s ability to repay. Credit risk is also monitored regularly through the use of internal proprietary, custom scoring models used to evaluate each transaction at the time of the application for credit and by periodically updating those credit scores for ongoing monitoring purposes. Snap-on evaluates credit quality through the use of an internal proprietary measuring system that provides a framework to analyze finance and contract receivables on the basis of risk factors of the individual obligor as well as transaction specific risk. The finance and contract receivables are typically monitored through an asset quality review process that closely monitors past due accounts and initiates a progressive collection action process when appropriate.
Counterparty Risk
Snap-on is exposed to credit losses in the event of non-performance by the counterparties to its various financial agreements, including its foreign currency forward contracts, interest rate swap agreements and prepaid equity forward agreements. Snap-on does not obtain collateral or other security to support financial instruments subject to credit risk, but monitors the credit standing of the counterparties and generally enters into agreements with financial institution counterparties with a credit rating of A- or better. Snap-on does not anticipate non-performance by its counterparties, but cannot provide assurances.
Economic Risk
Economic risk is the possibility of loss resulting from economic instability in certain areas of the world. Snap-on continually monitors its exposure in these markets. Inflation has not had a significant impact on the company.
As a result of the above market, credit and economic risks, net earnings and revenues in any particular period may not be representative of full-year results and may vary significantly from year to year.
Commodity Risk
Snap-on is a purchaser of certain commodities such as steel, natural gas and electricity. The company is also a purchaser of components and parts that are integrated into the company’s end products, as well as the purchaser of certain finished goods, all of which may contain various commodities including steel, aluminum and others. Snap-on’s supply of raw materials and purchased components are generally and readily available from numerous suppliers.
The principal raw material used in the manufacture of the company’s products is steel, which the company purchases in competitive, price-sensitive markets. To meet Snap-on’s high quality standards, the company’s steel needs range from specialized alloys, which are available only from a limited group of approved suppliers, to commodity types of alloys. These raw materials have historically exhibited price and demand cyclicality. Some of these materials have been, and in the future may be, in short supply, particularly in the event of a general economic recovery, mill shutdowns or production cut backs. As some steel alloys require specialized manufacturing procedures, Snap-on could experience inventory shortages if it were required to use an alternative manufacturer on short notice. Additionally, unexpected price increases for raw materials could result in higher prices to Snap-on’s customers or an erosion of the margins on its products.
Snap-on believes its ability to sell product is also dependent on the number of vehicles on the road, the number of miles driven and the general aging of vehicles. These factors affect the frequency, type and amount of service and repair performed on vehicles by technicians, and therefore affect the demand for the number of technicians, the prosperity of the technicians and, subsequently, the demand technicians have for the company’s tools, other products and services, and the value technicians place on those products and services. To the extent that the prices of gasoline and other petroleum-based fuels increase, as they have at times in recent years, consumers may turn to other methods of transportation, including more frequent use of public transportation, which could result in a decrease in the use of privately operated vehicles. A decrease in the use of privately operated vehicles may lead to fewer repairs and less demand for the company’s products.
To the extent that commodity prices increase and the company does not have firm pricing agreements with its suppliers, the company may experience margin declines to the extent that it is not able to increase the selling prices of its products.
| 54 | SNAP-ON INCORPORATED |
Table of Contents
Item 8. Financial Statements and Supplementary Data
The financial statements and schedules are listed on page 59 and are incorporated by reference into this Item 8.
Item 9. Changes in and Disagreements With Accountants on Accounting and Financial Disclosure
None.
Item 9A. Controls and Procedures
Evaluation of Disclosure Controls and Procedures
Snap-on maintains a system of disclosure controls and procedures that is designed to provide reasonable assurance that material information relating to the company and its consolidated subsidiaries is timely communicated to the officers who certify Snap-on’s financial reports and to other members of senior management and the Board, as appropriate.
In accordance with Rule 13a-15(b) of the Securities Exchange Act of 1934 (the “Exchange Act”), the company’s management evaluated, with the participation of the Chief Executive Officer and Chief Financial Officer, the effectiveness of the design and operation of the company’s disclosure controls and procedures (as defined in Rules 13a-15(e) and 15d-15(e) under the Exchange Act) as of January 3, 2015. Based upon their evaluation of these disclosure controls and procedures, the Chief Executive Officer and Chief Financial Officer concluded that the disclosure controls and procedures were effective as of January 3, 2015, to ensure that information required to be disclosed by the company in the reports it files or submits under the Exchange Act is recorded, processed, summarized and reported, within the time period specified in the Securities and Exchange Commission rules and forms, and to ensure that information required to be disclosed by the company in the reports it files or submits under the Exchange Act is accumulated and communicated to the company’s management, including its principal executive and principal financial officers, or persons performing similar functions, as appropriate, to allow timely decisions regarding required disclosure.
Changes in Internal Control
There has not been any change in the company’s internal control over financial reporting during the quarter ended January 3, 2015, that has materially affected, or is reasonably likely to materially affect, the company’s internal control over financial reporting (as such term is defined in Exchange Act Rules 13a-15(f) and 15d-15(f)).
Management’s Report on Internal Control over Financial Reporting
Our management is responsible for establishing and maintaining adequate internal control over financial reporting (as defined in Exchange Act Rules 13a-15(f) and 15d-15(f) under the Securities Exchange Act of 1934, as amended). Under the supervision and with the participation of our management, including our Chief Executive Officer and Chief Financial Officer, we evaluated the effectiveness of our internal control over financial reporting based on the criteria set forth by the Committee of Sponsoring Organizations of the Treadway Commission in Internal Control — Integrated Framework (2013). Based on this assessment, the company’s management believes that, as of January 3, 2015, our internal control over financial reporting was effective at a reasonable assurance level. The company’s internal control over financial reporting as of January 3, 2015, has been audited by Deloitte & Touche LLP, an independent registered public accounting firm, as stated in their attestation report, which is included herein.
Our management, including the Chief Executive Officer and Chief Financial Officer, does not expect that our internal control over financial reporting will prevent all error or fraud. Because of inherent limitations, a system of internal control over financial reporting can provide only reasonable assurance and may not prevent or detect misstatements. Further, because of changes in conditions, the effectiveness of internal control over financial reporting may vary over time.
| 2014 ANNUAL REPORT | 55 |
Table of Contents
REPORT OF INDEPENDENT REGISTERED PUBLIC ACCOUNTING FIRM
To the Board of Directors and Shareholders of
Snap-on Incorporated:
We have audited the internal control over financial reporting of Snap-on Incorporated and subsidiaries (the “Company”) as of January 3, 2015, based on criteria established in Internal Control – Integrated Framework (2013) issued by the Committee of Sponsoring Organizations of the Treadway Commission. The Company’s management is responsible for maintaining effective internal control over financial reporting and for its assessment of the effectiveness of internal control over financial reporting, included in the accompanying Management’s Report on Internal Control over Financial Reporting. Our responsibility is to express an opinion on the Company’s internal control over financial reporting based on our audit.
We conducted our audit in accordance with the standards of the Public Company Accounting Oversight Board (United States). Those standards require that we plan and perform the audit to obtain reasonable assurance about whether effective internal control over financial reporting was maintained in all material respects. Our audit included obtaining an understanding of internal control over financial reporting, assessing the risk that a material weakness exists, testing and evaluating the design and operating effectiveness of internal control based on the assessed risk, and performing such other procedures as we considered necessary in the circumstances. We believe that our audit provides a reasonable basis for our opinion.
A company’s internal control over financial reporting is a process designed by, or under the supervision of, the company’s principal executive and principal financial officers, or persons performing similar functions, and effected by the company’s board of directors, management, and other personnel to provide reasonable assurance regarding the reliability of financial reporting and the preparation of financial statements for external purposes in accordance with generally accepted accounting principles. A company’s internal control over financial reporting includes those policies and procedures that (1) pertain to the maintenance of records that, in reasonable detail, accurately and fairly reflect the transactions and dispositions of the assets of the company; (2) provide reasonable assurance that transactions are recorded as necessary to permit preparation of financial statements in accordance with generally accepted accounting principles, and that receipts and expenditures of the company are being made only in accordance with authorizations of management and directors of the company; and (3) provide reasonable assurance regarding prevention or timely detection of unauthorized acquisition, use, or disposition of the company’s assets that could have a material effect on the financial statements.
Because of the inherent limitations of internal control over financial reporting, including the possibility of collusion or improper management override of controls, material misstatements due to error or fraud may not be prevented or detected on a timely basis. Also, projections of any evaluation of the effectiveness of the internal control over financial reporting to future periods are subject to the risk that the controls may become inadequate because of changes in conditions, or that the degree of compliance with the policies or procedures may deteriorate.
In our opinion, the Company maintained, in all material respects, effective internal control over financial reporting as of January 3, 2015, based on the criteria established in Internal Control – Integrated Framework (2013) issued by the Committee of Sponsoring Organizations of the Treadway Commission.
We have also audited, in accordance with the standards of the Public Company Accounting Oversight Board (United States), the consolidated financial statements of the Company as of and for the year ended January 3, 2015, and our report dated February 12, 2015, expressed an unqualified opinion on those financial statements.
| /s/ Deloitte & Touche LLP | ||
| DELOITTE & TOUCHE LLP | ||
| Milwaukee, Wisconsin February 12, 2015 |
| 56 | SNAP-ON INCORPORATED |
Table of Contents
Item 9B. Other Information
None.
PART III
Item 10. Directors, Executive Officers and Corporate Governance
Incorporated by reference to sections entitled “Item 1: Election of Directors,” “Corporate Governance Practices and Board Information” and “Other Information” in Snap-on’s 2015 Annual Meeting Proxy Statement, which is expected to be mailed to shareholders on or about March 12, 2015 (the “2015 Proxy Statement”).
The Section 16(a) filing compliance disclosure pursuant to Item 405 of Regulation S-K is contained in Snap-on’s 2015 Proxy Statement in the section entitled “Other Information – Section 16(a) Beneficial Ownership Reporting Compliance,” and is incorporated herein by reference.
Information regarding Snap-on’s executive officers, including their ages, business experience (for at least the last five years) and titles as of January 3, 2015, is presented below:
Nicholas T. Pinchuk (68) – Chairman of the Board of Directors since 2009, President and Chief Executive Officer since December 2007 and President and Chief Operating Officer from April to December 2007. Senior Vice President and President – Worldwide Commercial & Industrial Group from 2002 to 2007. Prior to joining Snap-on, Mr. Pinchuk held various positions, including President of Global Refrigeration Operations and President of Asia Pacific Operations, at Carrier Corporation, a producer of air conditioning, heating and refrigeration systems, and a subsidiary of United Technologies Corporation. Mr. Pinchuk serves on the board of directors of Columbus McKinnon Corporation.
Aldo J. Pagliari (60) – Senior Vice President – Finance and Chief Financial Officer since 2010. President – Snap-on Equipment from 2007 to 2010, and Group Controller / Director of Finance – Commercial & Industrial Group from 2002 to 2007.
Iain Boyd (52) – Vice President – Human Resources since 2007.
Constance R. Johnsen (57) – Vice President and Controller since 2003.
Thomas L. Kassouf (62) – Senior Vice President and President – Snap-on Tools Group since 2010. Senior Vice President and President – Commercial Division from 2007 to 2010.
Jeanne M. Moreno (60) – Vice President and Chief Information Officer since 2005.
Irwin M. Shur (56) – Vice President, General Counsel and Secretary since 2008.
Thomas J. Ward (62) – Senior Vice President and President – Repair Systems & Information Group since 2010. Senior Vice President and President – Snap-on Tools Group from 2007 to 2010.
There is no family relationship among the executive officers and there has been no involvement in legal proceedings during the past ten years that would be material to the evaluation of the ability or integrity of any of the executive officers. Executive officers may be elected by the Board or appointed by the Chief Executive Officer at the regular meeting of the Board that follows the Annual Shareholders’ Meeting, which is ordinarily held in April each year, and at such other times as new positions are created or vacancies must be filled.
| 2014 ANNUAL REPORT | 57 |
Table of Contents
Code of Ethics and Website Disclosure
Snap-on has adopted a written code of ethics that applies to its Chief Executive Officer, Chief Financial Officer, Vice President and Controller, and all other financial officers and executives performing similar functions. Snap-on has posted a copy of the code of ethics in the Investors/Corporate Governance section on the company’s website at www.snapon.com. Snap-on will also post any amendments to these documents, or information about any waivers granted to directors or executive officers with respect to the Code of Business Conduct and Ethics, on the company’s website at www.snapon.com.
Snap-on intends to satisfy the disclosure requirements under Item 10 of Form 8-K regarding amendments to, or waivers from, the code of ethics by posting such information in the “Investors” section of its corporate website at www.snapon.com.
Item 11. Executive Compensation
The information required by Item 11 is contained in Snap-on’s 2015 Proxy Statement in the sections entitled “Executive Compensation,” “Board Compensation,” “Compensation Committee Report,” and “Other Information” and is incorporated herein by reference.
Item 12. Security Ownership of Certain Beneficial Owners and Management and Related Stockholder Matters
The information required by Item 12 is contained in Snap-on’s 2015 Proxy Statement in the sections entitled “Executive Compensation,” “Security Ownership of Certain Beneficial Owners and Management,” “Other Information” and “Item 3: Approval of the Amendment to, and Restatement of, the Snap-on Incorporated 2011 Incentive Stock and Awards Plan,” and is incorporated herein by reference.
Item 13. Certain Relationships and Related Transactions, and Director Independence
Incorporated by reference to the sections entitled “Corporate Governance Practices and Board Information – Board Information” and “Other Information – Transactions with the Company” in Snap-on’s 2015 Proxy Statement.
Item 14. Principal Accounting Fees and Services
Incorporated by reference to the section entitled “Deloitte & Touche LLP Fee Disclosure” in Snap-on’s 2015 Proxy Statement.
| 58 | SNAP-ON INCORPORATED |
Table of Contents
PART IV
Item 15: Exhibits, Financial Statement Schedules
Item 15. (a): Documents Filed as Part of This Report:
1. List of Financial Statements
Unless otherwise indicated, references to “fiscal 2014” or “2014” refer to the fiscal year ended January 3, 2015; references to “fiscal 2013” or “2013” refer to the fiscal year ended December 28, 2013; and references to “fiscal 2012” or “2012” refer to the fiscal year ended December 29, 2012. References to 2014, 2013 and 2012 year end refer to January 3, 2015, December 28, 2013, and December 29, 2012, respectively.
The following consolidated financial statements of Snap-on and the Report of Independent Registered Public Accounting Firm thereon, are filed as part of this report:
| • | Report of Independent Registered Public Accounting Firm. |
|---|
| • | Consolidated Statements of Earnings for the 2014, 2013 and 2012 fiscal years. |
|---|
| • | Consolidated Statements of Comprehensive Income for the 2014, 2013 and 2012 fiscal years. |
|---|
| • | Consolidated Balance Sheets as of 2014 and 2013 year end. |
|---|
| • | Consolidated Statements of Equity for the 2014, 2013 and 2012 fiscal years. |
|---|
| • | Consolidated Statements of Cash Flows for the 2014, 2013 and 2012 fiscal years. |
|---|
| • | Notes to Consolidated Financial Statements. |
|---|
2. Financial Statement Schedules
All schedules are omitted because they are not applicable, or the required information is included in the consolidated financial statements or notes thereto.
3. List of Exhibits
The exhibits filed with or incorporated by reference in this report are as specified in the exhibit index included herein.
| 2014 ANNUAL REPORT | 59 |
Table of Contents
REPORT OF INDEPENDENT REGISTERED PUBLIC ACCOUNTING FIRM
To the Board of Directors and Shareholders of
Snap-on Incorporated:
We have audited the accompanying consolidated balance sheets of Snap-on Incorporated and subsidiaries (the “Company”) as of January 3, 2015, and December 28, 2013, and the related consolidated statements of earnings, comprehensive income, equity, and cash flows for each of the three years in the period ended January 3, 2015. These financial statements are the responsibility of the Company’s management. Our responsibility is to express an opinion on these financial statements based on our audits.
We conducted our audits in accordance with the standards of the Public Company Accounting Oversight Board (United States). Those standards require that we plan and perform the audit to obtain reasonable assurance about whether the financial statements are free of material misstatement. An audit includes examining, on a test basis, evidence supporting the amounts and disclosures in the financial statements. An audit also includes assessing the accounting principles used and significant estimates made by management, as well as evaluating the overall financial statement presentation. We believe that our audits provide a reasonable basis for our opinion.
In our opinion, such consolidated financial statements present fairly, in all material respects, the financial position of Snap-on Incorporated and subsidiaries as of January 3, 2015, and December 28, 2013, and the results of their operations and their cash flows for each of the three years in the period ended January 3, 2015, in conformity with accounting principles generally accepted in the United States of America.
We have also audited, in accordance with the standards of the Public Company Accounting Oversight Board (United States), the Company’s internal control over financial reporting as of January 3, 2015, based on the criteria established in Internal Control – Integrated Framework (2013) issued by the Committee of Sponsoring Organizations of the Treadway Commission and our report dated February 12, 2015 expressed an unqualified opinion on the Company’s internal control over financial reporting.
| /s/ Deloitte & Touche LLP | ||
| DELOITTE & TOUCHE LLP Milwaukee, Wisconsin February 12, 2015 |
| 60 | SNAP-ON INCORPORATED |
Table of Contents
Consolidated Statements of Earnings
| (Amounts in millions, except per share data) | 2014 | 2013 | 2012 | |||||||||
| Net sales | $ | 3,277.7 | $ | 3,056.5 | $ | 2,937.9 | ||||||
| Cost of goods sold | (1,693.4) | (1,583.6) | (1,547.9) | |||||||||
| Gross profit | 1,584.3 | 1,472.9 | 1,390.0 | |||||||||
| Operating expenses | (1,048.7) | (1,012.4) | (980.3) | |||||||||
| Operating earnings before financial services | 535.6 | 460.5 | 409.7 | |||||||||
| Financial services revenue | 214.9 | 181.0 | 161.3 | |||||||||
| Financial services expenses | (65.8) | (55.3) | (54.6) | |||||||||
| Operating earnings from financial services | 149.1 | 125.7 | 106.7 | |||||||||
| Operating earnings | 684.7 | 586.2 | 516.4 | |||||||||
| Interest expense | (52.9) | (56.1) | (55.8) | |||||||||
| Other income (expense) – net | (0.9) | (3.9) | (0.4) | |||||||||
| Earnings before income taxes and equity earnings | 630.9 | 526.2 | 460.2 | |||||||||
| Income tax expense | (199.5) | (166.7) | (148.2) | |||||||||
| Earnings before equity earnings | 431.4 | 359.5 | 312.0 | |||||||||
| Equity earnings, net of tax | 0.7 | 0.2 | 2.6 | |||||||||
| Net earnings | 432.1 | 359.7 | 314.6 | |||||||||
| Net earnings attributable to noncontrolling interests | (10.2) | (9.4) | (8.5) | |||||||||
| Net earnings attributable to Snap-on Incorporated | $ | 421.9 | $ | 350.3 | $ | 306.1 | ||||||
| Net earnings per share attributable to Snap-on Incorporated: | ||||||||||||
| Basic | $ | 7.26 | $ | 6.02 | $ | 5.26 | ||||||
| Diluted | 7.14 | 5.93 | 5.20 | |||||||||
| Weighted-average shares outstanding: | ||||||||||||
| Basic | 58.1 | 58.2 | 58.2 | |||||||||
| Effect of dilutive securities | 1.0 | 0.9 | 0.7 | |||||||||
| Diluted | 59.1 | 59.1 | 58.9 | |||||||||
See Notes to Consolidated Financial Statements.
| 2014 ANNUAL REPORT | 61 |
Table of Contents
Consolidated Statements of Comprehensive Income
| (Amounts in millions) | 2014 | 2013 | 2012 | |||||||||
| Comprehensive income (loss): | ||||||||||||
| Net earnings | $ | 432.1 | $ | 359.7 | $ | 314.6 | ||||||
| Other comprehensive income (loss): | ||||||||||||
| Foreign currency translation* | (128.8) | (8.6) | 35.0 |
Showing the first 8K of 215K characters. Open the full section