 filings.tools
Item 7. . Management’s Discussion and Analysis of Financial Condition and Results of Operations
131K characters. Original on sec.gov · Markdown
Item 7. . Management’s Discussion and Analysis of Financial Condition and Results of Operations
The following Management's Discussion and Analysis (“MD&A”) provides a narrative of the results of operations and financial condition of S&P Global Inc. (together with its consolidated subsidiaries, the “Company,” “we,” “us” or “our”) for the years ended December 31, 2019 and 2018, respectively. The MD&A should be read in conjunction with the consolidated financial statements and accompanying notes included in this Annual Report on Form 10-K for the year ended December 31, 2019, which have been prepared in accordance with accounting principles generally accepted in the U.S. (“U.S. GAAP”).
The MD&A includes the following sections:
| • | Overview |
| • | Results of Operations |
| • | Liquidity and Capital Resources |
| • | Reconciliation of Non-GAAP Financial Information |
| • | Critical Accounting Estimates |
| • | Recent Accounting Standards |
Certain of the statements below are forward-looking statements within the meaning of the Private Securities Litigation Reform Act of 1995. In addition, any projections of future results of operations and cash flows are subject to substantial uncertainty. See Forward-Looking Statements on page 4 of this report.
OVERVIEW
We are a leading provider of transparent and independent ratings, benchmarks, analytics and data to the capital and commodity markets worldwide. The capital markets include asset managers, investment banks, commercial banks, insurance companies, exchanges, trading firms and issuers; and the commodity markets include producers, traders and intermediaries within energy, petrochemicals, metals and agriculture.
Our operations consist of four reportable segments: S&P Global Ratings ("Ratings"), S&P Global Market Intelligence ("Market Intelligence"), S&P Global Platts ("Platts") and S&P Dow Jones Indices ("Indices").
| • | Ratings is an independent provider of credit ratings, research and analytics, offering investors and other market participants information, ratings and benchmarks. |
| • | Market Intelligence is a global provider of multi-asset-class data, research and analytical capabilities, which integrate cross-asset analytics and desktop services. |
| • | Platts is the leading independent provider of information and benchmark prices for the commodity and energy markets. |
| • | Indices is a global index provider maintaining a wide variety of valuation and index benchmarks for investment advisors, wealth managers and institutional investors. |
Major Portfolio Changes
The following significant change was recently made to our portfolio in January of 2020:
| • | In January of 2020, we completed the acquisition of the ESG Ratings Business from RobecoSAM, which includes the widely followed SAM* Corporate Sustainability Assessment, an annual evaluation of companies' sustainability practices. The acquisition will bolster our position as the premier resource for essential environmental, social, and governance ("ESG") insights and product solutions for our customers. Through this acquisition, we will be able to offer our customers even more transparent, robust and comprehensive ESG solutions. |
The following significant change was made to our portfolio during the three years ended December 31, 2019:
| • | In April of 2018, we acquired Kensho Technologies Inc. ("Kensho") for approximately $550 million, net of cash acquired, in a mix of cash and stock. Kensho is a leading-edge provider of next-generation analytics, artificial intelligence, machine learning, and data visualization systems to Wall Street's premier global banks and investment institutions, as well as the National Security community. Beginning in the first quarter of 2019, the contract obligations for revenue from Kensho's major customers were transferred to Market Intelligence for fulfillment. As a result of this transfer, from January 1, 2019 |
revenue from contracts with Kensho’s customers is reflected in Market Intelligence’s results. In 2018, the revenue from contracts with Kensho’s customers was reported in Corporate revenue.
Increased Shareholder Return
During the three years ended December 31, 2019, we have returned approximately $5.4 billion to our shareholders through a combination of share repurchases and our quarterly dividends: we completed share repurchases of approximately $3.9 billion and distributed regular quarterly dividends totaling approximately $1.5 billion. Also, on January 29, 2020 the Board of Directors approved an increase in the quarterly common stock dividend from $0.57 per share to $0.67 per share.
Key Results
| (in millions) | Year ended December 31, | % Change 1 | |||||||||||||
| 2019 | 2018 | 2017 | ’19 vs ’18 | ’18 vs ’17 | |||||||||||
| Revenue | $ | 6,699 | $ | 6,258 | $ | 6,063 | 7% | 3% | |||||||
| Operating profit 2 | $ | 3,226 | $ | 2,790 | $ | 2,583 | 16% | 8% | |||||||
| % Operating margin | 48 | % | 45 | % | 43 | % | |||||||||
| Diluted earnings per share from net income | $ | 8.60 | $ | 7.73 | $ | 5.78 | 11% | 34% |
| 1 | % changes in the tables throughout the MD&A are calculated off of the actual number, not the rounded number presented. |
| 2 | 2019 includes a gain on the sale of RigData and SPIAS of $27 million and $22 million, respectively, employee severance charges of $25 million, Kensho retention related expense of $21 million, lease impairments of $11 million and acquisition-related costs of $4 million. 2018 includes legal settlement expenses of $74 million, Kensho retention related expense of $31 million, restructuring charges related to a business disposition and employee severance charges of $25 million and lease impairments of $11 million. 2017 includes legal settlement expenses of $55 million, employee severance charges of $44 million, a charge to exit leased facilities of $25 million, non-cash acquisition and disposition-related adjustments of $15 million and an asset write-off of $2 million. 2019 and 2018 also includes amortization of intangibles from acquisitions of $122 million and 2017 includes amortization of intangibles from acquisitions of $ $98 million. |
2019
Revenue increased 7%, with an unfavorable impact of 1 percentage point from foreign exchange rates. The increase was driven by revenue growth at all of our reportable segments. Revenue growth at Ratings was driven by an increase in corporate bond ratings revenue and public finance revenue, partially offset by lower bank loan ratings revenue. The increase at Market Intelligence was driven by annualized contract value growth in the Market Intelligence Desktop, Credit Risk Solutions and Data Management Solutions products. The increase at Indices was due to higher levels of assets under management for exchange traded funds ("ETFs") and mutual funds. Revenue growth at Indices was also favorably impacted by the buyout of the balance of intellectual property rights in a family of indices from one of our co-marketing and index development partners in the fourth quarter of 2018, retrospective fees for previously unlicensed and unreported index usage and benefits related to recent contract renegotiation. The increase at Platts was primarily due to continued demand for market data and price assessment products.
Operating profit increased 16%, with a favorable impact from foreign exchange rates of less than 1 percentage point. Excluding the impact of higher legal settlement expenses in 2018 of 3 percentage points, a gain on our dispositions of 2 percentage points and higher Kensho retention related expense in 2018 of 1 percentage point, operating profit increased 10%. The increase was primarily due to revenue growth at all of our reportable segments, lower professional fees and decreased expenses at Corporate Unallocated driven by a $20 million reduction in contributions made to the S&P Global Foundation in 2018. These increases to operating profit were partially offset by higher technology costs, an increase in incentive costs and higher compensation costs driven by annual merit increases and additional headcount.
2018
Revenue increased 3% with a 1 percentage point favorable impact from foreign exchange rates. Revenue growth was driven by increases at Market Intelligence, Indices and Platts, partially offset by a decrease at Ratings. The increase at Market Intelligence was driven by annualized contract value growth in the Market Intelligence Desktop and Credit Risk Solutions products. Revenue growth at Indices was driven by higher levels of assets under management for ETFs and mutual funds, and higher exchange-traded derivative volumes. The increase at Platts was due to continued demand for market data and price assessment products. These increases were partially offset by a decrease at Ratings driven by lower corporate bond ratings revenue.
Operating profit increased 8% with a 2 percentage point favorable impact from foreign exchange rates. Excluding the unfavorable impact of higher legal settlement expenses in 2018 of less than 1 percentage point, Kensho retention related expense in 2018 of less than 1 percentage point, and higher deal-related amortization in 2018 of less than 1 percentage point, partially offset by the favorable impact of higher employee severance charges in 2017 of less than1 percentage point, the favorable impact of non-cash acquisition and disposition-related adjustments in 2017 of less than 1 percentage point, operating profit increased 8%. The increase was primarily due to revenue growth at Market Intelligence, Indices and Platts and decreased compensation costs at Ratings and Corporate primarily driven by reduced incentive costs as well as the decreased headcount from attrition and prior year restructuring actions. These increases were partially offset by a decrease in revenue at Ratings, increased expenses at Market Intelligence due to an increase in cost of sales as a result of royalties tied to annualized contract value growth and increased data costs, and higher compensation costs at Market Intelligence and Indices primarily driven by additional headcount.
Our Strategy
We are a leading provider of transparent and independent ratings, benchmarks, analytics and data to the capital and commodity markets worldwide. Our purpose is to provide the intelligence that is essential for companies, governments and individuals to make decisions with conviction. We seek to deliver on this purpose in line with our core values of integrity, excellence and relevance.
In 2018, we announced the launch of Powering the Markets of the Future to provide a framework for our forward-looking business strategy. Through this framework, we seek to deliver an exceptional, differentiated customer experience by enhancing our foundational capabilities, evolving and growing our core businesses, and pursuing growth via adjacencies. In 2020, we will strive to deliver on our strategic priorities in the following key areas:
Finance
| • | Meeting or exceeding revenue growth and EBITA margin targets and delivering on commitments to return capital to shareholders; |
| • | Funding organic opportunities with continued productivity gains; |
| • | Pursuing a disciplined acquisition, investment and partnership strategy to support our strategic initiatives; and |
| • | Better serving our customers, employees, and the communities in which we operate through our commitment to corporate responsibility and sustainability. |
Customer
| • | Continuing to drive excellence through our core business offerings; |
| • | Delivering ESG, Small and Medium-sized Enterprise data and Marketplace solutions to market on schedule and with strong commercial traction; |
| • | Modernizing and enhancing the delivery of our products across multiple channels (e.g., S&P Global Platform, MI Smart move, feeds, application programming interfaces); |
| • | Providing a superior customer experience through the collective efforts of our divisions and functions; and |
| • | Accelerating growth in non-U.S. markets with a particular focus on progressing our businesses in China. |
Operations
| • | Modernizing our workplace to improve end-user productivity and experience, enabling our employees to innovate and better serve our customers; |
| • | Standardizing and simplifying our technology to best support and enable our divisions; |
| • | Reducing our Cyber Security risk while augmenting process maturity and producing outcomes commensurate with our risk appetite; |
| • | Maintaining our strong commitment to quality, utilizing shared data processes and capabilities; and |
| • | Continuing to advance a strong Risk, Internal Control, and Compliance environment. |
People
| • | Creating an inclusive performance-driven culture that drives employee engagement and aligns with our purpose of accelerating progress in the world; |
| • | Promoting career mobility and attracting and retaining the best people; and |
| • | Improving diversity in overall representation through talent acquisition, advancement and retention. |
There can be no assurance that we will achieve success in implementing any one or more of these strategies as a variety of factors could unfavorably impact operating results, including prolonged difficulties in the global credit markets and a change in the regulatory environment affecting our businesses. See Item 1A, Risk Factors, in this Annual Report on Form 10-K.
Further projections and discussion on our 2020 outlook for our segments can be found within “ – Results of Operations”.
RESULTS OF OPERATIONS
Consolidated Review
| (in millions) | Year ended December 31, | % Change | |||||||||||||
| 2019 | 2018 | 2017 | ’19 vs ’18 | ’18 vs ’17 | |||||||||||
| Revenue | $ | 6,699 | $ | 6,258 | $ | 6,063 | 7% | 3% | |||||||
| Expenses: | |||||||||||||||
| Operating-related expenses | 1,801 | 1,698 | 1,694 | 6% | —% | ||||||||||
| Selling and general expenses | 1,517 | 1,564 | 1,606 | (3)% | (3)% | ||||||||||
| Depreciation and amortization | 204 | 206 | 180 | (1)% | 14% | ||||||||||
| Total expenses | 3,522 | 3,468 | 3,480 | 2% | —% | ||||||||||
| Gain on dispositions | (49 | ) | — | — | N/M | N/M | |||||||||
| Operating profit | 3,226 | 2,790 | 2,583 | 16% | 8% | ||||||||||
| Other expense (income), net | 98 | (25 | ) | (27 | ) | N/M | 8% | ||||||||
| Interest expense, net | 198 | 134 | 149 | 48% | (10)% | ||||||||||
| Provision for taxes on income | 627 | 560 | 823 | 12% | (32)% | ||||||||||
| Net income | 2,303 | 2,121 | 1,638 | 9% | 30% | ||||||||||
| Less: net income attributable to noncontrolling interests | (180 | ) | (163 | ) | (142 | ) | (10)% | (15)% | |||||||
| Net income attributable to S&P Global Inc. | $ | 2,123 | $ | 1,958 | $ | 1,496 | 8% | 31% |
N/M - not meaningful
Revenue
| (in millions) | Year ended December 31, | % Change | |||||||||||||
| 2019 | 2018 | 2017 | ’19 vs ’18 | ’18 vs ’17 | |||||||||||
| Subscription revenue | $ | 2,843 | $ | 2,682 | $ | 2,454 | 6% | 9% | |||||||
| Non-subscription / transaction revenue | 1,632 | 1,401 | 1,574 | 17% | (11)% | ||||||||||
| Non-transaction revenue | 1,401 | 1,408 | 1,363 | (1)% | 3% | ||||||||||
| Asset-linked fees | 623 | 542 | 484 | 15% | 12% | ||||||||||
| Sales usage-based royalties | 200 | 225 | 188 | (11)% | 19% | ||||||||||
| % of total revenue: | |||||||||||||||
| Subscription revenue | 43 | % | 43 | % | 41 | % | |||||||||
| Non-subscription / transaction revenue | 24 | % | 22 | % | 26 | % | |||||||||
| Non-transaction revenue | 21 | % | 23 | % | 22 | % | |||||||||
| Asset-linked fees | 9 | % | 9 | % | 8 | % | |||||||||
| Sales usage-based royalties | 3 | % | 3 | % | 3 | % | |||||||||
| U.S. revenue | $ | 3,949 | $ | 3,750 | $ | 3,658 | 5% | 3% | |||||||
| International revenue: | |||||||||||||||
| European region | 1,681 | 1,543 | 1,473 | 9% | 5% | ||||||||||
| Asia | 715 | 647 | 594 | 11% | 9% | ||||||||||
| Rest of the world | 354 | 318 | 338 | 11% | (6)% | ||||||||||
| Total international revenue | $ | 2,750 | $ | 2,508 | $ | 2,405 | 10% | 4% | |||||||
| % of total revenue: | |||||||||||||||
| U.S. revenue | 59 | % | 60 | % | 60 | % | |||||||||
| International revenue | 41 | % | 40 | % | 40 | % |
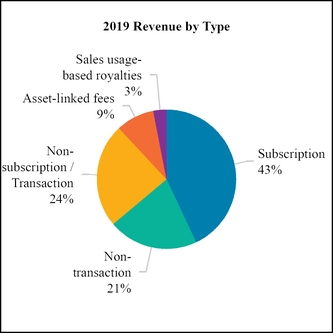

2019
Revenue increased 7% as compared to 2018. Subscription revenue increased primarily from growth in Market Intelligence's average contract values and continued demand for Platt's proprietary content. Higher data subscription revenue at Indices also contributed to subscription revenue growth. Non-transaction revenue decreased 1% primarily due to the unfavorable impact from foreign exchange rates. Non-transaction revenue was unfavorably impacted by a decline in Ratings Evaluation Service activity, a decrease at CRISIL, primarily within the risk and analytics sector, and lower entity credit ratings revenue, and benefited from an increase in surveillance revenue and higher royalty revenue. Non-subscription / transaction revenue increased driven by an increase in corporate bond ratings revenue and public finance revenue, partially offset by a decline in bank loan ratings revenue at Ratings. Asset linked fees increased due to the impact of higher levels of assets under management for ETFs and mutual funds at Indices. Additionally, asset-linked fees was favorably impacted by the buyout of the balance of intellectual property rights in a family of indices from one of our co-marketing and index development partners in the fourth quarter of 2018, retrospective fees for previously unlicensed and unreported index usage and benefits related to recent contract renegotiations. The decline in sales-usage based royalties was primarily driven by lower exchange-traded derivative volumes at Indices in 2019. See “Segment Review” below for further information.
The unfavorable impact of foreign exchange rates reduced revenue by 1 percentage point. This impact refers to constant currency comparisons estimated by recalculating current year results of foreign operations using the average exchange rate from the prior year.
2018
Revenue increased 3% as compared to 2017. Subscription revenue increased primarily from growth in Market Intelligence's average contract values and continued demand for Platt's proprietary content. Non-transaction revenue grew at Ratings primarily due to an increase in surveillance fees, higher entity credit ratings revenue and an increase in royalty revenue. Non-subscription / transaction revenue decreased as a decline in corporate bond ratings revenue was partially offset by an increase in structured finance revenue and bank loan ratings revenue at Ratings. Asset-linked fees increased primarily due to the impact of higher levels of assets under management for ETFs and mutual funds at Indices. Sales usage-based royalties increased primarily driven by higher volumes for exchange-traded derivatives at Indices. See “Segment Review” below for further information.
Foreign exchange rates had a 1 percentage point favorable impact on revenue. This impact refers to constant currency comparisons estimated by recalculating current year results of foreign operations using the average exchange rate from the prior year.
Total Expenses
The following tables provide an analysis by segment of our operating-related expenses and selling and general expenses for the years ended December 31, 2019 and 2018:
| (in millions) | 2019 | 2018 | % Change | ||||||||||||||||
| Operating- related expenses | Selling and general expenses | Operating- related expenses | Selling and general expenses | Operating- related expenses | Selling and general expenses | ||||||||||||||
| Ratings 1 | $ | 847 | $ | 461 | $ | 804 | $ | 517 | 5% | (11)% | |||||||||
| Market Intelligence 2 | 691 | 583 | 654 | 535 | 6% | 9% | |||||||||||||
| Platts 3 | 219 | 194 | 212 | 195 | 3% | (1)% | |||||||||||||
| Indices | 136 | 144 | 129 | 133 | 5% | 8% | |||||||||||||
| Intersegment eliminations 4 | (128 | ) | — | (125 | ) | — | (2)% | N/M | |||||||||||
| Total segments | 1,765 | 1,382 | 1,674 | 1,380 | 5% | —% | |||||||||||||
| Corporate Unallocated expense 5 | 36 | 135 | 24 | 184 | 53% | (27)% | |||||||||||||
| $ | 1,801 | $ | 1,517 | $ | 1,698 | $ | 1,564 | 6% | (3)% |
N/M - not meaningful
| 1 | In 2019, selling and general expenses include employee severance charges of $11 million. In 2018, selling and general expenses include legal settlement expenses of $74 million and employee severance charges of $8 million. |
| 2 | In 2019, selling and general expenses include employee severance charges of $6 million and acquisition-related costs of $4 million. In 2018, selling and general expenses include restructuring charges related to a business disposition and employee severance charges of $7 million. |
3 In 2019, selling and general expenses include employee severance charges of $1 million.
| 4 | Intersegment eliminations primarily relate to a royalty charged to Market Intelligence for the rights to use and distribute content and data developed by Ratings. |
| 5 | In 2019, selling and general expenses include Kensho retention related expense of $21 million, lease impairments of $11 million and employee severance charges of $7 million. In 2018, selling and general expenses include Kensho retention related expense of $31 million, lease impairments of $11 million and employee severance charges of $10 million. |
Operating-Related Expenses
Operating-related expenses increased as compared to 2018 driven by the acquisition of Kensho in April of 2018 and increases at all of our reportable segments. Ratings increased primarily due to an increase in incentive costs, partially offset by lower professional fees. The increase at Market Intelligence was due to higher technology costs, higher compensation costs and an increase in intersegment royalties tied to annualized contract value growth. Platts increased due to higher compensation costs primarily related to annual merit increases and higher costs to support business initiatives. The increase at Indices was primarily related to increased royalties due to increased traction of royalty-based products and higher compensation costs.
Intersegment eliminations primarily relate to a royalty charged to Market Intelligence for the rights to use and distribute content and data developed by Ratings.
Selling and General Expenses
Selling and general expenses decreased 3%. Excluding the impact of legal settlement expenses in 2018 of 4 percentage points and higher Kensho retention related expense in 2018 of 1 percentage point, selling and general expenses increased 2%. This increase was primarily driven by an increase at Market Intelligence due to higher compensation and technology costs. The increase at Ratings was primarily driven by an increase in incentive costs. Indices increased primarily due to higher legal expenses and compensation costs. These increases were partially offset by a decrease in expenses at Corporate Unallocated primarily driven by a $20 million contribution made by the Company to the S&P Global Foundation in 2018 and a decrease in expenses at Kensho.
Depreciation and Amortization
Depreciation and amortization decreased $2 million, or 1%, compared to 2018 due to decreases at Market Intelligence and Platts related to assets becoming fully depreciated and assets becoming fully amortized at Platts, partially offset by an increase in amortization expense from the acquisition of Kensho in April of 2018.
The following tables provide an analysis by segment of our operating-related expenses and selling and general expenses for the years ended December 31, 2018 and 2017:
| (in millions) | 2018 | 2017 | % Change | ||||||||||||||||
| Operating- related expenses | Selling and general expenses | Operating- related expenses | Selling and general expenses | Operating- related expenses | Selling and general expenses | ||||||||||||||
| Ratings 1 | $ | 804 | $ | 517 | $ | 856 | $ | 582 | (6)% | (11)% | |||||||||
| Market Intelligence 2 | 654 | 535 | 619 | 502 | 6% | 7% | |||||||||||||
| Platts 3 | 212 | 195 | 207 | 218 | 3% | (10)% | |||||||||||||
| Indices | 129 | 133 | 121 | 118 | 6% | 12% | |||||||||||||
| Intersegment eliminations 4 | (125 | ) | — | (109 | ) | — | (14)% | N/M | |||||||||||
| Total segments | 1,674 | 1,380 | 1,694 | 1,420 | (1)% | (3)% | |||||||||||||
| Corporate Unallocated expense5 | 24 | 184 | — | 186 | N/M | (1)% | |||||||||||||
| $ | 1,698 | $ | 1,564 | $ | 1,694 | $ | 1,606 | —% | (3)% |
N/M - not meaningful
| 1 | In 2018, selling and general expenses include legal settlement expenses of $74 million and employee severance charges of $8 million. In 2017, selling and general expenses include legal settlement expenses of $55 million and employee severance charges of $25 million. |
| 2 | In 2018, selling and general expenses include restructuring charges related to a business disposition and employee severance charges of $7 million. In 2017, selling and general expenses include employee severance charges of $7 million and a non-cash disposition-related adjustment of $4 million. |
| 3 | In 2017, selling and general expenses include a non-cash acquisition-related adjustment of $11 million, a charge to exit a leased facility of $6 million, an asset write-off of $2 million and employee severance charges of $2 million. |
| 4 | Intersegment eliminations primarily relate to a royalty charged to Market Intelligence for the rights to use and distribute content and data developed by Ratings. |
| 5 | In 2018, selling and general expenses include Kensho retention related expense of $31 million, lease impairments of $11 million and employee severance charges of $10 million. In 2017, selling and general expenses include a charge to exit leased facilities of $19 million and employee severance charges of $10 million. |
Operating-Related Expenses
Operating-related expenses remained relatively unchanged as compared to 2017, increasing $4 million or less than 1%. Market Intelligence increased due to an increase in cost of sales as a result of royalties tied to annualized contract value growth and increased data costs, and higher compensation costs related to additional headcount. Additionally, operating-related expenses increased due to the acquisition of Kensho in April of 2018. These increases were partially offset by decreased compensation costs at Ratings primarily driven by reduced incentive costs as well as the decreased headcount from attrition and prior year restructuring actions.
Selling and General Expenses
Selling and general expenses decreased 3%. Excluding the favorable impact of higher employee severance charges in 2017 of 59 percentage points, non-cash acquisition and disposition-related adjustments in 2017 of 48 percentage points, higher lease impairment charges in 2017 of 43 percentage points and an asset write-off in 2017 of 7 percentage points, partially offset by the unfavorable impact of Kensho retention related expense in 2018 of 98 percentage points and higher legal settlement expenses in 2018 of 59 percentage points, selling and general expenses decreased 3%. The decrease is due to decreased compensation costs at Ratings primarily driven by reduced incentive costs, as well as the decreased headcount from attrition and prior year restructuring actions, and a reduction in Corporate Unallocated expense due to a reduction in vacant space, technology spend and professional fees. These decreases were partially offset by higher compensation costs at Market Intelligence and Indices, and increased expenses due to the acquisition of Kensho in April of 2018.
Depreciation and Amortization
Depreciation and amortization increased $26 million, or 14%, compared to 2018 due to an increase in amortization expense primarily related to the acquisition of Kensho in April of 2018.
Gain on Dispositions
During the year ended December 31, 2019, we completed the following dispositions that resulted in a pre-tax gain of $49 million, which was included in Gain on dispositions in the consolidated statement of income:
| • | In July of 2019, we completed the sale of RigData, a business within our Platts segment, to Drilling Info, Inc. RigData is a provider of daily information on rig activity for the natural gas and oil markets across North America. During the year ended December 31, 2019, we recorded a pre-tax gain of $27 million ($26 million after-tax) in Gain on dispositions in the consolidated statement of income related to the sale of RigData. |
| • | In March of 2019, we entered into an agreement to sell Standard & Poor's Investment Advisory Services LLC ("SPIAS"), a business within our Market Intelligence segment, to Goldman Sachs Asset Management ("GSAM"). SPIAS provides non-discretionary investment advice across institutional sub-advisory and intermediary distribution channels globally. On July 1, 2019, we completed the sale of SPIAS to GSAM. During the year ended December 31, 2019, we recorded a pre-tax gain of $22 million ($12 million after-tax) in Gain on dispositions in the consolidated statement of income related to the sale of SPIAS. |
Operating Profit
We consider operating profit to be an important measure for evaluating our operating performance and we evaluate operating profit for each of the reportable business segments in which we operate.
We internally manage our operations by reference to operating profit with economic resources allocated primarily based on each segment's contribution to operating profit. Segment operating profit is defined as operating profit before Corporate Unallocated. Segment operating profit is not, however, a measure of financial performance under U.S. GAAP, and may not be defined and calculated by other companies in the same manner.
The table below reconciles segment operating profit to total operating profit:
| (in millions) | Year ended December 31, | % Change | |||||||||||||
| 2019 | 2018 | 2017 | ’19 vs ’18 | ’18 vs ’17 | |||||||||||
| Ratings 1 | $ | 1,763 | $ | 1,530 | $ | 1,517 | 15% | 1% | |||||||
| Market Intelligence 2 | 607 | 545 | 457 | 11% | 19% | ||||||||||
| Platts 3 | 438 | 383 | 326 | 15% | 18% | ||||||||||
| Indices 4 | 630 | 563 | 478 | 12% | 18% | ||||||||||
| Total segment operating profit | 3,438 | 3,021 | 2,778 | 14% | 9% | ||||||||||
| Corporate Unallocated 5 | (212 | ) | (231 | ) | (195 | ) | 8% | (19)% | |||||||
| Total operating profit | $ | 3,226 | $ | 2,790 | $ | 2,583 | 16% | 8% |
| 1 | 2019 includes employee severance charges of $11 million. 2018 includes legal settlement expenses of $74 million and employee severance charges of $8 million. 2017 includes legal settlement expenses of $55 million and employee severance charges of $25 million. 2019 and 2018 includes amortization of intangibles from acquisitions of $2 million and 2017 includes amortization of intangibles from acquisitions of $4 million. |
| 2 | 2019 includes a gain on the sale of SPIAS of $22 million, employee severance charges of $6 million and acquisition-related costs of $4 million. 2018 includes restructuring charges related to a business disposition and employee severance charges of $7 million. 2017 includes employee severance charges of $7 million and a non-cash disposition-related adjustment of $4 million. 2019, 2018 and 2017 includes amortization of intangibles from acquisitions of $75 million, $73 million and $71 million, respectively. |
| 3 | 2019 includes a gain on the sale of RigData of $27 million and employee severance charges of $1 million. 2017 includes a non-cash acquisition-related adjustment of $11 million, a charge to exit a leased facility of $6 million, an asset write-off of $2 million and employee severance charges of $2 million. 2019 includes amortization of intangibles from acquisitions of $12 million and both 2018 and 2017 includes amortization of intangibles from acquisitions of $18 million. |
| 4 | 2019, 2018 and 2017 includes amortization of intangibles from acquisitions of $6 million. |
| 5 | 2019 includes Kensho retention related expense of $21 million, lease impairments of $11 million and employee severance charges of $7 million. 2018 includes Kensho retention related expense of $31 million, lease impairments of $11 million and employee severance charges of $10 million. 2017 includes a charge to exit leased facilities of $19 million and employee severance charges of $10 million. 2019 and 2018 also includes amortization of intangibles from acquisitions of $28 million and $23 million, respectively. |
2019
Segment Operating Profit — Increased $417 million, or 14% as compared to 2018. Excluding the impact of higher legal settlement expenses in 2018 of 3 percentage points and a gain on our dispositions in 2019 of 2 percentage points, segment operating profit increased 9%. This increase was primarily driven by an increase in revenue at all of our reportable segments and lower professional fees, partially offset by higher technology costs, an increase in incentive costs and higher compensation costs driven by annual merit increases and additional headcount.
Corporate Unallocated — Corporate Unallocated includes costs for corporate center functions, select initiatives and unoccupied office space and Kensho, included in selling and general expenses, and Kensho revenue in 2018. Corporate Unallocated improved by $19 million or 8% as compared to 2018. Excluding the favorable impact of lower Kensho retention related expense in 2019 of 2 percentage points, partially offset by the unfavorable impact of higher deal-related amortization in 2019 of 1 percentage point, Corporate Unallocated improved 7% primarily driven by a $20 million contribution made by the Company to the S&P Global Foundation in 2018 and a reduction in professional fees.
Foreign exchange rates had a favorable impact on operating profit of less than 1 percentage point. The foreign exchange rate impact refers to constant currency comparisons and the remeasurement of monetary assets and liabilities. Constant currency impacts are estimated by recalculating current year results of foreign operations using the average exchange rate from the prior year. Remeasurement impacts are based on the variance between current-year and prior-year foreign exchange rate fluctuations on monetary assets and liabilities denominated in currencies other than the individual business' functional currency.
2018
Segment Operating Profit — Increased $243 million, or 9% as compared to 2017. Excluding the favorable impact of higher employee severance charges in 2017 of 1 percentage point and non-cash acquisition and disposition related adjustments of 1 percentage point, partially offset by the impact of higher legal settlement charges in 2018 of 1 percentage point, segment operating
profit increased 7%. This increase was primarily due to revenue growth at Market Intelligence, Indices and Platts as discussed above and decreased compensation costs at Ratings primarily driven by reduced incentive costs as well as the decreased headcount from attrition and prior year restructuring actions. These increases were partially offset by a decrease in revenue at Ratings, increased expenses at Market Intelligence due to an increase in cost of sales as a result of royalties tied to annualized contract value growth and increased data costs, and higher compensation costs at Market Intelligence and Indices primarily driven by additional headcount. See “ – Segment Review” below for further information.
Corporate Unallocated — Corporate Unallocated includes costs for corporate center functions, select initiatives and unoccupied office space, included in selling and general expenses, and the results for Kensho in 2018. Corporate Unallocated operating loss increased by $36 million or 19% as compared to 2017. Excluding the unfavorable impact of Kensho retention related expense in 2018 of 17 percentage points, higher deal-related amortization of 12 percentage points, partially offset by higher lease impairment charges in 2017 of 4 percentage points, Corporate Unallocated improved 6% due to a reduction in vacant space, performance related incentive compensation and professional fees.
Foreign exchange rates had a favorable impact on operating profit of 2 percentage points. The foreign exchange rate impact refers to constant currency comparisons and the remeasurement of monetary assets and liabilities. Constant currency impacts are estimated by recalculating current year results of foreign operations using the average exchange rate from the prior year. Remeasurement impacts are based on the variance between current-year and prior-year foreign exchange rate fluctuations on monetary assets and liabilities denominated in currencies other than the individual business' functional currency.
Other Expense (Income), net
Other expense, net for 2019 was $98 million and other income, net for 2018 and 2017 was $25 million and $27 million, respectively. Other income (expense), net primarily includes the net periodic benefit cost for our retirement and postretirement plans. During the first quarter of 2019, the Company purchased a group annuity contract under which an insurance company assumed the Company’s obligation to pay pension benefits to approximately 4,600 retirees and beneficiaries. This purchase eliminates all future investment or mortality risk associated with these retirees. The purchase of this group annuity contract was funded with pension plan assets. As a result, the Company’s outstanding pension benefit obligation was reduced by approximately $370 million, representing approximately 24% of the total obligations of the Company’s qualified pension plans. In connection with this transaction, the Company recorded a pre-tax settlement charge of $113 million, reflecting the accelerated recognition of a portion of unamortized actuarial losses in the plan. The Company also recorded pension settlement charges of $5 million and $8 million in 2018 and 2017, respectively. Excluding these charges, other income, net was $14 million, $29 million and $35 million for 2019, 2018 and 2017, respectively. The decreases in other income, net in 2019 compared to 2018 and 2018 compared to 2017 were primarily due to a higher loss on investments.
Interest Expense, net
Net interest expense for 2019 increased $64 million or 48% as compared to 2018, primarily driven by costs associated with the early repayment of our 3.3% Senior Notes and a portion of our 6.55% Senior Notes. Excluding these costs, net interest expense increased $7 million or 5%, driven by the release of reserves for accrued interest related to the resolution of various tax audits in 2018.
Net interest expense for 2018 decreased $16 million or 10% as compared to 2017, driven by the release of reserves for accrued interest related to the resolution of various tax audits in 2018.
Provision for Income Taxes
Our effective tax rate was 21.4%, 20.9% and 33.4% for 2019, 2018 and 2017, respectively. The increase in 2019 was primarily due to an increase in accruals for potential tax liabilities for prior years in various jurisdictions. The decrease in 2018 was primarily due to the reduction of the U.S. federal corporate tax rate as a result of the enactment of the Tax Cuts and Jobs Act ("TCJA"). Additionally, a one-time net tax charge of $149 million due to the TCJA was recorded in 2017, which included tax expense of approximately $173 million on the deemed repatriation of foreign earnings and a tax benefit of approximately $24 million in respect of the re-valuation of the net U.S. deferred tax liabilities at the reduced corporate income tax rate.
Segment Review
Ratings
Ratings is an independent provider of credit ratings, research and analytics to investors, issuers and other market participants. Credit ratings are one of several tools investors can use when making decisions about purchasing bonds and other fixed income investments. They are opinions about credit risk and our ratings express our opinion about the ability and willingness of an issuer, such as a corporation or state or city government, to meet its financial obligations in full and on time. Our credit ratings can also relate to the credit quality of an individual debt issue, such as a corporate or municipal bond, and the relative likelihood that the issue may default.
Ratings disaggregates its revenue between transaction and non-transaction. Transaction revenue primarily includes fees associated with:
| • | ratings related to new issuance of corporate and government debt instruments, as well as structured finance debt instruments; |
| • | bank loan ratings; and |
| • | corporate credit estimates, which are intended, based on an abbreviated analysis, to provide an indication of our opinion regarding creditworthiness of a company which does not currently have a Ratings credit rating. |
Non-transaction revenue primarily includes fees for surveillance of a credit rating, annual fees for customer relationship-based pricing programs, fees for entity credit ratings and global research and analytics at CRISIL. Non-transaction revenue also includes an intersegment royalty charged to Market Intelligence for the rights to use and distribute content and data developed by Ratings. Royalty revenue for 2019, 2018 and 2017 was $118 million, $109 million and $100 million, respectively.
The following table provides revenue and segment operating profit information for the years ended December 31:
| (in millions) | Year ended December 31, | % Change | ||||||||||||||||
| 2019 | 2018 | 2017 | ’19 vs ’18 | ’18 vs ’17 | ||||||||||||||
| Revenue | $ | 3,106 | $ | 2,883 | $ | 2,988 | 8 | % | (4 | )% | ||||||||
| Transaction revenue 1 | $ | 1,577 | $ | 1,350 | $ | 1,515 | 17 | % | (11 | )% | ||||||||
| Non-transaction revenue 1 | $ | 1,529 | $ | 1,533 | $ | 1,473 | — | % | 4 | % | ||||||||
| % of total revenue: | ||||||||||||||||||
| Transaction revenue | 51 | % | 47 | % | 51 | % | ||||||||||||
| Non-transaction revenue | 49 | % | 53 | % | 49 | % | ||||||||||||
| U.S. revenue | $ | 1,745 | $ | 1,619 | $ | 1,716 | 8 | % | (6 | )% | ||||||||
| International revenue | $ | 1,361 | $ | 1,264 | $ | 1,272 | 8 | % | 1 | % | ||||||||
| % of total revenue: | ||||||||||||||||||
| U.S. revenue | 56 | % | 56 | % | 57 | % | ||||||||||||
| International revenue | 44 | % | 44 | % | 43 | % | ||||||||||||
| Operating profit 2 | $ | 1,763 | $ | 1,530 | $ | 1,517 | 15 | % | 1 | % | ||||||||
| % Operating margin | 57 | % | 53 | % | 51 | % |
| 1 | In 2019, we reevaluated our transaction and non-transaction revenue presentation which resulted in a reclassification from transaction revenue to non-transaction revenue of $27 million and $25 million for 2018 and 2017, respectively. |
| 2 | 2019 includes employee severance charges of $11 million. 2018 includes legal settlement expenses of $74 million and employee severance charges of $8 million. 2017 includes legal settlement expenses of $55 million and employee severance charges of $25 million. 2019 and 2018 includes amortization of intangibles from acquisitions of $2 million and 2017 includes amortization of intangibles from acquisitions of $4 million. |
2019
Revenue increased 8%, with a 1 percentage point unfavorable impact from foreign exchange rates, due to an increase in transaction revenue. Transaction revenue increased due to an increase in corporate bond ratings revenue primarily driven by higher corporate bond issuance in the U.S. and Europe mainly resulting from historically low borrowing costs, partially offset by lower bank loan ratings revenue driven by reduced U.S. issuance volumes. An increase in public finance revenue due to increased issuance also contributed to transaction revenue growth. Non-transaction revenue decreased less than 1% primarily due to the unfavorable impact from foreign exchange rates. Non-transaction revenue was unfavorably impacted by a decline in Ratings Evaluation Service activity, a decrease at CRISIL, primarily within the risk and analytics sector, and lower entity credit ratings revenue, and benefited from an increase in surveillance revenue and higher royalty revenue. Transaction and non-transaction revenue also benefited from improved contract terms across product categories.
Operating profit increased 15%, with a 2 percentage point unfavorable impact from foreign exchange rates. Excluding the impact of higher legal settlement expenses in 2018 of 5 percentage points, operating profit increased 10%. This increase was primarily due to the increase in revenue discussed above combined with a reduction in legal expenses, lower professional fees from increased leverage on the Global Technology Center and internal resources, partially offset by an increase in incentive costs and AWS cloud infrastructure spend.
2018
Revenue decreased 4% due to a decline in transaction revenue, partially offset by an increase in non-transaction revenue. Transaction revenue decreased due to a decline in corporate bond ratings revenue driven by lower corporate bond issuance in the U.S. and Europe, partially offset by an increase in structured finance revenue and bank loan ratings revenue. The increase in structured finance transaction revenue was driven by increased U.S. collateralized loan obligations ("CLO") issuance in the first half of the year. Non-transaction revenue grew due to an increase in surveillance revenue, higher entity credit ratings revenue, an increase in royalty revenue, and an increase in Ratings Evaluation Service activity. Transaction and non-transaction revenue benefited from improved contract terms across product categories.
Operating profit increased 1%, with a 3 percentage point favorable impact from foreign exchange rates. Excluding the impact of higher legal settlement expenses in 2018 of 6 percentage points, partially offset by the favorable impact of higher employee severance charges in 2017 of 5 percentage points and higher amortization of intangibles from acquisitions in 2017 of 1 percentage point, operating profit increased 1%. This increase was primarily due to the favorable impact of foreign exchange rates and a decrease in compensation costs related to lower incentive costs as well as the decreased headcount from attrition and prior year restructuring actions, partially offset by the decrease in revenue discussed above and an increase in costs related to the development of a global center for technology talent in India.
Market Issuance Volumes
We monitor market issuance volumes regularly within Ratings. Market issuance volumes noted within the discussion that follows are based on where an issuer is located or where the assets associated with an issue are located. Structured Finance issuance includes amounts when a transaction closes, not when initially priced and excludes domestically-rated Chinese issuance. The following tables depict changes in issuance levels as compared to the prior year based on data from SDC Platinum for Corporate bond issuance and based on a composite of external data feeds and Ratings' internal estimates for Structured Finance issuance.
| 2019 Compared to 2018 | ||||||
| **Corporate Bond Issuance *** | U.S. | Europe | Global | |||
| High-yield issuance | 58% | 35% | 51% | |||
| Investment-grade issuance | 14% | (2)% | 12% | |||
| Total issuance | 20% | 2% | 15% |
| * | Includes Industrials and Financial Services. |
| • | Corporate issuance was up in 2019 driven by double-digit increases in both high-yield and investment grade issuance. U.S. high-yield issuance increased as accommodating views from the U.S. Federal Reserve regarding interest rates throughout 2019 moved investors toward more fixed-rate debt. Strength was also seen in U.S. investment grade issuance as issuers were taking advantage of historically low borrowing costs. Increased issuance in Europe was driven by strength in high-yield issuance. Both high-yield and investment grade issuance comparisons also benefited from weakness in 2018 due to market volatility and slowing global economic growth. |
| 2019 Compared to 2018 | ||||||
| Structured Finance | U.S. | Europe | Global | |||
| Asset-backed securities (“ABS”) | (1)% | (14)% | —% | |||
| Structured credit (primarily CLOs) | (46)% | (30)% | (43)% | |||
| Commercial mortgage-backed securities (“CMBS”) | 26% | 17% | 23% | |||
| Residential mortgage-backed securities (“RMBS”) | 67% | 6% | 28% | |||
| Covered bonds | ** | (8)% | (10)% | |||
| Total issuance | (11)% | (10)% | (9)% |
** Represents no activity in 2019 and 2018.
| • | ABS issuance was down slightly in the U.S. reflecting a decline in student loan and credit card transactions and down in Europe primarily in auto transactions reflecting uncertainty caused by regulation introducing a new framework for simple, transparent and standardized ("STS") securitizations effective January 1, 2019. |
| • | Issuance was down in the U.S and European structured credit markets driven by a decline in CLO transactions. |
| • | CMBS issuance was up in the U.S. reflecting increased market volume caused by a decline in interest rates. CMBS issuance was also up in Europe driven by increased market volume. |
| • | RMBS issuance was up in the U.S. reflecting increased market volume primarily driven by nonqualified mortgages. RMBS issuance was also up in Europe reflecting increased market volume in the fourth quarter of 2019. |
| • | Covered bond (debt securities backed by mortgages or other high-quality assets that remain on the issuer's balance sheet) issuance in Europe was down driven by difficult market conditions in the third and fourth quarters of 2019. |
Industry Highlights and Outlook
Revenue increased in 2019 due to an increase in corporate bond ratings revenue primarily driven by higher corporate bond issuance in the U.S. and Europe. In 2019, Ratings continued to focus on international expansion particularly in China and published its first ratings in the domestic Chinese bond market. Additionally, Ratings launched ESG Evaluation in 2019. The ESG Evaluation is a cross-sector, relative analysis of an entity's ability to operate successfully in the future and optimize long-term stakeholder value in light of its natural and social environment and the quality of its governance.
In 2020, Ratings will continue to focus on strengthening analytical excellence to drive market relevance, leveraging new technology and data capabilities to transform its value chain, entering new high-potential geographies with innovative products and extending its strong analytical capabilities to new opportunities such as ESG and cybersecurity.
Legal and Regulatory Environment
General
Ratings and many of the securities that it rates are subject to extensive regulation in both the U.S. and in other countries, and therefore existing and proposed laws and regulations can impact the Company’s operations and the markets in which it operates. Additional laws and regulations have been adopted but not yet implemented or have been proposed or are being considered. In addition, in certain countries, governments may provide financial or other support to locally-based rating agencies. For example, governments may from time to time establish official rating agencies or credit ratings criteria or procedures for evaluating local issuers. We have reviewed the new laws, regulations and rules which have been adopted and we have implemented, or are planning to implement, changes as required. We do not believe that such new laws, regulations or rules will have a material adverse effect on our financial condition or results of operations. Other laws, regulations and rules relating to credit rating agencies are being considered by local, national, foreign and multinational bodies and are likely to continue to be considered in the future, including provisions seeking to reduce regulatory and investor reliance on credit ratings, remuneration and rotation of credit rating agencies, and liability standards applicable to credit rating agencies. The impact on us of the adoption of any such laws, regulations or rules remains uncertain, but could increase the costs and legal risks relating to Ratings’ rating activities, or adversely affect our ability to compete and/or our remuneration, or result in changes in the demand for credit ratings.
In the normal course of business both in the U.S. and abroad, Ratings (or the legal entities comprising Ratings) are defendants in numerous legal proceedings and are often the subject of government and regulatory proceedings, investigations and inquiries. Many of these proceedings, investigations and inquiries relate to the ratings activity of Ratings and are or have been brought by purchasers of rated securities. In addition, various government and self-regulatory agencies frequently make inquiries and conduct
investigations into Ratings’ compliance with applicable laws and regulations. Any of these proceedings, investigations or inquiries could ultimately result in adverse judgments, damages, fines, penalties or activity restrictions, which could adversely impact our consolidated financial condition, cash flows, business or competitive position.
U.S.
The businesses conducted by our Ratings segment are, in certain cases, regulated under the Credit Rating Agency Reform Act of 2006 (the “Reform Act”), the Dodd-Frank Wall Street Reform and Consumer Protection Act (the “Dodd Frank Act”), the Securities Exchange Act of 1934 (the “Exchange Act”) and/or the laws of the states or other jurisdictions in which they conduct business. The financial services industry is subject to the potential for increased regulation in the U.S.
S&P Global Ratings is a credit rating agency that is registered with the SEC as a Nationally Recognized Statistical Rating Organization (“NRSRO”). The SEC first began informally designating NRSROs in 1975 for use of their credit ratings in the determination of capital charges for registered brokers and dealers under the SEC’s Net Capital Rule. The Reform Act created a new SEC registration system for rating agencies that choose to register as NRSROs. Under the Reform Act, the SEC is given authority and oversight of NRSROs and can censure NRSROs, revoke their registration or limit or suspend their registration in certain cases. The rules implemented by the SEC pursuant to the Reform Act, the Dodd Frank Act and the Exchange Act address, among other things, prevention or misuse of material non-public information, conflicts of interest, documentation and assessment of internal controls, and improving transparency of ratings performance and methodologies. The public portions of the current version of S&P Global Ratings’ Form NRSRO are available on S&P Global Ratings’ website.
European Union
In the European Union ("EU"), the credit rating industry is registered and supervised through a pan-European regulatory framework which is a compilation of three sets of legislative actions. In 2009, the European Parliament passed a regulation (“CRA1”) that established an oversight regime for the credit rating industry in the EU, which became effective in 2010. CRA1 requires the registration, formal regulation and periodic inspection of credit rating agencies operating in the EU. Ratings was granted registration in October of 2011. In January of 2011, the EU established the European Securities and Markets Authority (“ESMA”), which, among other things, has direct supervisory responsibility for the registered credit rating industry throughout the EU.
Additional rules augmenting the supervisory framework for credit rating agencies went into effect in 2013. Commonly referred to as CRA3, these rules, among other things:
| • | impose various additional procedural requirements with respect to ratings of sovereign issuers; |
| • | require member states to adopt laws imposing liability on credit rating agencies for an intentional or grossly negligent failure to abide by the applicable regulations; |
| • | impose mandatory rotation requirements on credit rating agencies hired by issuers of securities for ratings of resecuritizations, which may limit the number of years a credit rating agency can issue ratings for such securities of a particular issuer; |
| • | impose restrictions on credit rating agencies or their shareholders if certain ownership thresholds are crossed; and |
| • | impose additional procedural and substantive requirements on the pricing of services. |
The financial services industry is subject to the potential for increased regulation in the EU.
Other Jurisdictions
Outside of the U.S. and the EU, regulators and government officials have also been implementing formal oversight of credit rating agencies. Ratings is subject to regulations in most of the foreign jurisdictions in which it operates and continues to work closely with regulators globally to promote the global consistency of regulatory requirements. Regulators in additional countries may introduce new regulations in the future. This includes the UK, in which the Financial Conduct Authority is establishing its own credit rating agencies oversight regime for its exit from the EU.
For a further discussion of competitive and other risks inherent in our Ratings business, see Item 1A, Risk Factors, in this Annual Report on Form 10-K. For a further discussion of the legal and regulatory environment in our Ratings business, see Note 13 - Commitments and Contingencies to the consolidated financial statements under Item 8, Consolidated Financial Statements and Supplementary Data, in this Annual Report on Form 10-K.
Market Intelligence
Market Intelligence's portfolio of capabilities is designed to help investment professionals, government agencies, corporations and universities track performance, generate alpha, identify investment ideas, understand competitive and industry dynamics, perform valuations and assess credit risk.
In March of 2019, we entered into an agreement to sell SPIAS, a business within our Market Intelligence segment, to GSAM. SPIAS provides non-discretionary investment advice across institutional sub-advisory and intermediary distribution channels globally. On July 1, 2019, we completed the sale of SPIAS to GSAM. During 2019, we recorded a pre-tax gain of $22 million ($12 million after-tax) in Gain on dispositions in the consolidated statement of income related to the sale of SPIAS.
Market Intelligence includes the following business lines:
| • | Desktop — a product suite that provides data, analytics and third-party research for global finance professionals, which includes the Market Intelligence Desktop (which are inclusive of the S&P Capital IQ and SNL Desktop products); |
| • | Data Management Solutions — integrated bulk data feeds and application programming interfaces that can be customized, which includes Compustat, GICS, Point In Time Financials and CUSIP; and |
| • | Credit Risk Solutions — commercial arm that sells Ratings' credit ratings and related data, analytics and research, which includes subscription-based offerings, RatingsDirect® and RatingsXpress®, and Credit Analytics. |
Subscription revenue at Market Intelligence is primarily derived from distribution of data, analytics, third-party research, and credit ratings-related information primarily through web-based channels, including Market Intelligence Desktop, RatingsDirect®, RatingsXpress®, and Credit Analytics. Non-subscription revenue at Market Intelligence is primarily related to certain advisory, pricing and analytical services.
The following table provides revenue and segment operating profit information for the years ended December 31:
| (in millions) | Year ended December 31, | % Change | ||||||||||||||||
| 2019 | 2018 | 2017 | ’19 vs ’18 | ’18 vs ’17 | ||||||||||||||
| Revenue | $ | 1,959 | $ | 1,833 | $ | 1,683 | 7 | % | 9 | % | ||||||||
| Subscription revenue | $ | 1,904 | $ | 1,773 | $ | 1,614 | 7 | % | 10 | % | ||||||||
| Non-subscription revenue | $ | 45 | $ | 40 | $ | 46 | 12 | % | (13 | )% | ||||||||
| Asset-linked fees | $ | 10 | $ | 20 | $ | 23 | (50 | )% | (14 | )% | ||||||||
| % of total revenue: | ||||||||||||||||||
| Subscription revenue | 97 | % | 97 | % | 96 | % | ||||||||||||
| Non-subscription revenue | 2 | % | 2 | % | 3 | % | ||||||||||||
| Asset-linked fees | 1 | % | 1 | % | 1 | % | ||||||||||||
| U.S. revenue | $ | 1,213 | $ | 1,180 | $ | 1,114 | 3 | % | 6 | % | ||||||||
| International revenue | $ | 746 | $ | 653 | $ | 569 | 14 | % | 14 | % | ||||||||
| % of total revenue: | ||||||||||||||||||
| U.S. revenue | 62 | % | 64 | % | 66 | % | ||||||||||||
| International revenue | 38 | % | 36 | % | 34 | % | ||||||||||||
| Operating profit 1 | $ | 607 | $ | 545 | $ | 457 | 11 | % | 19 | % | ||||||||
| % Operating margin | 31 | % | 30 | % | 27 | % |
| 1 | 2019 includes a gain on the disposition of SPIAS of $22 million, employee severance charges of $6 million and acquisition-related costs of $4 million. 2018 includes restructuring charges related to a business disposition and employee severance charges of $7 million. 2017 includes employee severance charges of $7 million and a non-cash disposition-related adjustment of $4 million. 2019, 2018 and 2017 includes amortization of intangibles from acquisitions of $75 million, $73 million and $71 million, respectively. |
2019
Revenue increased 7% and was favorably impacted by less than 1 percentage point from the net impact of recent acquisitions and a disposition. Excluding the impact of the acquisitions and disposition, increased revenue was driven by growth in annualized contract values in the Market Intelligence Desktop products, RatingsXpress®, RatingsDirect®, CUSIP and our data feed products within Data Management Solutions. Excluding the impact of the acquisitions and disposition favorably impacting Desktop revenue growth by 1 percentage point, revenue growth at Data Management Solutions, Credit Risk Solutions and Desktop was 11%, 9% and 4%, respectively. Both domestic and international revenue increased compared to 2018. In 2019, international revenue represented 38% of Market Intelligence's total revenue compared to 36% in 2018. Foreign exchange rates had an unfavorable impact of less than one percentage point. Revenue was favorably impacted by the acquisitions of 451 Research, LLC, Panjiva Inc. ("Panjiva") and the Rate Watch business ("RateWatch") in December of 2019, February of 2018 and June of 2018, respectively, and the transfer of Kensho revenue from Corporate in January of 2019, and unfavorably impacted by the disposition of SPIAS in July of 2019. See Note 1 - Nature of Operations and Basis of Presentation and Note 2 - Acquisitions and Divestitures to the Consolidated Financial Statements and Supplementary Data, in the Annual Report on Form 10-K for further discussion.
Operating profit increased 11%, with a 2 percentage point favorable impact from foreign exchange rates. Excluding the favorable impact of the gain on the disposition of SPIAS of 5 percentage points, partially offset by the unfavorable impact of acquisition-related costs in 2019 of 1 percentage point, operating profit increased 7%. The increase was primarily due to revenue growth, partially offset by higher technology costs, higher compensation costs primarily driven by additional headcount and an increase in intersegment royalties tied to annualized contract value growth.
2018
Revenue increased 9% and was favorably impacted by 1 percentage point from the impact of recent acquisitions. Excluding acquisitions, the revenue increase was driven by growth in annualized contract values in the Market Intelligence Desktop, RatingsXpress® and RatingsDirect® products. Increases in annualized contract value for certain of our data feed products within Data Management Solutions also contributed to revenue growth. Both domestic and international revenue increased compared to 2017. In 2018, international revenue represented 36% of Market Intelligence's total revenue compared to 34% in 2017.
Operating profit increased 19%, with a 3 percentage point favorable impact from foreign exchange rates. Excluding the favorable impact of a non-cash disposition-related adjustment in 2017 of 8 percentage points and higher employee severance charges in 2017 of 2 percentage points, partially offset by the unfavorable impact of higher amortization in 2018 of 5 percentage points and disposition-related costs in 2018 of 2 percentage points, operating profit increased 16%. The increase was primarily due to revenue growth, partially offset by an increase in intersegment royalties tied to annualized contract value growth and increased data costs, and higher compensation costs driven by additional headcount partially related to the acquisitions of Panjiva in February of 2018 and Rate Watch in June of 2018.
Industry Highlights and Outlook
In 2019, Market Intelligence launched unique technology innovations including Textual Data Analytics, Kensho's Scribe and several ESG-related offerings. Textual Data Analytics, launched on XpressfeedTM, provides sentiment scores and behavioral metrics derived from earnings call transcripts. Kensho's Scribe is a speech recognition solution specifically optimized for financial audio. In 2019, Market Intelligence continued to develop its desktop platform by enhancing its product offerings and developing its analytical capabilities. In 2020, Market Intelligence will continue to focus on leveraging its strong content heritage to expand the core business, streamlining and enriching the customer experience across all delivery platforms, and harnessing new data sources and technology to extend into new geographies and growth areas such as ESG.
Legal and Regulatory Environment
The financial services industry is subject to the potential for increased regulation in the U.S. and abroad. Market Intelligence operates investment advisory businesses that are regulated in the U.S. under the U.S. Investment Advisers Act of 1940 (the “Investment Advisers Act”) and/or the laws of the states or other jurisdictions in which they conduct business.
Market Intelligence operates a business that is authorized and regulated in the United Kingdom by the Financial Conduct Authority (the “FCA”). As such, this business is authorized to arrange and advise on investments, and is also entitled to exercise a passport right to provide specified cross border services into other European Economic Area (“EEA”) States, and is to the conditions under the E.U. Markets in Financial Instruments Directive (“MiFID”).
The markets for research and investment advisory services are very competitive. Market Intelligence competes domestically and internationally on the basis of a number of factors, including the quality of its research and advisory services, client service, reputation, price, geographic scope, range of products and services, and technological innovation. For a further discussion of competitive and other risks inherent in our Market Intelligence business, see Item 1A, Risk Factors, in this Annual Report on Form 10-K.
European Union
The EU enacted a package of legislative measures known as MiFID II ("MiFID II"), which revises and updates the existing EU Markets in Financial Instruments Directive framework, and the substantive provisions became applicable in all EU Member States as of January 3, 2018. MiFID II includes provisions that, among other things: (i) impose new conditions and requirements on the licensing of benchmarks and provide for non-discriminatory access to exchanges and clearing houses; (ii) modify the categorization and treatment of certain classes of derivatives; (iii) expand the categories of trading venue that are subject to regulation; (iv) require the unbundling of investment research and direct how asset managers pay for research either out of a research payment account or from a firm’s profits; and (v) provide for the mandatory trading of certain derivatives on exchanges (complementing the mandatory derivative clearing requirements in the EU Market Infrastructure Regulation of 2011). Although the MiFID II package is “framework” legislation (meaning that much of the detail of the rules will be set out in subordinate measures, including some technical standards yet to be adopted by the European Commission), the introduction of the MiFID II package may result in changes to the manner in which Market Intelligence licenses its price certain products. MiFID II may impose regulatory burdens on Market Intelligence activities in the EU, although the exact impact and costs are not yet known.
Platts
Platts is the leading independent provider of information and benchmark prices for the commodity and energy markets. Platts provides essential price data, analytics, and industry insight enabling the commodity and energy markets to perform with greater transparency and efficiency.
On July 31, 2019, we completed the sale of RigData, a business within our Platts segment, to Drilling Info, Inc. RigData is a provider of daily information on rig activity for the natural gas and oil markets across North America. During 2019, we recorded a pre-tax gain of $27 million ($26 million after-tax) in Gain on dispositions in the consolidated statement of income related to the sale of RigData.
Platts' revenue is generated primarily through the following sources:
| • | Subscription revenue — primarily from subscriptions to our real-time news, market data and price assessments, along with other information products; |
| • | Sales usage-based royalties — primarily from licensing of our proprietary market price data and price assessments to commodity exchanges, and |
| • | Non-subscription revenue — conference sponsorship, consulting engagements, and events. |
| (in millions) | Year ended December 31, | % Change | ||||||||||||||||
| 2019 | 2018 | 2017 | ’19 vs ’18 | ’18 vs ’17 | ||||||||||||||
| Revenue | $ | 844 | $ | 815 | $ | 774 | 4 | % | 5 | % | ||||||||
| Subscription revenue | $ | 774 | $ | 750 | $ | 704 | 3 | % | 6 | % | ||||||||
| Sales usage-based royalties | $ | 60 | $ | 54 | $ | 57 | 11 | % | (5 | )% | ||||||||
| Non-subscription revenue | $ | 10 | $ | 11 | $ | 13 | (5 | )% | (12 | )% | ||||||||
| % of total revenue: | ||||||||||||||||||
| Subscription revenue | 92 | % | 92 | % | 91 | % | ||||||||||||
| Sales usage-based royalties | 7 | % | 7 | % | 7 | % | ||||||||||||
| Non-subscription revenue | 1 | % | 1 | % | 2 | % | ||||||||||||
| U.S. revenue | $ | 281 | $ | 283 | $ | 284 | — | % | — | % | ||||||||
| International revenue | $ | 563 | $ | 532 | $ | 490 | 6 | % | 9 | % | ||||||||
| % of total revenue: | ||||||||||||||||||
| U.S. revenue | 33 | % | 35 | % | 37 | % | ||||||||||||
| International revenue | 67 | % | 65 | % | 63 | % | ||||||||||||
| Operating profit 1 | $ | 438 | $ | 383 | $ | 326 | 15 | % | 18 | % | ||||||||
| % Operating margin | 52 | % | 47 | % | 42 | % |
| 1 | 2019 includes a gain on the disposition of RigData of $27 million and employee severance charges of $1 million. 2017 includes a non-cash acquisition-related adjustment of $11 million, a charge to exit a leased facility of $6 million, an asset write-off of $2 million and employee severance charges of $2 million. 2019 includes amortization of intangibles from acquisitions of $12 million and both 2018 and 2017 includes amortization of intangibles from acquisitions of $18 million. |
2019
Revenue increased 4% and was unfavorably impacted by less than 1 percentage point from the net impact of recent acquisitions and a disposition. Excluding the acquisitions and disposition, revenue increased due to continued demand for market data and price assessment products driven by both expanded product offerings to our existing customers combined with enhanced contract terms. Additionally, revenue growth was driven by an increase in sales usage-based royalties from the licensing of our proprietary market price data and price assessments to commodity exchanges mainly due to increased trading volumes in Iron Ore, LNG and Gasoil. Demand for market data and price assessment products was driven by international customers. International revenue increased and domestic revenue, which was unfavorably impacted by the disposition of RigData in July of 2019, remained relatively unchanged compared to 2018. In 2019, international revenue represented 67% of Platts total revenue compared to 65% in 2018. Petroleum continues to be the most significant revenue driver, followed by power & gas, metals and petrochemicals also contributing to revenue growth. Foreign exchange rates had an unfavorable impact of less than 1 percentage point. Revenue was unfavorably impacted by the disposition of RigData in July of 2019 and favorably impacted by the acquisitions of Live Rice Index and Enerdata in August of 2019 and September of 2019, respectively. See Note 2 - Acquisitions and Divestitures to the Consolidated Financial Statements and Supplementary Data, in the Annual Report on Form 10-K for further discussion.
Operating profit increased 15% with a 2 percentage point favorable impact from foreign exchange rates. Excluding the favorable impact of the gain on the disposition of RigData of 7 percentage points and lower amortization of intangibles in 2019 of 2 percentage points, operating profit increased 6%. The increase was primarily due to revenue growth, partially offset by an increase in operating costs to support revenue growth and business initiatives at Platts, including Asia expansion initiatives, an increase in compensation costs due to annual merit increases and increased headcount, higher technology costs, an increase in the bad debt provision in the current year and one-time costs related to the discontinuation of a product line at Platts.
2018
Revenue increased 5% due to continued demand for market data and price assessment products across all commodity sectors, led by petroleum, partially offset by a decrease in sales usage-based royalties from the licensing of our proprietary market price data and price assessments to commodity exchanges mainly due to a decline in oil trading volumes in the first nine months of 2018.
Demand for market data and price assessment products was driven by international customers. While petroleum is still the biggest revenue driver, the proportional revenue mix continues to become more diversified as other sectors contributed to revenue growth including petrochemicals, metals and agriculture. International revenue increased and domestic revenue remained relatively unchanged compared to 2017. In 2018, international revenue represented 65% of Platts total revenue compared to 63% in 2017.
Operating profit increased 18%. Excluding the favorable impact of a non-cash acquisition-related adjustment in 2017 of 4 percentage points, a charge to exit a leased facility in 2017 of 2 percentage points, an asset write-off in 2017 of 1 percentage point and employee severance charges in 2017 of 1 percentage point, operating profit increased 10%, with the increase largely driven by revenue growth.
Industry Highlights and Outlook
In 2019, sustained demand for market data and price assessment products, led by petroleum, continued to drive revenue growth. Revenue also increased from the licensing of our proprietary market price data and price assessments to commodity exchanges driven by higher trading volumes. In 2019, Platts continued to drive commercial transformation by enhancing and simplifying the customer experience. Additionally, Platts focused on expanding its capabilities in Asia. In 2020, Platts will continue to focus on extending the core business through innovation, simplifying its product and platform strategy, and driving commercial transformation.
Legal and Regulatory Environment
Platts’ commodities price assessment and information business is subject to increasing regulatory scrutiny in the U.S. and abroad. As discussed below under the heading “Indices-Legal and Regulatory Environment”, the financial benchmarks industry is subject to the new benchmark regulation in the EU (the “EU Benchmark Regulation”) as well as potential increased regulation in other jurisdictions. Platts has obtained authorization and is now supervised by the Dutch Authority for the Financial Markets in the Netherlands under the EU Benchmark Regulation, and may need to take similar steps in other jurisdictions including the United Kingdom post-Brexit and jurisdictions outside of Europe if they pass similar legislation. For a further discussion of competitive and other risks inherent in our Platts business, see Item 1A, Risk Factors, in this Annual Report on Form 10-K.
European Union
The EU has enacted MiFID II, which revise and update the existing EU Markets in Financial Instruments Directive and the substantive provisions became applicable in all EU Member States as of January 3, 2018. MiFID II includes provisions that, among other things: (i) impose new conditions and requirements on the licensing of benchmarks and provide for non-discriminatory access to exchanges and clearing houses; (ii) modify the categorization and treatment of certain classes of derivatives; (iii) expand the categories of trading venue that are subject to regulation; (iv) require the unbundling of investment research and direct how asset managers pay for research either out of a research payment account or from a firm’s profits; and (v) provide for the mandatory trading of certain derivatives on exchanges (complementing the mandatory derivative clearing requirements in the E.U. Market Infrastructure Regulation of 2011). Although the MiFID II package is “framework” legislation (meaning that much of the detail of the rules will be set out in subordinate measures, including some technical standards yet to be adopted by the European Commission), the introduction of the MiFID II package may result in changes to the manner in which Platts licenses its price assessments. MiFID II and the Market Abuse Regulation ("MAR") may impose additional regulatory burdens on Platts activities in the EU, although the exact impact and costs are not yet known.
In October of 2012, IOSCO issued its Principles for Oil Price Reporting Agencies ("PRA Principles"), which are intended to enhance the reliability of oil price assessments referenced in derivative contracts subject to regulation by IOSCO members. Platts has aligned its operations with the PRA Principles and, as recommended by IOSCO in its final report on the PRA Principles, has aligned to the PRA Principles for other commodities for which it publishes benchmarks.
Indices
Indices is a global index provider maintaining a wide variety of indices to meet an array of investor needs. Indices’ mission is to provide transparent benchmarks to help with decision making, collaborate with the financial community to create innovative products, and provide investors with tools to monitor world markets.
Indices primarily derives revenue from asset-linked fees based on the S&P and Dow Jones indices and to a lesser extent generates subscription revenue and sales-usage based royalties. Specifically, Indices generates revenue from the following sources:
| • | Investment vehicles — asset-linked fees such as ETFs and mutual funds, that are based on the S&P Dow Jones Indices' benchmarks and generate revenue through fees based on assets and underlying funds; |
| • | Exchange traded derivatives — generate sales usage-based royalties based on trading volumes of derivatives contracts listed on various exchanges; |
| • | Index-related licensing fees — fixed or variable annual and per-issue asset-linked fees for over-the-counter derivatives and retail-structured products; and |
| • | Data and customized index subscription fees — fees from supporting index fund management, portfolio analytics and research. |
The following table provides revenue and segment operating profit information for the years ended December 31:
| (in millions) | Year ended December 31, | % Change | ||||||||||||||
| 2019 | 2018 | 2017 | ’19 vs ’18 | ’18 vs ’17 | ||||||||||||
| Revenue | $ | 918 | $ | 837 | $ | 728 | 10% | 15% | ||||||||
| Asset-linked fees | $ | 613 | $ | 522 | $ | 461 | 18% | 13% | ||||||||
| Subscription revenue | $ | 165 | $ | 144 | $ | 136 | 14% | 6% | ||||||||
| Sales usage-based royalties | $ | 140 | $ | 171 | $ | 131 | (18)% | 30% | ||||||||
| % of total revenue: | ||||||||||||||||
| Asset-linked fees | 67 | % | 62 | % | 63 | % | ||||||||||
| Subscription revenue | 18 | % | 17 | % | 19 | % | ||||||||||
| Sales usage-based royalties | 15 | % | 21 | % | 18 | % | ||||||||||
| U.S. revenue | $ | 772 | $ | 719 | $ | 601 | 7% | 20% | ||||||||
| International revenue | $ | 146 | $ | 118 | $ | 127 | 24% | (7)% | ||||||||
| % of total revenue: | ||||||||||||||||
| U.S. revenue | 84 | % | 86 | % | 83 | % | ||||||||||
| International revenue | 16 | % | 14 | % | 17 | % | ||||||||||
| Operating profit 1 | $ | 630 | $ | 563 | $ | 478 | 12% | 18% | ||||||||
| Less: net income attributable to noncontrolling interests | $ | 170 | $ | 151 | $ | 129 | 12% | 17% | ||||||||
| Net operating profit | $ | 460 | $ | 412 | $ | 349 | 12% | 18% | ||||||||
| % Operating margin | 69 | % | 67 | % | 66 | % | ||||||||||
| % Net operating margin | 50 | % | 49 | % | 48 | % |
| 1 | 2019, 2018 and 2017 includes amortization of intangibles from acquisitions of $6 million. |
2019
Revenue increased 10% due to higher levels of assets under management ("AUM") for ETFs and mutual funds. Additionally, revenue was favorably impacted by the buyout of the balance of intellectual property rights in a family of indices from one of our co-marketing and index development partners in the fourth quarter of 2018, retrospective fees for previously unlicensed and unreported index usage and benefits related to contract renegotiations. These increases were partially offset by a decrease in exchange-traded derivatives revenue primarily driven by lower volumes in 2019. Ending AUM for ETFs increased 30% to $1.701 trillion in 2019 and average AUM for ETFs increased 8% to $1.508 trillion compared to 2018. Foreign exchange rates had an unfavorable impact of less than 1 percentage point.
Operating profit grew 12%. The impact of revenue growth was partially offset by higher operating costs from increased royalties due to increased traction of royalty-based products, higher legal expenses and increased compensation costs primarily driven by additional headcount, partially offset by lower incentive costs. Foreign exchange rates had a favorable impact of less than 1 percentage point.
2018
Revenue increased 15%, primarily driven by higher AUM for ETFs and mutual funds, and higher exchange-traded derivative volumes due to market volatility. Average AUM for ETFs increased 20% to $1.399 trillion compared to 2017. Ending AUM for ETFs decreased 3% to $1.309 trillion compared to 2017 driven by the impact of market depreciation in the fourth quarter of 2018. Foreign exchange rates had an unfavorable impact of less than 1 percentage point.
Operating profit grew 18%. The impact of revenue growth was partially offset by higher operating costs to support revenue growth and business initiatives at Indices and higher compensation costs from additional headcount. Foreign exchange rates had an unfavorable impact of less than 1 percentage point.
Industry Highlights and Outlook
Indices continues to be the leading index provider for the ETF market space. In 2019, higher average levels of AUM for ETFs contributed to revenue growth. In 2019, Indices continued to launch innovative indices, expand index product offerings and grow international partnerships. In 2020, Indices will continue to focus on growing the core business, expanding innovative offerings with focus on differentiated solutions such as factor, multi-asset-class, and ESG indices, and growing globally through collaborative client relationships.
Legal and Regulatory Environment
Over the past four years the financial benchmarks industry has been subject to specific benchmark regulation in the European Union (the "EU Benchmark Regulation") and Australia (the "Australia Benchmark Regulation"). Other jurisdictions are also considering new regulation for financial benchmarks.
The EU Benchmark Regulation was published June 30, 2016 and included provisions applicable to Indices and Platts, which became effective January 1, 2018. Both Indices and Platts have established separate benchmark administrators in connection with their benchmark activities in Europe. The Indices and Platts entities are both based in Amsterdam and are authorized by the Netherlands Authority for Financial Markets (AFM). This legislation will likely cause additional operating obligations but they are not expected to be material at this time, although the exact impact remains unclear.
The Australian Benchmark Regulation was enacted in June of 2018 and included provisions applicable to Indices, designating the S&P ASX 200 a significant financial benchmark and therefore requiring Indices to obtain a license from the Australian Investment and Securities Commission (“ASIC”) as its administrator. Indices is in the process of obtaining such license. Although narrower in scope, the requirements of the Australian Benchmark Regulation are similar to those of the EU Benchmark Regulation. This legislation will likely cause additional operating obligations but they are not expected to be material at this time, although the exact impact remains unclear.
In July of 2013, the IOSCO issued Financial Benchmark Principles (IOSCO Principles), intended to promote the reliability of financial benchmark determinations. The IOSCO Principles address governance, benchmark quality and accountability mechanisms, including with regard to the indices published by Indices. Even though the IOSCO Principles are not binding law, Indices has taken steps to align its governance regime and operations with the IOSCO Principles and engaged an independent auditor to perform an annual reasonable assurance review of such alignment.
The markets for index providers are very competitive. Indices competes domestically and internationally on the basis of a number of factors, including the quality of its benchmark indices, client service, reputation, price, range of products and services (including geographic coverage) and technological innovation. Our Indices business is impacted by market volatility, asset levels of investment products tracking indices, and trading volumes of certain exchange traded derivatives. Volatile capital markets, as well as changing investment styles, among other factors, may influence an investor’s decision to invest in and maintain an investment in an index-linked investment product. For a further discussion of competitive and other risks inherent in our Indices business, see Item 1A, Risk Factors, in this Annual Report on Form 10-K.
LIQUIDITY AND CAPITAL RESOURCES
We continue to maintain a strong financial position. Our primary source of funds for operations is cash from our businesses and our core businesses have been strong cash generators. In 2020, cash on hand, cash flows from operations and availability under our existing credit facility are expected to be sufficient to meet any additional operating and recurring cash needs into the foreseeable future. We use our cash for a variety of needs, including but not limited to: ongoing investments in our businesses, strategic acquisitions, share repurchases, dividends, repayment of debt, capital expenditures and investment in our infrastructure.
Cash Flow Overview
Cash, cash equivalents, and restricted cash were $2.9 billion as of December 31, 2019, an increase of $0.9 billion as compared to December 31, 2018.
| (in millions) | Year ended December 31, | |||||||||||
| 2019 | 2018 | 2017 | ||||||||||
| Net cash provided by (used for): | ||||||||||||
| Operating activities | $ | 2,776 | $ | 2,064 | $ | 2,016 | ||||||
| Investing activities | (131 | ) | (513 | ) | (209 | ) | ||||||
| Financing activities | (1,751 | ) | (2,288 | ) | (1,507 | ) |
In 2019, free cash flow increased to $2.5 billion compared to $1.8 billion in 2018. Free cash flow is a non-GAAP financial measure and reflects our cash flow provided by operating activities less capital expenditures and distributions to noncontrolling interest holders. Capital expenditures include purchases of property and equipment and additions to technology projects. See “Reconciliation of Non-GAAP Financial Information” below for a reconciliation of cash flow provided by operating activities, the most directly comparable U.S. GAAP financial measure, to free cash flow and free cash flow excluding certain items.
Operating activities
Cash provided by operating activities increased to $2.8 billion in 2019 as compared to $2.1 billion in 2018. The increase is mainly due to higher results from operations, lower incentive compensation payments and lower legal settlement payments in 2019.
Cash provided by operating activities increased to $2.1 billion in 2018 as compared to $2.0 billion in 2017. The increase is mainly due to higher results from operations in 2018 and lower estimated income tax payments in 2018 due to the reduction of the U.S. federal corporate tax rate as a result of the enactment of the TCJA, partially offset by legal settlement payments and settlement payments following the resolution of tax audits.
Investing activities
Our cash outflows from investing activities are primarily for acquisitions and capital expenditures, while cash inflows are primarily proceeds from dispositions.
Cash used for investing activities decreased to $0.1 billion for 2019 as compared to $0.5 billion in 2018, primarily due to cash used for the acquisition of Kensho and the purchase of intellectual property in 2018.
Cash used for investing activities increased to $0.5 billion for 2018 as compared to $0.2 billion in 2017, primarily due to cash used for the acquisition of Kensho and the purchase of intellectual property in 2018.
Refer to Note 2 – Acquisitions and Divestitures to the Consolidated Financial Statements and Supplementary Data, in the Annual Report on Form 10-K for further information.
Financing activities
Our cash outflows from financing activities consist primarily of share repurchases, dividends and repayment of short-term and long-term debt, while cash inflows are primarily inflows from long-term and short-term debt borrowings and proceeds from the exercise of stock options.
Cash used for financing activities decreased to $1.8 billion in 2019 from $2.3 billion in 2018. The decrease is primarily attributable to higher cash paid for share repurchases in 2018 and proceeds from the issuance of senior notes in 2019.
Cash used for financing activities increased to $2.3 billion in 2018 from $1.5 billion in 2017. The increase is primarily attributable to higher cash paid for share repurchases in 2018.
During 2019, we received 5.9 million shares, including 0.4 million shares received in January of 2019 related to our October 29, 2018 accelerated share repurchase ("ASR") agreement, resulting in $1,240 million of cash used to repurchase shares. We entered into an ASR agreement with a financial institution on August 5, 2019 to initiate share repurchases aggregating $500 million. We repurchased a total of 2.0 million shares under the ASR agreement for an average purchase price of $253.36 per share. We entered into an ASR agreement with a financial institution on February 11, 2019 to initiate share repurchases aggregating $500 million. We repurchased a total of 2.3 million shares under the ASR agreement for an average purchase price of $214.65 per share.
During 2018, we used cash to repurchase 8.4 million shares for $1.7 billion. We entered into an ASR agreement with a financial institution on October 29, 2018 to initiate share repurchases aggregating $500 million. We repurchased a total of 2.9 million shares under the ASR agreement for an average purchase price of $173.80 per share. We entered into an ASR agreement with a financial institution on March 6, 2018 to initiate share repurchases aggregating $1 billion. We repurchased a total of 5.1 million shares under that ASR agreement for an average purchase price of $197.49 per share.
During 2017, we used cash to repurchase 6.8 million shares for $1.0 billion. We entered into an ASR agreement with a financial institution on August 1, 2017 to initiate share repurchases aggregating $500 million. We repurchased a total of 3.2 million shares under the ASR agreement for an average purchase price of $154.46 per share.
On December 4, 2013, the Board of Directors approved a share repurchase program authorizing the purchase of up to 50 million shares, which was approximately 18% of the total shares of our outstanding common stock at that time. Our current repurchase program has no expiration date and purchases under this program may be made from time to time on the open market and in private transactions, depending on market conditions. As of December 31, 2019, 4.7 million shares remained available under our current repurchase program.
See Note 9 — Equity to the Consolidated Financial Statements and Supplementary Data, in the Annual Report on Form 10-K for further discussion related to our ASR agreements.
Additional Financing
We have the ability to borrow a total of $1.2 billion through our commercial paper program, which is supported by our revolving $1.2 billion five-year credit agreement (our "credit facility") that we entered into on June 30, 2017. This credit facility will terminate on June 30, 2022. There were no commercial paper borrowings outstanding as of December 31, 2019 and 2018.
Depending on our corporate credit rating, we pay a commitment fee of 8 to 17.5 basis points for our credit facility, whether or not amounts have been borrowed. We currently pay a commitment fee of 10 basis points. The interest rate on borrowings under our credit facility is, at our option, calculated using rates that are primarily based on either the prevailing London Inter-Bank Offer Rate, the prime rate determined by the administrative agent or the Federal Funds Rate. For certain borrowings under this credit facility, there is also a spread based on our corporate credit rating.
Our credit facility contains certain covenants. The only financial covenant requires that our indebtedness to cash flow ratio, as defined in our credit facility, is not greater than 4 to 1, and this covenant level has never been exceeded.
On November 1, 2019, Fitch Ratings upgraded our short-term/commercial paper rating to F1 from F2, affirmed our long-term debt rating and the ratings outlook was maintained at stable.
Dividends
On January 29, 2020, the Board of Directors approved an increase in the quarterly common stock dividend from $0.57 per share to $0.67 per share.
Contractual Obligations
We typically have various contractual obligations, which are recorded as liabilities in our consolidated balance sheets, while other items, such as certain purchase commitments and other executory contracts, are not recognized, but are disclosed herein. For example, we are contractually committed to contracts for information-technology outsourcing, certain enterprise-wide information-technology software licensing and maintenance.
We believe that the amount of cash and cash equivalents on hand, cash flow expected from operations and availability under our credit facility will be adequate for us to execute our business strategy and meet anticipated requirements for lease obligations, capital expenditures, working capital and debt service for 2020.
The following table summarizes our significant contractual obligations and commercial commitments as of December 31, 2019, over the next several years. Additional details regarding these obligations are provided in the notes to our consolidated financial statements, as referenced in the footnotes to the table:
| (in millions) | Less than 1 Year | 1-3 Years | 3-5 Years | More than 5 Years | Total | ||||||||||||||
| Debt: 1 | |||||||||||||||||||
| Principal payments | $ | — | $ | — | $ | — | $ | 3,948 | $ | 3,948 | |||||||||
| Interest payments | $ | 156 | $ | 313 | $ | 313 | $ | 1,414 | $ | 2,196 | |||||||||
| Operating leases 2 | $ | 133 | $ | 211 | $ | 147 | $ | 358 | $ | 849 | |||||||||
| Purchase obligations and other 3 | $ | 91 | $ | 98 | $ | 69 | $ | 70 | $ | 328 | |||||||||
| Total contractual cash obligations | $ | 380 | $ | 622 | $ | 529 | $ | 5,790 | $ | 7,321 |
| 1 | Our debt obligations are described in Note 5 – Debt to our consolidated financial statement. |
| 2 | See Note 13 – Commitments and Contingencies to our consolidated financial statements for further discussion on our operating lease obligations. |
| 3 | Other consists primarily of commitments for unconditional purchase obligations in contracts for information-technology outsourcing and certain enterprise-wide information-technology software licensing and maintenance. |
As of December 31, 2019, we had $124 million of liabilities for unrecognized tax benefits. We have excluded the liabilities for unrecognized tax benefits from our contractual obligations table because, until formal resolutions are reached, reasonable estimates of the timing of cash settlements with the respective taxing authorities are not practicable.
As of December 31, 2019, we have recorded $2,268 million for our redeemable noncontrolling interest in our S&P Dow Jones Indices LLC partnership discussed in Note 9 – Equity to our consolidated financial statements. Specifically, this amount relates to the put option under the terms of the operating agreement of S&P Dow Jones Indices LLC, whereby, after December 31, 2017, CME Group and CME Group Index Services LLC ("CGIS") has the right at any time to sell, and we are obligated to buy, at least 20% of their share in S&P Dow Jones Indices LLC. We have excluded this amount from our contractual obligations table because we are uncertain as to the timing and the ultimate amount of the potential payment we may be required to make.
We make contributions to our pension and postretirement plans in order to satisfy minimum funding requirements as well as additional contributions that we consider appropriate to improve the funded status of our plans. During 2019, we contributed $46 million to our retirement plans. Expected employer contributions in 2020 are $11 million and $5 million for our retirement and postretirement plans, respectively. In 2020, we may elect to make additional non-required contributions depending on investment performance and the pension plan status. See Note 7 – Employee Benefits to our consolidated financial statements for further discussion.
Off-Balance Sheet Arrangements
As of December 31, 2019 and 2018, we did not have any material relationships with unconsolidated entities, such as entities often referred to as specific purpose or variable interest entities where we are the primary beneficiary, which would have been established for the purpose of facilitating off-balance sheet arrangements or other contractually narrow or limited purposes. As such we are not exposed to any financial liquidity, market or credit risk that could arise if we had engaged in such relationships.
RECONCILIATION OF NON-GAAP FINANCIAL INFORMATION
Free cash flow is a non-GAAP financial measure and reflects our cash flow provided by operating activities less capital expenditures and distributions to noncontrolling interest holders. Capital expenditures include purchases of property and equipment and additions to technology projects. Our cash flow provided by operating activities is the most directly comparable U.S. GAAP financial measure to free cash flow. Additionally, we have considered certain items in evaluating free cash flow, which are included in the table below.
We believe the presentation of free cash flow and free cash flow excluding certain items allows our investors to evaluate the cash generated from our underlying operations in a manner similar to the method used by management. We use free cash flow to conduct and evaluate our business because we believe it typically presents a more conservative measure of cash flows since capital expenditures and distributions to noncontrolling interest holders are considered a necessary component of ongoing operations. Free cash flow is useful for management and investors because it allows management and investors to evaluate the cash available to us to prepay debt, make strategic acquisitions and investments and repurchase stock.
The presentation of free cash flow and free cash flow excluding certain items are not intended to be considered in isolation or as a substitute for the financial information prepared and presented in accordance with U.S. GAAP. Free cash flow, as we calculate it, may not be comparable to similarly titled measures employed by other companies. The following table presents a reconciliation of our cash flow provided by operating activities to free cash flow excluding the impact of the items below:
| (in millions) | Year ended December 31, | % Change | ||||||||||||||
| 2019 | 2018 | 2017 | ’19 vs ’18 | ’18 vs ’17 | ||||||||||||
| Cash provided by operating activities | $ | 2,776 | $ | 2,064 | $ | 2,016 | 34% | 2% | ||||||||
| Capital expenditures | (115 | ) | (113 | ) | (123 | ) | ||||||||||
| Distributions to noncontrolling interest holders, net 1 | (143 | ) | (154 | ) | (111 | ) | ||||||||||
| Free cash flow | $ | 2,518 | $ | 1,797 | $ | 1,782 | 40% | 1% | ||||||||
| Settlement of prior-year tax audits | 51 | 73 | — | |||||||||||||
| Tax on gain from sale of SPIAS and RigData | 13 | — | — | |||||||||||||
| Tax on gain from sale of SPSE and CMA | — | — | 67 | |||||||||||||
| Payment of legal settlements | 1 | 180 | 4 | |||||||||||||
| Tax benefit from legal settlements | — | (44 | ) | (2 | ) | |||||||||||
| Free cash flow excluding above items | $ | 2,583 | $ | 2,006 | $ | 1,851 | 29% | 8% |
1 Distributions to noncontrolling interest holders is net of amounts owed to the S&P Dow Jones Indices LLC joint venture by the noncontrolling interest holders.
| (in millions) | 2019 | 2018 | 2017 | ’19 vs ’18 | ’18 vs ’17 | ||||||||
| Cash used for investing activities | (131 | ) | (513 | ) | (209 | ) | (75 | )% | NM | ||||
| Cash used for financing activities | (1,751 | ) | (2,288 | ) | (1,507 | ) | (23 | )% | 52% |
N/M - not meaningful
CRITICAL ACCOUNTING ESTIMATES
Our discussion and analysis of our financial condition and results of operations is based upon our consolidated financial statements, which have been prepared in accordance with U.S. GAAP. The preparation of these financial statements requires us to make estimates and judgments that affect the reported amounts of assets, liabilities, revenues and expenses and related disclosure of contingent assets and liabilities.
On an ongoing basis, we evaluate our estimates and assumptions, including those related to revenue recognition, allowance for doubtful accounts, valuation of long-lived assets, goodwill and other intangible assets, pension plans, incentive compensation and stock-based compensation, income taxes, contingencies and redeemable noncontrolling interests. We base our estimates on historical experience, current developments and on various other assumptions that we believe to be reasonable under these circumstances, the results of which form the basis for making judgments about carrying values of assets and liabilities that cannot readily be determined from other sources. There can be no assurance that actual results will not differ from those estimates.
Management considers an accounting estimate to be critical if it required assumptions to be made that were uncertain at the time the estimate was made and changes in the estimate or different estimates could have a material effect on our results of operations. Management has discussed the development and selection of our critical accounting estimates with the Audit Committee of our Board of Directors. The Audit Committee has reviewed our disclosure relating to them in this MD&A.
We believe the following critical accounting policies require us to make significant judgments and estimates in the preparation of our consolidated financial statements:
Revenue recognition
We adopted Financial Accounting Standards Board Accounting Standards Codification ("ASC") 606 "Revenue from Contracts with Customers" using the modified retrospective transition method applied to our revenue contracts with customers as of January 1, 2018. Results for reporting periods beginning after January 1, 2018 are presented under ASC 606, while prior year amounts are not adjusted and continue to be reported in accordance with our historic accounting under ASC 605 "Revenue Recognition". We recorded a net increase to opening retained earnings of $35 million as of January 1, 2018 due to the cumulative effect of adopting ASC 606, with the impact primarily related to our treatment of costs to obtain a contract and to a lesser extent, changes to the timing of the recognition of our subscription and non-transaction revenues. We recognized incremental revenue of $6 million for the year ended December 31, 2018 as a result of the adoption of this standard.
Under ASC 606, revenue is recognized when a customer obtains control of promised goods or services in an amount that reflects the consideration the entity expects to receive in exchange for those goods or services. Under ASC 605, revenue was recognized as it was earned and when services were rendered. See Note 1 - Accounting Policies to our consolidated financial statements for further information.
Allowance for doubtful accounts
The allowance for doubtful accounts reserve methodology is based on historical analysis, a review of outstanding balances and current conditions. In determining these reserves, we consider, amongst other factors, the financial condition and risk profile of our customers, areas of specific or concentrated risk as well as applicable industry trends or market indicators. The impact on operating profit for a one percentage point change in the allowance for doubtful accounts is approximately $16 million.
For the years ended December 31, 2019, 2018 and 2017, there were no material changes in our assumptions regarding the determination of the allowance for doubtful accounts. Based on our current outlook these assumptions are not expected to significantly change in 2020.
Accounting for the impairment of long-lived assets (including other intangible assets)
We evaluate long-lived assets for impairment whenever events or changes in circumstances indicate that the carrying amount of an asset may not be recoverable. Upon such an occurrence, recoverability of assets to be held and used is measured by comparing the carrying amount of an asset to current forecasts of undiscounted future net cash flows expected to be generated by the asset. If the carrying amount of the asset exceeds its estimated future cash flows, an impairment charge is recognized equal to the amount by which the carrying amount of the asset exceeds the fair value of the asset. For long-lived assets held for sale, assets are written down to fair value, less cost to sell. Fair value is determined based on market evidence, discounted cash flows, appraised values or management’s estimates, depending upon the nature of the assets.
Goodwill and indefinite-lived intangible assets
Goodwill represents the excess of purchase price and related costs over the value assigned to the net tangible and identifiable intangible assets of businesses acquired. As of December 31, 2019 and 2018, the carrying value of goodwill and other indefinite-lived intangible assets was $4.4 billion. Goodwill and other intangible assets with indefinite lives are not amortized, but instead are tested for impairment annually during the fourth quarter each year or more frequently if events or changes in circumstances indicate that the asset might be impaired.
Goodwill
As part of our annual impairment test of our four reporting units, we initially perform a qualitative analysis evaluating whether any events and circumstances occurred that provide evidence that it is more likely than not that the fair value of any of our reporting units is less than its carrying amount. Reporting units are generally an operating segment or one level below an operating segment. Our qualitative assessment included, but was not limited to, consideration of macroeconomic conditions, industry and market conditions, cost factors, cash flows, changes in key Company personnel and our share price. If, based on our evaluation of the events and circumstances that occurred during the year we do not believe that it is more likely than not that the fair value of any of our reporting units is less than its carrying amount, no quantitative impairment test is performed. Conversely, if the results of our qualitative assessment determine that it is more likely than not that the fair value of any of our reporting units is less than its respective carrying amount we perform a two-step quantitative impairment test. For 2019, based on our qualitative assessments, we determined that it is more likely than not that our reporting units’ fair values were greater than their respective carrying amounts.
If the fair value of the reporting unit is less than the carrying value, a second step is performed which compares the implied fair value of the reporting unit's goodwill to the carrying value of the goodwill. The implied fair value of the goodwill is determined based on the difference between the fair value of the reporting unit and the net fair value of the identifiable assets and liabilities of the reporting unit. If the implied fair value of the goodwill is less than the carrying value, the difference is recognized as an impairment charge.
Indefinite-Lived Intangible Assets
We evaluate the recoverability of indefinite-lived intangible assets by first performing a qualitative analysis evaluating whether any events and circumstances occurred that provide evidence that it is more likely than not that the indefinite-lived asset is impaired. If, based on our evaluation of the events and circumstances that occurred during the year we do not believe that it is more likely than not that the indefinite-lived asset is impaired, no quantitative impairment test is performed. Conversely, if the results of our qualitative assessment determine that it is more likely than not that the indefinite-lived asset is impaired, a quantitative impairment test is performed. If necessary, the impairment test is performed by comparing the estimated fair value of the intangible asset to its carrying value. If the indefinite-lived intangible asset carrying value exceeds its fair value, an impairment analysis is performed using the income approach. The fair value of loss is recognized in an amount equal to that excess. Significant judgments inherent in these analyses include estimating the amount and timing of future cash flows and the selection of appropriate discount rates, royalty rates and long-term growth rate assumptions. Changes in these estimates and assumptions could materially affect the determination of fair value for this indefinite-lived intangible asset and could result in an impairment charge, which could be material to our financial position and results of operations.
We performed our impairment assessment of goodwill and indefinite-lived intangible assets and concluded that no impairment existed for the years ended December 31, 2019, 2018, and 2017.
Retirement plans and postretirement healthcare and other benefits
Our employee pension and other postretirement benefit costs and obligations are dependent on assumptions concerning the outcome of future events and circumstances, including compensation increases, long-term return on pension plan assets, healthcare cost trends, discount rates and other factors. In determining such assumptions, we consult with outside actuaries and other advisors where deemed appropriate. In accordance with relevant accounting standards, if actual results differ from our assumptions, such differences are deferred and amortized over the estimated remaining lifetime of the plan participants. While we believe that the assumptions used in these calculations are reasonable, differences in actual experience or changes in assumptions could affect the expense and liabilities related to our pension and other postretirement benefits.
The following is a discussion of some significant assumptions that we make in determining costs and obligations for pension and other postretirement benefits:
| • | Discount rate assumptions are based on current yields on high-grade corporate long-term bonds. |
| • | Healthcare cost trend assumptions are based on historical market data, the near-term outlook and an assessment of likely long-term trends. |
| • | The expected return on assets assumption is calculated based on the plan’s asset allocation strategy and projected market returns over the long-term. |
Our discount rate and return on asset assumptions used to determine the net periodic pension and postretirement benefit cost on our U.S. retirement plans are as follows:
| Retirement Plans | Postretirement Plans | |||||||||||||||||
| January 1 | 2020 | 2019 | 2018 | 2020 | 2019 | 2018 | ||||||||||||
| Discount rate | 3.45 | % | 4.40 | % | 3.68 | % | 3.08 | % | 4.15 | % | 3.40 | % | ||||||
| Return on assets | 5.50 | % | 6.00 | % | 6.00 | % | ||||||||||||
| Weighted-average healthcare cost rate | 6.50 | % | 6.50 | % | 6.50 | % |
Stock-based compensation
Stock-based compensation expense is measured at the grant date based on the fair value of the award and is recognized over the requisite service period, which typically is the vesting period. Stock-based compensation is classified as both operating-related expense and selling and general expense in our consolidated statements of income.
We use a lattice-based option-pricing model to estimate the fair value of options granted. The following assumptions were used in valuing the options granted:
| Year Ended | ||||
| December 31, 2018 | ||||
| Risk-free average interest rate | 2.6 - 2.7% | |||
| Dividend yield | 1.1 | % | ||
| Volatility | 21.8 - 22.0% | |||
| Expected life (years) | 5.67 - 6.07 | |||
| Weighted-average grant-date fair value per option | $ | 112.98 |
Because lattice-based option-pricing models incorporate ranges of assumptions, those ranges are disclosed. These assumptions are based on multiple factors, including historical exercise patterns, post-vesting termination rates, expected future exercise patterns and the expected volatility of our stock price. The risk-free interest rate is the imputed forward rate based on the U.S. Treasury yield at the date of grant. We use the historical volatility of our stock price over the expected term of the options to estimate the expected volatility. The expected term of options granted is derived from the output of the lattice model and represents the period of time that options granted are expected to be outstanding.
In 2018, we made a one-time issuance of incentive stock options under the 2002 Plan to replace Kensho employees' stock options that were assumed in connection with our acquisition of Kensho in April of 2018. There were no stock options granted in 2019 and 2017.
Income taxes
Deferred tax assets and liabilities are recognized for the future tax consequences attributable to differences between financial statement carrying amounts of existing assets and liabilities and their respective tax bases. Deferred tax assets and liabilities are measured using enacted tax rates expected to be applied to taxable income in the years in which those temporary differences are expected to be recovered or settled. We recognize liabilities for uncertain tax positions taken or expected to be taken in income tax returns. Accrued interest and penalties related to unrecognized tax benefits are recognized in interest expense and operating expense, respectively.
Judgment is required in determining our provision for income taxes, deferred tax assets and liabilities and unrecognized tax benefits. In determining the need for a valuation allowance, the historical and projected financial performance of the operation that is recording a net deferred tax asset is considered along with any other pertinent information.
We file income tax returns in the U.S. federal jurisdiction, various states, and foreign jurisdictions, and we are routinely under audit by many different tax authorities. We believe that our accrual for tax liabilities is adequate for all open audit years based on our assessment of many factors including past experience and interpretations of tax law. This assessment relies on estimates and assumptions and may involve a series of complex judgments about future events. It is possible that examinations will be settled prior to December 31, 2020. If any of these tax audit settlements do occur within that period we would make any necessary adjustments to the accrual for unrecognized tax benefits.
As of December 31, 2019, we have approximately $3.2 billion of undistributed earnings of our foreign subsidiaries, of which $776 million is reinvested indefinitely in our foreign operations.
Contingencies
We are subject to a number of lawsuits and claims that arise in the ordinary course of business. We recognize a liability for such contingencies when both (a) information available prior to issuance of the financial statements indicates that it is probable that a liability had been incurred at the date of the financial statements and (b) the amount of loss can reasonably be estimated. We continually assess the likelihood of any adverse judgments or outcomes to our contingencies, as well as potential amounts or ranges of probable losses, and recognize a liability, if any, for these contingencies based on an analysis of each matter with the assistance of outside legal counsel and, if applicable, other experts. Because many of these matters are resolved over long periods of time, our estimate of liabilities may change due to new developments, changes in assumptions or changes in our strategy related to the matter. When we accrue for loss contingencies and the reasonable estimate of the loss is within a range, we record its best estimate within the range. We disclose an estimated possible loss or a range of loss when it is at least reasonably possible that a loss may have been incurred.
Redeemable Noncontrolling Interest
The fair value component of the redeemable noncontrolling interest in Indices business is based on a combination of an income and market valuation approach. Our income and market valuation approaches may incorporate Level 3 fair value measures for instances when observable inputs are not available. The more significant judgmental assumptions used to estimate the value of the S&P Dow Jones Indices LLC joint venture include an estimated discount rate, a range of assumptions that form the basis of the expected future net cash flows (e.g., the revenue growth rates and operating margins), and a company specific beta. The significant judgmental assumptions used that incorporate market data, including the relative weighting of market observable information and the comparability of that information in our valuation models, are forward-looking and could be affected by future economic and market conditions.
RECENT ACCOUNTING STANDARDS
See Note 1 – Accounting Policies to our consolidated financial statements for a detailed description of recent accounting standards. We expect the adoption of these recent accounting standards to have a material impact on our consolidated balance sheet; however, we do not expect that these standards will have a material impact on our consolidated statements of income or cash flows.
Previous: Item 6. . Selected Financial Data · Next: Item 7A. . Quantitative and Qualitative Disclosures about Market Risk