 filings.tools
Steel Dynamics 10-K 2019-12-31
Filed 2020-02-27. 22 sections, 345K characters. Original on sec.gov · Markdown · JSON
Cover and table of contents
UNITED STATES
SECURITIES AND EXCHANGE COMMISSION
WASHINGTON, D.C. 20549
FORM 10-K
| ☒ | ANNUAL REPORT PURSUANT TO SECTION 13 OR 15(d) OF THE SECURITIES EXCHANGE ACT OF 1934 FOR THE FISCAL YEAR ENDED DECEMBER 31, 2019 |
| | |
| ☐ | TRANSITION REPORT PURSUANT TO SECTION 13 OR 15(d) OF THE SECURITIES EXCHANGE ACT OF 1934 |
Commission File Number 0-21719
Steel Dynamics, Inc.
(Exact name of registrant as specified in its charter)
| | | |
|---|---|---|
| Indiana | 35-1929476 | |
| (State or other jurisdiction of incorporation or organization) | | (IRS Employer Identification No.) |
| | | |
| 7575 West Jefferson Blvd**,** Fort Wayne**,** IN | | 46804 |
| (Address of principal executive offices) | | (Zip Code) |
Registrant’s telephone number, including area code: (260) 969-3500
Securities registered pursuant to Section 12(b) of the Act.
| | | |
|---|---|---|
| Title of each class | Trading Symbol | Name of each exchange on which registered |
| Common Stock voting, $0.0025 par value | STLD | NASDAQ Global Select Market |
Securities registered pursuant to Section 12(g) of the Act: None
Indicate by check mark if the registrant is a well-known seasoned issuer, as defined in Rule 405 of the Securities Act. Yes ⌧ No ◻
Indicate by check mark if the registrant is not required to file reports pursuant to Section 13 or Section 15(d) of the Act. Yes ◻ No ⌧
Indicate by check mark whether the registrant (1) has filed all reports required to be filed by Section 13 or 15(d) of the Securities Exchange Act of 1934 during the preceding 12 months (or for such shorter period that the registrant was required to file such reports), and (2) has been subject to such filing requirements for the past 90 days. Yes ⌧ No ◻
Indicate by check mark whether the registrant has submitted electronically every Interactive Data File required to be submitted pursuant to Rule 405 of Regulation S-T (§ 232.405 of this chapter) during the preceding 12 months (or for such shorter period that the registrant was required to submit such files). Yes ⌧ No ◻
Indicate by check mark whether the registrant is a large accelerated filer, an accelerated filer, a non-accelerated filer, a smaller reporting company, or an emerging growth company. See the definitions of “large accelerated filer,” “accelerated filer,” “smaller reporting company,” and “emerging growth company” in Rule 12b-2 of the Exchange Act.
| Large accelerated filer ⌧ | Accelerated file ◻ | Non-accelerated filer ◻ | Smaller reporting company ☐ |
|---|---|---|---|
| | | | |
| | | | Emerging growth company ☐ |
If an emerging growth company, indicate by check mark if the registrant has elected not to use the extended transition period for complying with any new or revised financial accounting standards provided pursuant to Section 13(a) of the Exchange Act. ◻
Indicate by check mark whether the registrant is a shell company (as defined in Rule 12b-2 of the Act). Yes ☐ No ⌧
The aggregate market value of the voting stock held by non-affiliates of the registrant computed by reference to the price at which the common equity was last sold as of June 28, 2019, was approximately $5.0 billion. Registrant has no non-voting shares. For purposes of this calculation, shares of common stock held by directors, officers and 5% stockholders known to the registrant have been deemed to be owned by affiliates, but this should not be construed as an admission that any such person possesses the power, direct or indirect, to direct or cause the direction of the management or policies of the registrant or that such person is controlled by or under common control with the registrant.
As of February 20, 2020, Registrant had outstanding 213,554,449 shares of common stock.
DOCUMENTS INCORPORATED BY REFERENCE
Portions of registrant’s definitive proxy statement referenced in Part III, Items 10 through 14 of this report, to be filed prior to April 30, 2020, are incorporated herein by reference.
STEEL DYNAMICS, INC.
Table of Contents
PART I
Special Note Regarding Forward-Looking Statements
Throughout this report, or in other reports or registration statements filed from time to time with the Securities and Exchange Commission under the Securities Exchange Act of 1934, or under the Securities Act of 1933, as well as in documents we incorporate by reference herein or herefrom, or in press releases or oral statements made by our officers or Regulation FD authorized representatives, we may make statements that express our opinions, expectations, or projections regarding future events or future results, in contrast with statements that reflect present or historical facts. These predictive statements, which we generally precede or accompany by such typical conditional words as “anticipate,” “intend,” “believe,” “estimate,” “plan,” “seek,” “project” or “expect,” or by the words “may,” “will,” or “should,” are intended to operate as “forward-looking statements” of the kind permitted by the Private Securities Litigation Reform Act of 1995, incorporated in Section 27A of the Securities Act of 1933 and Section 21E of the Securities Exchange Act of 1934. Such forward-looking statements involve both known and unknown risks, uncertainties and other factors that may cause our actual results, performance or achievements to be materially different from any future results, performance or achievements expressed or implied by such forward-looking statements. That legislation protects such predictive and cautionary statements by creating a “safe harbor” from liability in the event that a particular prediction does not turn out as anticipated.
While we always intend to express our best judgment when we make statements about what we believe will occur in the future, and although we base these statements on assumptions that we believe to be reasonable when made, these forward-looking statements are not a guarantee of performance, and you should not place undue reliance on such statements. Forward-looking statements are subject to many uncertainties and other variable circumstances, many of which are outside of our control, that could cause our actual results and experience to differ materially from those we thought would occur.
The following listing represents some, but not necessarily all, of the factors that may cause actual results to differ from those we may have anticipated or predicted:
| ● | United States or foreign trade policy affecting the amount of, or tariffs on, foreign steel imported into the United States, or adverse or less than satisfactory outcomes of pending and future trade cases alleging unlawful practices in connection with steel imports; |
|---|
| ● | increased price competition brought about by global steelmaking overcapacity; |
|---|
| ● | increased price and other forms of competition from other steel producers, scrap processors and alternative materials; |
|---|
| ● | margin compression resulting from falling selling prices with no offsetting reduction in raw material costs, or our inability to pass increases in costs of raw materials and supplies, if any, onto our customers; |
|---|
| ● | the adverse impact of periods of slower than anticipated economic growth or the risk of a recession, resulting in a general decrease of demand for our products; |
|---|
| ● | the weakening of demand for steel products within the non-residential and residential construction, automotive, manufacturing, appliance, pipe and tube, and other steel-consuming industries; |
|---|
| ● | conditions affecting steel or recycled metals consumption; |
|---|
| ● | cyclical changes in market supply and demand for steel and recycled metals; |
|---|
| ● | changes in the availability or cost of raw materials, such as scrap metal, scrap substitute products such as pig iron and pelletized iron, and other supplies such as zinc, graphite electrodes and ferroalloys, or other raw materials, which we use in our production processes; |
|---|
| ● | periodic fluctuations in the availability and cost of electricity, natural gas, oil, or other energy resources; |
|---|
| ● | the impact of, or changes in, environmental law or in the application of other legal or regulatory requirements upon our production processes or costs of production or upon those of our suppliers or customers, including actions by government agencies, such as the United States Environmental Protection Agency or related state agencies, upon our receipt of pending or future environmentally related construction or operating permits; |
|---|
| ● | the impact of United States government or various other governmental agencies introducing laws or regulatory changes in response to the subject of climate change and greenhouse gas emissions, including the introduction of carbon emissions limitations or trading mechanisms; |
|---|
| ● | increased cybersecurity threats and vulnerabilities and increased global information technology security requirements, and a rise in sophisticated cybercrimes that pose a risk to the security and functionality of our systems and information networks and to the confidentiality, availability, and integrity of sensitive data, including intellectual property, proprietary information, financial information, customer, supplier and business partner information, and personally identifiable information; |
|---|
| ● | changes in our business strategies or development plans which we have adopted or may adopt, and any difficulty or inability to timely, cost efficiently and successfully consummate, implement, integrate or operate any current, planned or potential construction or other projects, acquisitions, joint ventures or strategic alliances; |
|---|
| ● | the impact of impairment charges; |
|---|
| ● | private or governmental liability claims or litigation, or the impact of any adverse litigation costs or outcome of any litigation on the adequacy of our reserves or the availability or adequacy of our insurance coverage; |
|---|
| ● | the occurrence of unanticipated equipment failures and plant outages; |
|---|
| ● | costs to idle facilities, idled facility carrying costs, or increased costs to resume production at idled facilities; and |
|---|
| ● | uncertainties involving new products or new technologies. |
|---|
We also refer you to and urge you to carefully read the section entitled Risk Factors at Item 1A of this report to better understand some of the principal risks and uncertainties inherent in our businesses or in owning our securities, as well as the section entitled Management Discussion and Analysis of Financial Condition and Results of Operations at Item 7_._ You should also review the notes to consolidated financial statements under headings in Note 1. Use of Estimates and in Note 9. Commitments and Contingencies.
Any forward-looking statements which we make in this report, or in any of the documents that are incorporated by reference herein or herefrom, speak only as of the date of such statement, and we undertake no ongoing obligation to update such statements. Comparisons of results between current and any prior periods are not intended to express any future trends or indications of future performance, unless expressed as such, and should only be viewed as historical data.
Item 1. BUSINESS
Our Company
Steel Dynamics, Inc. is one of the largest domestic steel producers and metal recyclers in the United States, based on current estimated steelmaking and coating capacity of approximately 13 million tons and actual metals recycling volumes, with one of the most diversified, high-margin steel product portfolios. The company’s primary sources of revenue are from the manufacture and sale of steel products, the processing and sale of recycled ferrous and nonferrous metals, and the fabrication and sale of steel joists and deck products.
We believe our strategic focus to create value for our teams, customers, communities and shareholders is differentiated through our six Core Operating and Leadership Principles. These six pillars bring us together with a common focus and provide us the foundation upon which we operate and grow. Our six pillars and our team’s execution of them each day has driven our success and sustainability.
| ● | Safety – Creating and maintaining a safe work environment is our number one value and first priority. We want every individual to go home safely at the end of each day and to take an active role in remaining safe both on the job and at home. Our goal is no accidents, no lost workdays, no injuries. |
|---|
| ● | Sustaining Superior Operating Culture – Our entrepreneurial culture fosters a team of energetic, positive, driven and innovative individuals by utilizing open communication and meaningful performance-based compensation aligned to our strategic focus. This results in our safe, low-cost, and highly efficient operations, which drive “best-in-class” operating and financial performance. |
|---|
| ● | Enhancing Customer Relationships and Commitment – We focus on being a preferred partner providing outstanding products and supply-chain solutions that exceed expectations, as we anticipate our customer’s future needs and deliver greater value. |
|---|
| ● | Strategic Growth, Intentional Margin Expansion and Consistency “Through the Cycle” – Our intentional, value-driven growth has propelled our diversification in both end markets and product offerings to sustain continued higher volume and profitability throughout both strong and weak market environments. We are squarely focused on continued strategic and responsible growth. |
|---|
| ● | Driving Innovation – Through individual creativity and ingenuity, our teams drive innovation to improve safety, quality, productivity and resource sustainability. We utilize innovative technologies and processes in order to perform at the highest level, and consistently achieve excellence in all that we do. |
|---|
| ● | Financial Strength and Flexibility – We have one of the most diversified steel product offerings in the industry. Coupled with high variability of our operating costs and our vertically connected business platforms, this results in higher utilization and lower costs, providing strong cash flow generation through both strong and weak market cycles. |
|---|
Competitive Strengths / Business Strategies
We believe our financial strength and flexibility, coupled with our competitive advantages of maintaining a low, highly variable cost structure, producing a diversified value-added product offering, controlling a secure supply of recycled ferrous metals, fostering an entity-wide entrepreneurial culture and having an experienced senior management team and work force, positions us well to continue to strengthen our leadership position and execute our growth strategy.
Differentiated Business Model / Diversified Product Mix / Expanded Product Offerings
We are one of the most diversified steel companies in the United States, with very broad value-added steel product offerings. We offer a wide range of steel products (more specifically enumerated in the Steel Operations Products and Tons Sold by End Market discussion later in this section). We have a proven track record of growing and developing premium, value-added steel product capabilities and unlocking value within our operations. Additionally, by adding high-margin downstream manufacturing businesses, we are able to provide base-load “pull-through” volume for our steel operations, increasing “through-cycle” steel mill utilization. We are also identifying new ways to provide value to our customers by providing supply-chain solutions. Our differentiated business
model and performance-driven culture demonstrate our through-cycle earnings capability through our three vertically connected operating segments.
Steel Operations:
Sheet Products. Hot roll, cold roll and coated steel, including a wide variety of value-added products, such as light gauge hot roll, and galvanized, galvanneal, Galvalume®, Galfan®, and painted products.
Long Products. Structural steel beams, pilings, and standard and premium grade rail; engineered special-bar-quality of an expanding range of sizes and chemistries; various merchant-bar-quality products including rounds, angles, flats, reinforcing bar, channels and specialty steel sections.
Steel Finishing. Turning, polishing, straightening, chamfering, threading, precision saw-cutting, cold draw and heat treating of bar products; and cutting to length, additional straightening, hole punching, shot blasting, welding and coating of beams, channels and specialty steel sections.
Metals Recycling Operations. An array of both ferrous and nonferrous scrap recycling, scrap management, transportation, and brokerage products and services.
Steel Fabrication Operations. Steel joists, girders and steel deck, including specialty deck. Our steel fabrication operations provide “pull-through” volume optionality for our steel operations, as many of the products that we make utilize our own internally produced steel.
This diversified portfolio of products enables us to access a broad range of markets, serve a large customer base, and helps mitigate our market exposure to any one product or sector, resulting in increased through-cycle steel mill utilization. In addition, our value-added steel product offerings help to balance our exposure to commodity grade products supplied by other manufacturers. We will continue to seek additional opportunities and to collaborate with our customers to anticipate their future needs by further expanding our range of products and offerings, which may allow our customers the ability to more effectively and efficiently navigate their supply chain.
One such opportunity is our planned $1.9 billion “next-generation” electric arc furnace (EAF) flat roll steel mill – Southwest-Sinton Flat Roll Division. Our new steel mill will have an estimated 3.0 million tons of annual steel production capacity, including value-added coating lines comprised of a galvanizing line with planned annual coating capacity of 550,000 tons with galvalume capability and a paint line with annual coating capacity of 250,000 tons. By leveraging our construction and operating expertise, we are building a “next-generation” EAF flat roll steel mill with planned production capabilities beyond existing EAF flat roll steel producers, competing even more effectively with the integrated steel model and foreign competition. Our new steel mill will have the capability to provide higher-strength, tougher grades of flat roll steel for the energy and automotive markets. These ultra-high-strength steel products are not currently readily available from other domestic steel producers. By locating our new steel mill in Sinton, Texas we are strategically targeting underserved markets that are largely reliant on imports with long lead times and lower product quality capabilities, providing customers throughout the Southwest United States and Mexico significant freight benefits and shorter lead times allowing them to realize working capital advantages. Additionally, our new steel m
Showing the first 8K of 62K characters. Open the full section
Item 1A. RISK FACTORS
Many factors could have an effect on our business, results of operations, financial condition and cash flows. We are subject to various risks resulting from changing economic, environmental, political, industry, business and financial conditions. The factors described below represent our principal risks.
Risks Related to our Industry
Global steelmaking overcapacity and imports of steel into the United States have adversely affected, and may continue to adversely affect, United States steel prices, which may adversely affect our business, results of operations, financial condition and cash flows.
Global steelmaking capacity currently exceeds global consumption of steel products, which adversely affects United States and global steel prices. Such excess capacity sometimes results in steel manufacturers in certain countries exporting steel and steel products, including pre-fabricated long product steel, at prices that are lower than prevailing domestic prices, and sometimes at or below their cost of production. Excessive imports of steel and steel products, including pre-fabricated steel, into the United States, have exerted, and may continue to exert, downward pressure on United States steel and steel products prices, which adversely affects our business, results of operations, financial condition and cash flows. Furthermore, anticipated additional domestic steel capacity could increase this global overcapacity. This, in turn, may also adversely impact domestic demand for ferrous scrap and our ferrous metallics margins. United States steel producers compete with many foreign producers, including those in China, Vietnam and other Asian and European countries. Competition from foreign producers is typically strong and is periodically exacerbated by weakening of the economies of certain foreign steelmaking countries. Additionally, low iron ore prices, resulting in disruption of the scrap price correlation to iron ore, leads to reduced global costs to produce steel, further depressing steel import prices. A higher volume of steel imports into the United States tends to occur at depressed prices when steel producing countries experience periods of economic difficulty, decreased demand for steel products or excess capacity. The global steelmaking overcapacity is exacerbated by Chinese steel production capacity that far exceeds that country’s demand and has made China a major global exporter of steel, resulting in weakened global steel pricing than otherwise would be expected. While tariffs pursuant to Section 232 of the Trade Expansion Act of 1962, as amended (“Section 232”), other measures to curb unfair trade such as duties or quotas, and the renegotiation of trade agreements with other countries, including the recently signed United States-Mexico-Canada Agreement (“USMCA”), have decreased the volume of steel and steel products imports in the United States, domestic steel and steel products prices remain negatively impacted by excessive imports of steel and steel products into the United States. Should the Section 232 tariffs, duties or quotas expire or be relaxed, repealed or circumvented by importers of steel and steel products, or should trade agreements be renegotiated, downward pressure may be exerted on United States steel and steel products prices, which adversely affects our business, results of operations, financial condition and cash flows.
In addition, we believe the downward pressure on, and periodically depressed levels of, United States steel prices in recent years have been further accentuated through imports of steel involving dumping and subsidy abuses by foreign steel producers. Some foreign steel producers are owned, controlled or subsidized by foreign governments. As a result, decisions by these producers with respect to their production, sales and pricing are sometimes influenced to a greater degree by political and economic policy considerations than by prevailing market conditions, realities of the marketplace or consideration of profit or loss. However, while some tariffs, duties and quotas, including those imposed under Section 232, have been put into effect for steel and certain steel products imported from a number of countries that have been found to have been unfairly pricing steel imports to the United States, some foreign steel subject to these duties, tariffs and quotas circumvent the penalties by processing in or transporting through a foreign country not subject to the penalties. Additionally, there is no assurance that the Section 232 tariffs or other already imposed tariffs, duties and quotas will remain in place or that new ones, even if justified, will be levied, and even when imposed many of these are only short-lived. If such tariffs, duties or quotas expire or if others are further relaxed or repealed, or if relatively higher United States steel prices make it attractive for foreign steelmakers to export their steel products to the United States, despite the presence of tariffs, duties or quotas, the resurgence of substantial imports of foreign steel could create downward pressure on United States steel prices.
Our industry, as well as the industries of many of our customers and suppliers upon whom we are dependent, is affected by domestic and global economic factors including periods of slower than anticipated economic growth and the risk of a new recession.
Our financial results are substantially dependent not only upon overall economic conditions in the United States and globally, including North America, Europe and in Asia, but also as they may affect one or more of the industries upon which we depend for the sale of our products. Global or domestic actions or conditions, including political actions, trade policies or restrictions, such as the recently signed USMCA, changes in tax laws, terrorism, natural disasters, or widespread illness or other health issues, such as the recent Coronavirus outbreak, could result in changing economic conditions in the United States and globally, disruptions to or
slowdowns in our business or our global or domestic industry, or those of our customers or suppliers upon whom we are dependent, or changes in our pre-tax and post-tax financial performance. Additionally, periods of slower than anticipated economic growth could reduce customer confidence and adversely affect demand for our products and further adversely affect our business, results of operations, financial condition and cash flows. Metals industries have historically been vulnerable to significant declines in consumption and product pricing during periods of economic downturn or continued uncertainty, including the pace of domestic non-residential construction activity.
Our business is also dependent upon certain industries, such as construction, automotive, manufacturing, transportation, heavy and agriculture equipment, and pipe and tube (including OCTG) markets, and these industries are also cyclical in nature. Therefore, these industries may experience their own fluctuations in demand for our products based on such things as economic conditions, raw material and energy costs, consumer demand and infrastructure funding decisions by governments. Many of these factors are beyond our control. As a result of volatility in our industry or in the industries we serve, we may have difficulty increasing or maintaining our level of sales or profitability. If our industry or the industries we serve were to suffer a downturn, then we may experience an adverse effect on our business, results of operations, financial condition and cash flows.
A prospective decline in consumer and business confidence and spending, which is often coupled with reductions in the availability of credit or increased cost of credit, as well as volatility in the capital and credit markets, could adversely affect the business and economic environment in which we operate and the profitability of our business. We are also exposed to risks associated with the creditworthiness of our suppliers and customers. If the availability of credit to fund or support the continuation and expansion of our customers’ business operations is curtailed or if the cost of that credit is increased, the resulting inability of our customers or of their customers to either access credit or absorb the increased cost of that credit could adversely affect our business by reducing our sales or by increasing our exposure to losses from uncollectible customer accounts. A disruption of the credit markets could also result in financial instability of some of our suppliers and customers. The consequences of such adverse effects could include the interruption of production at the facilities of our customers, the reduction, delay or cancellation of customer orders, delays or interruptions of the supply of raw materials we purchase, and bankruptcy of customers, suppliers or other creditors. Any of these events may adversely affect our business, results of operations, financial condition and cash flows.
Our level of production and our sales and earnings are subject to significant fluctuations as a result of the cyclical nature of the steel industry and some of the industries we serve.
The steel manufacturing business is cyclical in nature, and the selling price of the steel we make may fluctuate significantly due to many factors beyond our control. Furthermore, a number of our products are commodities, subject to their own cyclical fluctuations in supply and demand in both metal consuming and metal generating industries, including the construction and manufacturing industries. The timing, magnitude and duration of these cycles and the resulting price fluctuations are difficult to predict. The sale of our manufactured steel products is directly affected by demand for our products in other cyclical industries, such as construction, automotive, manufacturing, transportation, heavy and agriculture equipment, and pipe and tube (including OCTG) markets. Economic difficulties, stagnant or slow global economies, supply/demand imbalances and currency fluctuations in the United States or globally could decrease the demand for our products or increase the amount of imports of steel into the United States, which could decrease our sales, margins and profitability.
The scrap metal recycling industry has historically been, and is expected to remain, highly cyclical and this could have a material adverse effect on our metals recycling operations’ results.
Scrap metal prices remain subject to fluctuation, and operating results within the metals recycling industry in general have historically been, and are expected to remain, highly cyclical in nature. Similarly, but not necessarily paralleling the price fluctuations in the steel business, the purchase prices for automobile bodies and various other grades of obsolete and industrial scrap, as well as the selling prices for processed and recycled scrap metals we utilize in our own manufacturing process, or which we resell to others through our metals recycling operations, are also volatile. During periods of excess domestic supply or increased imports, scrap metal prices may become or remain depressed and adversely affect the sales, profitability and margins of our scrap business. As a metals recycler, we may attempt to respond to changing recycled metal selling prices by adjusting the scrap metal purchase prices we pay to others, but our ability to do this may be limited by competitive or other factors during periods of low scrap prices, when inbound scrap flow may slow considerably, as scrap generators hold on to their scrap in hopes of getting higher prices later. As such, a prolonged period of low scrap prices could reduce our ability to obtain, process, and sell recycled materials, and this could adversely affect our metals recycling operations’ results. Conversely, periodic increased foreign demand for scrap can result in an outflow of available domestic scrap, as well as resulting higher scrap prices domestically that cannot always be passed on to domestic scrap consumers, thereby further reducing available domestic scrap flows and scrap margins, all of which could adversely affect our sales and profitability of our metals recycling operations. Additionally, during periods of high demand and resulting higher scrap prices, ferrous scrap consumers may seek and develop ferrous scrap alternatives, including pig iron and DRI. The availability and pricing of these
scrap alternatives in the domestic market may have a longer-term impact on scrap pricing, particularly in prime grades, which could adversely affect our sales, profitability and margins.
Volatility and major fluctuations in prices and availability of scrap metal, scrap substitutes, and supplies, and our potential inability to pass higher costs on to our customers, may constrain operating levels and reduce profit margins.
Steel producers require large amounts of raw materials, including scrap metal and scrap substitute products such as pig iron, pelletized iron and other supplies such as zinc, graphite electrodes and ferroalloys. Our principal raw material is scrap metal derived primarily from industrial scrap and end-of-life automobiles, appliances, railroad cars, railroad track materials, agricultural machinery and demolition scrap from obsolete structures, containers and machines. The prices for scrap are subject to market forces largely beyond our control, including demand by United States and international steel producers, freight costs and speculation. The prices for scrap have varied significantly in the past, may vary significantly in the future and do not necessarily fluctuate in tandem with the price of steel. Moreover, some of our integrated steel producer competitors are not as dependent as we are on scrap as a part of their raw material melt mix, which, during periods of high scrap costs relative to the cost of blast furnace iron used by the integrated producers, give them a raw material cost advantage over mini-mills. While our vertical integration into the metals recycling business, through our OmniSource operations, and into the ironmaking business, through our IDI facility, are expected to enable us to continue being a cost-effective supplier to our own steelmaking operations, for some of our metallics requirements, we will still need to rely on other metallics and raw material suppliers, as well as upon general industry supply conditions for the balance of our needs.
Purchase prices for auto bodies, scrap metal and scrap substitute products such as pig iron that we consume and selling prices for scrap and recycled metals that we sell to third parties are volatile and beyond our control. While OmniSource attempts to respond to changing recycled metal selling prices through adjustments to its metal purchase prices, its ability to do so is limited by competitive and other market factors. Changing prices could potentially impact the volume of scrap metal available to us and the volume and realized margins of processed metals we sell.
The availability and prices of raw materials may also be negatively affected by new or existing laws and regulations, allocation by suppliers, interruptions in production, accidents or natural disasters, changes in exchange rates, global price fluctuations, the availability and cost of transportation, and competing uses for raw materials. As a major producer of galvanized steel products, we purchase and consume a large amount of zinc, which if purchased at high prices, may have an effect on our profit margins. Due to its use in other industries, demand for the primary raw material (needle coke) used in the production of graphite electrodes, a critical raw material in our steelmaking, has expanded in recent years, leading to increased price. Any inability to secure a consistent, cost effective and timely supply of our raw materials and supplies could have an adverse effect on our business, financial condition, results of operations and cash flows.
If prices for ferrous metallics increase by a greater margin than corresponding price increases for the sale of our steel products, we may not be able to recoup such cost increases from increases in the selling prices of steel products. Conversely, depressed prices for ferrous scrap may constrain its supply, which may adversely affect our metals recycling operations and also the availability of certain grades of scrap for our steelmaking operations. Additionally, our inability to pass on all or any substantial part of any cost increases during periods of rapidly rising scrap prices, through scrap or other surcharges, or to provide for our customers’ needs because of the potential unavailability of key raw materials or other inputs, may result in production slowdowns or curtailments or may otherwise have a material adverse effect on our business, financial condition, results of operations and cash flows.
The cost and availability of electricity, natural gas, oil and other energy resources are subject to volatile market conditions.
Steel producers like us consume large amounts of energy to melt ferrous scrap in electric arc furnaces and reheat steel for rolling into finished products. We rely on third parties for the supply of energy resources we consume in our steelmaking activities. The prices for and availability of electricity, natural gas, oil and other energy resources are subject to volatile market conditions, often affected by weather conditions as well as political, environmental and economic factors beyond our control. As consumers of electricity and natural gas, we must have dependable delivery in order to operate. Accordingly, we are at risk in the event of an energy disruption, including power outages or power unavailability. Prolonged blackouts or brownouts or disruptions caused by natural disasters or by political or environmental considerations would substantially disrupt our production. Since a significant portion of our finished steel products are delivered by truck, unforeseen fluctuations in the price of fuel would also have a negative impact on our costs or on the costs of many of our customers. In addition, changes in certain environmental regulations, including those that may impose output limitations or higher costs associated with climate change or greenhouse gas emissions, could substantially increase the cost of manufacturing and raw materials to us and other steel producers.
Fluctuations in the value of the United States dollar relative to other currencies may adversely affect our business.
Fluctuations in the value of the dollar can be expected to affect our business. A strong United States dollar makes imported products less expensive, potentially resulting in more imports of steel products into the United States by our foreign competitors, while a weak United States dollar may have the opposite impact on imports.
Compliance with and changes in environmental and remediation requirements could result in substantially increased capital requirements and operating costs.
Existing laws or regulations, as currently interpreted or as may be interpreted in the future, as well as future laws or regulations, may have a material adverse effect on our results of operations and financial condition.
We are subject to numerous local, state, federal and international statutory and regulatory environmental requirements relating to, among other things:
| ● | the generation, storage, treatment, handling and disposal of solid and hazardous waste and secondary materials; |
|---|
| ● | the discharge of materials into the air, including periodic changes to the National Ambient Air Quality Standards and to emission standards; |
|---|
| ● | the management, treatment and discharge of wastewater and storm water; |
|---|
| ● | the use and treatment of groundwater; |
|---|
| ● | the remediation of soil and groundwater contamination; |
|---|
| ● | climate change legislation or regulation; |
|---|
| ● | the need for and the ability to timely obtain air, water or other environmental permits; |
|---|
| ● | the timely reporting of certain chemical usage, content, storage and releases; |
|---|
| ● | the remediation and reclamation of land used for iron mining; |
|---|
| ● | natural resource protections; and |
|---|
| ● | the protection of our employees’ health and safety. |
|---|
Compliance with environmental laws and regulations, which affect our steelmaking, metals recycling, ironmaking, and copper and aluminum production operations, is a significant factor in our business. We are required to obtain and comply with environmental permits and licenses, and failure to obtain or renew or the violation of any permit or license could result in substantial fines and penalties, capital expenditures, operational changes, suspension of operations and/or the closure of a subject facility. Similarly, delays, increased costs and/or the imposition of onerous conditions to the securing or renewal of permits could have a material adverse effect on these operations.
Uncertainty regarding adequate pollution control levels, testing and sampling procedures, and new pollution control technology are factors that may increase our future compliance expenditures. We are unable to predict the ultimate cost of future compliance with environmental requirements or their effect on our operations. Although we work hard to be in substantial compliance with all applicable laws and regulations, legal requirements frequently change and are subject to interpretation such that regulatory agencies may bring enforcement actions for alleged noncompliance. Private parties might also bring claims against us under citizen suit provisions and/or for property damage or personal injury allegedly resulting from our operations. New laws, regulations and changing interpretations by regulatory authorities, together with uncertainty regarding the application of existing requirements are among the factors that may increase our future expenditures to comply with environmental requirements. The cost of complying with existing laws or regulations as currently interpreted or reinterpreted in the future, or with future laws or regulations, may have a material adverse effect on our results of operations and financial condition.
Our operations produce significant amounts of by-products, some of which are handled as solid or hazardous waste or as hazardous secondary materials. For example, our steel mills generate electric arc furnace (EAF) dust, which the United States Environmental Protection Agency (United States EPA) and other regulatory authorities classify as hazardous waste and regulate accordingly unless recycled in an exempt manner.
In addition, the primary feed materials for the shredders operated by our metals recycling operations are automobile bodies. A portion of the feed materials consist of unrecyclable material known as shredder residue. If laws or regulations or the interpretation of the laws or regulations change with regard to EAF dust or shredder residue or other by-products created by our operations, we may incur significant additional expenditures.
Federal and state environmental laws enable the United States EPA, state agencies and certain private parties to recover from owners, operators, generators and transporters the cost of investigation and cleanup of sites at which wastes or hazardous substances
were disposed. In connection with these laws, we may be required to clean up contamination discovered at our sites including contamination that may have been caused by former owners or operators of the sites, to conduct additional cleanup at sites that have already had some cleanup performed, and/or to perform cleanup with regard to sites formerly used in connection with our operations.
In addition, we may be required to pay for, or to pay a portion of, the costs of cleanup at sites to which we sent materials for disposal or recycling, notwithstanding that the original disposal or recycling activity may have complied with all regulatory requirements then in effect. Under certain laws, a party can be held jointly and severally liable for all of the cleanup costs associated with a disposal site. In practice, a liable party often splits the costs of cleanup with other potentially responsible parties. We have received notices from the United States EPA, state agencies and third parties that we have been identified as potentially responsible for the costs of investigating and cleaning up a number of disposal sites. In most cases, many other parties are also named as potentially responsible parties and also contribute to payment of those costs.
Because cleanup liability can in some cases be imposed retroactively on activities that occurred many years ago, and because the United States EPA and state agencies are still discovering sites that pose a threat to public health or the environment, we can provide no assurance that we will not become liable for significant costs associated with investigation and remediation of cleanup sites.
Increased regulation associated with climate change and greenhouse gas (GHG) emissions could impose significant costs on both our steelmaking and metals recycling operations.
The United States government or various other governmental agencies may introduce regulatory changes in response to the potential impacts of climate change. International treaties or agreements may also result in increasing regulation of GHG emissions, including the introduction of carbon emissions limitations or trading mechanisms. Any such regulation regarding climate change and GHG emissions could impose significant costs on our operations and on the operations of our customers and suppliers, including increased energy, capital equipment, emissions controls, environmental monitoring and reporting and other costs in order to comply with current or future laws or regulations concerning climate change and GHG emissions. Any adopted future climate change and GHG regulations could negatively impact our ability, and that of our customers and suppliers, to compete with companies situated in areas not subject to or not complying with such limitations.
From a medium and long-term perspective, we may see an increase in costs relating to our assets that emit significant amounts of GHGs as a result of these regulatory initiatives, which may impact our operations directly or through our suppliers or customers. Until the timing, scope and extent of any future regulation becomes known, we cannot predict the effect on our financial condition, operating performance and ability to compete.
Risks Related to the Business
Our senior unsecured credit facility contains, and any future financing agreements may contain, restrictive covenants that may limit our flexibility.
Restrictions and covenants in our existing debt agreements, including our senior unsecured credit facility, and any future financing agreements, may impair our ability to finance future operations or capital needs or to engage in other business activities. A breach of any of the restrictions or covenants could cause a default under our senior unsecured credit facility, our senior notes, or our other debt. A significant portion of our indebtedness may then become immediately due and payable.
Under our senior unsecured credit facility, we are required to maintain certain financial covenants tied to our leverage and profitability. Our ability to meet such covenants or other restrictions can be affected by events beyond our control. If a default were to occur, the lenders could elect to declare all amounts then outstanding to be immediately due and payable and terminate all commitments to extend further credit.
We may face significant price and other forms of competition from other steel producers, scrap processors and alternative materials, which could have a material adverse effect on our business, financial condition, results of operations and cash flows.
The global markets in which steel companies and scrap processors conduct business are highly competitive and became even more so due to consolidations in the steel and scrap industries. Additionally, in many applications, steel competes with other materials, such as aluminum, cement, composites, plastics, carbon fiber, glass and wood. Increased use of alternative materials for any reason, including as a response to regulations such as the Corporate Average Fuel Economy (CAFE) requirements, could decrease demand for steel or force other steel producers into new products or markets that compete more directly with us, and combined with increased competition could cause us to lose market share, increase expenditures or reduce pricing, any one of which could have a material adverse effect on our business, financial condition, results of operations and cash flows. The global steel industry suffers from overcapacity, and that excess capacity intensifies price competition for some of our products. A decrease in the global demand
for steel scrap, due to market or other conditions, including trade restrictions, generally causes a decrease in the price of scrap metals. A decrease in price could result in some scrap generators exiting the marketplace which could further decrease the availability of scrap. A shortage in the availability of scrap could have a material adverse effect on both our steelmaking and our metals recycling operations and thus on our business, financial condition, results of operations and cash flows.
We are subject to significant risks relating to changes in commodity prices and may not be able to effectively protect against these risks.
We are exposed to commodity price risk during periods where we hold scrap metal inventory for processing or resale. Prices of commodities, including scrap, can be volatile due to numerous factors beyond our control. In an increasing price environment for raw materials, competitive conditions may limit our ability to pass on price increases to our consumers. In a decreasing price environment for processed scrap, we may not have the ability to fully recoup the cost of raw materials that we procure, process, and sell to our customers. In addition, new entrants into the market areas we serve could result in higher purchase prices for raw materials and lower margins from our scrap. Our sales and inventory position may be vulnerable to adverse changes in commodity prices, which could materially adversely impact our operating and financial performance. Thus, we engage in some hedging of certain commodities in futures markets.
Availability of an adequate source of supply is required for our metals recycling operations.
We procure our scrap inventory from numerous sources. These suppliers generally are not bound by long-term contracts and generally have no obligation to sell recyclable metal to us. In periods of low industry scrap prices, scrap suppliers may elect to hold recyclable metal to wait for higher prices or intentionally slow their metal collection activities. If a substantial number of scrap suppliers cease selling recyclable metal to us, we may be unable to recycle metal at desired levels and our results of operations and financial condition could be materially adversely affected. In addition, a slowdown of industrial production in the United States reduces the supply of industrial grades of metal to the metal recycling industry, resulting in our having less recyclable metal available to process and sell.
We are subject to cybersecurity threats and may face risks to the security of our sensitive data and information technology, which may adversely affect our business, results of operations, financial condition and cash flows.
Increased global cybersecurity and information technology security requirements, vulnerabilities and threats and a rise in sophisticated and targeted cybercrime pose a risk to the security and functionality of our systems and information networks, and to the confidentiality, availability and integrity of sensitive data, including intellectual property, proprietary information, financial information, customer, supplier and business partner information, and personally identifiable information, any of which could result in reputational harm and have materially adverse economic consequences. Additionally, such cybersecurity vulnerabilities or attacks could result in an interruption of the functionality of our automated and electronically controlled manufacturing operating systems, which, if compromised, could cease, threaten, delay or slow down our ability to melt, roll or otherwise process steel or any of our other products for the duration of such interruption, which could result in reputational harm, have materially adverse economic consequences and may adversely affect our business, results of operations, financial condition and cash flows. Our customers, suppliers and vendors may also store certain of our sensitive information on their information technology systems, which if breached or attacked, could likewise expose our sensitive information and result in reputational harm and have materially adverse economic consequences.
Although we believe we have adopted procedures and controls to adequately protect our sensitive data, networks and information and operating technology and systems, there can be no assurance that a system or network failure, or cybersecurity breach or attack, will be prevented, whether due to attacks by cyber criminals or due to employee, contractor or other error or malfeasance. This could lead to system interruption, production delays or downtimes and operational disruptions, and the disclosure, modification or destruction of sensitive data, which could have an adverse effect on our reputation, customer, supplier and business partner relationships, financial results and results of operations, and could result in litigation or regulatory investigations, actions, fines or penalties, as well as increased cybersecurity monitoring and protection costs, including the cost of insurance. Additionally, as cybersecurity threats continue to evolve and become more sophisticated, we may need to invest additional time, resources and finances to protect the security of our sensitive data, systems and information networks.
We may face risks associated with the implementation of our growth strategy.
Our growth strategy subjects us to various risks. As part of our growth strategy, we may expand existing facilities, enter into new product or process initiatives, acquire or build additional plants, acquire other businesses and assets, enter into joint ventures, or form strategic alliances that we believe will complement our existing business. These expansions and transactions may involve some or all of the following risks:
| ● | the risk of entering product or geographic markets in which we have little experience; |
|---|
| ● | the risk of a newly constructed steel mill being completed over budget or not on time; |
|---|
| ● | the risk of not being able to adequately obtain sufficient labor to efficiently build or staff a new steel mill; |
|---|
| ● | the risk of expected markets, products, customers and demand for products produced by a new steel mill being lower than expected; |
|---|
| ● | the difficulty of competing for acquisitions and other growth opportunities with companies having materially greater financial resources than us; |
|---|
| ● | the inability to realize anticipated synergies or other expected benefits; |
|---|
| ● | the difficulty of integrating new or acquired operations and personnel into our existing operations; |
|---|
| ● | the potential disruption of ongoing operations; |
|---|
| ● | the diversion of financial resources to new operations or acquired businesses; |
|---|
| ● | the diversion of management attention from other business concerns to new operations or acquired businesses; |
|---|
| ● | the loss of key employees, customers or suppliers of acquired businesses; |
|---|
| ● | the potential exposure to unknown liabilities; |
|---|
| ● | the inability of management to maintain uniform standards, controls, procedures and policies; |
|---|
| ● | the difficulty of managing the growth of a larger company; |
|---|
| ● | the risk of becoming involved in labor, commercial, or regulatory disputes or litigation related to the new operations or acquired businesses; |
|---|
| ● | the risk of becoming more highly leveraged; |
|---|
| ● | the risk of contractual or operational liability to other venture participants or to third parties as a result of our participation; |
|---|
| ● | the inability to work efficiently with joint venture or strategic alliance partners; and |
|---|
| ● | the difficulties of terminating joint ventures or strategic alliances. |
|---|
Our new Southwest-Sinton Flat Roll Division is under construction in Sinton, Texas, and is planned to commence operations in mid-2021, with an expected cost of approximately $1.9 billion. The project is subject to the above risks, as well as unfavorable weather conditions, natural disasters, delayed equipment deliveries and installations, or other conditions outside our control could increase the cost or delay the commencement of operations of our new EAF steel mill. Additionally, customer, product, or geographic markets we expect to serve may not be as profitable as currently expected, which could have an adverse effect on our prospects, business, financial condition, results of operations and cash flows.
These expansions or transactions might be required for us to remain competitive, but we may not be able to complete any such expansions or transactions on favorable terms or obtain financing, if necessary. Future expansions and transactions may not improve our competitive position and business prospects as anticipated, and if they do not, our business, financial condition, results of operations and cash flows may be adversely affected.
Impairment charges could adversely affect our results of operations.
Occasionally, assumptions that we have made regarding products or businesses we have acquired or sought to develop, about the sustainability of markets we sought to exploit, or about industry conditions that underlie our decision making when we elected to capitalize a venture turn out differently than anticipated. In such instances, the fair value of such assets may fall below their carrying value recorded on our balance sheet.
Accordingly, we periodically test goodwill, and long-lived tangible and intangible assets to determine whether their estimated fair value is in fact less than their value recorded on our balance sheet. If we determine that the fair value of any of these assets, from whatever cause, is less than the value recorded on our balance sheet, we are required to incur non-cash asset impairment charges, such as those recorded in past years, that adversely affect our results of operations. There can be no assurances that continued market dynamics or other factors may not result in future impairment charges.
We are subject to litigation and legal compliance risks which could adversely affect our financial condition, results of operations and liquidity.
We are involved from time to time in various routine litigation matters, including administrative proceedings, regulatory proceedings, governmental investigations, environmental matters, and commercial and construction contract disputes, none of which at the present time are expected to have a material impact on our financial conditions, results of operations or liquidity. For additional information regarding legal proceedings please refer to Item 3. Legal Proceedings.
In addition to risks associated with our environmental and other regulatory compliance, our international operations are subject to complex foreign and United States laws and regulations, including the Foreign Corrupt Practices Act and other anti-bribery laws, regulations related to import-export controls, the Office of Foreign Assets Control, and other laws and regulations, each of which may increase our cost of doing business and expose us to increased risk.
Unexpected equipment downtime or shutdowns could adversely affect our business, financial condition, results of operations and cash flows.
Interruptions in our production capabilities could adversely affect our production costs, products available for sale and earnings during the affected period. In addition to equipment failures, our facilities are also subject to the risk of catastrophic loss due to unanticipated events such as fires, explosions or violent weather conditions. Our manufacturing processes are dependent upon critical pieces of steelmaking equipment, such as our electric arc furnaces, continuous casters and rolling equipment, some of which are controlled by our information technology systems, as well as electrical equipment, such as transformers. This equipment may, on occasion, be out of service as a result of unanticipated failures or other events, including cybersecurity breaches or attacks or system failures. We have experienced plant shutdowns or periods of reduced production as a result of such equipment failures and may in the future experience plant shutdowns or periods of reduced production as a result of such equipment failures, or other events. These disruptions could have an adverse effect on our business, financial condition, results of operations and cash flows.
We have incurred, and may incur in the future, costs to idle facilities, idled facility carrying costs, or increased costs to resume production at idled facilities.
Our Minnesota ironmaking operations are indefinitely idled, and should we in the future resume production, we would incur increased costs related to preparing for operation, performing any required repairs and maintenance, and training employees. Should economic or market conditions dictate, we may in the future idle additional facilities, which may require us to incur idling and carrying costs related to those facilities, as well as further increased costs should production be resumed at any idled facility, which could have an adverse effect on our business, financial results, results of operations and cash flows.
Governmental agencies may refuse to grant or renew some of our licenses and permits.
We must receive licenses and air, water and other permits and approvals from state and local governments to conduct certain of our operations or to build, expand or acquire new facilities, such as our new electric arc furnace flat roll steel mill currently under construction in Sinton, Texas. Governmental agencies sometimes resist the establishment of certain types of facilities in their communities, including scrap metal collection and processing facilities. There can be no assurance that future approvals, licenses and permits will be granted or that we will be able to maintain and renew the approvals, licenses and permits we currently hold. Failure to do so could have a material adverse effect on our business, financial condition, results of operations and cash flows.
Item 1B. UNRESOLVED STAFF COMMENTS
None.
Item 2. PROPERTIES
The following table describes our significant properties as of December 31, 2019. These properties are owned by us, and not subject to any significant encumbrances, or are leased by us. We believe these properties are suitable and adequate for our current operations and are appropriately utilized. For additional information regarding our facilities please refer to Item 1. Business.
| | | | | | | | | |
|---|---|---|---|---|---|---|---|---|
| | | | | | | Site | | Site |
| | | | | | | Acreage | | Acreage |
| Operations | | Location | | Description | | Owned | | Leased |
| **Steel Operations Segment *** | | | | | | | | |
| Butler Flat Roll Division: | | | | | | | | |
| Butler Operations | | Butler, IN | | Flat Roll Steel Mill and Coating Facility | | 1,021 | | — |
| Jeffersonville Operations | | Jeffersonville, IN | | Flat Roll Steel Coating Facility | | 27 | | 10 |
| Iron Dynamics | | Butler, IN | | Liquid Ironmaking Facility | | 25 | | — |
| Columbus Flat Roll Division | | Columbus, MS | | Flat Roll Steel Mill and Coating Facility | | 1,479 | | 14 |
| Southwest-Sinton Flat Roll Division | | Sinton, TX | | Flat Roll Steel Mill and Coating Facility ** | | 2,487 | | — |
| The Techs | | Pittsburgh, PA | | Flat Roll Steel Coating Facilities | | 16 | | 2 |
| Heartland Flat Roll Division | | Terre Haute, IN | | Flat Roll Steel Rolling and Coating Facility | | 193 | | — |
| United Steel Supply | | IN, MS, OR, and TX | | Distributor of Painted Galvalume® Flat Roll Steel | | 12 | | 3 |
| Structural and Rail Division | | Columbia City, IN | | Structural and Rail Steel Mill | | 692 | | — |
| Engineered Bar Division | | Pittsboro, IN | | Engineered Bar Steel Mill and Finishing Facility | | 312 | | — |
| Vulcan Threaded Products | | Pelham, AL | | Bar Steel Processing Facility | | 29 | | — |
| Roanoke Bar Division | | Roanoke, VA | | Merchant Bar Steel Mill | | 290 | | — |
| Steel of West Virginia | | WV, KY, and TN | | Specialty Shapes Steel Mill and Finishing | | 139 | | 6 |
| | | | | and Coating Facilities | | | | |
| | | | | | | | | |
| Metals Recycling Operations Segment | | | | | | | | |
| OmniSource: | | | | | | | ||
| Indiana | | Multiple Cities | | Ferrous and Nonferrous Scrap Processing | | 449 | | 26 |
| Michigan | | Multiple Cities | | Ferrous and Nonferrous Scrap Processing | | 193 | | — |
| North Carolina | | Multiple Cities | | Ferrous and Nonferrous Scrap Processing | | 346 | | — |
| Ohio | | Multiple Cities | | Ferrous and Nonferrous Scrap Processing | | 212 | | 21 |
| Oklahoma | | Sand Springs, OK | | Ferrous Scrap Processing | | — | | 5 |
| Tennessee | | Johnson City, TN | | Ferrous and Nonferrous Scrap Processing | | 33 | | — |
| Virginia | | Multiple Cities | | Ferrous and Nonferrous Scrap Processing | | 196 | | — |
| | | | | | | | | |
| Steel Fabrication Operations Segment | | | | | | | | |
| New Millennium Building Systems: | | | | | | | | |
| Joist and Deck Operations | | Butler, IN | | Steel Joist and Deck Fabrication Facility | | 216 | | — |
| Joist Operations | | Fallon, NV | | Steel Joist Fabrication Facility | | 53 | | — |
| Joist and Deck Operations | | Hope, AR | | Steel Joist and Deck Fabrication Facility | | 62 | | 4 |
| Joist Operations | | Juarez, MX | | Steel Joist Fabrication Facility | | 17 | | — |
| Joist and Deck Operations | | Lake City, FL | | Steel Joist and Deck Fabrication Facility | | 75 | | — |
| Deck Operations | | Memphis, TN | | Deck Fabrication Facility | | 19 | | — |
| Joist and Deck Operations | | Salem, VA | | Steel Joist and Deck Fabrication Facility | | 63 | | — |
| | | | | | | | | |
The company’s corporate headquarters is in Fort Wayne, Indiana on 20 owned acres. Our copper rod and wire facility, a controlled subsidiary, is in New Haven, Indiana on 35 owned acres.
- Our 2019 steel mill production utilization was 88% of our estimated annual steelmaking capability.
** Southwest-Sinton Flat Roll Division is under construction, with planned commencement of operations in mid-2021.
Item 3. LEGAL PROCEEDINGS
We are involved in various litigation matters, including administrative proceedings, regulatory proceedings, governmental investigations, environmental matters, and commercial and construction contract disputes, none of which are currently expected to have a material impact on our financial condition, results of operations, or liquidity.
We may also be involved from time to time in various governmental investigations, regulatory proceedings or judicial actions seeking penalties, injunctive relief, and/or remediation under federal, state and local environmental laws and regulations. The United States EPA has conducted such investigations and proceedings involving us, in some instances along with state environmental regulators, under various environmental laws, including RCRA, CERCLA, the Clean Water Act and the Clean Air Act. Some of these matters have resulted in fines or penalties, for which a total of $512,000 is recorded in our financial statements as of December 31, 2019.
Item 4. MINE SAFETY DISCLOSURES
Information required to be furnished pursuant to Item 4 concerning mine safety disclosure matters by Section 1503(a) of the Dodd-Frank Wall Street Reform and Consumer Protection Act and Item 104 of Regulation S-K (17 CFR 229.104), is included in Exhibit 95 to this annual report.
PART II
Item 5. MARKET FOR REGISTRANT’S COMMON EQUITY, RELATED STOCKHOLDER MATTERS AND ISSUER PURCHASES OF EQUITY SECURITIES
The information required by Item 5 with respect to securities authorized for issuance under equity compensation plans is set forth in Part III, Item 12 of this Form 10-K. Our common stock trades on The NASDAQ Global Select Stock Market under the symbol STLD.
As of February 20, 2020, we had 213,554,449 shares of common stock outstanding and held beneficially by approximately 23,900 stockholders based on our security position listing. Because many of the shares were held by depositories, brokers and other nominees, the number of registered holders (approximately 1,460) is not representative of the number of beneficial holders.
Issuer Purchases of Equity Securities
We purchased the following equity securities registered by us pursuant to Section 12 of the Exchange Act during the three months ended December 31, 2019.
| | | | | | | | | | | | |
|---|---|---|---|---|---|---|---|---|---|---|---|
| | | | | | | | | | | | |
| Period | | Total Number of Shares Purchased | | Average Price Paid per Share | | Total Number of Shares Purchased as Part of Publicly Announced Program (1) | | Maximum Dollar Value of Shares That May Yet be Purchased Under the Program (in thousands) (1) | |||
| | | | | | | | | | | | |
| Quarter ended December 31, 2019 | | | | | | | | | | ||
| | | | | | | | | | | | |
| October 1-31 | | 289,185 | | $ | 28.06 | | | 289,185 | | $ | 98,640 |
| November 1-30 | | 1,001,283 | | | 31.71 | | | 1,001,283 | | | 66,885 |
| December 1 - 31 | | 472,793 | | | 34.57 | | | 472,793 | | | 50,540 |
| | | 1,763,261 | | | | | | 1,763,261 | | | |
| (1) | On September 4, 2018, we announced that our board of directors had authorized a share repurchase program of up to $750.0 million of our common stock. |
|---|
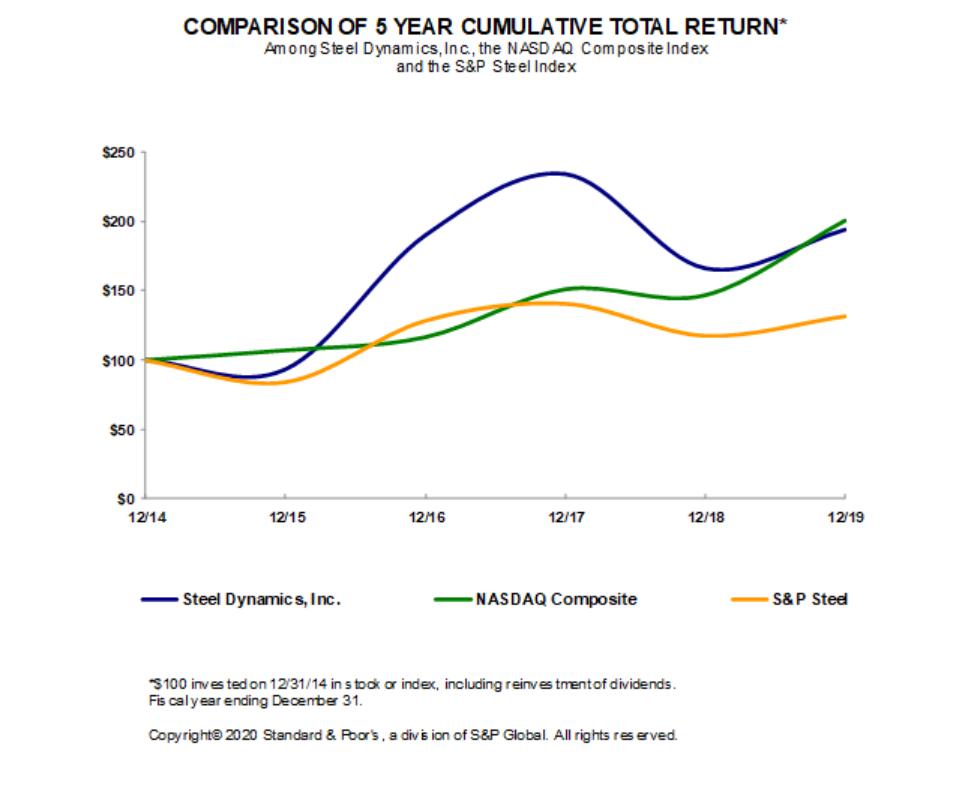
Total Return Graph
Item 6. SELECTED FINANCIAL DATA
The following table sets forth the selected consolidated financial and operating data of Steel Dynamics, Inc. The selected consolidated operating, other financial and balance sheet data, as of and for each of the years in the five-year period ended December 31, 2019, were derived from our audited consolidated financial statements. You should read the following data in conjunction with Item 7. Management’s Discussion and Analysis of Financial Condition and Results of Operations and our consolidated financial statements and notes appearing elsewhere in this Form 10-K.
You should also read the following information in conjunction with the data in the table on the following page:
| ● | On March 1, 2019, we completed the acquisition of 75% of the equity interest of United Steel Supply, LLC (USS), for a total cash purchase price of $97.1 million. USS operations are reflected in our steel operations from the date of acquisition. |
|---|
| ● | On June 29, 2018, we completed the acquisition of Heartland Steel Processing, LLC (formerly known as Companhia Siderurgica Nacional, LLC) (Heartland), for a total cash purchase price of $434.0 million. Heartland operations are reflected in our steel operations from the date of acquisition. |
|---|
| ● | In the fourth quarter of 2017, we recorded a tax benefit related primarily to the impact of the revaluation of the company’s deferred tax assets and liabilities as of December 31, 2017, using the lower federal tax rate enacted in the Tax Cuts and Jobs Act of 2017, which increased net income and net income attributable to Steel Dynamics, Inc. by $180.6 million, and basic and diluted earnings per share by $0.75. |
|---|
| ● | In the fourth quarter of 2016, we recorded a non-cash asset impairment charge associated with the company’s Minnesota ironmaking operations and certain OmniSource assets, which reduced 2016 operating and pretax income by $132.8 million, net income by $89.5 million, net income attributable to Steel Dynamics, Inc. by $76.4 million, and basic and diluted earnings per share by $0.31. |
|---|
| ● | In the fourth quarter of 2015, we recorded a pretax non-cash asset impairment charge related to goodwill, trade name and certain other assets associated with OmniSource, which reduced 2015 operating income by $428.5 million, and net income and net income attributable to Steel Dynamics, Inc. by $268.7 million, and basic and diluted earnings per share by $1.11. |
|---|
| | | | | | | | | | | | | | | |
|---|---|---|---|---|---|---|---|---|---|---|---|---|---|---|
| | | | | | | | | | | | | | | |
| | Years Ended December 31, | |||||||||||||
| | 2019 | | 2018 | | 2017 | | 2016 | | 2015 | |||||
| | | | | | | | | | | | | | | |
| | (dollars and shares in thousands, except per share data) | |||||||||||||
| Operating data: | | | | | | | | | | | | | | |
| Net sales | $ | 10,464,991 | | $ | 11,821,839 | | $ | 9,538,797 | | $ | 7,777,109 | | $ | 7,594,411 |
| Gross profit | | 1,530,984 | | | 2,322,814 | | | 1,582,014 | | | 1,334,864 | | | 731,718 |
| Operating income (loss) | | 986,880 | | | 1,722,409 | | | 1,066,881 | | | 727,966 | | | (72,784) |
| Asset impairment charges reflected in operating income (loss) | | - | | | - | | | - | | | (132,839) | | | (428,500) |
| Net income (loss) | | 677,900 | | | 1,255,805 | | | 805,796 | | | 360,006 | | | (145,170) |
| Net income (loss) attributable to Steel Dynamics, Inc. | | 671,103 | | | 1,258,379 | | | 812,741 | | | 382,115 | | | (130,311) |
| | | | | | | | | | | | | | | |
| Basic earnings (loss) per share | $ | 3.06 | | $ | 5.38 | | $ | 3.38 | | $ | 1.57 | | $ | (0.54) |
| Weighted average common shares outstanding | | 219,639 | | | 233,923 | | | 240,132 | | | 243,576 | | | 242,017 |
| | | | | | | | | | | | | | | |
| Diluted earnings (loss) per share | $ | 3.04 | | $ | 5.35 | | $ | 3.36 | | $ | 1.56 | | $ | (0.54) |
| Weighted average common shares and share | | | | | | | | | | | | | | |
| equivalents outstanding | | 220,748 | | | 235,193 | | | 241,781 | | | 245,298 | | | 242,017 |
| | | | | | | | | | | | | | | |
| Dividends declared per share | $ | 0.96 | | $ | 0.75 | | $ | 0.62 | | $ | 0.56 | | $ | 0.55 |
| | | | | | | | | | | | | | | |
| Capital expenditures | $ | 451,945 | | $ | 239,390 | | $ | 164,935 | | $ | 198,160 | | $ | 114,501 |
| | | | | | | | | | | | | | | |
| Other data (unaudited): | | | | | | | | | | | | | | |
| Shipments: | | | | | | | | | | | | | | |
| Steel operations segment (net tons) | | 10,816,641 | | | 10,609,763 | | | 9,726,977 | | | 9,245,946 | | | 8,328,150 |
| | | | | | | | | | | | | | | |
| Metals recycling operations segment | | | | | | | | | | | | | | |
| Ferrous metals (gross tons) | | 4,627,214 | | | 5,123,553 | | | 4,952,973 | | | 5,070,380 | | | 5,139,506 |
| Nonferrous metals (thousands of pounds) | | 1,068,208 | | | 1,131,412 | | | 1,086,799 | | | 1,103,505 | | | 1,082,777 |
| | | | | | | | | | | | | | | |
| Steel fabrication operations segment (net tons) | | 644,411 | | | 641,698 | | | 627,274 | | | 562,725 | | | 492,875 |
| | | | | | | | | | | | | | | |
| Steel operations segment production (net tons) | | 10,898,744 | | | 10,899,776 | | | 9,995,082 | | | 9,503,465 | | | 8,528,885 |
| | | | | | | | | | | | | | | |
| Number of employees | | 8,385 | | | 8,200 | | | 7,635 | | | 7,695 | | | 7,510 |
| | | | | | | | | | | | | | | |
| Balance sheet data: | | | | | | | | | | | | | | |
| Cash and equivalents and short-term investments | $ | 1,643,634 | | $ | 1,057,003 | | $ | 1,028,649 | | $ | 841,483 | | $ | 727,032 |
| Property, plant and equipment, net | | 3,135,886 | | | 2,945,767 | | | 2,675,904 | | | 2,787,215 | | | 2,951,210 |
| Total assets | | 8,275,765 | | | 7,703,563 | | | 6,855,732 | | | 6,423,732 | | | 6,202,082 |
| Long-term debt (including current maturities) | | 2,734,344 | | | 2,376,723 | | | 2,381,940 | | | 2,356,826 | | | 2,594,656 |
| Equity | | 3,921,241 | | | 3,775,989 | | | 3,195,068 | | | 2,777,459 | | | 2,545,111 |
| | | | | | | | | | | | | | | |
| Shares outstanding (in thousands) | | 214,503 | | | 225,272 | | | 237,397 | | | 243,785 | | | 243,090 |
Item 7. MANAGEMENT’S DISCUSSION AND ANALYSIS OF FINANCIAL CONDITION AND RESULTS OF OPERATIONS
Forward-Looking Statements
This report contains some predictive statements about future events, including statements related to conditions in domestic or global economies, conditions in the steel and recycled metals market places, Steel Dynamics’ revenues, costs of purchased materials, future profitability and earnings, and the operation of new, existing or planned facilities. These statements, which we generally precede or accompany by such typical conditional words as "anticipate," "intend," "believe," "estimate," "plan," "seek," "project" or "expect," or by the words "may," "will," or "should," are intended to be made as “forward-looking,” subject to many risks and uncertainties, within the safe harbor protections of the Private Securities Litigation Reform Act of 1995. These statements speak only as of this date and are based upon information and assumptions, which we consider reasonable as of this date, concerning our businesses and the environments in which they operate. Such predictive statements are not guarantees of future performance, and we undertake no duty to update or revise any such statements. Some factors that could cause such forward-looking statements to turn out differently than anticipated include: (1) the effects of uncertain economic conditions; (2) cyclical and changing industrial demand; (3) changes in conditions in any of the steel or scrap-consuming sectors of the economy which affect demand for our products, including the strength of the non-residential and residential construction, automotive, manufacturing, appliance, pipe and tube, and other steel-consuming industries; (4) fluctuations in the cost of key raw materials and supplies (including steel scrap, iron units, zinc, graphite electrodes, and energy costs) and our ability to pass on any cost increases; (5) the impact of domestic and foreign imports, including trade policy, restrictions, or agreements; (6) unanticipated difficulties in integrating or starting up new, acquired or planned businesses or assets; (7) risks and uncertainties involving product and/or technology development; and (8) occurrences of unexpected plant outages or equipment failures.
More specifically, we refer you to our more detailed explanation of these and other factors and risks that may cause such predictive statements to turn out differently, as set forth in the sections titled Special Note Regarding Forward-Looking Statements at the beginning of Part I of this Report and Item 1A. Risk Factors, as well as in other subsequent reports we file with the Securities and Exchange Commission. These reports are available publicly on the Securities and Exchange Commission website, www.sec.gov, and on our website, www.steeldynamics.com under “Investors – SEC Filings.”
Operating Statement Classifications
Net Sales. Net sales from our operations are a factor of volumes shipped, product mix and related pricing. We charge premium prices for certain grades of steel, product dimensions, certain smaller volumes, and for value-added processing or coating of our steel products. Except for the steel fabrication operations, we recognize revenues from sales and the allowance for estimated returns and claims from these sales at the point in time control of the product transfers to the customer, upon shipment or delivery. Our steel fabrication operations recognize revenues over time based on completed fabricated tons to date as a percentage of total tons required for each contract.
Costs of Goods Sold. Our costs of goods sold represent all direct and indirect costs associated with the manufacture of our products. The principal elements of these costs are scrap and scrap substitutes (which represent the most significant single component of our consolidated costs of goods sold), steel substrate, direct and indirect labor and related benefits, alloys, zinc, transportation and freight, repairs and maintenance, utilities such as electricity and natural gas, and depreciation.
Selling, General and Administrative Expenses. Selling, general and administrative expenses consist of all costs associated with our sales, finance and accounting, and administrative departments. These costs include, among other items, labor and related benefits, professional services, insurance premiums, and property taxes. Company-wide profit sharing and amortization of intangible assets are each separately presented in the statement of income.
Interest Expense, net of Capitalized Interest. Interest expense consists of interest associated with our senior credit facilities and other debt net of interest costs that are required to be capitalized during the construction period of certain capital investment projects.
Other Income, net. Other income consists of interest income earned on our temporary cash deposits and short-term investments; any other non-operating income activity, including income from non-consolidated investments accounted for under the equity method. Other expense consists of any non-operating costs, such as certain acquisition and financing expenses.
2019 Overview
Our 2019 consolidated results were challenged by high customer steel inventories, as many customers purchased beyond normal demand levels in late 2018. Underlying domestic steel demand remained steady in 2019, but as customers began to destock
inventories, steel prices declined throughout the year in conjunction with weakening scrap prices, before firming in the fourth quarter as destocking subsided and inventory levels were right-sized. Declining ferrous scrap prices throughout much of 2019 negatively impacted our metals recycling operations financial results. The non-residential construction market remained strong, resulting in record steel fabrication shipments with increased selling prices and margins compared to 2018. In spite of the market challenges faced by our steel and metals recycling operations, our consolidated net sales of $10.5 billion and cash flows from operations of $1.4 billion were the second-best performance in company history, and our consolidated operating income was our third-best in company history. In addition, our steel fabrication operations segment achieved record shipments of 644,000 tons, resulting in record operating income of $119.1 million.
Consolidated operating income for 2019 decreased $735.5 million, or 43%, to $986.9 million, compared to the record $1.7 billion in 2018. Net income attributable to Steel Dynamics, Inc. for 2019 decreased $587.3 million, or 47%, to $671.1 million, compared to record 2018. Diluted earnings per share attributable to Steel Dynamics, Inc. was $3.04 for 2019, compared to $5.35 for 2018.
Refer to Item 7. Management’s Discussion and Analysis of Financial Condition and Results of Operations in Part II of our Annual Report on Form 10-K for the year ended December 31, 2018, for additional information regarding results of operations for the year ended December 31, 2018, as compared to the year ended December 31, 2017, and segment operating results for 2018 as compared to 2017.
Acquisition of United Steel Supply, LLC
On March 1, 2019, we purchased 75% of the equity interest of United Steel Supply, LLC (USS) for cash consideration of $93.4 million, plus a customary working capital transaction purchase price adjustment of $3.7 million, which was paid in September 2019. Additionally, we have an option to purchase, and the sellers have the option to require us to purchase, the remaining 25% equity interest of USS in the future. Headquartered in Austin, Texas, USS is a leading distributor of painted Galvalume® flat roll steel used for roofing and siding applications, with distribution centers strategically located in Mississippi, Indiana, Arkansas, and Oregon. USS provides the steel segment a new, complementary distribution channel and connects us to a rapidly growing industry segment with customers that do not traditionally purchase steel directly from a steel producer. USS’s operating results from and after March 1, 2019, are reflected in our financial statements in the steel operations reporting segment.
Segment Operating Results (dollars in thousands)
| | | | | | | | | |
|---|---|---|---|---|---|---|---|---|
| | | | | | | | | |
| | Years Ended December 31, | | ||||||
| | 2019 | | % Change | | 2018 | | ||
| | | | | | | | | |
| Net sales | | | | | | | | |
| Steel Operations | $ | 8,234,179 | | (11)% | | $ | 9,263,152 | |
| Metals Recycling Operations | | 2,494,014 | | (22)% | | | 3,202,214 | |
| Steel Fabrication Operations | | 963,259 | | 4% | | | 921,951 | |
| Other | | 400,747 | | (7)% | | | 429,060 | |
| | | 12,092,199 | | | | | 13,816,377 | |
| Intra-company | | (1,627,208) | | | | | (1,994,538) | |
| | $ | 10,464,991 | | (11)% | | $ | 11,821,839 | |
| | | | | | | | | |
| Operating income (loss) | | | | | | | | |
| Steel Operations | $ | 1,030,554 | | (44)% | | $ | 1,839,852 | |
| Metals Recycling Operations | | 16,308 | | (79)% | | | 75,891 | |
| Steel Fabrication Operations | | 119,099 | | 92% | | | 61,901 | |
| Other | | (186,159) | | 26% | | | (253,195) | |
| | | 979,802 | | | | | 1,724,449 | |
| Intra-company | | 7,078 | | | | | (2,040) | |
| | $ | 986,880 | | (43)% | | $ | 1,722,409 | |
| Steel Operations Segment |
Steel operations consist of our electric arc furnace steel mills, producing sheet and long products steel from ferrous scrap and scrap substitutes, utilizing continuous casting and automated rolling mills, with numerous downstream processing and coating lines, as well as IDI, our liquid pig iron production facility that supplies solely the Butler Flat Roll Division. Our steel operations sell a diverse portfolio of sheet and long products directly to end-users, steel fabricators, and service centers. These products are used in a wide variety of industry sectors, including the construction, automotive, manufacturing, transportation, heavy equipment and agriculture, and pipe and tube (including OCTG) markets (see Item 1. Business). Steel operations accounted for 76% and 75% of our consolidated net sales during 2019 and 2018, respectively.
Steel Operations Shipments (tons):
| | | | | | | |
|---|---|---|---|---|---|---|
| | | | | | | |
| | Years Ended December 31, | | ||||
| | 2019 | | % Change | | 2018 | |
| Total shipments | 10,816,641 | | 2% | | 10,609,763 | |
| Intra-segment shipments | (975,372) | | | | (612,655) | |
| Steel Operations Segment shipments | 9,841,269 | | (2)% | | 9,997,108 | |
| | | | | | | |
| External shipments | 9,402,608 | | (2)% | | 9,625,291 | |
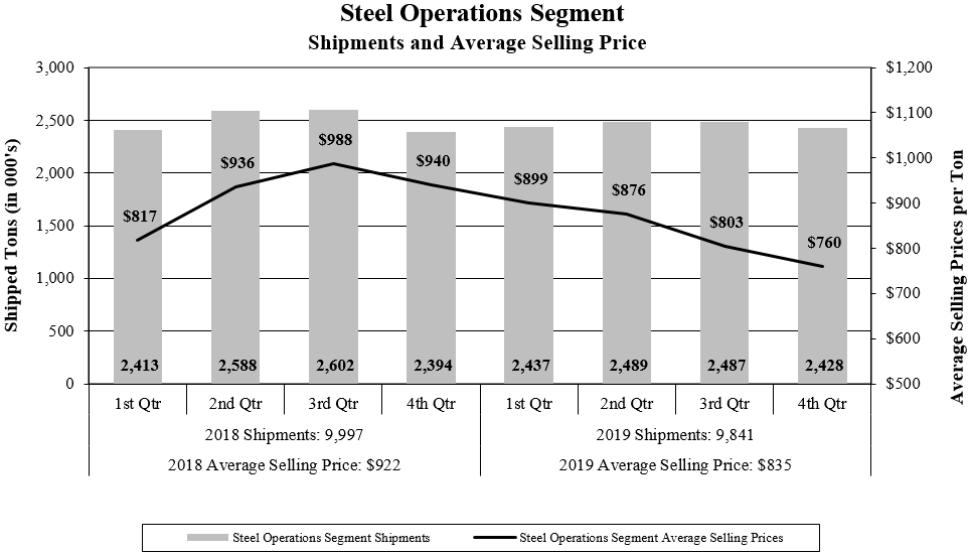
Segment Results 2019 vs. 2018
Overall domestic steel demand remained steady during 2019, with continued strength in the automotive, construction and other industrial sectors. However, a challenging steel pricing environment continued throughout 2019, due to customer inventory destocking in conjunction with weakening scrap prices, which led to decreasing steel selling prices compared to 2018. Steel operations segment shipments decreased 2% in 2019, as compared to 2018. Net sales for the steel operations decreased 11% in 2019
when compared to 2018, due primarily to decreases in overall steel selling prices, particularly in sheet steel, and decreased steel mill shipments.
Ferrous raw materials used in our electric arc furnaces represent our single most significant steel manufacturing cost, generally comprising approximately 55 to 60 percent of our steel mill operations’ manufacturing costs. Our metallic raw material cost per net ton consumed in our steel operations decreased $48, or 14%, in 2019 compared to 2018, consistent with overall decreased domestic scrap pricing.
As a result of average selling prices decreasing more than scrap costs, metal spread (which we define as the difference between average steel mill selling prices and the cost of ferrous scrap consumed in our steel mills) decreased 10% in 2019 compared to the record-high 2018. Due to this metal spread contraction, most notably in sheet steel, operating income for the steel operations decreased 44%, to $1.0 billion, in 2019 compared to the record results in 2018.
| Metals Recycling Operations Segment |
|---|
Metals recycling operations consists solely of OmniSource and includes both ferrous and nonferrous scrap metal processing, transportation, marketing, and brokerage services, strategically located primarily in close proximity to our steel mills and other end-user scrap consumers throughout the eastern half of the United States. In addition, OmniSource designs, installs, and manages customized scrap management programs for industrial manufacturing companies at hundreds of locations throughout North America. Our steel mills utilize a large portion (approximately 65%) of the ferrous scrap sold by OmniSource as raw material in our steelmaking operations, and the remainder is sold to other consumers, such as other steel manufacturers and foundries. Metals recycling operations accounted for 11% and 13% of our consolidated net sales during 2019 and 2018, respectively.
Metals Recycling Operations Shipments:
| | | | | | | | |
|---|---|---|---|---|---|---|---|
| | | | | | | | |
| | | Years Ended December 31, | | ||||
| | | 2019 | | % Change | | 2018 | |
| Ferrous metal (gross tons) | | | | | | | |
| Total | | 4,627,214 | | (10)% | | 5,123,553 | |
| Inter-company | | (3,061,257) | | (9)% | | (3,346,135) | |
| External shipments | | 1,565,957 | | (12)% | | 1,777,418 | |
| | | | | | | | |
| Nonferrous metals (thousands of pounds) | | | | | | | |
| Total | | 1,068,208 | | (6)% | | 1,131,412 | |
| Inter-company | | (144,229) | | | | (138,001) | |
| External shipments | | 923,979 | | (7)% | | 993,411 | |
Segment Results 2019 vs. 2018
Our metals recycling operations were negatively impacted throughout 2019 by falling ferrous and nonferrous scrap prices compared to 2018, as well as a challenging steel market in which customers were also reluctant to purchase during a falling pricing environment. Net sales for our metals recycling operations decreased 22% in 2019 as compared to 2018, driven by decreased shipments and ferrous scrap prices declining in eight of the twelve months during the year. Ferrous and nonferrous scrap average selling prices decreased 21% and 10%, respectively, during 2019 compared to 2018. Ferrous metal spread (which we define as the difference between average selling prices and the cost of purchased scrap) decreased 15%, while nonferrous metal spread decreased 7% in 2019 compared to 2018. Metals recycling operations operating income in 2019 of $16.3 million decreased 79% from 2018 operating income of $75.9 million, due to lower ferrous and nonferrous shipments, and metal spread contraction.
| Steel Fabrication Operations Segment |
|---|
Steel fabrication operations include our New Millennium Building Systems joist and deck plants located throughout the United States and in Northern Mexico. Revenues from these plants are generated from the fabrication of steel joists, trusses, girders and steel deck used within the non-residential construction industry. Steel fabrication operations accounted for 9% and 8% of our consolidated net sales during 2019 and 2018, respectively.
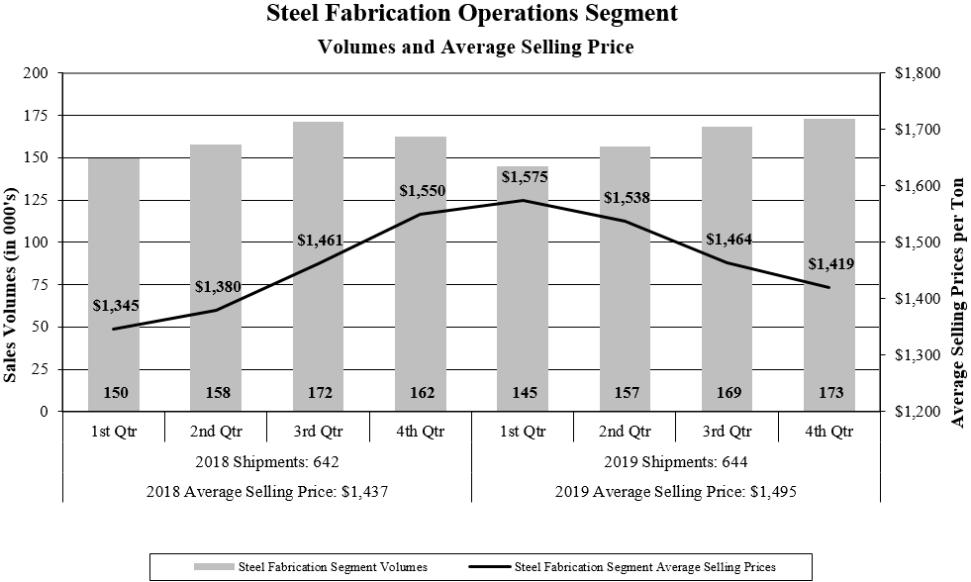
Segment Results 2019 vs. 2018
Net sales for the steel fabrication operations increased $41.3 million, or 4%, during 2019 compared to 2018, as shipments increased to a record 644,000 tons, while average selling prices increased $58 per ton, or 4%. Our steel fabrication operations continue to leverage our national operating footprint. Market demand, orders and backlog continue to be strong for non-residential construction project development, as customer sentiment remains positive.
The purchase of various steel products is the largest single cost of production for our steel fabrication operations, generally representing approximately two-thirds of the total cost of manufacturing. The average cost of steel consumed decreased by 7% in 2019, as compared to 2018, consistent with decreased steel selling prices discussed in the steel operations results, while average selling prices increased 4%, with resulting metal spread (which we define as the difference between average selling prices and the cost of purchased steel) increasing 22%. Operating income increased $57.2 million, or 92%, to $119.1 million in 2019 compared to 2018, due to the increases in volumes and metal spread, with selling prices outpacing steel input costs.
| Other Operations |
|---|
Consolidated Results 2019 vs. 2018
Selling, General and Administrative Expenses. Selling, general and administrative expenses increased 5%, or $19.9 million, to $436.5 million during 2019 compared to 2018, representing 4.2% and 3.5% of net sales, respectively. Profit sharing expense was $78.0 million in 2019, a decrease of $78.0 million from the record $156.0 million earned during 2018. The company-wide profit sharing plan represents 8% of pretax earnings; therefore, our lower 2019 earnings resulted in lower profit sharing.
Interest Expense, net of Capitalized Interest. During 2019, interest expense of $127.1 million was comparable to the $126.6 million incurred during 2018, based on consistent debt levels during the majority of both years.
Income Tax Expense. During 2019, income tax expense of $197.4 million, representing an effective income tax rate of 22.6%, was down 46% from the $364.0 million, representing an effective income tax rate of 22.5%, during 2018, consistent with lower pretax earnings.
Included in the balance of unrecognized tax benefits of $10.2 million at December 31, 2019, were potential benefits of $6.0 million that, if recognized, would affect our effective tax rate. We recognize interest and penalties related to our tax contingencies on a net-of-tax basis in income tax expense. During the year ended December 31, 2019, we recognized a benefit from the decrease of interest expense of $400,000, net of tax. In addition to the unrecognized tax benefits noted above, we had $1.4 million accrued for the payment of interest and penalties at December 31, 2019.
We file income tax returns in the United States federal jurisdiction as well as income tax returns in various state jurisdictions. We have concluded U.S. federal income tax audits through 2015. We are subject to examination and proposed adjustments by the IRS for years 2016 through 2018, and tax years 2015 through 2018 remain open to various state and local jurisdictions. At this time, we do not believe there will be any significant examination adjustments that would result in a material change to our financial position, results of operations or cash flows. It is reasonably possible that the amount of unrecognized tax benefits could change in the next twelve months in an amount ranging from zero to $3.3 million, as a result of the expiration of the statute of limitations and other federal and state income tax audits.
Liquidity and Capital Resources
Capital Resources and Long-term Debt. Our business is capital intensive and requires substantial expenditures for, among other things, the purchase and maintenance of equipment used in our steel, metals recycling, and steel fabrication operations, and to remain in compliance with environmental laws. Our short-term and long-term liquidity needs arise primarily from working capital requirements, capital expenditures, principal and interest payments related to our outstanding indebtedness, dividends to our shareholders, stock repurchases, and acquisitions. We have met these liquidity requirements primarily with cash provided by operations and long-term borrowings, and we also have availability under our unsecured Revolver. Our liquidity at December 31, 2019, is as follows (in thousands):
| | | | | | | | | | |
|---|---|---|---|---|---|---|---|---|---|
| | | | | | | | | | |
| | | | Cash and equivalents | | $ | 1,381,460 | | | |
| | | | Short-term investments | | | 262,174 | | | |
| | | | Unsecured revolver availability | | | 1,158,039 | | | |
| | | | Total liquidity | | $ | 2,801,673 | | | |
In October 2019, our corporate credit rating was upgraded to an investment grade credit designation by three credit rating agencies.
In December 2019, we entered into a new unsecured credit agreement which has a senior unsecured revolving credit facility (Facility), which provides a $1.2 billion unsecured Revolver, and matures in December 2024. Subject to certain conditions, we have the opportunity to increase the Facility size by $500.0 million. The unsecured Revolver is available to fund working capital, capital expenditures, and other general corporate purposes. The Facility contains financial covenants and other covenants pertaining to our ability to incur indebtedness and permit liens on property. Our ability to borrow funds within the terms of the unsecured Revolver is dependent upon our continued compliance with the financial and other covenants. At December 31, 2019, we had $1.2 billion of availability on the Revolver, $42.0 million of outstanding letters of credit and other obligations which reduce availability, and there were no borrowings outstanding.
The financial covenants under our Facility state that we must maintain an interest coverage ratio of not less than 2.50:1.00. Our interest coverage ratio is calculated by dividing our last-twelve-months (LTM) consolidated adjusted EBITDA (earnings before interest, taxes, depreciation, amortization, and certain other non-cash transactions as allowed in the Facility) by our LTM gross interest expense, less amortization of financing fees. In addition, a debt to capitalization ratio of not more than 0.60:1.00 must be maintained. At December 31, 2019, our interest coverage ratio and debt to capitalization ratio were 10.72:1.00 and 0.40:1.00, respectively. We were, therefore, in compliance with these covenants at December 31, 2019, and we anticipate we will continue to be in compliance during the next twelve months.
In December 2019, we issued $400.0 million of 2.800% senior notes due 2024 (the "2024 Notes"), and $600.0 million of 3.450% senior notes due 2030 (the “2030 Notes”), the net proceeds of which were used to fund the call and redemption of all $700.0 million of our 5.125% Senior Notes due 2021 (the "2021 Notes") in accordance with the indenture governing our 2021 Notes, and for general corporate purposes. Refer to Note 3. Long-term Debt to the consolidated financial statements elsewhere in this report for additional information regarding these transactions, and our long-term debt
Our total outstanding debt increased $357.6 million during 2019, due to our December 2019 issuance of the 2024 Notes and 2030 Notes as described above. Our total long-term debt to capitalization ratio (representing our long-term debt, including current maturities, divided by the sum of our long-term debt, redeemable noncontrolling interests, and our total stockholders’ equity) was 40.2% and 37.9% at December 31, 2019, and December 31, 2018, respectively.
Working Capital. We generated cash flow from operations of $1.4 billion in 2019. Operational working capital (representing amounts invested in trade receivables and inventories, less current liabilities other than income taxes payable and debt) decreased $339.5 million, excluding the effect of acquired USS working capital, to $1.6 billion at December 31, 2019, due primarily to decreased accounts receivable and inventories consistent with decreased sales and inventory costs.
Capital Investments. During 2019, we invested $451.9 million in property, plant and equipment, primarily within our steel operations segment, compared with $239.4 million invested during 2018. The increase in 2019 relates primarily to organic steel growth opportunities, including our new electric arc furnace flat roll steel mill currently under construction in Sinton, Texas.
Cash Dividends. As a reflection of continued confidence in our current and future cash flow generation ability and financial position, we increased our quarterly cash dividend by 28% to $0.2400 per share in the first quarter 2019 (from $0.1875 per share in 2018), resulting in declared cash dividends of $209.5 million during 2019, compared to $174.4 million during 2018. We paid cash dividends of $200.3 million and $168.9 million during 2019 and 2018, respectively. Our board of directors, along with executive management, approves the payment of dividends on a quarterly basis. The determination to pay cash dividends in the future is at the discretion of our board of directors, after taking into account various factors, including our financial condition, results of operations, outstanding indebtedness, current and anticipated cash needs and growth plans.
Other. In August 2018, our board of directors authorized a share repurchase program of up to $750 million of our common stock. Under the share repurchase program, purchases will take place, as and when, we determine in open market or private transactions made based upon the market price of our common stock, the nature of other investment opportunities or growth projects, our cash flows from operations, and general economic conditions. The share repurchase program does not require us to acquire any specific number of shares, and may be modified, suspended, extended or terminated by us at any time. We acquired 11.3 million shares of our common stock for $348.6 million in 2019, leaving $50.5 million remaining available to purchase under the program at December 31, 2019. See Part II, Item 5. Market for Registrant’s Common Equity, Related Stockholder Matters and Issuer Purchases of Equity Securities for additional information.
Our ability to meet our debt service obligations and reduce our total debt will depend upon our future performance which, in turn, will depend upon general economic, financial and business conditions, along with competition, legislation and regulatory factors that are largely beyond our control. In addition, we cannot assure that our operating results, cash flows, access to credit markets and capital resources will be sufficient for repayment of our indebtedness in the future. We believe that based upon current levels of operations and anticipated growth, cash flows from operations, together with other available sources of funds, including if necessary borrowings under our Revolver through its term, will be adequate for the next twelve months for making required payments of principal and interest on our indebtedness, funding working capital requirements, and anticipated capital expenditures.
Contractual Obligations and Other Long-Term Liabilities
We have the following minimum commitments under contractual obligations, including purchase obligations, as defined by the Securities and Exchange Commission. A “purchase obligation” is defined as an agreement to purchase goods or services that is enforceable and legally binding and that specifies all significant terms, including fixed or minimum quantities to be purchased; fixed, minimum or variable price provisions; and the approximate timing of the transaction. Other long-term liabilities are defined as long-term liabilities that are reflected on our balance sheet under generally accepted accounting principles. Based on this definition, the following table includes only those contracts which include fixed or minimum obligations. It does not include normal purchases, which are made in the ordinary course of business. The following table provides aggregated information about outstanding contractual obligations and other long-term liabilities as of December 31, 2019 (in thousands):
| | | | | | | | | | | | | | | |
|---|---|---|---|---|---|---|---|---|---|---|---|---|---|---|
| | | | | | | | | | | | | | | |
| | Payments Due By Period | |||||||||||||
| | Total | | 2020 | | 2021 & 2022 | | 2023 & 2024 | | 2025 & After | |||||
| Long-term debt (1) | $ | 2,764,472 | | $ | 89,356 | | $ | 7,976 | | $ | 1,307,082 | | $ | 1,360,058 |
| Estimated interest payments on debt (2) | | 710,920 | | | 121,513 | | | 236,952 | | | 192,709 | | | 159,746 |
| Purchase obligations (3) | | 677,652 | | | 240,832 | | | 223,621 | | | 62,640 | | | 150,559 |
| Construction commitments (4) | | 820,429 | | | 734,029 | | | 86,400 | | | - | | | - |
| Lease commitments | | 84,441 | | | 20,201 | | | 30,991 | | | 18,194 | | | 15,055 |
| Other commitments (5) | | 1,626 | | | 250 | | | 425 | | | 400 | | | 551 |
| Total (6) | $ | 5,059,540 | | $ | 1,206,181 | | $ | 586,365 | | $ | 1,581,025 | | $ | 1,685,969 |
| (1) | The long-term debt payment information presented above assumes that our senior notes remain outstanding until maturity. Refer to Note 3. Long-term Debt to the consolidated financial statements elsewhere in this report for additional information regarding these transactions, and our long-term debt. |
|---|
| (2) | The estimated interest payments shown above assume interest rates of 5¼% on our $400.0 million senior unsecured notes due April 2023; 2.800% on our $400.0 million senior unsecured notes due December 2024; 5.500% on our $500.0 million senior unsecured notes due October 2024; 4.125% on our $350.0 million senior unsecured notes due September 2025; 5.00% on our $400.0 million senior unsecured notes due December 2026; 3.450% on our $600.0 million senior unsecured notes due April 2030; 0.175% commitment fee on our available Revolver; and an average of 3.7% on our other debt of $114.5 million. |
|---|
| (3) | Purchase obligations include commitments we have for the purchase of such commodities as electricity, water, natural gas and its transportation services, fuel, air products, zinc, and electrodes. These arrangements have “take or pay” or other similar commitment provisions. We have utilized such “take or pay” requirements during the past three years under these contracts, except for certain air products at our Minnesota ironmaking operations which have been idle since May 2015. Purchase obligations related to the start-up of our new Southwest-Sinton Flat Roll Division total $137.3 million, starting in 2021. Refer to Note 9. Commitments and Contingencies to the consolidated financial statements elsewhere in this report for additional information. |
|---|
| (4) | Construction commitments relate to firm contracts we have with various vendors for the completion of certain construction projects at our various divisions at December 31, 2019. Construction commitments related to our new Southwest-Sinton Flat Roll Division mill comprise $681.9 million of this total, including the $86.4 million in 2021. Refer to Note 9. Commitments and Contingencies to the consolidated financial statements elsewhere in this report for additional information. |
|---|
| (5) | Other commitments principally relate to deferred compensation plan obligations. |
|---|
| (6) | We expect to make cash outlays in the future related to our unrecognized tax benefits; however, due to the uncertainty of the timing, we are unable to make reasonably reliable estimates regarding the period of cash settlement with the respective taxing authorities. Accordingly, unrecognized tax benefits and related interest and penalties of $11.6 million as of December 31, 2019, have been excluded from the contractual obligations table above. Refer to Note 4. Income Taxes to the consolidated financial statements elsewhere in this report for additional information. |
|---|
Other Matters
Inflation
We believe that inflation has not had a material effect on our results of operations.
Environmental and Other Contingencies
We have incurred, and in the future will continue to incur, capital expenditures and operating expenses for matters relating to environmental control, remediation, monitoring and compliance. During 2019, we incurred costs related to the monitoring and compliance of environmental matters in the amount of approximately $32.1 million and capital expenditures related to environmental compliance of approximately $2.3 million. Of the costs incurred during 2019 for monitoring and compliance, approximately 68% were related to the normal transportation of certain types of waste produced in our steelmaking processes and other facilities, in accordance with legal requirements. We incurred combined environmental remediation costs of approximately $1.3 million at all of our facilities during 2019. We have an accrual of $3.6 million recorded for environmental remediation related to our metals recycling operations, and $2.6 million related to our Minnesota ironmaking operations. We believe, apart from our dependence on environmental construction and operating permits for our existing and any future manufacturing facilities, that compliance with current environmental laws and regulations is not likely to have a materially adverse effect on our financial condition, results of operations or liquidity. However, environmental laws and regulations evolve and change, and we may become subject to more stringent environmental laws and regulations in the future, such as the impact of United States government or various governmental agencies introducing regulatory changes in response to the potential of climate change.
Critical Accounting Policies and Estimates
Management’s Discussion and Analysis of Our Financial Condition and Results of Operations is based upon our consolidated financial statements, which have been prepared in accordance with accounting principles generally accepted in the United States. We review the accounting policies we use in reporting our financial results on a regular basis. The preparation of these financial statements requires us to make estimates and judgments that affect the reported amounts of assets, liabilities, revenues and expenses and related disclosure of contingent liabilities. We evaluate the appropriateness of these estimations and judgments on an ongoing basis. We base our estimates on historical experience and on various other assumptions that are believed to be reasonable under the circumstances, the results of which form the basis for making judgments about the carrying value of assets and liabilities that are not readily apparent from other sources. Results may differ from these estimates due to actual outcomes being different from those on which we based our assumptions. We believe the following critical accounting policies affect our more significant judgments and estimates used in the preparation of our consolidated financial statements.
Revenue Recognition and Allowance for Doubtful Accounts. Except for our steel fabrication operations, we recognize revenues at the point in time the performance obligation is satisfied, and control of the product is transferred to the customer upon shipment or delivery, at the amount of consideration the company expects to receive, including any variable consideration. The variable consideration included in the company’s steel operations segment contracts, which is not constrained, include estimated product returns and customer claims, and may include volume rebates which are recorded on an expected value basis. Our steel fabrication operations segment recognizes revenue over time at the amount of consideration the company expects to receive. Revenue is measured on an output method representing completed fabricated tons to date as a percentage of total tons required for each contract. The company does not exercise significant judgements in determining the timing of satisfaction of performance obligations or the transaction price. Provision is made for estimated product returns and customer claims based on historical experience. If the historical data used in our estimates does not reflect future returns and claims trends, additional provision may be necessary. The allowance for doubtful accounts is based on our best estimate of known credit risks, historical experience, and current economic conditions affecting our customers, which estimates may or may not prove accurate.
We are exposed to credit risk in the event of nonpayment by our customers, which in steel operations are principally intermediate steel processors and service centers that sell our products to numerous industry sectors, including the construction, automotive, manufacturing, transportation, heavy and agriculture equipment, and pipe and tube (including OCTG) markets. Our metals recycling operations sell ferrous scrap to steel mills and foundries, and nonferrous scrap, such as copper, brass, aluminum and stainless steel to, among others, ingot manufacturers, copper refineries and mills, smelters, and specialty mills. Our steel fabrication operations sell fabricated steel joists and deck primarily to the non-residential construction market. We mitigate our exposure to credit risk, which we generally extend initially on an unsecured basis, by performing ongoing credit evaluations and taking further action when necessary, such as requiring letters of credit or other security interests to support the customer receivable. If the financial condition of our customers were to deteriorate, resulting in the impairment of their ability to make payments, additional allowance may be required.
Inventories. We record inventories at lower of cost or net realizable value. Cost is determined using a weighted average cost method for raw materials and supplies, and on a first-in, first-out, basis for other inventory. We record amounts required, if any, to reduce the carrying value of inventory to its net realizable value as a charge to cost of goods sold. If product selling prices were to decline in future periods, further write-down of inventory could result, specifically raw material inventory such as scrap purchased during periods of peak market pricing.
Impairments of Long-Lived Tangible and Definite-Lived Intangible Assets. We review long-lived assets for impairment whenever events or changes in circumstances indicate the carrying amount of such assets may not be fully recoverable. Impairment losses are recorded on long-lived assets used in operations when indicators of impairment are present and the undiscounted cash flows estimated to be generated by those assets are less than the assets’ carrying amounts. The impairment loss is measured by comparing the fair value of the asset to its carrying amount. We consider various factors and determine whether an impairment test is necessary, including by way of examples, a significant and prolonged deterioration in operating results and/or projected cash flows, significant changes in the extent or manner in which an asset is used, technological advances with respect to assets which would potentially render them obsolete, our strategy and capital planning, and the economic climate in markets to be served. When determining future cash flows and if necessary, fair value, we must make judgments as to the expected utilization of assets and estimated future cash flows related to those assets. We consider historical and anticipated future results, general economic and market conditions, the impact of planned business and operational strategies and all other available information at the time the estimates are made. Those estimates and judgments may or may not ultimately prove accurate.
A long-lived asset is classified as held for sale upon meeting specified criteria related to ability and intent to sell. An asset classified as held for sale is measured at the lower of its carrying amount or fair value less cost to sell. As of December 31, 2019, and 2018, the company reported $8.0 million and $8.3 million, respectively, of assets held for sale within other current assets in our consolidated balance sheet. An impairment loss is recognized for any initial or subsequent write-down of the asset held for sale to its fair value less cost to sell. For assets determined to be classified as held for sale in the year ended December 31, 2019 and 2018, the asset carrying amounts approximated their fair value less cost to sell. The company determined fair value using Level 3 fair value inputs as provided for under ASC 820, consisting of information provided by brokers and other external sources along with management’s own assumptions.
Goodwill.
Our goodwill, relating to various business combinations, consisted of the following at December 31 (in thousands):
| | | | | | | | | |
|---|---|---|---|---|---|---|---|---|
| | | | 2019 | | 2018 | | ||
| | | | | | | | | |
| | Steel Operations Segment | | $ | 272,133 | | $ | 245,473 | |
| | Metals Recycling Operations Segment | | | 178,857 | | | 182,247 | |
| | Steel Fabrication Operations Segment | | | 1,925 | | | 1,925 | |
| | | | $ | 452,915 | | $ | 429,645 | |
At least once annually (as of October 1), or when indicators of impairment exist, the company performs an impairment test for goodwill. Goodwill is allocated to various reporting units, which are generally one level below the company’s operating segments. The fair value of the reporting unit is determined by using an estimate of future cash flows utilizing a risk-adjusted discount rate to calculate the net present value of future cash flows (income approach), and by using a market approach based upon an analysis of valuation metrics of comparable peer companies, using Level 3 fair value inputs as provided for under ASC 820. If the fair value exceeds the carrying value of the reporting unit, there is no impairment. If the carrying amount exceeds the fair value, we recognize an impairment loss in the amount by which the carrying value of the net assets assigned to the reporting unit exceeds the fair value of the reporting unit, with the impairment loss not to exceed the amount of goodwill allocated to the reporting unit.
Key assumptions used to determine the estimated fair value of each reporting unit under the discounted cash flows method (income approach) include: (a) expected cash flows for the five-year period following the testing date (including market share, sales volumes and prices, costs to produce and estimated capital needs); (b) an estimated terminal value using a terminal year growth rate determined based on the growth prospects of the reporting unit; and (c) a risk-adjusted discount rate based on management’s best estimate of market participants’ after-tax weighted average cost of capital and market risk premiums. Key assumptions used to determine the estimated fair value of each reporting unit under the market approach include the expected revenues and cash flows in the next year. We consider historical and anticipated future results, general economic and market conditions, the impact of planned business and operational strategies and all available information at the time the fair values of its reporting units are estimated. Those estimates and judgments may or may not ultimately prove accurate.
Goodwill acquired in past transactions are naturally more susceptible to impairment, primarily due to the fact that they are recorded at fair value based on operating plans and economic conditions at the time of acquisition. Consequently, if operating results and/or economic conditions deteriorate after an acquisition, it could result in the impairment of the acquired assets. A deterioration of economic conditions may not only negatively impact the estimated operating cash flows used in our cash flow models but may also negatively impact other assumptions used in our analyses, including, but not limited to, the estimated cost of capital and/or discount rates. Additionally, we are required to ensure that assumptions used to determine fair value in our analyses are consistent with the assumptions a hypothetical marketplace participant would use. As a result, the cost of capital and/or discount rates used in our
analyses may increase or decrease based on market conditions and trends, regardless of whether our actual cost of capital has changed. Therefore, we may recognize an impairment in spite of realizing actual cash flows that are approximately equal to or greater than our previously forecasted amounts.
Our fourth quarter 2019, 2018, and 2017 annual goodwill impairment analyses did not result in any impairment charges. Management does not believe that it is reasonably likely that our reporting units will fail the goodwill impairment test in the near term, as the determined fair value of the reporting units with goodwill exceeded their carrying value by more than an insignificant amount. We will continue to monitor operating results within all reporting units throughout the upcoming year to determine if events and circumstances warrant interim impairment testing. Otherwise, all reporting units will again be subject to the required annual impairment test during the fourth quarter of 2020. Changes in judgments and estimates underlying our analysis of goodwill for possible impairment, including expected future operating cash flows and discount rate, could decrease the estimated fair value of our reporting units in the future and could result in an impairment of goodwill.
Income Taxes. We are required to estimate our income taxes as a part of the process of preparing our consolidated financial statements. This requires us to estimate our actual current tax exposure together with assessing temporary differences resulting from differing treatments of items for tax and accounting purposes. These differences result in deferred tax assets and liabilities, which are included within our consolidated balance sheet. We must then assess the likelihood that our deferred tax assets will be recovered from future taxable income and, to the extent we believe that recovery is not likely, we must establish a valuation allowance. We also establish reserves to reduce some or all of the tax benefit of any of our tax positions at the time we determine that the positions become uncertain. We adjust these reserves, including any impact on the related interest and penalties, in light of changing facts and circumstances, such as the progress of a tax audit. A number of years may elapse before a particular matter for which we have established a reserve is audited by a taxing authority and finally resolved. The number of years with open tax audits varies depending on the tax jurisdiction. The tax benefit that has been previously reserved because of a failure to meet the "more likely than not" recognition threshold would be recognized in our income tax expense in the first interim period when the uncertainty disappears. Settlement of any particular issue would usually require the use of cash.
Item 7A. QUANTITATIVE AND QUALITATIVE DISCLOSURES ABOUT MARKET RISK
Market Risk
In the normal course of business, we are exposed to interest rate changes. Our objectives in managing fluctuations in interest rates are to limit the impact of these rate changes on earnings and cash flows and to lower overall borrowing costs. To achieve these objectives, we may use interest rate swaps to manage net exposure to interest rate changes related to our portfolio of borrowings; however, we have not done so during 2019, 2018, or 2017.
The following table represents the principal cash repayments and related weighted-average interest rates by maturity date for our long-term debt, as of December 31, 2019 (in thousands):
| | | | | | | | | | | | | | | |
|---|---|---|---|---|---|---|---|---|---|---|---|---|---|---|
| | | | | | | | | | | | | | | |
| | | | Interest Rate Risk | | ||||||||||
| | | | Fixed Rate | | Variable Rate | | ||||||||
| | | | | | Average | | | | Average | | ||||
| | | | Principal | | Rate | | Principal | | Rate | | ||||
| | Expected maturity date: | | | | | | | | | | | | | |
| | 2020 | | $ | 5,697 | | | 6.0% | | $ | 83,659 | | | 3.1% | |
| | 2021 | | | 3,644 | | | 5.9 | | | 35 | | | 5.1 | |
| | 2022 | | | 3,923 | | | 5.5 | | | 374 | | | 5.1 | |
| | 2023 | | | 403,703 | | | 5.3 | | | - | | | | |
| | 2024 | | | 903,379 | | | 4.3 | | | - | | | | |
| | Thereafter | | | 1,360,058 | | | 4.1 | | | - | | | | |
| | Total debt outstanding | | $ | 2,680,404 | | | 4.3% | | $ | 84,068 | | | 3.1% | |
| | Fair value | | $ | 2,750,674 | | | | | $ | 84,068 | | | | |
Commodity Risk
In the normal course of business, we are exposed to the market risk and price fluctuations related to the sale of our products and to the purchase of raw materials used in our operations, such as metallic raw materials, electricity, natural gas and its transportation services, fuel, air products, zinc, and electrodes. Our risk strategy associated with product sales has generally been to obtain competitive prices for our products and to allow operating results to reflect market price movements dictated by supply and demand.
Our risk strategy associated with the purchase of raw materials utilized within our operations has generally been to make some commitments with suppliers relating to future expected requirements for some commodities such as electricity, water, natural gas and its transportation services, fuel, air products, zinc, and electrodes. Certain of these commitments contain provisions which require us to “take or pay” for specified quantities without regard to actual usage for periods of generally up to 5 years for physical commodity requirements and commodity transportation requirements, with some extending beyond, and for up to 13 years for air products. Our commitments for these arrangements with “take or pay” or other similar commitment provisions for the years ending December 31 are as follows (in thousands):
| | | | | | |
|---|---|---|---|---|---|
| | 2020 | | $ | 240,832 | |
| | 2021 | | | 118,613 | |
| | 2022 | | | 105,008 | |
| | 2023 | | | 32,752 | |
| | 2024 | | | 29,888 | |
| | Thereafter | | | 150,559 | |
| | | | $ | 677,652 | |
We utilized such “take or pay” requirements during the past three years under these contracts, except for certain air products at our idle Minnesota ironmaking operations. We believe that production requirements will be such that consumption of the products or services purchased under these commitments will occur in the normal production process, other than certain air products related to our Minnesota ironmaking operations during the idle period. We also purchase electricity consumed at our Butler Flat Roll Division pursuant to a contract which extends through December 2020, which establishes an agreed fixed-rate energy charge per Mill/kWh consumed for each year through the expiration of the agreement.
In our metals recycling and steel operations, we have certain fixed price contracts with various customers and suppliers for future delivery of nonferrous and ferrous metals. Our risk strategy has been to enter into base metal financial contracts with the goal to protect the profit margin, within certain parameters, that was contemplated when we entered into the transaction with the customer or vendor. At December 31, 2019, we had a cumulative unrealized loss associated with these financial contracts of $456,000, substantially all of which have settlement dates in 2020. We believe the customer contracts associated with the financial contracts will be fully consummated.
Item 8. CONSOLIDATED FINANCIAL STATEMENTS AND SUPPLEMENTARY DATA
INDEX TO CONSOLIDATED FINANCIAL STATEMENTS
MANAGEMENT’S REPORT ON INTERNAL CONTROL OVER FINANCIAL REPORTING
The management of Steel Dynamics, Inc. is responsible for the preparation and integrity of the company’s consolidated financial statements and for establishing and maintaining adequate internal control over financial reporting, as such term is defined in Rule 13a – 15(f) of the Exchange Act, for the company (including its consolidated subsidiaries). We maintain accounting and internal control systems which are intended to provide reasonable assurance that assets are safeguarded against loss from unauthorized use or disposition, transactions are executed in accordance with management’s authorization, and accounting records are reliable for preparing financial statements in accordance with accounting principles generally accepted in the United States. We are dedicated to ensuring that we maintain the high standards of financial accounting and reporting that we have established. Our culture demands integrity and an unyielding commitment to strong internal control practices and policies.
Internal control over financial reporting includes those policies and procedures that (1) pertain to the maintenance of records that, in reasonable detail, accurately and fairly reflect the transactions and dispositions of our assets; (2) provide reasonable assurance that transactions are recorded as necessary to permit preparation of the financial statements in accordance with generally accepted accounting principles; and provide reasonable assurance that our receipts and expenditures are being made only in accordance with authorizations of our management and directors; and (3) provide reasonable assurance regarding prevention or timely detection of unauthorized acquisition, use or disposition of our assets that could have a material effect on our financial statements.
Because of its inherent limitations, internal control over financial reporting may not always prevent or detect misstatements. Also, projections of any evaluation of effectiveness to future periods are subject to the risk that controls may become inadequate because of changes in conditions, or that the degree of compliance with policies and procedures may deteriorate.
We acquired United Steel Supply, LLC (USS) on March 1, 2019. In conducting our evaluation of the effectiveness of our internal control over financial reporting as of December 31, 2019, we have elected to exclude USS from our evaluation in the year of acquisition as permitted by the Securities and Exchange Commission. USS constituted approximately 3% of the company’s total and net assets as of December 31, 2019, and 3% of the company’s net sales for the year then ended.
Under the supervision and with the participation of our management, including our principal executive officer and our principal financial officer, we conducted an evaluation of the effectiveness of our internal control over financial reporting. The framework on which such evaluation was based upon is contained in the report entitled “Internal Control—Integrated Framework” issued by the Committee of Sponsoring Organizations of the Treadway Commission (2013 Framework) (the “COSO criteria”). Based on that evaluation, management concluded that our internal control over financial reporting was effective as of December 31, 2019, the end of the period covered by this report.
| | ||
|---|---|---|
| /s/ Mark D. Millett | /s/ Theresa E. Wagler | |
| Chief Executive Officer | | Executive Vice President and Chief Financial Officer |
| (Principal Executive Officer) | | (Principal Financial Officer) |
REPORT OF INDEPENDENT REGISTERED PUBLIC ACCOUNTING FIRM
To the Stockholders and the Board of Directors Steel Dynamics, Inc.
Opinion on Internal Control over Financial Reporting
We have audited Steel Dynamics, Inc.’s internal control over financial reporting as of December 31, 2019, based on criteria established in Internal Control—Integrated Framework issued by the Committee of Sponsoring Organizations of the Treadway Commission (2013 framework) (the COSO criteria). In our opinion, Steel Dynamics, Inc. (the Company) maintained, in all material respects, effective internal control over financial reporting as of December 31, 2019, based on the COSO criteria.
As indicated in the accompanying Management's Report on Internal Control Over Financial Reporting, management's assessment of and conclusion on the effectiveness of internal control over financial reporting did not include the internal controls of United Steel Supply, LLC, which is included in the 2019 consolidated financial statements of the Company and constituted 3% of total and net assets, respectively, as of December 31, 2019 and 3% of net sales for the year then ended. Our audit of internal control over financial reporting of the Company also did not include an evaluation of the internal control over financial reporting of United Steel Supply, LLC.
We also have audited, in accordance with the standards of the Public Company Accounting Oversight Board (United States) (PCAOB), the consolidated balance sheets of Steel Dynamics, Inc. as of December 31, 2019 and 2018, the related consolidated statements of income, comprehensive income, equity, and cash flows for each of the three years in the period ended December 31, 2019, and the related notes and our report dated February 27, 2020, expressed an unqualified opinion thereon.
Basis for Opinion
The Company’s management is responsible for maintaining effective internal control over financial reporting and for its assessment of the effectiveness of internal control over financial reporting included in the accompanying Management’s Report on Internal Control Over Financial Reporting. Our responsibility is to express an opinion on the Company’s internal control over financial reporting based on our audit. We are a public accounting firm registered with the PCAOB and are required to be independent with respect to the Company in accordance with the U.S. federal securities laws and the applicable rules and regulations of the Securities and Exchange Commission and the PCAOB.
We conducted our audit in accordance with the standards of the PCAOB. Those standards require that we plan and perform the audit to obtain reasonable assurance about whether effective internal control over financial reporting was maintained in all material respects.
Our audit included obtaining an understanding of internal control over financial reporting, assessing the risk that a material weakness exists, testing and evaluating the design and operating effectiveness of internal control based on the assessed risk, and perf
Showing the first 8K of 133K characters. Open the full section
Item 9. CHANGES IN AND DISAGREEMENTS WITH ACCOUNTANTS ON ACCOUNTING AND FINANCIAL DISCLOSURE
None.
Item 9A. CONTROLS AND PROCEDURES
(a) Evaluation of Disclosure Controls and Procedures.
As required, we carried out an evaluation, under the supervision and with the participation of our principal executive officer and principal financial officer, of the effectiveness of our disclosure controls and procedures, as defined in Rules 13a-15(e) and 15d-15(e) under the Securities Exchange Act of 1934, as amended (the Exchange Act). Based on this evaluation, our principal executive officer and principal financial officer concluded that, as of December 31, 2019, the end of the period covered by this annual report, our disclosure controls and procedures were designed to provide and were effective to provide reasonable assurance that the information required to be disclosed by us in the reports we file or submit under the Exchange Act is recorded, processed, summarized and reported within the time periods specified in the applicable rules and forms, and that it is accumulated and communicated to our management, including our principal executive and principal financial officer, as appropriate to allow timely decisions regarding required disclosure.
Management’s report on our internal control over financial reporting (as defined in Rules 13a-15(f) and 15d-15(f) under the Exchange Act) and the independent registered public accounting firm’s related audit report are included in Item 8. Consolidated Financial Statements and Supplementary Data of this Form 10-K and are incorporated herein by reference.
(b) Changes in Internal Control Over Financial Reporting
No changes in our internal control over financial reporting (as defined in Rules 13a-15(f) and 15d-15(f) under the Exchange Act) occurred during the fiscal quarter ended December 31, 2019, that has materially affected, or is reasonably likely to materially affect, our internal control over financial reporting.
Our Management’s Report on Internal Control Over Financial Reporting, as of December 31, 2019, can be found on page 45 of this Form 10-K, and the related Report of Independent Registered Public Accounting Firm, Ernst & Young LLP, can be found on page 46 of this Form 10-K, each of which is incorporated by reference into this Item 9A.
Item 9B. OTHER INFORMATION
None.
PART III
Item 10. DIRECTORS, EXECUTIVE OFFICERS, AND CORPORATE GOVERANCE
The information required to be furnished pursuant to Item 10 with respect to directors, executive officers, code of ethics, and audit committee and audit committee financial experts is incorporated herein by reference from the section entitled “Governance of the Company” and “Election of Directors” in our Proxy Statement for the 2020 Annual Meeting of Stockholders, which we will file with the Securities and Exchange Commission no later than 120 days after the end of our fiscal year.
Item 11. EXECUTIVE COMPENSATION
The information required to be furnished pursuant to Item 11 with respect to executive compensation is incorporated herein by reference from the section entitled “Executive Compensation and Related Information” in our Proxy Statement for the 2020 Annual Meeting of Stockholders, which we will file with the Securities and Exchange Commission no later than 120 days after the end of our fiscal year.
Item 12. SECURITY OWNERSHIP OF CERTAIN BENEFICIAL OWNERS AND MANAGEMENT AND RELATED STOCKHOLDER MATTERS
The information relating to security ownership of certain beneficial owners and management required by Item 12 is incorporated herein by reference from the section entitled “Security Ownership of Directors and Executive Officers” and “Security Ownership of Certain Beneficial Owners” in our Proxy Statement for the 2020 Annual Meeting of Stockholders, which we will file with the Securities and Exchange Commission no later than 120 days after the end of our fiscal year. The Equity Compensation Plan Information required by Item 12 is set forth in the table below.
Equity Compensation Plan Information
Our stockholders approved the Steel Dynamics, Inc. 2015 Equity Incentive Plan at our annual meeting of stockholders held May 21, 2015, and the Amended and Restated Steel Dynamics, Inc. 2015 Equity Incentive Plan (2015 Plan) at our annual meeting of stockholders held May 16, 2019. Our stockholders approved the Amended and Restated Steel Dynamics, Inc. 2006 Equity Incentive Plan at our annual meeting of stockholders held May 17, 2012 (2006 Plan). Our stockholders approved the Steel Dynamics, Inc. 2018 Equity Incentive Compensation Plan at our annual meeting of stockholders held May 17, 2018 (2018 Plan). Our stockholders approved the Steel Dynamics, Inc. 2013 Equity Incentive Compensation Plan (2013 Plan) at our annual meeting of stockholders held May 16, 2013. The following table summarizes information about our equity compensation plans at December 31, 2019, all of which have been approved by stockholders. We do not have any equity compensation plans that have not been approved by stockholders.
| | | | | | | |
|---|---|---|---|---|---|---|
| | (a) | (b) | (c) | |||
| | | | | | | Number of securities |
| | | | | | | remaining available for |
| | | Number of securities to be | | | | future issuance under equity |
| | | issued upon exercise of | | Weighted-average | | compensation |
| | | outstanding options, | | exercise price of outstanding | | plans (excluding securities |
| Plan Category | | warrants and rights | | options, warrants and rights (1) | | reflected in column (a)) |
| Equity compensation plans approved by security holders: | | | | | | |
| 2015 Plan and predecessor 2006 Plan (1) | 2,294,895 | — | 8,730,479 | |||
| 2018 Plan and predecessor 2013 Plan | 293,423 | — | 1,696,361 | |||
| Equity compensation plans not approved by security holders | N/A | N/A | N/A | |||
| Total | | 2,588,318 | | — | | 10,426,840 |
| (1) | Includes 1,558,472 RSUs, 252,819 DSUs, and 483,595 LTIP awards issuable upon expiration of the vesting or deferral periods, which have no exercise price. |
|---|
Item 13. CERTAIN RELATIONSHIPS AND RELATED TRANSACTIONS, AND DIRECTOR INDEPENDENCE
The information required to be furnished pursuant to Item 13 with respect to certain relationships and related transactions is incorporated herein by reference from the sections entitled “Statement of Policy for the Review, Approval or Ratification of Transactions with Related Persons,” and “Governance of the Company – Director Independence” in our Proxy Statement for the 2020 Annual Meeting of Stockholders, which we will file with the Securities and Exchange Commission no later than 120 days after the end of our fiscal year; and from Note 10. Transactions with Affiliated Companies to our consolidated financial statements as of December 31, 2019 and 2018, and each of the three years in the periods ended December 31, 2019, 2018, and 2017, included in Item 8. Consolidated Financial Statements and Supplementary Data of this Form 10-K Annual Report for the fiscal year ended December 31, 2019.
Item 14. PRINCIPAL ACCOUNTANT FEES AND SERVICES
The information required to be furnished pursuant to Item 14 with respect to principal accountant fees and services is incorporated herein by reference from the sections entitled “Audit and Non-Audit Fees” and “Policy on Audit Committee Pre-Approval of Audit and Permissible Non-Audit Services of Independent Auditor” in our Proxy Statement for the 2020 Annual Meeting of Stockholders, which we will file with the Securities and Exchange Commission no later than 120 days after the end of our fiscal year.
PART IV
Item 15. EXHIBITS, FINANCIAL STATEMENT SCHEDULES
(a) The following documents are filed as a part of this report:
-
Financial Statements: See the Audited Consolidated Financial Statements of Steel Dynamics Inc. included as part of Item 8. Consolidated Financial Statements and Supplementary Data and described in the Index on page 44 of this Report.
-
Financial Statement Schedules: All schedules for which provision is made in the applicable regulations of the Securities and Exchange Commission are not required under the related instructions or are inapplicable and therefore have been omitted.
(b) Exhibits:
Reference is made to the Exhibit Index preceding the signature pages hereto, which Exhibit Index is hereby incorporated into this item.
Item 16. FORM 10-K SUMMARY
None.
EXHIBIT INDEX
Articles of Incorporation
- Filed concurrently herewith
† Indicates a management contract or compensatory plan or arrangement.
SIGNATURES
Pursuant to the requirements of Section 13 or 15(d) of Securities Exchange Act of 1934, Steel Dynamics, Inc. has duly caused this report to be signed on its behalf by the undersigned, thereunto duly authorized.
| | | |
|---|---|---|
| February 27, 2020 | | |
| | | |
| | STEEL DYNAMICS, INC. | |
| | | |
| | | |
| | By: | /s/ MARK D. MILLETT |
| | | Mark D. Millett |
| | | Chief Executive Officer |
| | | (Principal Executive Officer) |
POWER OF ATTORNEY
Each person whose signature appears below constitutes and appoints Mark D. Millett and Theresa E. Wagler, either of whom may act without the joinder of the other, as his or her true and lawful attorneys-in-fact and agents with full power of substitution and resubstitution, for him or her, and in his or her name, place and stead, in any and all capacities to sign any and all amendments, and supplements to this 2019 Annual Report on Form 10-K, filed pursuant to Section 13 or 15(d) of the Securities Exchange Act of 1934, as amended, and to file the same, with all exhibits thereto, and all other documents in connection therewith, with the Securities and Exchange Commission, granting unto said attorneys-in-fact and agents full power and authority to do and performs each and every act and thing requisite and necessary to be done, as full to all intents and purposes as he or her might or could do in person, hereby ratifying and confirming all that said attorneys-in-fact and agents or their substitute or substitutes may lawfully do or cause to be done by virtue thereof. Pursuant to the requirements of the Securities Exchange Act of 1934, this 2019 Annual Report on Form 10-K has been signed below by the following persons on behalf of Steel Dynamics, Inc. and in the capacities and on the dates indicated.
| | | |
|---|---|---|
| Signatures | Title | Date |
| | | |
| /s/ MARK D. MILLETT | Chief Executive Officer and Director | February 27, 2020 |
| Mark D. Millett | (Principal Executive Officer) | |
| | | |
| /s/ THERESA E. WAGLER | Executive Vice President and Chief Financial Officer | February 27, 2020 |
| Theresa E. Wagler | (Principal Financial Officer and | |
| | Principal Accounting Officer) | |
| | | |
| /s/ KEITH E. BUSSE | Director | February 27, 2020 |
| Keith E. Busse | | |
| | | |
| /s/ SHEREE L. BARGABOS | Director | February 27, 2020 |
| Sheree L. Bargabos | | |
| | | |
| /s/ FRANK D. BYRNE, M.D. | Director | February 27, 2020 |
| Frank D. Byrne, M.D. | | |
| | | |
| /s/ KENNETH W. CORNEW | Director | February 27, 2020 |
| Kenneth W. Cornew | | |
| | | |
| /s/ TRACI M. DOLAN | Director | February 27, 2020 |
| Traci M. Dolan | | |
| | | |
| /s/ JAMES C. MARCUCCILLI | Director | February 27, 2020 |
| James C. Marcuccilli | | |
| | | |
| /s/ BRADLEY S. SEAMAN | Director | February 27, 2020 |
| Bradley S. Seaman | | |
| | | |
|---|---|---|
| /s/ GABRIEL L. SHAHEEN | Director | February 27, 2020 |
| Gabriel L. Shaheen | | |
| | | |
| /s/ STEVEN A. SONNENBERG | Director | February 27, 2020 |
| Steven A. Sonnenberg | | |
| | | |
| /s/ RICHARD P. TEETS, JR. | Director | February 27, 2020 |
| Richard P. Teets, Jr. | | |