 filings.tools
Seagate Technology Holdings 10-K 2023-06-30
Filed 2023-08-04. 22 sections, 503K characters. Original on sec.gov · Markdown · JSON
Cover and table of contents
UNITED STATES
SECURITIES AND EXCHANGE COMMISSION
Washington, D.C. 20549
FORM 10-K
_________________________________________________
☒ ANNUAL REPORT PURSUANT TO SECTION 13 OR 15(d) OF THE SECURITIES EXCHANGE ACT OF 1934
For the fiscal year ended June 30, 2023
OR
☐ TRANSITION REPORT PURSUANT TO SECTION 13 OR 15(d) OF THE SECURITIES EXCHANGE ACT OF 1934
For the transition period from: to
Commission File Number 001-31560
SEAGATE TECHNOLOGY HOLDINGS PUBLIC LIMITED COMPANY
(Exact name of registrant as specified in its charter)
| Ireland | 98-1597419 | ||||
| (State or other jurisdiction of incorporation or organization) | (I.R.S. Employer Identification Number) | ||||
38/39 Fitzwilliam Square
Dublin 2, Ireland
(Address of principal executive offices)
D02 NX53
(Zip Code)
Registrant’s telephone number, including area code: (353) (1) 234-3136
_________________________________________________
Securities registered pursuant to Section 12(b) of the Act:
| Title of Each Class | Trading Symbol(s) | Name of Each Exchange on Which Registered | ||||||
| Ordinary Shares, par value $0.00001 per share | STX | The NASDAQ Global Select Market |
Securities registered pursuant to Section 12(g) of the Act:
None
_________________________________________________
Indicate by check mark if the registrant is a well-known seasoned issuer, as defined in Rule 405 of the Securities Act. Yes ☒ No ☐
Indicate by check mark if the registrant is not required to file reports pursuant to Section 13 or Section 15(d) of the Act. Yes ☐ No ☒
Indicate by check mark whether the registrant (1) has filed all reports required to be filed by Section 13 or 15(d) of the Securities Exchange Act of 1934 during the preceding 12 months (or for such shorter period that the registrant was required to file such reports), and (2) has been subject to such filing requirements for the past 90 days. Yes ☒ No ☐
Indicate by check mark whether the registrant has submitted electronically every Interactive Data File required to be submitted pursuant to Rule 405 of Regulation S-T (§ 232.405 of this chapter) during the preceding 12 months (or for such shorter period that the registrant was required to submit such files). Yes ☒ No ☐
Indicate by check mark whether the registrant is a large accelerated filer, an accelerated filer, a non-accelerated filer, a smaller reporting company, or an emerging growth company. See the definitions of “large accelerated filer,” “accelerated filer”, “smaller reporting company” and “emerging growth company” in Rule 12b-2 of the Exchange Act.
| Large accelerated filer | ☒ | Accelerated filer: | ☐ | ||||||||
| Non-accelerated filer: | ☐ | Smaller reporting company: | ☐ | ||||||||
| Emerging growth company: | ☐ | ||||||||||
| If an emerging growth company, indicate by check mark if the registrant has elected not to use the extended transition period for complying with any new or revised financial accounting standards provided pursuant to Section 13(a) of the Exchange Act. | ☐ | ||||||||||
| Indicate by check mark whether the registrant has filed a report on and attestation to its management’s assessment of the effectiveness of its internal control over financial reporting under Section 404(b) of the Sarbanes-Oxley Act (15 U.S.C. 7262(b)) by the registered public accounting firm that prepared or issued its audit report. | ☒ |
If securities are registered pursuant to Section 12(b) of the Act, indicate by check mark whether the financial statements of the registrant included in the filing reflect the correction of an error to previously issued financial statements. ☐
Indicate by check mark whether any of those error corrections are restatements that required a recovery analysis of incentive-based compensation received by any of the registrant’s executive officers during the relevant recovery period pursuant to §240.10D-1(b). ☐
Indicate by check mark whether the registrant is a shell company (as defined in Rule 12b-2 of the Act). Yes ☐ No ☒
The aggregate market value of the voting and non-voting ordinary shares held by non-affiliates of the registrant as of December 30, 2022, the last business day of the registrant’s most recently completed second fiscal quarter, was approximately $10.1 billion based upon the closing price reported for such date by the NASDAQ.
The number of outstanding ordinary shares of the registrant as of July 31, 2023 was 207,393,242.
DOCUMENTS INCORPORATED BY REFERENCE
Portions of the definitive proxy statement to be filed with the Securities and Exchange Commission pursuant to Regulation 14A relating to the registrant’s Annual General Meeting of Shareholders, to be held on October 23, 2023, will be incorporated by reference in this Form 10-K in response to Items 10, 11, 12, 13 and 14 of Part III. The definitive proxy statement will be filed with the SEC no later than 120 days after the registrant's fiscal year ended June 30, 2023.
SEAGATE TECHNOLOGY HOLDINGS PLC
TABLE OF CONTENTS
PRESENTATION OF FINANCIAL AND OTHER INFORMATION
In this Annual Report on Form 10-K (the “Form 10-K”), unless the context indicates otherwise, as used herein, the terms “we,” “us,” “Seagate,” the “Company” and “our” refer to Seagate Technology Holdings public limited company (“plc”), an Irish public limited company, and its subsidiaries. References to “$” and “dollars” are to United States dollars.
We have compiled the market size information in this Form 10-K using statistics and other information obtained from several third-party sources.
Various amounts and percentages used in this Form 10-K have been rounded and, accordingly, they may not total 100%.
Seagate, Seagate Technology, LaCie, Maxtor, Lyve and the Spiral Logo, are trademarks or registered trademarks of Seagate Technology LLC or one of its affiliated companies in the United States (“U.S.”) and/or other countries. All other trademarks or registered trademarks are the property of their respective owners.
CAUTIONARY NOTE REGARDING FORWARD-LOOKING STATEMENTS
This Annual Report on Form 10-K contains forward-looking statements within the meaning of the Private Securities Litigation Reform Act of 1995. Forward-looking statements provide current expectations of future events based on certain assumptions and include any statement that does not directly relate to any historical fact. These statements include, among other things, statements about the Company’s plans, programs, strategies and prospects; anticipated shifts in technology and storage industry trends, and anticipated demand for and performance of new storage product introductions; expectations regarding market demand for our products and technologies and our ability to optimize our level of production and meet market and industry expectations and the effects of these future trends on the Company’s performance; financial outlook for future periods; expectations regarding our ability to service debt, meet debt covenant and continue to generate free cash flow; expectations regarding our ability to make timely quarterly payments under the settlement agreement with the U.S. Department of Commerce’s Bureau of Industry and Security (“BIS”); the impact of macroeconomic headwinds and customer inventory adjustments on our business and operations; our cost saving plans, including our ability to execute such plans, the projected savings under such plans and the assumptions on which the plans and projected savings are based; expectations regarding the Company’s business strategy and performance; the sufficiency of our sources of cash to meet cash needs for the next 12 months; and our expectations regarding capital expenditures and dividend issuance plans. Forward-looking statements generally can be identified by words such as “expects,” “intends,” “plans,” “anticipates,” “believes,” “estimates,” “predicts,” “projects,” “should,” “may,” “will,” “will continue,” “can,” “could,” or negative of these words, variations of these words and comparable terminology, in each case, intended to refer to future events or circumstances. However, the absence of these words or similar expressions does not mean that a statement is not forward-looking. Forward-looking statements are based on information available to the Company as of the date of this Annual Report on Form 10-K and are subject to known and unknown risks and uncertainties that could cause actual results, performance or events to differ materially from historical experience and our present expectations or projections. Therefore, undue reliance should not be placed on forward-looking statements. These risks and uncertainties include, but are not limited to, those set forth in “Part I, Item 1A. Risk Factors” in this Annual Report on Form 10-K. We undertake no obligation to update forward-looking statements, except as required by law.
PART I
Item 1. BUSINESS
We are a leading provider of data storage technology and infrastructure solutions. Our principal products are hard disk drives, commonly referred to as disk drives, hard drives or HDDs. In addition to HDDs, we produce a broad range of data storage products including solid state drives (“SSDs”) and storage subsystems and offer storage solutions such as a scalable edge-to-cloud mass data platform that includes data transfer shuttles and a storage-as-a-service cloud.
HDDs are devices that store digitally encoded data on rapidly rotating disks with magnetic surfaces. HDDs continue to be the primary medium of mass data storage due to their performance attributes, reliability, high capacities, superior quality and cost effectiveness. Complementing HDD storage architectures, SSDs use NAND flash memory integrated circuit assemblies to store data.
Our HDD products are designed for mass capacity storage and legacy markets. Mass capacity storage involves well-established use cases—such as hyperscale data centers and public clouds as well as emerging use cases. Legacy markets are those that we continue to sell to but we do not plan to invest in significantly. Our HDD and SSD product portfolio includes Serial Advanced Technology Attachment (“SATA”), Serial Attached SCSI (“SAS”) and Non-Volatile Memory Express (“NVMe”) based designs to support a wide variety of mass capacity and legacy applications.
Our systems portfolio includes storage subsystems for enterprises, cloud service providers (“CSPs”), scale-out storage servers and original equipment manufacturers (“OEMs”). Engineered for modularity, mobility, capacity and performance, these solutions include our enterprise HDDs and SSDs, enabling customers to integrate powerful, scalable storage within existing environments or create new ecosystems from the ground up in a secure, cost-effective manner.
Our Lyve portfolio provides a simple, cost-efficient and secure way to manage massive volumes of data across the distributed enterprise. The Lyve platform includes a shuttle solution that enables enterprises to transfer massive amounts of data from endpoints to the core cloud and a storage-as-a-service cloud offering that provides frictionless mass capacity storage at the metro edge.
Industry Overview
Data Storage Industry
The data storage industry includes companies that manufacture components or subcomponents designed for data storage devices, as well as providers of storage solutions, software and services for enterprise cloud, big data, computing platforms and consumer markets. The rapid growth of data generation and the intelligent application of data are driving demand for data storage. As more data is created at endpoints outside traditional data centers, which requires processing at the edge and in the core or cloud, the need for data storage and management between the edge and cloud has also increased. Use cases include connected and autonomous vehicles, smart manufacturing and smart cities. We believe the proliferation and personal creation of media-rich digital content, further enabled by fifth-generation wireless (“5G”) technology, the edge, the Internet of Things (“IoT”), machine learning (“ML”) and artificial intelligence (“AI”), will continue to create demand for higher capacity storage solutions. The resulting mass data ecosystem is expected to require increasing amounts of data storage at the edge, in the core and in between.
Markets
The principal data storage markets include:
Mass Capacity Storage Markets
Mass capacity storage supports high capacity, low-cost per terabyte (“TB”) storage applications, including nearline, video and image applications (“VIA”) and network-attached storage (“NAS”) and edge-to-cloud data storage infrastructures.
Nearline. Nearline applications require mass capacity devices and mass capacity subsystems that provide end-to-end solutions to businesses for the purpose of modular and scalable storage. Enterprise storage applications require both high-capacity and energy efficient storage devices to support low total cost of ownership. Seagate systems offer mass capacity storage solutions that provide foundational infrastructure for public and private clouds. The nearline market includes storage for cloud computing, content delivery, archival, backup services and emerging use cases such as generative AI.
VIA and NAS. VIA and NAS drives are specifically designed to ensure the appropriate performance and reliability of the system for video analytics and camera enabled environments or network storage environments. These markets include storage for security and smart video installations.
Edge-to-cloud data storage infrastructures, transport, and activation of mass data. The Seagate Lyve portfolio grew out of our mass capacity storage portfolio. It provides a simple, cost-efficient and secure way to manage, transport and activate massive volumes of data across the distributed enterprise. Among other elements, the Lyve portfolio includes a shuttle solution that enables enterprises to transfer vast amounts of data from endpoints to the core cloud and a storage-as-a-service cloud that provides frictionless mass capacity storage at the metro edge.
Legacy Markets
Legacy markets include consumer, client and mission critical applications. We continue to sell to these markets but do not plan significant additional investment.
Consumer storage. Consumer applications are externally connected storage, both HDD and SSD-based, used to provide backup capabilities, augmented storage capacity, or portable storage for PCs, mobile devices and gaming consoles.
Client storage. Client applications include desktop and notebook storage that rely on low cost-per-HDD and SSD devices to provide built-in storage, digital video recorder (“DVR”) storage for video streaming in always-on consumer premise equipment and media center, and gaming storage for PC-based gaming systems as well as console gaming applications including both internal and external storage options.
Mission critical storage. Mission critical applications are defined as those that use very high-performance enterprise class HDDs and SSDs with sophisticated firmware to reliably support very high workloads. We expect that enterprises utilizing dedicated storage area networks will continue to drive market demand for mission critical enterprise storage solutions.
Participants in the data storage industry include:
Major subcomponent manufacturers. Companies that manufacture components or subcomponents used in data storage devices or solutions include companies that supply spindle motors, heads and media, and application specific integrated circuits (“ASICs”).
Storage device manufacturers. Companies that transform components into storage products include disk drive manufacturers and semiconductor storage manufacturers that integrate flash memory into storage products such as SSDs.
Storage solutions manufacturers and system integrators. Companies, such as Original Equipment Manufacturers (“OEMs”), that bundle and package storage solutions, distributors that integrate storage hardware and software into end-user applications, CSPs that provide cloud based solutions to businesses for the purpose of scale-out storage solutions and modular systems, and producers of solutions such as storage racks.
Hyperscale data centers. Large hyperscale data center companies, many of which are CSPs, are increasingly designing their own storage subsystems and having them built by contract manufacturers for their own data centers. This trend is reshaping the storage system and subsystem market, driving both innovation in system design and changes in the competitive landscape of large storage system vendors.
Storage services. Companies that provide and host services and solutions, which include storage, backup, archiving, recovery and discovery of data.
Demand for Data Storage
In the “Worldwide Global DataSphere Forecast, 2023-2027”, published by the International Data Corporation (“IDC”), the global datasphere is forecasted to grow from 106 zettabytes in 2022 to 291 zettabytes by 2027. According to IDC, we are in a new era of the Data Age, whereby data is shifting to both the core and the edge. By 2027, nearly 71% of the world’s data will be generated in the core and edge, up from 54% in 2022. Digital transformation has given rise to many new applications, all of which rely on faster access to and secure storage of data proliferating from endpoints through edge to cloud, which we expect will have a positive impact on storage demand.
As more applications require real-time decision making, some data processing and storage is moving closer to the network edge. We believe this will result in a buildup of private and edge cloud environments that will enable fast and secure access to data throughout the IoT ecosystem.
Factors contributing to the growth of digital content include:
-
Creation, sharing and consumption of media-rich content, such as high-resolution photos, high definition videos and digital music through smart phones, tablets, digital cameras, personal video cameras, DVRs, gaming consoles or other digital devices;
-
Increasing use of video and imaging sensors to collect and analyze data used to improve traffic flow, emergency response times and manufacturing production costs, as well as for new security surveillance systems that feature higher resolution digital cameras and thus require larger data storage capacities;
-
Creation and collection of data through the development and evolution of the IoT ecosystem, big data analytics, machine learning and new technology trends such as autonomous vehicles and drones, smart manufacturing, and smart cities, as well as emerging trends that converge the digital and physical worlds such as the metaverse, use of digital twins or generative AI;
-
The growing use of analytics, especially for action on data created at the edge instead of processing and analyzing at the data center, which is particularly important for verticals such as autonomous vehicles, property monitoring systems, and smart manufacturing;
-
Cloud migration initiatives and the ongoing advancement of the cloud, including the build out of large numbers of cloud data centers by CSPs and private companies transitioning on-site data centers into the cloud; and
-
Need for protection of increased digital content through redundant storage on backup devices and externally provided storage services.
As a result of these factors, we anticipate that the nature and volume of data being created will require greater storage capability, which is more efficiently and economically facilitated by higher capacity mass storage solutions.
In addition, the economics of storage infrastructure are also evolving. The utilization of public and private hyperscale storage and open-source solutions is reducing the total cost of ownership of storage while increasing the speed and efficiency with which customers can leverage massive computing and storage devices. Accordingly, we expect these trends will continue to create significant demand for data storage products and solutions going forward.
Demand Trends
We believe that continued growth in digital content creation will require increasingly higher storage capacity in order to store, aggregate, host, distribute, analyze, manage, protect, back up and use such content. We also believe that as architectures evolve to serve a growing commercial and consumer user base throughout the world, storage solutions will evolve as well.
Mass capacity is and will continue to be the enabler of scale. We expect increased data creation will lead to the expansion of the need for storage in the form of HDDs, SSDs and systems. While the advance of solid state technology in many end markets is expected to increase, we believe that in the foreseeable future, cloud, edge and traditional enterprise which require high-capacity storage solutions will be best served by HDDs due to their ability to deliver reliable, energy-efficient and the most cost effective mass storage devices. We also believe that as HDD capacities continue to increase, a focus exclusively on unit demand does not reflect the increase in demand for exabytes. As demand for higher capacity drives increases, the demand profile has shifted to reflect fewer total HDD units, but with higher average capacity per drive and higher overall exabyte demand.
Industry Supply Balance
From time to time, the storage industry has experienced periods of imbalance between supply and demand. To the extent that the storage industry builds or maintains capacity based on expectations of demand that do not materialize, price erosion may become more pronounced. Conversely, during periods where demand exceeds supply, price erosion is generally muted.
Our Business
Data Storage Technologies
The design and manufacturing of HDDs depends on highly advanced technology and manufacturing techniques. Therefore, it requires high levels of research and development spending and capital equipment investments. We design, fabricate and assemble a number of the most important components in our disk drives, including read/write heads and recording media. Our design and manufacturing operations are based on technology platforms that are used to produce various disk drive products that serve multiple data storage applications and markets. Our core technology platforms focus on the areal density of media and read/write head technologies, including innovations like shingled-magnetic-recording ("SMR") technology, the high-capacity enabling heat-assisted magnetic recording (“HAMR”) technology, and the throughput-optimizing multi actuator MACH.2 technology. This design and manufacturing approach allows us to deliver a portfolio of storage products to service a wide range of data storage applications and industries.
Disk drives that we manufacture are commonly differentiated by the following key characteristics:
-
input/output operations per second (“IOPS”), commonly expressed in megabytes per second, which is the maximum number of reads and writes to a storage location;
-
storage capacity, commonly expressed in TB, which is the amount of data that can be stored on the disk drive;
-
spindle rotation speed, commonly expressed in revolutions per minute (“RPM”), which has an effect on speed of access to data;
-
interface transfer rate, commonly expressed in megabytes per second, which is the rate at which data moves between the disk drive and the computer controller;
-
average seek time, commonly expressed in milliseconds, which is the time needed to position the heads over a selected track on the disk surface;
-
data transfer rate, commonly expressed in megabytes per second, which is the rate at which data is transferred to and from the disk drive;
-
product quality and reliability, commonly expressed in annualized return rates; and
-
energy efficiency, commonly measured by the power output such as energy per TB necessary to operate the disk drive.
Areal density is measured by storage capacity per square inch on the recording surface of a disk. The storage capacity of a disk drive is determined by the size and number of disks it contains as well as the areal density capability of these disks.
We also offer SSDs as part of our storage solutions portfolio. Our portfolio includes devices with SATA, SAS and NVMe interfaces. The SSDs differ from HDDs in that they are without mechanical parts.
SSDs store data on NAND flash memory cells, or metal-oxide semiconductor transistors using a charge on a capacitor to represent a binary digit. SSD technology offers fast access to data and robust performance. SSDs complement hyperscale
applications, high-density data centers, cloud environments and web servers. They are also used in mission-critical enterprise applications, consumer, gaming and NAS applications.
Manufacturing
We primarily design and manufacture our own read/write heads and recording media, which are critical technologies for disk drives. This integrated approach enables us to lower costs and to improve the functionality of components so that they work together efficiently.
We believe that because of our vertical design and manufacturing strategy, we are well positioned to take advantage of the opportunities to leverage the close interdependence of components for disk drives. Our manufacturing efficiency and flexibility are critical elements of our integrated business strategy. We continuously seek to improve our manufacturing efficiency and reduce manufacturing costs by:
-
employing manufacturing automation;
-
employing machine learning algorithms and AI;
-
improving product quality and reliability;
-
integrating our supply chain with suppliers and customers to enhance our demand visibility and reduce our working capital requirements;
-
coordinating between our manufacturing group and our research and development organization to rapidly achieve volume manufacturing; and
-
operating our facilities at optimal capacities.
A vertically integrated model, however, tends to have less flexibility when demand declines as it exposes us to higher unit costs when capacity utilization is not optimized which would lead to factory underutilization charges as we experienced in fiscal year 2023.
Components and Raw Materials
Disk drives incorporate certain components, including a head disk assembly and a printed circuit board mounted to the head disk assembly, which are sealed inside a rigid base and top cover containing the recording components in a contamination-controlled environment. We maintain a highly integrated approach to our business by designing and manufacturing a significant portion of the components we view as critical to our products, such as read/write heads and recording media.
Read/Write Heads. The function of the read/write head is to scan across the disk as it spins, magnetically recording or reading information. The tolerances of read/write heads are extremely demanding and require state-of-the-art equipment and processes. Our read/write heads are manufactured with thin-film and photolithographic processes similar to those used to produce semiconductor integrated circuits, though challenges related to magnetic film properties and topographical structures are unique to the disk drive industry. We perform all primary stages of design and manufacture of read/write heads at our facilities. We use a combination of internally manufactured and externally sourced read/write heads, the mix of which varies based on product mix, technology and our internal capacity levels.
Media. Data is written to or read from the media, or disk, as it rotates at very high speeds past the read/write head. The media is made from non-magnetic substrates, usually an aluminum alloy or glass and is coated with thin layers of magnetic materials. We use a combination of internally manufactured and externally sourced finished media and aluminum substrates, the mix of which varies based on product mix, technology and our internal capacity levels. We purchase all of our glass substrates from third parties.
Printed Circuit Board Assemblies. The printed circuit board assemblies (“PCBAs”) are comprised of standard and custom ASICs and ancillary electronic control chips. The ASICs control the movement of data to and from the read/write heads and through the internal controller and interface, which communicates with the host computer. The ASICs and control chips form electronic circuitry that delivers instructions to a head positioning mechanism called an actuator to guide the heads to the selected track of a disk where the data is recorded or retrieved. Disk drive manufacturers use one or more industry standard interfaces such as SATA, SCSI, or SAS to communicate to the host systems.
Head Disk Assembly. The head disk assembly consists of one or more disks attached to a spindle assembly powered by a spindle motor that rotates the disks at a high constant speed around a hub. Read/write heads, mounted on an arm assembly, similar in concept to that of a record player, fly extremely close to each disk surface, and record data on and retrieve it from concentric tracks in the magnetic layers of the rotating disks. The read/write heads are mounted vertically on an E-shaped assembly (“E-block”) that is actuated by a voice-coil motor to allow the heads to move from track to track. The E-block and the
recording media are mounted inside the head disk assembly. We purchase spindle motors from outside vendors and from time to time participate in the design of the motors that go into our products.
Disk Drive Assembly. Following the completion of the head disk assembly, it is mated to the PCBA, and the completed unit goes through extensive defect mapping and machine learning prior to packaging and shipment. Disk drive assembly and machine learning operations occur primarily at our facilities located in China and Thailand. We perform subassembly and component manufacturing operations at our facilities in China, Malaysia, Northern Ireland, Singapore, Thailand and the United States.
Contract Manufacturing. We outsource the manufacturing and assembly of certain components and products to third parties in various countries worldwide. This includes outsourcing the PCBAs used in our disk drives, SSDs and storage subsystems. We continue to participate in the design of our components and products, and we are directly involved in qualifying key suppliers and components used in our products.
Suppliers of Components and Industry Constraints. There are a limited number of independent suppliers of components, such as recording heads and media, available to disk drive manufacturers. From time to time, we may enter into long-term supply arrangements with these independent suppliers. Vertically integrated disk drive manufacturers like us, who manufacture their own components, are less dependent on external component suppliers than less vertically integrated disk drive manufacturers. However, certain parts of our business have been adversely affected by our suppliers’ capacity constraints and this could occur again in the future.
Commodity and Other Manufacturing Costs. The production of disk drives requires rare earth elements, precious metals, scarce alloys and industrial commodities, which are subject to fluctuations in price and the supply of which has at times been constrained. In addition to increased costs of components and commodities, volatility in fuel and other transportation costs may also increase our costs related to commodities, manufacturing and freight. As a result, we may increase our use of alternative shipment methods to help offset any increase in freight costs, and we will continually review various forms of shipments and routes in order to minimize the exposure to higher freight costs.
Products
We offer a broad range of storage solutions for mass capacity storage and legacy applications. We differentiate products on the basis of capacity, performance, product quality, reliability, price, form factor, interface, power consumption efficiency, security features and other customer integration requirements. Our industry is characterized by continuous and significant advances in technology that contribute to rapid product life cycles. Currently our product offerings include:
Mass Capacity Storage
Enterprise Nearline HDDs. Our high-capacity enterprise HDDs ship in capacities of up to 30TB. These products are designed for mass capacity data storage in the core and at the edge, as well as server environments and cloud systems that require high capacity, enterprise reliability, energy efficiency and integrated security. They are available in SATA and SAS interfaces. Additionally, certain customers can utilize many of our HDDs with Shingled Magnetic Recording (“SMR”) technology enabled which increases the available storage capacity of the drive with certain performance trade-offs.
Enterprise Nearline SSDs. Our enterprise SSDs are designed for high-performance, hyperscale, high-density and cloud applications. They are offered with multiple interfaces, including SAS, SATA, and NVMe and in capacities up to 15TB.
Enterprise Nearline Systems. Our systems portfolio provides modular storage arrays, storage server platforms, multi-level configuration for disks (commonly referred as JBODs) and expansion shelves to expand and upgrade data center storage infrastructure and other enterprise applications. They feature speed, scalability and security. Our capacity-optimized systems feature multiple scalable configurations and can accommodate up to 96 26TB drives per chassis. We offer capacity and performance-optimized systems that include all-flash, all-disk and hybrid arrays for workloads demanding high performance, capacity and efficiency.
VIA. Our video and image HDDs are built to support the high-write workload of an always-on, always-recording video systems. These optimized drives are built to support the growing needs of the video imaging market with support for multiple streams and capacities up to 24TB.
NAS. Our NAS drives are built to support the performance and reliability demanded by small and medium businesses, and incorporate interface software with custom-built health management, error recovery controls, power settings and vibration tolerance. Our NAS HDD solutions are available in capacities up to 24TB. We also offer NAS SSDs with capacities up to 4TB.
Legacy Applications
Mission Critical HDDs and SSDs. We continue to support 10,000 and 15,000 RPM HDDs, offered in capacities up to 2.4TB, which enable increased throughput while improving energy efficiency. Our enterprise SSDs are available in capacities up to 15TB, with endurance options up to 10 drive writes per day and various interfaces. Our SSDs deliver the speed and consistency required for demanding enterprise storage and server applications.
Consumer Solutions. Our external storage solutions, with capacities up to 20TB are shipped, under the Seagate Ultra Touch, One Touch, Expansion and Basics product lines, as well as under the LaCie brand name. We strive to deliver the best customer experience by leveraging our core technologies, offering services such as Seagate Recovery Services (data recovery) and partnering with leading brands such as Microsoft’s Xbox, Sony’s PlayStation and Disney’s Star Wars and Marvel.
Client Applications. Our 3.5-inch desktop drives offer up to 8TB of capacity, designed for personal computers and workstation applications and our 2.5-inch notebook drives offer up to 5TB for HDD and up to 2TB for SSD designed for applications such as traditional notebooks, convertible systems and external storage to address a range of performance needs and sizes for affordable, high-capacity storage. Our DVR HDDs are optimized for video streaming in always-on consumer premise equipment applications with capacities up to 8TB. Our gaming SSDs are specifically optimized internal storage for gaming rigs and are designed to enhance the gaming experience during game load and game play with capacities up to 4TB for SSD.
Lyve Edge-to-Cloud Mass Capacity Platform
Lyve. Lyve is our platform built with mass data in mind. These solutions, including modular hardware and software, deliver a portfolio that streamlines data access, transport and management for today’s enterprise.
Cloud. Lyve Cloud storage-as-a-service platform is an S3-compatible storage-only cloud designed to allow enterprises to unlock the value of their massive unstructured datasets. We collaborate with certain partners to maximize accessibility and provide extensive interconnect opportunities for additional cloud services and geographical expansion.
Data Services. Lyve Mobile Data Transfer Services consists of Lyve Mobile modular and scalable hardware, purpose-built for simple and secure mass-capacity edge data storage, lift-and-shift initiatives, and other data movement for the enterprise. These products are cloud-vendor agnostic and can be integrated seamlessly with public or private cloud data centers and providers.
Customers
We sell our products to major OEMs, distributors and retailers.
OEM customers, including large hyperscale data center companies and CSPs, typically enter into master purchase agreements with us. Deliveries are scheduled only after receipt of purchase orders. In addition, with limited lead-time, customers may defer most purchase orders without significant penalty. Anticipated orders from our customers have in the past failed to materialize or OEM delivery schedules have been deferred or altered as a result of changes in their business needs.
Our distributors generally enter into non-exclusive agreements for the resale of our products. They typically furnish us with a non-binding indication of their near-term requirements and product deliveries are generally scheduled accordingly. The agreements and related sales programs typically provide the distributors with limited rights of return and price protection. In addition, we offer sales programs to distributors on a quarterly and periodic basis to promote the sale of selected products in the sales channel.
Our retail channel consists of our branded storage products sold to retailers either by us directly or by our distributors. Retail sales made by us or our distributors typically require greater marketing support, sales incentives and price protection periods.
See “Item 8. Financial Statements and Supplementary Data—Note 16. Business Segment and Geographic Information” contained in this report for a description of our major customers.
Competition
We compete primarily with manufacturers of hard drives used in the mass capacity storage and legacy markets, and with other companies in the data storage industry that provide SSDs and systems. Some of the principal factors used by customers to differentiate among data storage solutions manufacturers are storage capacity, product performance, product quality and reliability, price per unit and price per TB, storage/retrieval access times, data transfer rates, form factor, product warranty and support capabilities, supply continuity and flexibility, power consumption, total cost of ownership and brand. While different markets and customers place varying levels of emphasis on these factors, we believe that our products are competitive with respect to many of these factors in the markets that we currently compete in.
Principal Competitors. We compete with manufacturers of storage solutions and the other principal manufacturers in the data storage solution industry including:
-
Micron Technology, Inc.;
-
Samsung Electronics;
-
SK hynix, Inc.;
-
Kioxia Holdings Corporation;
-
Toshiba Corporation; and
-
Western Digital Corporation, operating the Western Digital, Hitachi Global Storage Technologies and SanDisk brands.
Price Erosion. Historically, our industry has been characterized by price declines for data storage products with comparable capacity, performance and feature sets (“like-for-like products”). Price declines for like-for-like products (“price erosion”) tend to be more pronounced during periods of:
-
economic contraction in which competitors may use discounted pricing to attempt to maintain or gain market share;
-
few new product introductions when competitors have comparable or alternative product offerings; and
-
industry supply exceeding demand.
Data storage manufacturers typically attempt to offset price erosion with an improved mix of data storage products characterized by higher capacity, better performance and additional feature sets and product cost reductions.
We believe the HDD industry, in the prevailing supply and demand environment, experienced higher than usual price erosion in fiscal year 2023 and modest price erosion in fiscal year 2022.
Product Life Cycles and Changing Technology. Success in our industry has been dependent to a large extent on the ability to balance the introduction and transition of new products with time-to-volume, performance, capacity and quality metrics at a competitive price, level of service and support that our customers expect. Generally, the drive manufacturer that introduces a new product first benefits from improved product mix, favorable profit margins and less pricing pressure until comparable products are introduced. Changing technology also necessitates on-going investments in research and development, which may be difficult to recover due to rapid product life cycles or economic declines. Further, there is a continuing need to successfully execute product transitions and new product introductions, as factors such as quality, reliability and manufacturing yields continue to be of significant competitive importance.
Cyclicality and Seasonality
Our mass capacity markets are subject to variability of sales, which can be attributed to the timing of IT spending or a reflection of cyclical demand from CSPs based on the timing of their procurement and deployment requirements and their ability to procure other components needed to build out data center infrastructure. Our legacy markets, such as consumer storage applications, traditionally experienced seasonal variability in demand with higher levels of demand in the first half of the fiscal year, primarily driven by consumer spending related to back-to-school season and traditional holiday shopping season.
Research and Development
We are committed to developing new component technologies, products, alternative storage technologies inclusive of systems, software and other innovative technology solutions to support emerging applications in data use and storage. Our research and development activities are designed to bring new products to market in high volume, with quality attributes that our customers expect, before our competitors. Part of our product development strategy is to leverage a design platform and/or subsystem within product families to serve different market needs. This platform strategy allows for more efficient resource utilization, leverages best design practices, reduces exposure to changes in demand, and allows for achievement of lower costs through purchasing economies of scale. Our advanced technology integration effort, such as our high-capacity enabling HAMR technology, focuses disk drive and component research on recording subsystems, including read/write heads and recording media; market-specific product technology; and technology we believe may lead to new business opportunities. The primary purpose of our advanced technology integration effort is to ensure timely availability of mature component technologies for our product development teams as well as to allow us to leverage and coordinate those technologies in the design centers across our products in order to take advantage of opportunities in the marketplace.
Patents and Licenses
As of June 30, 2023, we had approximately 4,200 U.S. patents and 450 patents issued in various foreign jurisdictions as well as approximately 350 U.S. and 100 foreign patent applications pending. The number of patents and patent applications will vary at any given time as part of our ongoing patent portfolio management activity. Due to the rapid technological change that characterizes the data storage industry, we believe that, in addition to patent protection, the improvement of existing products, reliance upon trade secrets, protection of unpatented proprietary know-how and development of new products are also important to our business in establishing and maintaining a competitive advantage. Accordingly, we intend to continue our efforts to broadly protect our intellectual property, including obtaining patents, where available, in connection with our research and development program.
The data storage industry is characterized by significant litigation arising from time to time relating to patent and other intellectual property rights. From time to time, we receive claims that our products infringe patents of third parties. Although we have been able to resolve some of those claims or potential claims without a material adverse effect on us, other claims have resulted in adverse decisions or settlements. In addition, other claims are pending, which if resolved unfavorably to us could have a material adverse effect on our business and results of operations. For more information on these claims, see “Item 8. Financial Statements and Supplementary Data—Note 14. Legal, Environmental and Other Contingencies.” The costs of engaging in intellectual property litigation in the past have been, and in the future may be, substantial, irrespective of the merits of the claim or the outcome.
Environmental Matters
Our operations are subject to laws and regulations in the various jurisdictions in which we operate relating to the protection of the environment, including those governing discharges of pollutants into the air and water, the management and disposal of hazardous substances and wastes and the cleanup of contaminated sites. Some of our operations require environmental permits and controls to prevent and reduce air and water pollution, and these permits are subject to modification, renewal and revocation by issuing authorities.
We have established environmental management systems and continually update environmental policies and standard operating procedures for our operations worldwide. We believe that our operations are in material compliance with applicable environmental laws, regulations and permits. We budget for operating and capital costs on an ongoing basis to comply with environmental laws. If additional or more stringent requirements are imposed on us in the future, we could incur additional operating costs and capital expenditures.
Some environmental laws, such as the U.S. Comprehensive Environmental Response Compensation and Liability Act of 1980 (as amended, the “Superfund” law) and its state equivalents, can impose liability for the cost of cleanup of contaminated sites upon any of the current or former site owners or operators or upon parties who sent waste to these sites, regardless of whether the owner or operator owned the site at the time of the release of hazardous substances or the lawfulness of the original disposal activity. We have been identified as a responsible or potentially responsible party at several sites. Based on current estimates of cleanup costs and our expected allocation of these costs, we do not expect costs in connection with these sites to be material.
We may be subject to various state, federal and international laws and regulations governing environmental matters, including those restricting the presence of certain substances in electronic products. For example, the European Union (“EU”) enacted the Restriction of the Use of Certain Hazardous Substances in Electrical and Electronic Equipment (2011/65/EU), which prohibits the use of certain substances, including lead, in certain products, including disk drives and server storage
products, put on the market after July 1, 2006. Similar legislation has been or may be enacted in other jurisdictions, including in the U.S., Canada, Mexico, Taiwan, China and Japan. The EU REACH Directive (Registration, Evaluation, Authorization, and Restriction of Chemicals, EC 1907/2006) also restricts substances of very high concern in products. If we or our suppliers fail to comply with the substance restrictions, recycle requirements or other environmental requirements as they are enacted worldwide, it could have a materially adverse effect on our business.
Social and Employee Matters
As of June 30, 2023, we employed approximately 33,400 employees and temporary employees worldwide, of which approximately 27,100 were located in our Asia operations. We believe that our employees are crucial to our current success and that our future success will depend, in part, on our ability to attract, retain and further motivate qualified employees at all levels. We believe that our employee relations are good.
Diversity, Equity & Inclusion. One of our core values is inclusion. We rely on our diverse workforce to develop, deliver and sustain our business strategy and achieve our goals. One way we embrace our diverse employees and promote a culture of inclusion is through the support of employee resource groups (“ERG”). These voluntary, employee-led communities are built on a shared diversity of identity, experience or thought and provide a number of benefits to employees, including professional and leadership development. Seagate’s ERG community encompasses a wide array of diversity, such as LGBTQ+, women, people of color and interfaith, and includes over 27 chapters across seven countries. We also support inclusion through active employee communications, unconscious bias education and ongoing efforts to ensure our employees feel safe, respected and welcomed. In January 2023, we published our fourth annual Diversity, Equity, and Inclusion (“DEI”) Report, which provides an overview of our DEI efforts and outcomes including demographics on our workforce. The fiscal year 2022 DEI Report is available on our website.
Health & Safety. All our manufacturing sites have health and safety management systems certified to the International Organization for Standardization (“ISO”) 45001. In addition, we are audited to health and safety standards set forth by the Responsible Business Alliance. Our global health and safety standards, as well as our accompanying Environment, Health and Safety (“EHS”) management systems, frequently go beyond country or industry-level guidelines to ensure that we keep our employees healthy and safe. We regularly host health and safety regulatory visits that focus on issues such as safety, radiation, fire codes, food and transportation. Through our EHS Management Systems, we ensure that the focus remains on the continuous improvement of employee health and safety programs. We continue to provide comprehensive health and safety training to our employees. We emphasize e-learning courses as our main vehicle for delivering such training because employees can learn at their own pace.
Development, Retention, Compensation, Benefits & Engagement. Our performance management system is a continuous process that helps team members focus on the right priorities. Meaningful conversations between managers and employees are the foundation of performance management at Seagate. We focus on dialogue centered around manager and employee conversations, and ongoing feedback, to align goals. This approach focuses on achieving high-quality productive dialogue between managers and employees. We also encourage our employees to participate in the many learning opportunities that are available at Seagate. The portfolio of learning and training formats include but are not limited to mentoring and coaching, e-learning opportunities, LinkedIn Learning classroom training, on-the-job training and other strategic internal programs that cover topics ranging from leadership and technical skills to health, safety and the environment. In addition, we are investing in upskilling and re-deploying employees as needed to support our future growth and respond to the changing demands of the business. For example, our internal mobility and career development tool provides Seagate employees the opportunity to establish networking and mentor connections, identify and participate in internal part-time projects, and explore internal full-time positions.
Our Total Rewards program is designed to attract, motivate and retain talented people in order to successfully meet our business goals. The program generally includes base pay, annual bonuses, commissions, equity awards, an employee stock purchase plan, retirement savings opportunities and other employee health and wellness benefits. Our compensation programs and guidelines are structured to align pay with performance and aim to provide internally and externally competitive total compensation.
Employee engagement is the psychological commitment and passion that drives discretionary effort. It predicts individual performance and is the measure of the relationship between employees and the Company. Our engagement survey includes facets of the employee experience throughout the employee life cycle. Employee experience is what employees encounter and observe over the course of their career at Seagate. A positive employee experience can have an impact on everything from recruiting to Seagate's bottom line.
In fiscal year 2023, we conducted two pulse surveys to obtain feedback from our global employees on their experience at Seagate. Following the conclusion of the surveys, leaders were provided access to a dashboard with results that shared the key drivers of engagement specific to their own department.
Giving Back. Our community engagement program is designed to provide support to our local communities, with an emphasis on science, technology, engineering and mathematics (“STEM”) and also address health and human services, and environmental opportunities. The program is reflective of Seagate’s vertically integrated model, with multiple large facilities across EMEA, Asia and the United States. Accordingly, the program is highly localized, involving a cross-functional process to identify and execute on opportunities that are meaningful locally.
We maintain an emphasis on STEM, targeting K-12 students, supporting STEM efforts in a way that is age-appropriate and allows for fun as well as learning. In fiscal year 2023 we continued pivoting to virtual engagements and funding of STEM partners as they worked to deliver their programs online or in a socially distanced manner. Seagate also increased support of health & human services partnerships, such as support of food banks, clinics, and non-profit organizations, while sustaining many of our ongoing community partnerships.
Environmental, Social and Governance (“ESG”) Performance Report
Additional information regarding our ESG commitment and progress can be found on the ESG section of our website and in our ESG Performance Report. Information contained on our website or in our annual ESG Performance Report is not incorporated by reference into this or any other report we filed with the Securities and Exchange Commission.
Financial Information
Financial information for our reportable business segment and about geographic areas is set forth in “Item 8. Financial Statements and Supplementary Data—Note 16. Business Segment and Geographic Information.”
Corporate Information
Seagate Technology Holdings public limited company is a public limited company organized under the laws of Ireland.
Available Information
Availability of Reports. We are a reporting company under the Securities Exchange Act of 1934, as amended (the “1934 Exchange Act”), and we file reports, proxy statements and other information with the U.S. Securities and Exchange Commission (the “SEC”). Because we make filings to the SEC electronically, the public may access this information at the SEC's website: www.sec.gov. This site contains reports, proxy and information statements and other information regarding issuers that file electronically with the SEC.
Website Access. Our website is www.seagate.com. We make available, free of charge at the “Investor Relations” section of our website (investors.seagate.com), our Annual Reports on Form 10-K, Quarterly Reports on Form 10-Q, Current Reports on Form 8-K and amendments to those reports filed or furnished pursuant to Section 13(a) or 15(d) of the 1934 Exchange Act as soon as reasonably practicable after we electronically file such materials with, or furnish them to, the SEC. Reports of beneficial ownership filed pursuant to Section 16(a) of the 1934 Exchange Act are also available on our website.
Investors. Investors and others should note that we routinely use the Investor Relations section of our website to announce material information to investors and the marketplace. While not all of the information that the Company posts on its corporate website is of a material nature, some information could be deemed to be material. Accordingly, the Company encourages investors, the media and others interested in the Company to review the information that it shares on www.seagate.com. Information in, or that can be accessed through, our website is not incorporated into this Form 10-K.
Information About Our Executive Officers
The following sets forth the name, age and position of each of the persons who were serving as executive officers as of August 4, 2023. There are no family relationships among any of our executive officers.
| Name | Age | Positions | ||||||||||||
| Dr. William D. Mosley | 56 | Director and Chief Executive Officer | ||||||||||||
| Gianluca Romano | 54 | Executive Vice President and Chief Financial Officer | ||||||||||||
| Ban Seng Teh | 57 | Executive Vice President and Chief Commercial Officer | ||||||||||||
| Katherine E. Schuelke | 60 | Senior Vice President, Chief Legal Officer and Corporate Secretary | ||||||||||||
| KianFatt Chong | 60 | Senior Vice President, Global Operations | ||||||||||||
| Dr. John C. Morris | 56 | Senior Vice President and Chief Technology Officer |
Dr. William D. Mosley, 56, has served as our Chief Executive Officer (“CEO”) since October 2017 and as a member of the Board since July 2017. He previously served as our President and Chief Operating Officer (“COO”) from June 2016 to September 2017. He also served as our President of Operations and Technology from October 2013 to June 2016 and as our Executive Vice President of Operations from March 2011 until October 2013. Prior to these positions, Dr. Mosley served as Executive Vice President, Sales and Marketing from February 2009 through March 2011; Senior Vice President of Global Disk Storage Operations from 2007 to 2009; and Vice President of Research and Development, Engineering from 2002 to 2007. He joined Seagate in 1996 as a Senior Engineer with a PhD in solid state physics. From 1996 to 2002, he served at Seagate in varying roles of increasing responsibility until his promotion to Vice President.
Gianluca Romano, 54, has served as our Executive Vice President and Chief Financial Officer since January 2019. From October 2011 to December 2018, Mr. Romano served as Corporate Vice President, Business Finance and Accounting at Micron Technology, Inc (“Micron”), a producer of computer memory and computer data storage. Prior to his role at Micron, Mr. Romano served as Vice President Finance, Corporate Controller at Numonyx, Inc., a flash memory company which was acquired by Micron in February 2010, from 2008 to 2010. From 1994 until 2008, Mr. Romano held various finance positions at STMicroelectronics, an electronics and semiconductor manufacturer, most recently as Group Vice-President, Central & North Europe Finance Director, Shared Accounting Services Director.
Ban Seng Teh, 57, has served as our Executive Vice President and Chief Commercial Officer since July 2022. Prior to that, Mr. Teh served as Executive Vice President of Global Sales and Sales Operations from February 2021 to July 2022 and Senior Vice President of Global Sales and Sales Operations from November 2014 to February 2021. Mr. Teh also served as our Senior Vice President of Asia-Pacific and Japan Sales and marketing from July 2010 to November 2014. Mr. Teh joined Seagate in 1989 as a field customer engineer and has served in varying roles of increasing responsibilities, including as Vice President, Asia Pacific Sales and Marketing (Singapore) from January 2008 to July 2010; Vice President, Sales Operations from 2006 to 2008; Vice President, Asia Pacific Sales from 2003 to 2006; Director, Marketing and APAC Distribution Sales from 1999 to 2003; and Country Manager, South Asia Sales from 1996 to 1999.
Katherine E. Schuelke, 60, has served as our Senior Vice President, Chief Legal Officer and Corporate Secretary since June 2017. From 2011 to January 2016, Ms. Schuelke was the Senior Vice President, General Counsel and Secretary at Altera Corporation (“Altera”), a manufacturer of programmable logic devices. Prior to that, Ms. Schuelke was Vice President, General Counsel, and Secretary at Altera from 2001 to 2011. At Altera, she held other positions of increasing responsibility from 1996 through 2001. Ms. Schuelke began her career at an international law firm. Ms. Schuelke serves on the board of directors of SiTime Corporation, a provider of silicon timing solutions, and on its Compensation and Nominating and Corporate Governance Committees.
KianFatt Chong, 60, has served as our Senior Vice President, Global Operations since October 2020. Prior to his current role, Mr. Chong was Senior Vice President, Global Drive Operations from December 2013 to September 2020. He served as Vice President of China Operations from July 2003 to November 2013, expanding and also spearheading the first campus concept in Seagate with multiple manufacturing operations disciplines all located in a single site. Since joining Seagate in 1989 as an engineer, Mr. Chong has held a variety of leadership positions and has been a key strategic contributor for many Seagate’s operations and manufacturing capabilities across the global footprints.
Dr. John C. Morris, 56, has served as our Senior Vice President, HDD and SSD Products and Chief Technology Officer since 2019. Prior to his current role, Dr. Morris was the Vice President of HDD and SSD Products from August 2015 to August 2019. Before that, he served as Vice President of Design Engineering and Enterprise Development Group driving focus on technical and strategic alignment with enterprise and cloud customers from September 2013 to August 2015. Since joining the Company in 1996, Dr. Morris has held a variety of engineering leadership positions and has been a key contributor to many of Seagate’s core technologies.
Item 1A. RISK FACTORS
Summary of Risk Factors
The following is a summary of the principal risks and uncertainties that could materially adversely affect our business, results of operations, financial condition, cash flows, brand and/or the price of our outstanding ordinary shares, and make an investment in our ordinary shares speculative or risky. You should read this summary together with the more detailed description of each risk factor contained below. Additional risks beyond those summarized below or discussed elsewhere in this Annual Report on Form 10-K may apply to our business and operations as currently conducted or as we may conduct them in the future or to the markets in which we currently, or may in the future, operate.
Risks Related to our Business, Operations and Industry
-
Our ability to increase our revenue and maintain our market share depends on our ability to successfully introduce and achieve market acceptance of new products on a timely basis. If our products do not keep pace with customer requirements, our results of operations will be adversely affected.
-
We operate in highly competitive markets and our failure to anticipate and respond to technological changes and other market developments, including price, could harm our ability to compete.
-
We have been adversely affected by reduced, delayed, loss of or canceled purchases by, one or more of our key customers, including large hyperscale data center companies and CSPs.
-
We are dependent on sales to distributors and retailers, which may increase price erosion and the volatility of our sales.
-
We must plan our investments in our products and incur costs before we have customer orders or know about the market conditions at the time the products are produced. If we fail to predict demand accurately for our products or if the markets for our products change, we may have insufficient demand or we may be unable to meet demand, which may materially adversely affect our financial condition and results of operations.
-
Changes in demand for computer systems, data storage subsystems and consumer electronic devices may in the future cause a decline in demand for our products.
-
We have a long and unpredictable sales cycle for nearline storage solutions, which impairs our ability to accurately predict our financial and operating results in any period and may adversely affect our ability to forecast the need for investments and expenditures.
-
We experience seasonal declines in the sales of our consumer products during the second half of our fiscal year which may adversely affect our results of operations.
-
We may not be successful in our efforts to grow our systems, SSD and Lyve revenues.
-
Our worldwide sales and manufacturing operations subject us to risks that may adversely affect our business related to disruptions in international markets, currency exchange fluctuations and increased costs.
-
The effects of the COVID-19 pandemic have negatively impacted and may, in the future, adversely impact our business, operating results and financial condition, as well as the operations and financial performance of many of the customers and suppliers in industries that we serve.
-
If we do not control our costs, we will not be able to compete effectively and our financial condition may be adversely impacted.
Risks Associated with Supply and Manufacturing
-
Shortages or delays in the receipt of, or cost increases in, critical components, equipment or raw materials necessary to manufacture our products, as well as reliance on single-source suppliers, may affect our production and development of products and may harm our operating results.
-
We have cancelled purchased commitments with suppliers and incurred cost associated with such cancellations, and if revenues fall or customer demand decreases significantly, we may not meet our purchase commitments to certain suppliers in the future, which could result in penalties, increased manufacturing costs or excess inventory.
-
Due to the complexity of our products, some defects may only become detectable after deployment.
Risks Related to Human Capital
-
The loss of or inability to attract, retain and motivate key executive officers and employees could negatively impact our business prospects.
-
We are subject to risks related to corporate and social responsibility and reputation.
Risks Related to Financial Performance or General Economic Conditions
-
Changes in the macroeconomic environment have impacted and may in the future negatively impact our results of operations.
-
We may not be able to generate sufficient cash flows from operations and our investments to meet our liquidity requirements, including servicing our indebtedness and continuing to declare our quarterly dividend.
-
We are subject to counterparty default risks.
-
Our quarterly results of operations fluctuate, sometimes significantly, from period to period, and may cause our share price to decline.
-
Any cost reduction initiatives that we undertake may not deliver the results we expect and these actions may adversely affect our business.
-
The effect of geopolitical uncertainties, war, terrorism, natural disasters, public health issues and other circumstances, on national and/or international commerce and on the global economy, could materially adversely affect our results of operations and financial condition.
Legal, Regulatory and Compliance Risks
-
Our business is subject to various laws, regulations, governmental policies, litigation, governmental investigations or governmental proceedings that may cause us to incur significant expense or adversely impact our results or operations and financial condition.
-
Some of our products and services are subject to export control laws and other laws affecting the countries in which our products and services may be sold, distributed, or delivered, and any changes to or violation of these laws could have a material adverse effect on our business, results of operations, financial condition and cash flows.
-
Changes in U.S. trade policy, including the imposition of sanctions or tariffs and the resulting consequences, may have a material adverse impact on our business and results of operations.
-
We may be unable to protect our intellectual property rights, which could adversely affect our business, financial condition and results of operations.
-
We are at times subject to intellectual property proceedings and claims which could cause us to incur significant additional costs or prevent us from selling our products, and which could adversely affect our results of operations and financial condition.
-
Our business and certain products and services depend in part on IP and technology licensed from third parties, as well as data centers and infrastructure operated by third parties.
Risks Related to Information Technology, Data and Information Security
-
We could suffer a loss of revenue and increased costs, exposure to significant liability including legal and regulatory consequences, reputational harm and other serious negative consequences in the event of cyber-attacks, ransomware or other cyber security breaches or incidents that disrupt our operations or result in unauthorized access to, or the loss, corruption, unavailability or dissemination of proprietary or confidential information of our customers or about us or other third parties.
-
We must successfully implement our new global enterprise resource planning system and maintain and upgrade our information technology systems, and our failure to do so could have a material adverse effect on our business, financial condition and results of operations.
Risks Related to Owning our Ordinary Shares
-
The price of our ordinary shares may be volatile and could decline significantly.
-
Any decision to reduce or discontinue the payment of cash dividends to our shareholders or the repurchase of our ordinary shares pursuant to our previously announce
Showing the first 8K of 95K characters. Open the full section
Item 1B. UNRESOLVED STAFF COMMENTS
None.
Item 2. PROPERTIES
Our principal executive offices are located in Ireland. Our principal manufacturing facilities are located in China, Malaysia, Northern Ireland, Singapore, Thailand and the United States. Our principal product development facilities are located in California, Colorado, Minnesota and Singapore. Our leased facilities are occupied under leases that expire on various dates through 2067.
Our material manufacturing, product development and marketing and administrative facilities at June 30, 2023 are as follows:
| Location | Building(s) Owned or Leased | Approximate Square Footage | Primary Use | |||||||||||||||||
| Europe | ||||||||||||||||||||
| Northern Ireland | ||||||||||||||||||||
| Springtown | Owned | 479,000 | Manufacture of recording heads | |||||||||||||||||
| United States | ||||||||||||||||||||
| California | Leased | 575,000 | Product development, marketing and administrative and operational offices | |||||||||||||||||
| Colorado | Leased | 533,000 | Product development, administrative and operational offices | |||||||||||||||||
| Minnesota | Owned/Leased | 1,096,000 | Manufacture of recording heads and product development | |||||||||||||||||
| Asia | ||||||||||||||||||||
| China | ||||||||||||||||||||
| Wuxi | Leased | 707,000 | Manufacture of drives and drive subassemblies | |||||||||||||||||
| Malaysia | ||||||||||||||||||||
| Johor | Owned (1) | 631,000 | Manufacture of substrates | |||||||||||||||||
| Singapore | ||||||||||||||||||||
| Woodlands | Owned/Leased (1) | 1,511,000 | Manufacture of media, administrative and operational offices | |||||||||||||||||
| Ayer Rajah | Leased | 410,000 | Product development, administrative and operational offices | |||||||||||||||||
| Thailand | ||||||||||||||||||||
| Korat | Owned/Leased | 2,710,000 | Manufacture of drives and drive subassemblies | |||||||||||||||||
| Teparuk | Owned/Leased | 453,000 | Manufacture of drive subassemblies | |||||||||||||||||
(1) Land leases for these facilities expire on various dates through 2067.
As of June 30, 2023, we owned or leased a total of approximately 9.8 million square feet of space worldwide. We believe that our existing properties are in good operating condition and are suitable for the operations for which they are used.
Item 3. LEGAL PROCEEDINGS
See “Item 8. Financial Statements and Supplementary Data—Note 14. Legal, Environmental and Other Contingencies.”
Item 4. MINE SAFETY DISCLOSURES
Not applicable.
PART II
Item 5. MARKET FOR REGISTRANT’S COMMON EQUITY, RELATED STOCKHOLDER MATTERS AND ISSUER PURCHASES OF EQUITY SECURITIES
Market Information
Our ordinary shares trade on the NASDAQ Global Select Market under the symbol “STX.”
As of July 31, 2023, there were approximately 487 holders of record of our ordinary shares. We did not sell any of our equity securities during fiscal year 2023 that were not registered under the Securities Act of 1933, as amended.
Performance Graph
The performance graph below shows the cumulative total shareholder return on our ordinary shares for the period from June 29, 2018 to June 30, 2023. This is compared with the cumulative total return of the Dow Jones U.S. Computer Hardware Index and the Standard & Poor’s 500 Stock Index (“S&P 500”) over the same period. The graph assumes that on June 29, 2018, $100 was invested in our ordinary shares and $100 was invested in each of the other two indices, with dividends reinvested on the date of payment without payment of any commissions. Dollar amounts in the graph are rounded to the nearest whole dollar. The performance shown in the graph represents past performance and should not be considered an indication of future performance.
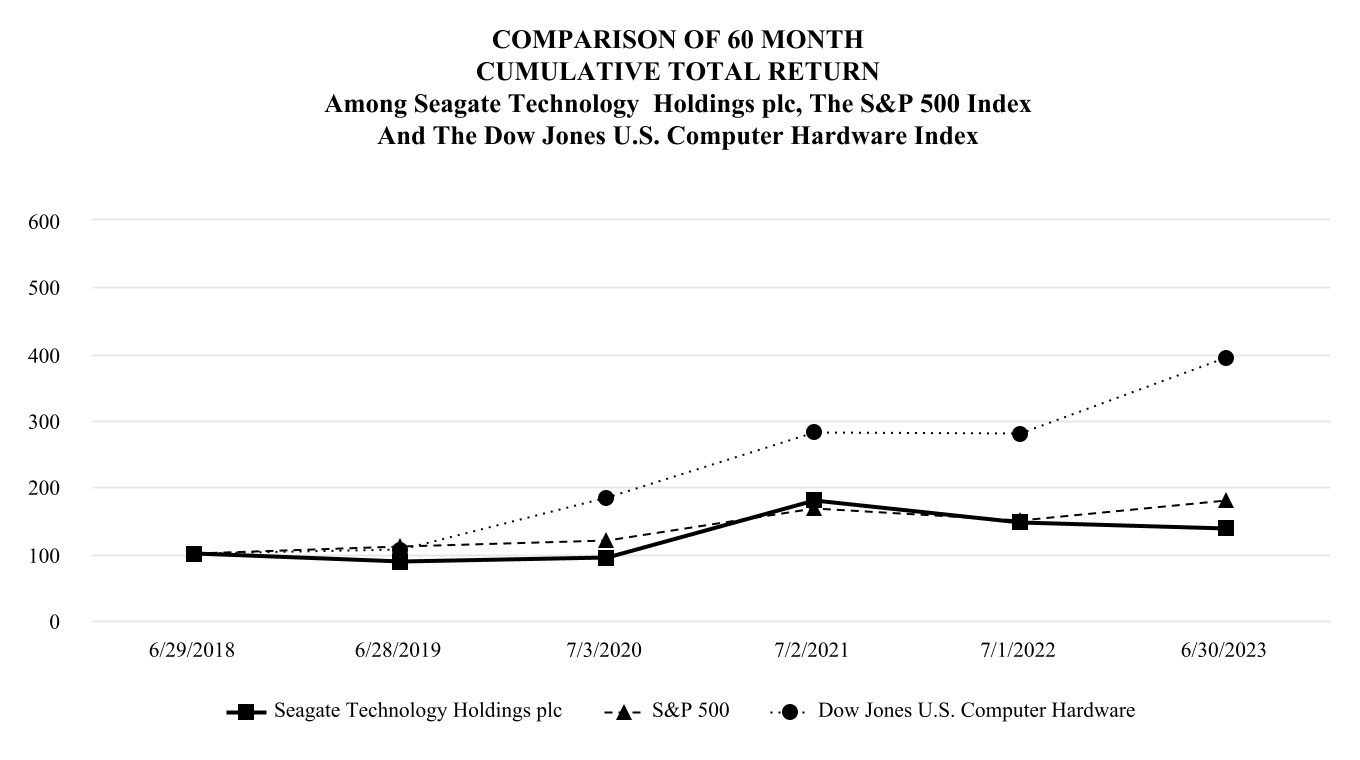
| 6/29/2018 | 6/28/2019 | 7/3/2020 | 7/2/2021 | 7/1/2022 | 6/30/2023 | ||||||||||||||||||||||||||||||
| Seagate Technology Holdings plc | $ | 100.00 | $ | 88.32 | $ | 93.37 | $ | 178.82 | $ | 146.57 | $ | 137.65 | |||||||||||||||||||||||
| S&P 500 | 100.00 | 110.42 | 118.70 | 167.13 | 149.39 | 178.66 | |||||||||||||||||||||||||||||
| Dow Jones U.S. Computer Hardware | 100.00 | 106.49 | 184.21 | 281.05 | 280.39 | 394.47 |
Dividends
Our ability to pay dividends in the future will be subject to, among other things, general business conditions within the data storage industry, our financial results, the impact of paying dividends on our credit ratings and legal and contractual restrictions on the payment of dividends by our subsidiaries to us or by us to our ordinary shareholders, including restrictions imposed by covenants on our debt instruments.
Repurchases of Equity Securities
All repurchases of our outstanding ordinary shares are effected as redemptions in accordance with our Constitution.
As of June 30, 2023, $1.9 billion remained available for repurchase of ordinary shares under the existing repurchase authorization limits authorized by our Board of Directors on October 21, 2020 and February 22, 2021. There is no expiration date on our repurchase authorizations. The timing of purchases will depend upon prevailing market conditions, alternative uses of capital and other factors. We may limit or terminate the repurchase program at any time.
The following table sets forth information with respect to all repurchases of our ordinary shares made during the fiscal year ended June 30, 2023, including statutory tax withholdings related to vesting of employee equity awards (in millions, except average price paid per share):
| Period | Total Number of Shares Purchased (1) | Average Price Paid per Share (1) | Total Number of Shares Purchased as Part of Publicly Announced Plans or Programs | Approximate Dollar Value of Shares that May Yet Be Purchased Under the Plans or Programs (1) | ||||||||||||||||||||||||||||
| 1st Quarter through 3rd Quarter of Fiscal Year 2023 | 6 | $ | 74.55 | 6 | $ | 1,924 | ||||||||||||||||||||||||||
| April 1, 2023 through April 28, 2023 | — | — | — | 1,924 | ||||||||||||||||||||||||||||
| April 29, 2023 through May 26, 2023 | — | — | — | 1,924 | ||||||||||||||||||||||||||||
| May 27, 2023 through June 30, 2023 | — | — | — | 1,921 | ||||||||||||||||||||||||||||
| Through 4th Quarter of Fiscal Year 2023 | 6 | 6 | $ | 1,921 |
(1) Repurchase of shares including tax withholdings.
Item 6. [Reserved]
Item 7. MANAGEMENT'S DISCUSSION AND ANALYSIS OF FINANCIAL CONDITION AND RESULTS OF OPERATIONS
The following is a discussion of the Company’s financial condition, changes in financial condition and results of operations for the fiscal years ended June 30, 2023 and July 1, 2022. Discussions of year-to-year comparisons between fiscal years 2022 and 2021 are not included in this Annual Report on Form 10-K and can be found in Part II, Item 7 of our Annual Report on Form 10-K for the fiscal year ended July 1, 2022, which was filed with the SEC on August 5, 2022.
You should read this discussion in conjunction with “Item 8. Financial Statements and Supplementary Data” included elsewhere in this Annual Report on Form 10-K. Except as noted, references to any fiscal year mean the twelve-month period ending on the Friday closest to June 30 of that year. Accordingly, fiscal year 2023 and 2022 both comprised of 52 weeks and ended on June 30, 2023 and July 1, 2022, respectively. Fiscal year 2026 will be comprised of 53 weeks and will end on July 3, 2026.
Our Management’s Discussion and Analysis of Financial Condition and Results of Operations (“MD&A”) is provided in addition to the accompanying consolidated financial statements and notes to assist readers in understanding our results of operations, financial condition and cash flows. Our MD&A is organized as follows:
*•*Overview of Fiscal Year 2023. Highlights of events in fiscal year 2023 that impacted our financial position.
-
Results of Operations. Analysis of our financial results comparing fiscal years 2023 and 2022.
-
Liquidity and Capital Resources. Analysis of changes in our balance sheets and cash flows and discussion of our financial condition, including potential sources of liquidity, material cash requirements and their general purpose.
-
Critical Accounting Policies and Estimates. Accounting policies and estimates that we believe are important to understanding the assumptions and judgments incorporated in our reported financial results.
For an overview of our business, see “Part I, Item 1. Business.”
Overview of Fiscal Year 2023
During fiscal year 2023, we shipped 441 exabytes of HDD storage capacity. We generated revenue of approximately $7.4 billion with a gross margin of 18%. Our operating cash flow was $942 million. We repurchased approximately 5 million of our ordinary shares for $408 million and paid $582 million in dividends.
We reduced our outstanding debt by $195 million through exchange and repurchase of certain senior notes and Term Loans facility with longer duration senior notes and recorded a net gain of $190 million as a result of debt extinguishment. Additionally, we entered into a settlement agreement related to BIS’ allegations regarding violations of the U.S. EAR and recorded a settlement penalty of $300 million.
Recent Developments, Economic Conditions and Challenges
During fiscal year 2023, the data storage industry and our business continued to be impacted by macroeconomic uncertainties and customer inventory adjustments, which led to a significant slowdown in demand for our products, particularly in the mass capacity markets. In response to changes in market demand, we undertook actions to lower our cost structure and reduced manufacturing production plans, which resulted in factory underutilization charges. We expect these market conditions will continue to impact our business and results of operations over the near term. Under these conditions, we are continuing to actively manage costs, drive operational efficiencies and maintain supply discipline.
In light of the deterioration of economic conditions, we undertook the October 2022, April 2023 and other restructuring plans to reduce our cost in response to change in macroeconomic and business conditions during fiscal year 2023. These restructuring plans were substantially completed by the end of fiscal year 2023 with total charges of approximately $269 million, mainly consisting of employee severance cost and other one-time termination benefits. Refer to “ Item 8. Financial Statements and Supplementary Data—Note 7. Restructuring and Exit Costs” for more details.
We continue to actively monitor the effects and potential impacts of inflation, other macroeconomic factors and the pandemic on all aspects of our business, supply chain, liquidity and capital resources including governmental policies that could periodically shut down an entire city where we, our suppliers or our customers operate. We are complying with governmental rules and guidelines across all of our sites. Although we are unable to predict the future impact on our business, results of operations, liquidity or capital resources at this time, we expect we will continue to be negatively affected if the inflation, other macroeconomic factors and the pandemic and related public and private health measures result in substantial manufacturing or supply chain challenges, substantial reductions or delays in demand due to disruptions in the operations of our customers or partners, disruptions in local and global economies, volatility in the global financial markets, sustained reductions or volatility in overall demand trends, restrictions on the export or shipment of our products or our customer’s products, or other unexpected ramifications. For a further discussion of the uncertainties and business risks associated with the COVID-19 pandemic, see “Part I, Item 1A. Risk Factors” of our Annual Report.
Regulatory settlement
On April 18, 2023, our subsidiaries Seagate Technology LLC and Seagate Singapore International Headquarters Pte. Ltd entered into the Settlement Agreement with the BIS that resolves BIS’ allegations regarding our sales of hard disk drives to Huawei between August 17, 2020 and September 29, 2021. Under the terms of the Settlement Agreement, we agreed to pay $300 million to the BIS in quarterly installments of $15 million over the course of five years beginning October 31, 2023. We have also agreed to complete three audits of its compliance with the license requirements of Section 734.9 of the EAR, including one audit by an unaffiliated third-party consultant chosen by us with expertise in U.S. export control laws and two internal audits. The Settlement Agreement also includes a denial order that is currently suspended and will be waived five years after the date of the order issued under the Settlement Agreement, provided that we have made full and timely payments under the Settlement Agreement and timely completed the audit requirements. While we are in compliance with and upon successful compliance in full with the terms of the Settlement Agreement, BIS has agreed it will not initiate any further administrative proceedings against us in connection with any violation of the EAR arising out of the transactions detailed in the Settlement Agreement.
While we believed that we complied with all relevant export control laws at the time we made the hard disk drive sales at issue, we determined that engaging with BIS and settling this matter was in the best interest of Seagate, our customers and our shareholders. In determining to engage with BIS and resolve this matter through a settlement agreement, we considered a number of factors, including the risks and cost of protracted litigation involving the U.S. government, as well as the size of the potential penalty and our desire to focus on current business challenges and long-term business strategy. The Settlement Agreement includes a finding that we incorrectly interpreted the regulation at issue to require evaluation of only the last stage of our hard disk drive manufacturing process rather than the entire process. As part of this settlement, we have agreed not to contest BIS’ determination that the sales in question did not comply with the U.S. EAR. Refer to “Item 8. Financial Statements and Supplementary Data—Note 14. Legal, Environmental and Other Contingencies” for more details.
Results of Operations
We list in the tables below summarized information from our Consolidated Statements of Operations by dollar amounts and as a percentage of revenue:
| Fiscal Years Ended | ||||||||||||||
| (Dollars in millions) | June 30, 2023 | July 1, 2022 | ||||||||||||
| Revenue | $ | 7,384 | $ | 11,661 | ||||||||||
| Cost of revenue | 6,033 | 8,192 | ||||||||||||
| Gross profit | 1,351 | 3,469 | ||||||||||||
| Product development | 797 | 941 | ||||||||||||
| Marketing and administrative | 491 | 559 | ||||||||||||
| Amortization of intangibles | 3 | 11 | ||||||||||||
| BIS settlement penalty | 300 | — | ||||||||||||
| Restructuring and other, net | 102 | 3 | ||||||||||||
| (Loss) income from operations | (342) | 1,955 | ||||||||||||
| Other expense, net | (154) | (276) | ||||||||||||
| (Loss) income before income taxes | (496) | 1,679 | ||||||||||||
| Provision for income taxes | 33 | 30 | ||||||||||||
| Net (loss) income | $ | (529) | $ | 1,649 |
| Fiscal Years Ended | ||||||||||||||
| June 30, 2023 | July 1, 2022 | |||||||||||||
| Revenue | 100 | % | 100 | % | ||||||||||
| Cost of revenue | 82 | 70 | ||||||||||||
| Gross margin | 18 | 30 | ||||||||||||
| Product development | 11 | 8 | ||||||||||||
| Marketing and administrative | 7 | 5 | ||||||||||||
| Amortization of intangibles | — | — | ||||||||||||
| BIS settlement penalty | 4 | — | ||||||||||||
| Restructuring and other, net | 1 | — | ||||||||||||
| Operating margin | (5) | 17 | ||||||||||||
| Other expense, net | (2) | (3) | ||||||||||||
| (Loss) income before income taxes | (7) | 14 | ||||||||||||
| Provision for income taxes | — | — | ||||||||||||
| Net (loss) income | (7) | % | 14 | % |
Revenue
The following table summarizes information regarding consolidated revenues by channel, geography, and market and HDD exabytes shipped by market and price per terabyte:
| Fiscal Years Ended | ||||||||||||||
| June 30, 2023 | July 1, 2022 | |||||||||||||
| Revenues by Channel (%) | ||||||||||||||
| OEMs | 74 | % | 75 | % | ||||||||||
| Distributors | 15 | % | 14 | % | ||||||||||
| Retailers | 11 | % | 11 | % | ||||||||||
| Revenues by Geography (%) (1) | ||||||||||||||
| Asia Pacific | 45 | % | 46 | % | ||||||||||
| Americas | 41 | % | 40 | % | ||||||||||
| EMEA | 14 | % | 14 | % | ||||||||||
| Revenues by Market (%) | ||||||||||||||
| Mass capacity | 66 | % | 68 | % | ||||||||||
| Legacy | 21 | % | 23 | % | ||||||||||
| Other | 13 | % | 9 | % | ||||||||||
| HDD Exabytes Shipped by Market | ||||||||||||||
| Mass capacity | 380 | 541 | ||||||||||||
| Legacy | 61 | 90 | ||||||||||||
| Total | 441 | 631 | ||||||||||||
| HDD Price per Terabyte | $ | 15 | $ | 17 |
(1) Revenue is attributed to geography based on the bill from location.
| Fiscal Years Ended | ||||||||||||||||||||||||||
| (Dollars in millions) | June 30, 2023 | July 1, 2022 | Change | % Change | ||||||||||||||||||||||
| Revenue | $ | 7,384 | $ | 11,661 | $ | (4,277) | (37) | % | ||||||||||||||||||
Revenue in fiscal year 2023 decreased approximately 37%, or $4.3 billion, from fiscal year 2022, primarily due to a decrease in exabytes shipped and to a lesser extend price erosion, as a result of lower demand in mass capacity and legacy markets that were impacted by macroeconomic conditions and pandemic-related headwinds. We expect the current market conditions will continue to persist at least through the first half of fiscal year 2024.
Cost of Revenue and Gross Margin
| Fiscal Years Ended | ||||||||||||||||||||||||||
| (Dollars in millions) | June 30, 2023 | July 1, 2022 | Change | % Change | ||||||||||||||||||||||
| Cost of revenue | $ | 6,033 | $ | 8,192 | $ | (2,159) | (26) | % | ||||||||||||||||||
| Gross profit | 1,351 | 3,469 | (2,118) | (61) | % | |||||||||||||||||||||
| Gross margin | 18 | % | 30 | % |
For fiscal year 2023, gross margin decreased compared to the prior fiscal year primarily driven by factory underutilization charges of $250 million associated with lower production levels and pandemic-related lockdown in one of our factories, order cancellation fees of $108 million, lower demand in mass capacity and legacy markets with less favorable product mix, price erosion, and accelerated depreciation expense for certain capital equipment.
Operating Expenses
| Fiscal Years Ended | ||||||||||||||||||||||||||
| (Dollars in millions) | June 30, 2023 | July 1, 2022 | Change | % Change | ||||||||||||||||||||||
| Product development | $ | 797 | $ | 941 | $ | (144) | (15) | % | ||||||||||||||||||
| Marketing and administrative | 491 | 559 | (68) | (12) | % | |||||||||||||||||||||
| Amortization of intangibles | 3 | 11 | (8) | (73) | % | |||||||||||||||||||||
| BIS settlement penalty | 300 | — | 300 | * | ||||||||||||||||||||||
| Restructuring and other, net | 102 | 3 | 99 | 3,300 | % | |||||||||||||||||||||
| Operating expenses | $ | 1,693 | $ | 1,514 | $ | 179 |
*Not a meaningful figure
Product Development Expense. Product development expenses for fiscal year 2023 decreased by $144 million from fiscal year 2022 primarily due to a $70 million decrease in variable compensation and related benefit expenses, a $51 million decrease in compensation and other employee benefits primarily from the reduction in headcount as a result of our October 2022 and April 2023 restructuring plans and a temporary salary reduction program, a $14 million decrease in material expense and a $6 million decrease in equipment expense.
Marketing and Administrative Expense. Marketing and administrative expenses for fiscal year 2023 decreased by $68 million from fiscal year 2022 primarily due to a $41 million decrease in variable compensation and related benefit expenses, a $24 million decrease in compensation and other employee benefits primarily from the reduction in headcount as a result of our October 2022 and April 2023 restructuring plans and a temporary salary reduction program and a $7 million recovery of an accounts receivable previously written-off in prior years, partially offset by a $2 million increase in travel expense as a result of the easing of pandemic-related travel restrictions.
Amortization of Intangibles. Amortization of intangibles for fiscal year 2023 decreased by $8 million, as compared to fiscal year 2022, due to certain intangible assets that reached the end of their useful lives.
BIS settlement penalty. The BIS settlement penalty for fiscal year 2023 was $300 million, related to BIS’ allegations of violations of the EAR, which were resolved by the Settlement Agreement in April 2023. Refer to “Item 8. Financial Statements and Supplementary Data—Note 14. Legal, Environmental and Other Contingencies” for more details.
Restructuring and Other, net. Restructuring and other, net for fiscal year 2023 was $102 million, primarily comprised of workforce reduction costs and other exit costs under our October 2022 and April 2023 restructuring plans, partially offset by gains from the sale of certain properties and assets of $167 million.
Restructuring and other, net for fiscal year 2022 was not material.
Other Expense, net
| Fiscal Years Ended | ||||||||||||||||||||||||||
| (Dollars in millions) | June 30, 2023 | July 1, 2022 | Change | % Change | ||||||||||||||||||||||
| Other expense, net | $ | (154) | $ | (276) | $ | 122 | (44) | % |
Other expense, net for fiscal year 2023 decreased by $122 million compared to fiscal year 2022 primarily due to a $190 million net gain recognized from early redemption and extinguishment of certain senior notes, partially offset by a $64 million net increase in interest expense from the exchange and issuance of long-term debt.
Income Taxes
| Fiscal Years Ended | ||||||||||||||||||||||||||
| (Dollars in millions) | June 30, 2023 | July 1, 2022 | Change | % Change | ||||||||||||||||||||||
| Provision for income taxes | $ | 33 | $ | 30 | $ | 3 | 10 | % |
We recorded an income tax provision of $33 million for fiscal year 2023 compared to an income tax provision of $30 million for fiscal year 2022. Despite a consolidated loss on a worldwide basis, we still have taxes payable on a global basis due to guaranteed earnings reported in certain jurisdictions as compared to fiscal year 2022.
On August 16, 2022, the Inflation Reduction Act of 2022 (the “IRA”) was enacted into U.S. law. The legislation includes a new corporate alternative minimum tax (the “CAMT”) of 15% on the adjusted financial statement income (“AFSI”) of corporations with average AFSI exceeding $1.0 billion over a three-year period. Although CAMT is effective for us beginning in fiscal year 2024, Seagate does not meet the criteria to be subject to CAMT for fiscal year 2024.
Our Irish tax resident parent holding company owns various U.S. and non-Irish subsidiaries that operate in multiple non-Irish income tax jurisdictions. Our worldwide operating income is either subject to varying rates of income tax or is exempt from income tax due to tax incentive programs we operate under in Singapore and Thailand. These tax incentives are scheduled to expire in whole or in part at various dates through 2033. Certain tax incentives may be extended if specific conditions are met.
Our income tax provision recorded for fiscal years 2023 and 2022 differed from the provision for income taxes that would be derived by applying the Irish statutory rate of 25% to income before income taxes, primarily due to the net effect of (i) non-Irish earnings generated in jurisdictions that are subject to tax incentive programs and are considered indefinitely reinvested outside of Ireland; and (ii) current year generation of research credits.
We anticipate that our effective tax rate in future periods will generally be less than the Irish statutory rate based on our ownership structure, our intention to indefinitely reinvest earnings from our subsidiaries outside of Ireland and the potential future changes in our valuation allowance for deferred tax assets.
Liquidity and Capital Resources
The following sections discuss our principal liquidity requirements, as well as our sources and uses of cash and our liquidity and capital resources. Our cash and cash equivalents are maintained in investments with remaining maturities of 90 days or less at the time of purchase. The principal objectives of our investment policy are the preservation of principal and maintenance of liquidity. We believe our cash equivalents are liquid and accessible. We operate in some countries that have restrictive regulations over the movement of cash and/or foreign exchange across their borders. However, we believe our sources of cash will continue to be sufficient to fund our operations and meet our cash requirements for the next 12 months. Although there can be no assurance, we believe that our financial resources, along with controlling our costs and capital expenditures, will allow us to manage the ongoing impacts of macroeconomic and other headwinds including higher inflationary pressures, inventory adjustments by our customers and the overall market demand disruptions on our business operations for the foreseeable future. However, some challenges to our industry and to our business continue to remain uncertain and cannot be predicted at this time. Consequently, we will continue to evaluate our financial position in light of future developments, particularly those relating to the global economic factors.
We are not aware of any downgrades, losses or other significant deterioration in the fair value of our cash equivalents from the values reported as of June 30, 2023. For additional information on risks and factors that could impact our ability to fund our operations and meet our cash requirements, including the pandemic, among others, see “Part I, Item 1A. Risk Factors” of our Annual Report.
Cash and Cash Equivalents
| As of | ||||||||||||||||||||
| (Dollars in millions) | June 30, 2023 | July 1, 2022 | Change | |||||||||||||||||
| Cash and cash equivalents | $ | 786 | $ | 615 | $ | 171 | ||||||||||||||
Our cash and cash equivalents increased by $171 million from July 1, 2022 primarily as a result of net cash of $942 million provided by operating activities, net proceeds of $1.6 billion from issuance of long-term debt and proceeds from the sale of assets of $534 million, partially offset by repayment of long-term debt of $1.6 billion, payment of dividends to our shareholders of $582 million, repurchases of our ordinary shares of $408 million, and payments for capital expenditures of $316 million. The following table summarizes results from the Consolidated Statement of Cash Flows for the periods indicated:
| Fiscal Years Ended | ||||||||||||||
| (Dollars in millions) | June 30, 2023 | July 1, 2022 | ||||||||||||
| Net cash flow provided by (used in): | ||||||||||||||
| Operating activities | $ | 942 | $ | 1,657 | ||||||||||
| Investing activities | 217 | (352) | ||||||||||||
| Financing activities | (988) | (1,899) | ||||||||||||
| Net increase/(decrease) in cash, cash equivalents and restricted cash | $ | 171 | $ | (594) |
Cash Provided by Operating Activities
Cash provided by operating activities for fiscal year 2023 was $942 million and includes the effects of net income adjusted for non-cash items including depreciation, amortization, share-based compensation and:
-
a decrease of $911 million in accounts receivable, primarily due to lower revenue and timing of collections;
-
a decrease of $425 million in inventories, primarily due to a decrease in units built to align with the prevailing demand environment; and
-
an increase of $110 million cash proceeds received from the settlement of certain interest rate swap agreements; partially offset by
-
a decrease of $421 million in accounts payable, primarily due to a decrease in materials purchased; and
-
a decrease of $152 million in accrued employee compensation, primarily due to cash paid to our employees as part of our variable compensation plans and a decrease in our variable compensation expense.
Cash provided by operating activities for fiscal year 2022 was approximately $1.7 billion and includes the effects of net income adjusted for non-cash items including depreciation, amortization, share-based compensation and:
-
an increase of $228 million in accounts payable, primarily due to timing of payments and an increase in materials purchased; partially offset by
-
an increase of $374 million in accounts receivable, primarily due to linearity of sales; and
-
an increase of $361 million in inventories, primarily due to timing of shipments, and an increase in materials purchased for production of higher capacity drives and to mitigate supply chain disruptions.
Cash Used in Investing Activities
In fiscal year 2023, we received $217 million for net cash investing activities, which was primarily due to proceeds of $534 million from the sale of assets, offset by payments for the purchase of property, equipment and leasehold improvements of $316 million.
In fiscal year 2022, we used $352 million for net cash investing activities, which was primarily due to payments for the purchase of property, equipment and leasehold improvements of $381 million and payments for the purchase of investments of $18 million, partially offset by proceeds from the sale of investments of $47 million.
Cash Used in Financing Activities
Net cash used in financing activities of $988 million for fiscal year 2023 was primarily attributable to the following activities:
-
$1.6 billion repurchases of long-term debt;
-
$582 million in dividend payments; and
-
$408 million in payments for repurchases of our ordinary shares; partially offset by
-
$1.6 billion in proceeds from the issuance of long-term debt; and
-
$68 million in proceeds from the issuance of ordinary shares under employee stock plans.
Net cash used in financing activities of $1.9 billion for fiscal year 2022 was primarily attributable to the following activities:
-
$1.8 billion in payments for repurchases of our ordinary shares;
-
$701 million net purchases of long-term debt; and
-
$610 million in dividend payments; partially offset by
-
$1.2 billion from the issuance of long-term debt; and
-
$68 million in proceeds from the issuance of ordinary shares under employee stock plans.
Liquidity Sources
Our primary sources of liquidity as of June 30, 2023, consist of: (1) approximately $786 million in cash and cash equivalents, (2) cash we expect to generate from operations and (3) $1.5 billion available for borrowing under our senior unsecured revolving credit facility (“Revolving Credit Facility”), which is part of our credit agreement (the “Credit Agreement”).
As of June 30, 2023, no borrowings (including swing line loans) were outstanding and no commitments were utilized for letters of credit issued under the Revolving Credit Facility. The Revolving Credit Facility is available for borrowings, subject to compliance with financial covenants and other customary conditions to borrowing.
The Credit Agreement includes three financial covenants: (1) interest coverage ratio, (2) leverage ratio and (3) a minimum liquidity amount. On May 19, 2023, we entered into the Eighth Amendment to our Credit Agreement to increase the maximum permitted total net leverage ratio and reduce the minimum interest coverage ration during the covenant relief period. The maximum total net leverage ratio is 6.75 to 1.00 beginning with the fiscal quarter ending June 30, 2023, with periodic step downs during the covenant relief period, shifting to a maximum total leverage ratio of 4.00 to 1.00 for any fiscal quarter ending at any time other than during the covenant relief period. The minimum interest coverage ratio is 2.50 to 1.00 beginning with the fiscal quarter ending June 30, 2023, with periodic step downs and step ups during the covenant relief period, returning to a minimum interest coverage ratio of 3.25 to 1.00 for any fiscal quarter ending after June 28, 2024, and for any fiscal quarter ending at any time other than during the covenant relief period. The covenant relief period terminates on June 27, 2025. As part of this Amendment, the aggregate revolving loan commitments were reduced from $1.75 billion to $1.5 billion. We continue to evaluate our debt portfolio and structure to comply with our financial debt covenants. As of June 30, 2023, we were in compliance with all of the covenants under our debt agreements. Refer to “Item 8. Financial Statements and Supplementary Data—Note 4. Debt” for more details.
As of June 30, 2023, cash and cash equivalents held by non-Irish subsidiaries was $638 million. This amount is potentially subject to taxation in Ireland upon repatriation by means of a dividend into our Irish parent. However, it is our intent to indefinitely reinvest earnings of non-Irish subsidiaries outside of Ireland and our current plans do not demonstrate a need to repatriate such earnings by means of a taxable Irish dividend. Should funds be needed in the Irish parent company and should we be unable to fund parent company activities through means other than a taxable Irish dividend, we would be required to accrue and pay Irish taxes on such dividend.
We believe that our sources of cash will be sufficient to fund our operations and meet our cash requirements for at least the next 12 months. Our ability to fund liquidity requirements beyond 12 months will depend on our future cash flows, which are determined by future operating performance, and therefore, subject to prevailing global macroeconomic conditions and financial, business and other factors, some of which are beyond our control. For additional information on risks and factors that could impact our ability to fund our operations and meet our cash requirements, among others, see “Part I, Item 1A. Risk Factors” of this Annual Report.
Cash Requirements and Commitments
Our liquidity requirements are primarily to meet our working capital, product development and capital expenditure needs, to fund scheduled payments of principal and interest on our indebtedness, and to fund our quarterly dividend and any future strategic investments.
Purchase obligations
Purchase obligations are defined as contractual obligations for the purchase of goods or services, which are enforceable and legally binding on us, and that specify all significant terms. From time to time, we enter into long-term, non-cancelable purchase commitments or make large up-front investments with certain suppliers in order to secure certain components or technologies for the production of our products or to supplement our internal manufacturing capacity for certain components. As of June 30, 2023, we had unconditional purchase obligations of approximately $3.7 billion, primarily related to purchases of inventory components with our suppliers. We expect $919 million of these commitments to be paid within one year.
Capital expenditures
We incur material capital expenditures to design and manufacture our products that depend on advanced technologies and manufacturing techniques. As of June 30, 2023, we had unconditional commitment of $238 million primarily related to purchases of equipment, of which approximately $137 million is expected to be paid within one year. For fiscal year 2024, we expect capital expenditures to be lower than fiscal year 2023.
Operating leases
We are a lessee in several operating leases related to real estate facilities for warehouse, office and lab space. As of June 30, 2023, the amount of future minimum rent expense for both occupied and vacated facilities net of sublease income under non-cancelable operating lease contracts was $564 million, of which $53 million is expected to be paid within one year. Refer to “Item 8. Financial Statements and Supplementary Data—Note 6. Leases” for details.
Long-term debt and interest payments on debt
As of June 30, 2023, the future principal payment obligation on our long-term debt was $5.5 billion, of which $63 million will mature within one year. As of June 30, 2023, future interest payments on this outstanding debt is estimated to be approximately $2.2 billion, of which $324 million is expected to be paid within one year. From time to time, we may repurchase, redeem or otherwise extinguish any of our outstanding senior notes in open market or privately negotiated purchases or otherwise, or we may repurchase or redeem outstanding senior notes pursuant to the terms of the applicable indenture. Refer to “Item 8. Financial Statements and Supplementary Data—Note 4. Debt” for more details.
BIS settlement penalty
We accrued a settlement penalty of $300 million for fiscal year 2023, related to BIS’ allegations of violations of the U.S. EAR, which were subsequently resolved by the Settlement Agreement in April 2023. As part of the Settlement Agreement with BIS, quarterly payments of $15 million will be made over the course of five years beginning October 31, 2023, of which $45 million is expected to be paid within one year and $255 million thereafter. Refer to “Item 8. Financial Statements and Supplementary Data—Note 14. Legal, Environmental and Other Contingencies” for more details.
Restructuring
On October 24, 2022, we committed to an October 2022 plan (the “October 2022 Plan”) to reduce our cost structure to better align our operational needs to current economic conditions while continuing to support the long-term business strategy. On March 29, 2023, in light of further deteriorating economic conditions, we committed to an expansion of the October 2022 Plan to further reduce the global headcount by approximately 480 employees to a total reduction of approximately 3,480 employees. The expanded plan includes aligning our business plan to near-term market conditions, along with other cost saving measures. On April 20, 2023, the Company committed to an April 2023 restructuring plan (the “April 2023 Plan”) to further reduce its cost structure in response to changes in macroeconomic and business conditions. The April 2023 Plan was intended to align the Company’s operational needs with the near-term demand environment while continuing to support the long-term business strategy. Both the October 2022 Plan and the April 2023 Plan were substantially completed by the end of the fiscal year 2023.
During fiscal year 2023, we recorded restructuring and other, net of $102 million, primarily related to the workforce reduction costs under the October 2022 Plan and the April 2023 Plan, partially offset by gains from the sale of certain properties and assets. We made cash payments of $155 million for all active restructuring plans. As of June 30, 2023, the future cash payments related to our remaining active restructuring plans were $119 million, of which $117 million is expected to be paid within one year.
Income Tax
As of June 30, 2023, we had a liability for unrecognized tax benefits and an accrual for the payment of related interest totaling $4 million, none of which is expected to be settled within one year. Outside of one year, we are unable to make a reasonably reliable estimate of when cash settlement with a taxing authority will occur.
Dividends
On July 26, 2023, our Board of Directors declared a quarterly cash dividend of $0.70 per share, which will be payable on October 10, 2023 to shareholders of record as of the close of business on September 26, 2023. Our ability to pay dividends in the future will be subject to, among other things, general business conditions within the data storage industry, our financial results, the impact of paying dividends on our credit ratings and legal and contractual restrictions on the payment of dividends by our subsidiaries to us or by us to our ordinary shareholders, including restrictions imposed by covenants on our debt instruments.
Share repurchases
From time to time, at our discretion, we may repurchase any of our outstanding ordinary shares through private, open market, or broker assisted purchases, tender offers, or other means, including through the use of derivative transactions. During fiscal year 2023, we repurchased approximately 6 million of our ordinary shares including shares withheld for statutory tax withholdings related to vesting of employee equity awards. See “Item 5. Market for Registrant’s Common Equity, Related Stockholder Matters and Issuer Purchases of Equity Securities-Repurchases of Our Equity Securities.” As of June 30, 2023, $1.9 billion remained available for repurchase under our existing repurchase authorization limit. We may limit or terminate the repurchase program at any time. All repurchases are effected as redemptions in accordance with our Constitution.
We require substantial amounts of cash to fund any increased working capital requirements, future capital expenditures, scheduled payments of principal and interest on our indebtedness and payments of dividends. We will continue to evaluate and manage the retirement and replacement of existing debt and associated obligations, including evaluating the issuance of new debt securities, exchanging existing debt securities for other debt securities and retiring debt pursuant to privately negotiated transactions, open market purchases, tender offers or other means or otherwise. In addition, we may selectively pursue strategic alliances, acquisitions, joint ventures and investments, which may require additional capital.
Critical Accounting Policies and Estimates
The Company’s accounting policies are more fully described in “Item 8. Financial Statements and Supplementary Data—Note 1. Basis of Presentation and Summary of Significant Accounting Policies”. The methods, estimates and judgments we use in applying our most critical accounting policies have a significant impact on the results we report in our consolidated financial statements. Critical accounting estimates are those estimates that involve a significant level of estimation uncertainty and have had or are reasonably likely to have a material impact on our financial condition or results of operations. Based on this definition, our most critical accounting policies include: Revenue - Sales Program Accruals, Warranty and Income Taxes. Below, we discuss these policies further, as well as the estimates and judgments involved. We also have other accounting policies and accounting estimates relating to uncollectible customer accounts, valuation of inventories, assessing goodwill and other long-lived assets for impairment, valuation of share-based payments and restructuring. We believe that these other accounting policies and accounting estimates either do not generally require us to make estimates and judgments that are as difficult or as subjective, or it is less likely that they would have a material impact on our reported results of operations for a given period.
Revenue - Sales Program Accruals. We record estimated variable consideration at the time of revenue recognition as a reduction to revenue. Variable consideration generally consists of sales incentive programs, such as price protection and volume incentives aimed at increasing customer demand. For OEM sales, rebates are typically established by estimating the most likely amount of consideration expected to be received based on an OEM customer's volume of purchases from us or other agreed upon rebate programs. For the distribution and retail channel, these sales incentive programs typically involve estimating the most likely amount of rebates related to a customer's level of sales, order size, advertising or point of sale activity as well as the expected value of price protection adjustments based on historical analysis and forecasted pricing environment. Total sales programs were 17% and 14% of gross revenue in fiscal years 2023 and 2022, respectively. Adjustments to revenues due to under or over accruals for sales programs related to revenues reported in prior quarterly periods were approximately 1% and less than 1% of gross revenue in fiscal years 2023 and 2022, respectively.
Warranty. We estimate probable product warranty costs at the time revenue is recognized. Our warranty provision considers estimated product failure rates, trends (including the timing of product returns during the warranty periods), and estimated repair or replacement costs related to product quality issues, if any. Unforeseen component failures or exceptional component performance can result in changes to warranty costs. We also exercise judgment in estimating our ability to sell refurbished products based on historical experience. Our judgment is subject to a greater degree of subjectivity with respect to newly introduced products because of limited experience with those products upon which to base our warranty estimates. If actual warranty costs differ substantially from our estimates, revisions to the estimated warranty liability would be required, which could have a material adverse effect on our results of operations.
Income Taxes. We make certain estimates and judgments in determining income tax expense for financial statement purposes. These estimates and judgments occur in the calculation of tax credits, recognition of income and deductions and calculation of specific tax assets and liabilities, which arise from differences in the timing of recognition of revenue and expense for income tax and financial statement purposes, as well as tax liabilities associated with uncertain tax positions.
The deferred tax assets we record each period depend primarily on our ability to generate future taxable income in the United States and certain non-U.S. jurisdictions. Each period, we evaluate the need for a valuation allowance for our deferred tax assets and, if necessary, adjust the valuation allowance so that net deferred tax assets are recorded only to the extent we conclude it is more likely than not that these deferred tax assets will be realized.
In evaluating our ability to recover our deferred tax assets, in full or in part, we consider all available positive and negative evidence, including our past operating results, and our forecast of future earnings, future taxable income and prudent and feasible tax planning strategies. The assumptions utilized in determining future taxable income require significant judgment and are consistent with the plans and estimates we are using to manage the underlying businesses. Actual operating results in future years could differ from our current assumptions, judgments, and estimates. If our outlook for future taxable income changes significantly, our assessment of the need for, and the amount of, a valuation allowance may also change resulting in an additional tax provision or benefit.
Recent Accounting Pronouncements
See “Item 8. Financial Statements and Supplementary Data—Note 1. Basis of Presentation and Summary of Significant Accounting Policies” for information regarding the effect of new accounting pronouncements on our financial statements.
Item 7A. QUANTITATIVE AND QUALITATIVE DISCLOSURES ABOUT MARKET RISK
We have exposure to market risks due to the volatility of interest rates, foreign currency exchange rates, credit rating changes and equity and bond markets. A portion of these risks may be hedged, but fluctuations could impact our results of operations, financial position and cash flows.
Interest Rate Risk. Our exposure to market risk for changes in interest rates relates primarily to our cash investment portfolio. As of June 30, 2023, we had no available-for-sale debt securities that had been in a continuous unrealized loss position for a period greater than 12 months. We had no impairments related to credit losses for available-for-sale debt securities as of June 30, 2023.
We have fixed rate and variable rate debt obligations. We enter into debt obligations for general corporate purposes including capital expenditures and working capital needs. Our Term Loans bear interest at a variable rate equal to Secured Overnight Financing Rate (“SOFR”) plus a variable margin.
We have entered into certain interest rate swap agreements to convert the variable interest rate on the Term Loans to fixed interest rates. The objective of the interest rate swap agreements is to eliminate the variability of interest payment cash flows associated with the variable interest rate under the Term Loans. We designated the interest rate swaps as cash flow hedges. As of June 30, 2023, the aggregate notional amount of the Company’s interest-rate swap contracts was $1.3 billion, of which $429 million will mature through September 2025 and $859 million will mature through July 2027.
The table below presents principal amounts and related fixed or weighted-average interest rates by year of maturity for our investment portfolio and debt obligations as of June 30, 2023.
| (Dollars in millions, except percentages) | Fiscal Years Ended | Fair Value at June 30, 2023 | ||||||||||||||||||||||||||||||||||||||||||||||||
| 2024 | 2025 | 2026 | 2027 | 2028 | Thereafter | Total | ||||||||||||||||||||||||||||||||||||||||||||
| Assets | ||||||||||||||||||||||||||||||||||||||||||||||||||
| Money market funds, time deposits and certificates of deposit | ||||||||||||||||||||||||||||||||||||||||||||||||||
| Floating rate | $ | 74 | $ | — | $ | — | $ | — | $ | — | $ | — | $ | 74 | $ | 74 | ||||||||||||||||||||||||||||||||||
| Average interest rate | 5.12 | % | — | % | — | % | — | % | — | % | — | % | 5.12 | % | ||||||||||||||||||||||||||||||||||||
| Other debt securities | ||||||||||||||||||||||||||||||||||||||||||||||||||
| Fixed rate | $ | — | $ | — | $ | 15 | $ | — | $ | — | $ | 1 | $ | 16 | $ | 16 | ||||||||||||||||||||||||||||||||||
| Debt | ||||||||||||||||||||||||||||||||||||||||||||||||||
| Fixed rate | $ | — | $ | 479 | $ | — | $ | 505 | $ | — | $ | 3,245 | $ | 4,229 | $ | 4,112 | ||||||||||||||||||||||||||||||||||
| Average interest rate | — | % | 4.75 | % | — | % | 4.88 | % | — | % | 6.88 | % | 6.40 | % | ||||||||||||||||||||||||||||||||||||
| Variable rate | $ | 63 | $ | 103 | $ | 497 | $ | 107 | $ | 519 | $ | — | $ | 1,289 | $ | 1,259 | ||||||||||||||||||||||||||||||||||
| Average interest rate | 5.60 | % | 5.61 | % | 5.84 | % | 5.52 | % | 5.60 | % | — | % | 5.69 | % |
Foreign Currency Exchange Risk. From time to time, we may enter into foreign currency forward exchange contracts to manage exposure related to certain foreign currency commitments and anticipated foreign currency denominated expenditures. Our policy prohibits us from entering into derivative financial instruments for speculative or trading purposes.
We hedge portions of our foreign currency denominated balance sheet positions with foreign currency forward exchange contracts to reduce the risk that our earnings will be adversely affected by changes in currency exchange rates. The change in fair value of these contracts is recognized in earnings in the same period as the gains and losses from the remeasurement of the assets and liabilities. All foreign currency forward exchange contracts mature within 12 months.
We recognized a net gain of $16 million and a net loss of $29 million in Cost of revenue and Interest expense, respectively, related to the loss of hedge designations on discontinued cash flow hedges during fiscal year 2023. We recognized a net loss of $11 million and $10 million in Cost of revenue and Interest expense, respectively, related to the loss of hedge designations on discontinued cash flow hedges during the fiscal year 2022.
The table below provides information as of June 30, 2023 about our foreign currency forward exchange contracts. The table is provided in dollar equivalent amounts and presents the notional amounts (at the contract exchange rates) and the weighted-average contractual foreign currency exchange rates.
| (Dollars in millions, except average contract rate) | Notional Amount | Average Contract Rate | Estimated Fair Value**(1)** | |||||||||||||||||
| Foreign currency forward exchange contracts: | ||||||||||||||||||||
| Singapore Dollar | $ | 356 | $ | 1.34 | $ | (2) | ||||||||||||||
| Thai Baht | 145 | $ | 33.96 | (5) | ||||||||||||||||
| Chinese Renminbi | 76 | $ | 6.83 | (3) | ||||||||||||||||
| British Pound Sterling | 65 | $ | 0.81 | 2 | ||||||||||||||||
| Total | $ | 642 | $ | (8) |
(1) Equivalent to the unrealized net gain (loss) on existing contracts.
Other Market Risks. We have exposure to counterparty credit downgrades in the form of credit risk related to our foreign currency forward exchange contracts and our fixed income portfolio. We monitor and limit our credit exposure for our foreign currency forward exchange contracts by performing ongoing credit evaluations. We also manage the notional amount of contracts entered into with any one counterparty, and we maintain limits on maximum tenor of contracts based on the credit rating of the financial institution. Additionally, the investment portfolio is diversified and structured to minimize credit risk.
Changes in our corporate issuer credit ratings have minimal impact on our near-term financial results, but downgrades may negatively impact our future ability to raise capital, our ability to execute transactions with various counterparties and may increase the cost of such capital.
We are subject to equity market risks due to changes in the fair value of the notional investments selected by our employees as part of our non-qualified deferred compensation plan—the Seagate Deferred Compensation Plan (the “SDCP”).
In fiscal year 2014, we entered into a Total Return Swap (“TRS”) in order to manage the equity market risks associated with the SDCP liabilities. We pay a floating rate, based on SOFR plus an interest rate spread, on the notional amount of the TRS. The TRS is designed to substantially offset changes in the SDCP liabilities due to changes in the value of the investment options made by employees. See “Item 8. Financial Statements and Supplementary Data—Note 8. Derivative Financial Instruments” of this Annual Report.
Item 8. FINANCIAL STATEMENTS AND SUPPLEMENTARY DATA
SEAGATE TECHNOLOGY HOLDINGS PLC
CONSOLIDATED BALANCE SHEETS
(In millions, except share and per share data)
| Fiscal Years Ended | |||||||||||
| June 30, 2023 | July 1, 2022 | ||||||||||
| ASSETS | |||||||||||
| Current assets: | |||||||||||
| Cash and cash equivalents | $ | 786 | $ | 615 | |||||||
| Accounts receivable, net | 621 | 1,532 | |||||||||
| Inventories | 1,140 | 1,565 | |||||||||
| Other current assets | 358 | 321 | |||||||||
| Total current assets | 2,905 | 4,033 | |||||||||
| Property, equipment and leasehold improvements, net | 1,706 | 2,239 | |||||||||
| Goodwill | 1,237 | 1,237 | |||||||||
| Other intangible assets, net | — | 9 | |||||||||
| Deferred income taxes | 1,117 | 1,132 | |||||||||
| Other assets, net | 591 | 294 | |||||||||
| Total Assets | $ | 7,556 | $ | 8,944 | |||||||
| LIABILITIES AND (DEFICIT) EQUITY | |||||||||||
| Current liabilities: | |||||||||||
| Accounts payable | $ | 1,603 | $ | 2,058 | |||||||
| Accrued employee compensation | 100 | 252 | |||||||||
| Accrued warranty | 78 | 65 | |||||||||
| Current portion of long-term debt | 63 | 584 | |||||||||
| Accrued expenses | 748 | 596 | |||||||||
| Total current liabilities | 2,592 | 3,555 | |||||||||
| Long-term accrued warranty | 90 | 83 | |||||||||
| Other non-current liabilities | 685 | 135 | |||||||||
| Long-term debt, less current portion | 5,388 | 5,062 | |||||||||
| Total Liabilities | 8,755 | 8,835 | |||||||||
| Commitments and contingencies (See Notes 12, 14 and 15) | |||||||||||
| Shareholders’ (Deficit) Equity: | |||||||||||
| Preferred shares, $0.00001 par value per share—100,000,000 authorized; no shares issued or outstanding | — | — | |||||||||
| Ordinary shares, $0.00001 par value per share—1,250,000,000 authorized; 207,389,381 issued an |
Showing the first 8K of 202K characters. Open the full section
Item 9. CHANGES IN AND DISAGREEMENTS WITH ACCOUNTANTS ON ACCOUNTING AND FINANCIAL DISCLOSURE
Not applicable.
Item 9A. CONTROLS AND PROCEDURES
Conclusions Regarding Disclosure Controls and Procedures
Our chief executive officer and our chief financial officer have concluded, based on the evaluation of the effectiveness of our disclosure controls and procedures (as defined in Rules 13a-15(e) and 15d-15(e) of the Securities Exchange Act of 1934, as amended) by our management, with the participation of our chief executive officer and our chief financial officer, that our disclosure controls and procedures were effective as of June 30, 2023.
Management’s Report on Internal Control over Financial Reporting
Our management is responsible for establishing and maintaining adequate internal control over financial reporting (as defined in Rules 13a-15(f) and 15d-15(f) under the Securities Exchange Act of 1934, as amended). Under the supervision and with the participation of our management, including our chief executive officer and chief financial officer, we conducted an evaluation of the effectiveness of our internal control over financial reporting based on the framework in Internal Control-Integrated Framework (2013) issued by the Committee of Sponsoring Organizations of the Treadway Commission, or COSO.
Based on our evaluation under the 2013 framework in Internal Control—Integrated Framework, our management has concluded that our internal control over financial reporting was effective as of June 30, 2023. The effectiveness of our internal control over financial reporting as of June 30, 2023 has been audited by Ernst & Young LLP, the independent registered public accounting firm that audited our financial statements included in this Annual Report on Form 10-K, as stated in their report that is included herein.
Changes in Internal Control over Financial Reporting
There were no changes in our internal control over financial reporting during our fourth fiscal quarter that have materially affected, or were reasonably likely to materially affect, our internal control over financial reporting.
Limitations on the Effectiveness of Controls
Our management, including our chief executive officer and chief financial officer, does not expect that our disclosure controls and procedures or our internal controls will prevent all errors and all fraud. A control system, no matter how well conceived and operated, can provide only reasonable, not absolute, assurance that the objectives of the control system are met. Further, the design of a control system must reflect the fact that there are resource constraints, and the benefits of controls must be considered relative to their costs. Our disclosure controls and procedures and our internal controls have been designed to provide reasonable assurance of achieving their objectives. Because of the inherent limitations in all control systems, no evaluation of controls can provide absolute assurance that all control issues and instances of fraud, if any, within Seagate have been detected. An evaluation was performed under the supervision and with the participation of our management, including our chief executive officer and chief financial officer, of the effectiveness of the design and operation of our disclosure controls and procedures as of June 30, 2023. Based on that evaluation, our management, including our chief executive officer and chief financial officer, concluded that our disclosure controls and procedures were effective at the reasonable assurance level.
Item 9B. OTHER INFORMATION
Trading Plans or Rule 10b5-1 Trading Plans
The table below summarizes the material terms of trading arrangements adopted by any of our executive officers or directors during the June 2023 quarter. All of the trading arrangements listed below are intended to satisfy the affirmative defense of Rule 10b5-1(c).
| Name | Title | Date of Adoption | End Date¹ | Aggregate number of ordinary shares to be sold pursuant to the trading agreement | ||||||||||
| Dr. William D. Mosley | Chief Executive Officer | 6/1/2023 | 9/11/2024 | 452,048 | ||||||||||
| Gianluca Romano | EVP and Chief Financial Officer | 5/26/2023 | 12/15/2023 | 40,177 | ||||||||||
| Ban Seng Teh | EVP, Chief Commercial Officer | 6/7/2023 | 6/7/2024 | 20,000 | ||||||||||
| Katherine E. Schuelke | SVP, Chief Legal Officer and Corporate Secretary | 5/31/2023 | 9/29/2023 | Net shares issued upon vesting of an aggregate 18,937 restricted stock units and performance stock units plus 262 ordinary shares. |
¹ Each plan will expire on the earlier of the end date and the completion of all transactions under the trading arrangement.
Item 9C. DISCLOSURE REGARDING FOREIGN JURISDICTIONS THAT PREVENT INSPECTIONS.
Not applicable.
PART III
Item 10. DIRECTORS, EXECUTIVE OFFICERS AND CORPORATE GOVERNANCE
The information regarding our directors and compliance with Section 16(a) of the Securities Exchange Act of 1934, as amended, set forth in the sections entitled “Proposal 1—Election of Directors,” “Corporate Governance” and “Section 16(a) Beneficial Ownership Reporting Compliance” in our Proxy Statement to be filed with the SEC within 120 days of the end of our fiscal year pursuant to General Instruction G(3) to Form 10-K are hereby incorporated by reference in this section. In addition, the information set forth in Part I of this report under “Item 1. Business—Information About Our Executive Officers” is also incorporated by reference in this section.
We have adopted a Code of Ethics that applies to the Chief Executive Officer, the Chief Financial Officer, and the principal accounting officer or controller or persons performing similar functions. This Code of Ethics is available on our website. The Internet address for our website is www.seagate.com, and the Code of Ethics may be found from our main web page by clicking first on “Investors,” next on “Governance” and then on “Code of Ethics.”
We intend to satisfy any disclosure requirements under Item 5.05 of Form 8-K regarding an amendment to, or waiver from, a provision of this Code of Ethics by posting such information on our website in the location specified above for the Code of Ethics.
Item 11. EXECUTIVE COMPENSATION
The information regarding executive compensation required by this Item 11 set forth in the section entitled “Compensation of Named Executive Officers” in our Proxy Statement to be filed with the SEC within 120 days of the end of our fiscal year pursuant to General Instruction G(3) to Form 10-K is hereby incorporated by reference in this section.
Item 12. SECURITY OWNERSHIP OF CERTAIN BENEFICIAL OWNERS AND MANAGEMENT AND RELATED STOCKHOLDER MATTERS
The information regarding security ownership beneficial owners and management and related shareholders and equity compensation plans required by this Item 12 set forth in the sections entitled “Security Ownership of Certain Beneficial Owners and Management” and “Equity Compensation Plan Information,” respectively, in our Proxy Statement to be filed with the SEC within 120 days of the end of our fiscal year pursuant to General Instruction G(3) to Form 10-K is hereby incorporated by reference in this section.
Item 13. CERTAIN RELATIONSHIPS AND RELATED TRANSACTIONS, AND DIRECTOR INDEPENDENCE
The information regarding certain relationships, related transactions and director independence required by this Item 13 set forth in the section entitled “Certain Relationships and Related Party and Other Transactions” in our Proxy Statement to be filed with the SEC within 120 days of the end of our fiscal year pursuant to General Instruction G(3) to Form 10-K is hereby incorporated by reference in this section.
Item 14. PRINCIPAL ACCOUNTANT FEES AND SERVICES
The information regarding principal accountant fees and services required by this Item 14 set forth in the section entitled “Fees to Independent Auditors” in our Proxy Statement to be filed with the SEC within 120 days of the end of our fiscal year pursuant to General Instruction G(3) to Form 10-K is hereby incorporated by reference in this section.
PART IV
Item 15. EXHIBITS AND FINANCIAL STATEMENT SCHEDULES
(a)The following documents are filed as part of this Report:
1. Financial Statements. The following Consolidated Financial Statements of Seagate Technology Holdings plc and Report of Independent Registered Public Accounting Firm are included in Item 8:
2. Financial Statement Schedules. All schedules are omitted because they are not applicable or the required information is included in the Financial Statements or in the notes thereto.
(b)Exhibits. The following exhibits, as required by Item 601 of Regulation S-K are attached or incorporated by reference as stated below.
EXHIBIT INDEX
| | | | | | | | | | | | | | | | | | | | | | | | | | | | | | | | | | | | | | | | | --- | --- | --- | --- | --- | --- | --- | --- | --- | --- | --- | --- | --- | --- | --- | --- | --- | --- | --- | --- | --- | --- | --- | --- | --- |
Showing the first 8K of 65K characters. Open the full section