 filings.tools
Item 5. MARKET FOR THE REGISTRANT’S COMMON EQUITY, RELATED STOCKHOLDER MATTERS AND ISSUER PURCHASES OF EQUITY SECURITIES
6K characters. Original on sec.gov · Markdown
Item 5. MARKET FOR THE REGISTRANT’S COMMON EQUITY, RELATED STOCKHOLDER MATTERS AND ISSUER PURCHASES OF EQUITY SECURITIES
The Company’s common stock is listed and traded on the New York Stock Exchange, Inc. (“NYSE”) under the abbreviated ticker symbol “SWK”, and is a component of the Standard & Poor’s (“S&P”) 500 Composite Stock Price Index. The Company increased its annual dividend per common share by $0.20 in 2022 compared to 2021 and intends to continue to pay quarterly dividends in 2023. In July 2022, the Company raised the quarterly dividend per common share, its 55th consecutive increase, which extended its record for the longest, consecutive quarterly and annual dividend payments among industrial companies. As of February 1, 2023, there were 8,519 holders of record of the Company’s common stock. Information required by Item 201(d) of Regulation S-K concerning securities authorized for issuance under equity compensation plans can be found under Item 12 of this Annual Report on Form 10-K.
Issuer Purchases of Equity Securities
The following table provides information about the Company’s purchases of equity securities that are registered by the Company pursuant to Section 12 of the Securities Exchange Act of 1934 for the three months ended December 31, 2022:
| 2022 | Total Number Of Common Shares Purchased (a) | Average Price Paid Per Common Share | Total Number Of Common Shares Purchased As Part Of A Publicly Announced Plan or Program | (In Millions) Maximum Number Of Common Shares That May Yet Be Purchased Under The Program (b) | ||||||||||||||||||||||
| October 2 - November 5 | 2,824 | $ | 76.43 | — | 20 | |||||||||||||||||||||
| November 6 - December 3 | 15,211 | 81.85 | — | 20 | ||||||||||||||||||||||
| December 4 - December 31 | 36,412 | 79.20 | — | 20 | ||||||||||||||||||||||
| Total | 54,447 | $ | 79.79 | — | 20 |
(a)Shares of common stock in this column were deemed surrendered to the Company by participants in various benefit plans of the Company to satisfy the participants’ taxes related to vesting or delivery of time-vesting restricted share units under those plans.
(b)On April 21, 2022, the Board approved a share repurchase program of up to 20 million shares of the Company’s common stock (the “April 2022 Program”). The April 2022 Program does not have an expiration date. The Company may repurchase shares under the April 2022 Program through open market purchases, privately negotiated transactions or share repurchase programs, including one or more accelerated share repurchase programs (under which an initial payment for the entire repurchase amount may be made at the inception of the program). Such repurchases may be funded from cash on hand, short-term borrowings or other sources of cash at the Company’s discretion, and the Company is under no obligation to repurchase any shares pursuant to the repurchase program. The currently authorized shares available for repurchase under the April 2022 Program do not include approximately 3.6 million shares reserved and authorized for purchase under the Company’s approved repurchase program in place prior to the April 2022 Program relating to a forward share purchase contract entered into in March 2015.
Stock Performance Graph
The following line graph compares the yearly percentage change in the Company’s cumulative total shareholder return for the last five years to that of the S&P 500 Index, S&P 500 Capital Goods Index and S&P 500 Industrials Index. Following the recent portfolio transformation, the Company has elected to replace the S&P 500 Industrials Index with the S&P 500 Capital Goods Index which it believes is a more appropriate comparison. The S&P 500 Capital Goods Index represents a more focused group of 45 companies across major industrial manufacturing categories that carry similar operational characteristics to the Company.
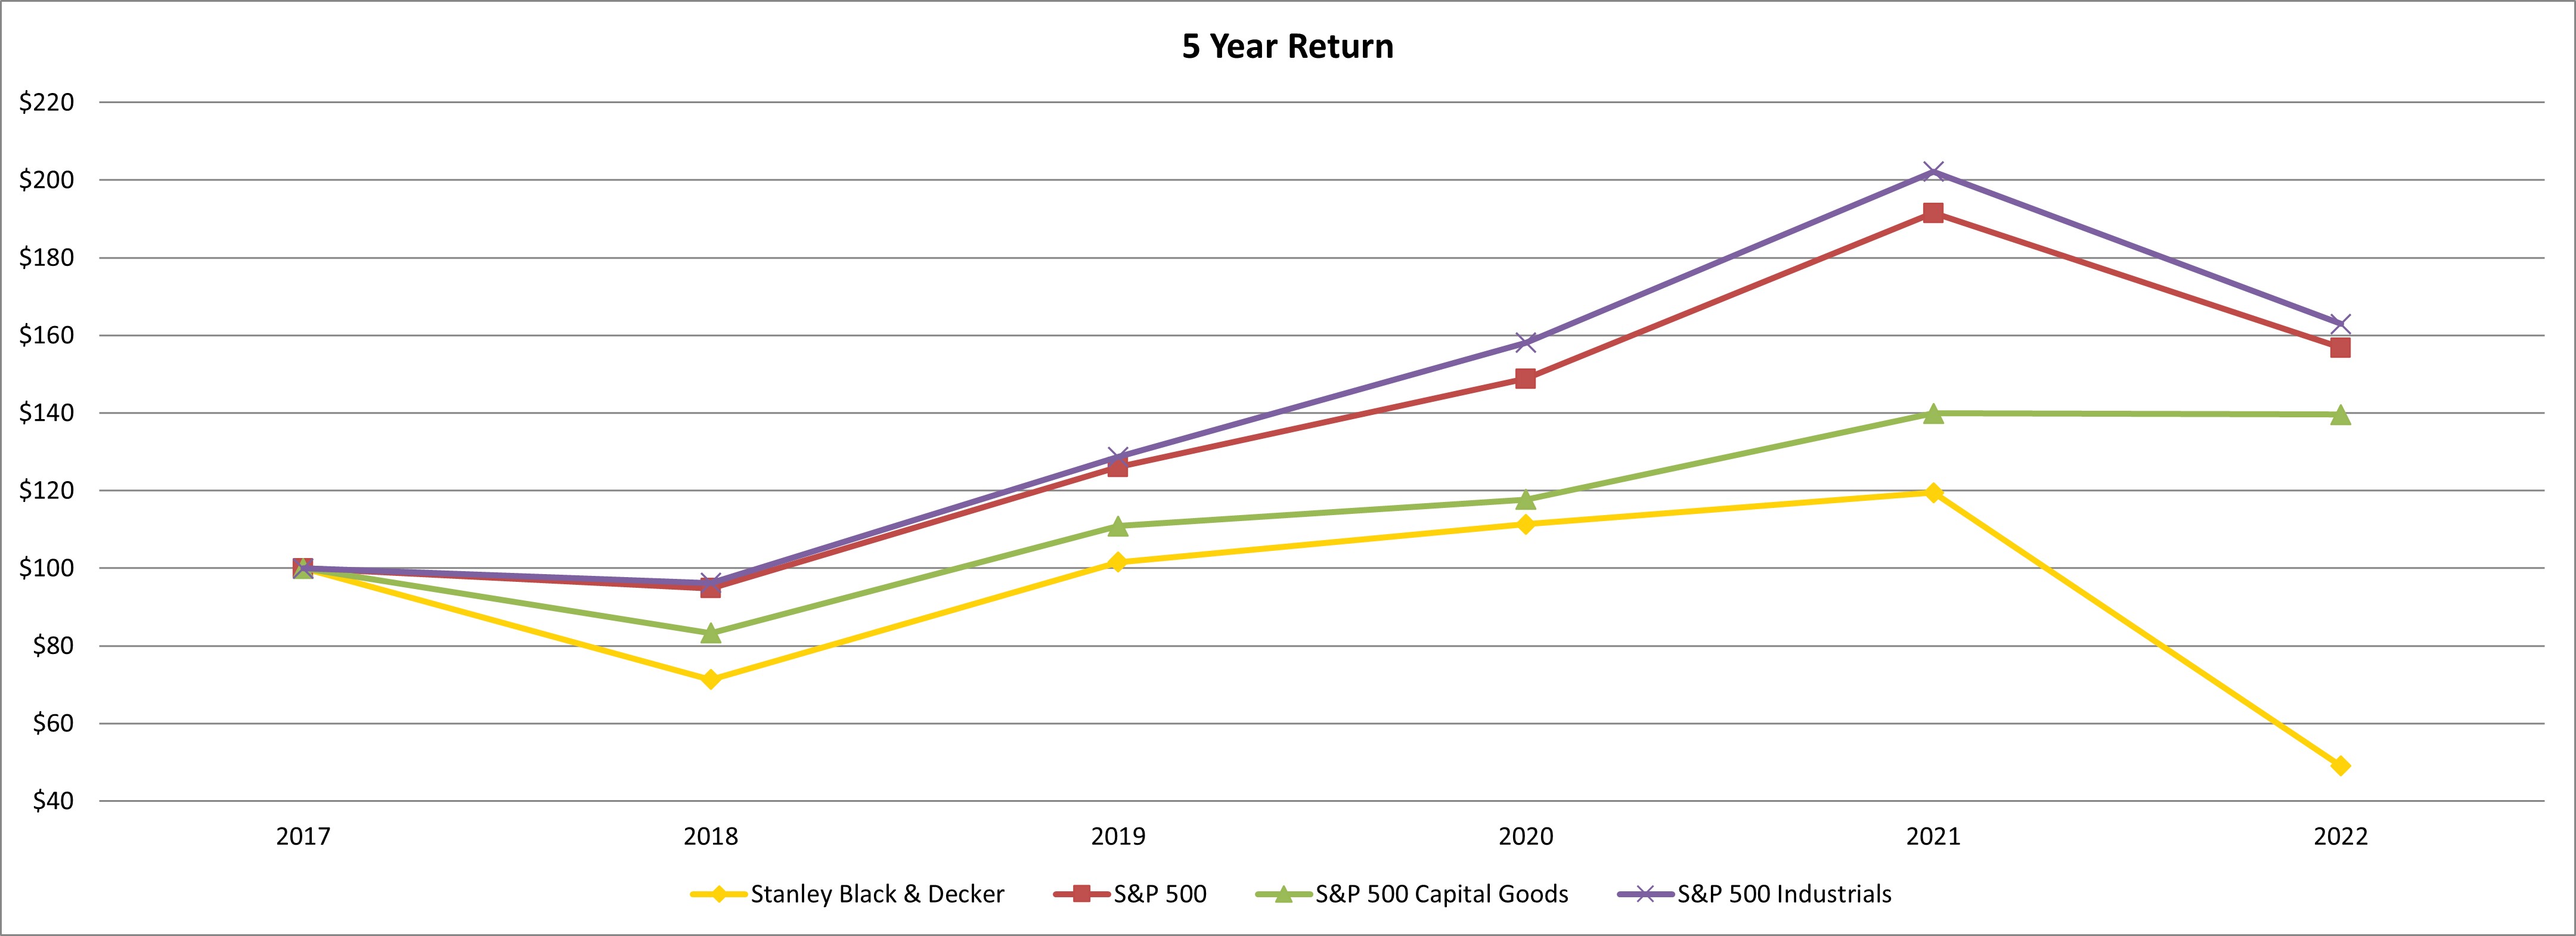
| THE POINTS IN THE ABOVE TABLE ARE AS FOLLOWS: | 2017 | 2018 | 2019 | 2020 | 2021 | 2022 | |||||||||||||||||||||||||||||
| Stanley Black & Decker | $ | 100.00 | $ | 71.32 | $ | 101.54 | $ | 111.32 | $ | 119.46 | $ | 49.06 | |||||||||||||||||||||||
| S&P 500 Index | $ | 100.00 | $ | 94.79 | $ | 126.03 | $ | 148.81 | $ | 191.48 | $ | 156.77 | |||||||||||||||||||||||
| S&P 500 Capital Goods Index | $ | 100.00 | $ | 83.26 | $ | 110.83 | $ | 117.67 | $ | 139.93 | $ | 139.55 | |||||||||||||||||||||||
| S&P 500 Industrials Index | $ | 100.00 | $ | 96.19 | $ | 128.70 | $ | 158.11 | $ | 202.22 | $ | 162.96 |
The comparison assumes $100 invested at the closing price on December 30, 2017 in the Company’s common stock, S&P 500 Index, S&P 500 Capital Goods Index, and S&P 500 Industrials Index. Total return assumes reinvestment of dividends.
Previous: Item 4. MINE SAFETY DISCLOSURES · Next: Item 6. REMOVED AND RESERVED