 filings.tools
Sysco 10-K 2023-07-01
Filed 2023-08-25. 23 sections, 573K characters. Original on sec.gov · Markdown · JSON
Cover and table of contents
UNITED STATES SECURITIES AND EXCHANGE COMMISSION
Washington, D.C. 20549
FORM 10-K
| (Mark One) | |||||
| ☑ | ANNUAL REPORT PURSUANT TO SECTION 13 OR 15(d) OF THE SECURITIES EXCHANGE ACT OF 1934 |
For the fiscal year ended July 1, 2023
OR
| ☐ | TRANSITION REPORT PURSUANT TO SECTION 13 OR 15(d) OF THE SECURITIES EXCHANGE ACT OF 1934 |
Commission file number 1-6544
Sysco Corporation
(Exact name of registrant as specified in its charter)
| Delaware (State or other jurisdiction of incorporation or organization) | 74-1648137 (I.R.S. Employer Identification No.) | |||||||
| 1390 Enclave Parkway Houston, Texas (Address of principal executive offices) | 77077-2099 (Zip Code) |
Registrant’s Telephone Number, Including Area Code:
(281) 584-1390
Securities Registered Pursuant to Section 12(b) of the Act:
| Title of each class | Trading symbols | Name of each exchange on which registered | ||||||||||||
| Common Stock, $1.00 Par Value | SYY | New York Stock Exchange |
Securities Registered Pursuant to Section 12(g) of the Act: None
Indicate by checkmark if the registrant is a well-known seasoned issuer, as defined in Rule 405 of the Securities Act. Yes ☑ No ☐
Indicate by checkmark if the registrant is not required to file reports pursuant to Section 13 or Section 15(d) of the Act. Yes ☐ No ☑
Indicate by check mark whether the registrant (1) has filed all reports required to be filed by Section 13 or 15(d) of the Securities Exchange Act of 1934 during the preceding 12 months (or for such shorter period that the registrant was required to file such reports), and (2) has been subject to such filing requirements for the past 90 days. Yes ☑ No ☐
Indicate by check mark whether the registrant has submitted electronically every Interactive Data File required to be submitted pursuant to Rule 405 of Regulation S-T during the preceding 12 months (or for such shorter period that the registrant was required to submit such files). Yes ☑ No ☐
Indicate by check mark whether the registrant is a large accelerated filer, an accelerated filer, a non-accelerated filer, a smaller reporting company or an emerging growth company. See definition of “large accelerated filer,” “accelerated filer,” “smaller reporting company” and “emerging growth company” in Rule 12b-2 of the Exchange Act.
| Large Accelerated Filer ☑ | Accelerated Filer ☐ | |||||||
| Non-accelerated Filer ☐ | Smaller Reporting Company ☐ | |||||||
| Emerging Growth Company ☐ |
If an emerging growth company, indicate by check mark if the registrant has elected not to use the extended transition period for complying with any new or revised financial accounting standards provided pursuant to Section 13(a) of the Exchange Act ☐
Indicate by check mark whether the registrant has filed a report on and attestation to its management’s assessment of the effectiveness of its internal control over financial reporting under Section 404(b) of the Sarbanes-Oxley Act (15 U.S.C. 7262(b)) by the registered public accounting firm that prepared or issued its audit report. ☑
If securities are registered pursuant to Section 12(b) of the Act, indicate by check mark whether the financial statements of the registrant included in the filing reflect the correction of an error to previously issued financial statements. ☐
Indicate by check mark whether any of those error corrections are restatements that required a recovery analysis of incentive-based compensation received by any of the registrant’s executive officers during the relevant recovery period pursuant to §240.10D-1(b). ☐
Indicate by check mark whether the registrant is a shell company (as defined in Rule 12b-2 of the Exchange Act). Yes ☐ No ☑
The aggregate market value of the voting stock of the registrant held by stockholders who were not affiliates (as defined by regulations of the Securities and Exchange Commission) of the registrant was approximately $38,720,179,124 as of January 1, 2023 (based on the closing sales price on the New York Stock Exchange Composite Tape on December 30, 2022, as reported by The Wall Street Journal (Southwest Edition)). As of August 8, 2023, the registrant had issued and outstanding an aggregate of 504,925,847 shares of its common stock.
DOCUMENTS INCORPORATED BY REFERENCE:
Portions of the company’s 2023 Proxy Statement to be filed with the Securities and Exchange Commission no later than 120 days after the end of the fiscal year covered by this Form 10-K are incorporated by reference into Part III.
TABLE OF CONTENTS
PART I
Item 1. Business
Unless this Form 10-K indicates otherwise or the context otherwise requires, the terms “we,” “our,” “us,” “Sysco,” or the “company” as used in this Form 10-K refer to Sysco Corporation together with its consolidated subsidiaries and divisions.
Overview
Sysco Corporation, acting through its subsidiaries and divisions, is the largest global distributor of food and related products primarily to the foodservice or food-away-from-home industry. Our purpose is “Connecting the World to Share Food and Care for One Another.” We provided products and related services to approximately 725,000 customer locations, including restaurants, healthcare and educational facilities, lodging establishments and other foodservice customers during fiscal 2023.
Founded in 1969, Sysco commenced operations as a public company in March 1970 when the stockholders of nine companies exchanged their stock for Sysco common stock. Since our formation, we have grown from $115 million to our all-time high of $76.3 billion in annual sales in fiscal 2023, both through internal expansion of existing operations and acquisitions.
Sysco’s fiscal year ends on the Saturday nearest to June 30th. This resulted in a 52-week year ended July 1, 2023 for fiscal 2023, a 52-week year ended July 2, 2022 for fiscal 2022 and a 53-week year ended July 3, 2021 for fiscal 2021. We will have a 52-week year ending June 29, 2024 for fiscal 2024.
Sysco Corporation is organized under the laws of Delaware. The address and telephone number of our executive offices are 1390 Enclave Parkway, Houston, Texas 77077-2099, (281) 584-1390. This annual report on Form 10-K, as well as all other reports filed or furnished by Sysco pursuant to Section 13(a) or 15(d) of the Securities Exchange Act of 1934, as amended (Exchange Act), are available free of charge on Sysco’s website at www.sysco.com as soon as reasonably practicable after they are electronically filed with or furnished to the Securities and Exchange Commission (SEC).
Reporting Segments
Sysco distributes food and related products to restaurants, healthcare and educational facilities, lodging establishments and other foodservice customers. Our primary operations are in North America and Europe. Under the accounting provisions related to disclosures about segments of an enterprise, we have combined certain operations into three reportable segments. “Other” financial information is attributable to our other operations that do not meet the quantitative disclosure thresholds.
-
U.S. Foodservice Operations – primarily includes (a) our U.S. Broadline operations, which distribute a full line of food products, including custom-cut meat, seafood, produce, specialty Italian, specialty imports and a wide variety of non-food products and (b) our U.S. Specialty operations, which include our FreshPoint fresh produce distribution business, our Specialty Meats and Seafood Group specialty protein operations, our growing Italian Specialty platform anchored by Greco & Sons, our Asian specialty distribution company and a number of other small specialty businesses that are not material to the operations of Sysco;
-
International Foodservice Operations – includes operations outside of the United States (U.S.), which distribute a full line of food products and a wide variety of non-food products. The Americas primarily consists of operations in Canada, Bahamas, Mexico, Costa Rica and Panama, as well as our export operations that distribute to international customers. Our European operations primarily consist of operations in the United Kingdom (U.K.), France, Ireland and Sweden;
-
SYGMA – our U.S. customized distribution operations serving quick-service chain restaurant customer locations; and
-
Other – primarily our hotel supply operations, Guest Worldwide.
Foodservice operating sites distribute a full line of food products and a wide variety of non-food products to both independent and chain restaurant customers, hospitals, schools, hotels, industrial caterers and other venues where foodservice products are served. SYGMA operating sites distribute a full line of food products and a wide variety of non-food products to certain chain restaurant customer locations. Selected financial data for each of our reportable segments, as well as financial information concerning geographic areas, can be found in Note 21, “Business Segment Information,” in the Notes to Consolidated Financial Statements in Item 8.
Customers and Products
Sysco’s customers in the foodservice industry include restaurants, hospitals and skilled nursing facilities, schools and colleges, hotels and motels, industrial caterers and other similar venues where foodservice products are served.
The products we distribute include:
-
frozen foods, such as meats, seafood, fully prepared entrées, fruits, vegetables and desserts;
-
canned and dry foods;
-
fresh meats and seafood;
-
dairy products;
-
beverage products;
-
imported specialties; and
-
fresh produce.
We also supply a wide variety of non-food items, including:
-
paper products such as disposable napkins, plates and cups;
-
tableware such as glassware and silverware;
-
cookware such as pots, pans and utensils;
-
restaurant and kitchen equipment and supplies; and
-
cleaning supplies.
A comparison of the sales mix in the principal product categories during the last three years is presented below:
| Principal product categories | 2023 | 2022 | 2021 | ||||||||||||||
| Canned and dry products | 19 | % | 17 | % | 16 | % | |||||||||||
| Fresh and frozen meats | 18 | 19 | 19 | ||||||||||||||
| Frozen fruits, vegetables, bakery and other | 15 | 14 | 15 | ||||||||||||||
| Dairy products | 11 | 10 | 10 | ||||||||||||||
| Poultry | 10 | 11 | 11 | ||||||||||||||
| Fresh produce | 9 | 8 | 8 | ||||||||||||||
| Paper and disposables | 7 | 7 | 8 | ||||||||||||||
| Seafood | 4 | 5 | 5 | ||||||||||||||
| Beverage products | 3 | 3 | 3 | ||||||||||||||
| Other (1) | 4 | 6 | 5 | ||||||||||||||
| Totals | 100 | % | 100 | % | 100 | % |
| (1) | Other sales relate to non-food products, including textiles and amenities for our hotel supply business, equipment, other janitorial products, medical supplies and smallwares. |
Our distribution centers, which we refer to as operating sites, distribute branded merchandise, as well as products packaged under our private brands. Products packaged under our private brands have been manufactured for Sysco according to specifications that have been developed by our quality assurance team. In addition, our quality assurance team certifies the manufacturing and processing plants where these products are packaged, enforces our quality control standards and identifies supply sources that satisfy our requirements.
We believe that prompt and accurate delivery of orders, competitive pricing, customer service and the ability to provide a full array of products and services to assist customers in their foodservice operations are of primary importance in the marketing and distribution of foodservice products to our customers. Our operating sites offer daily delivery to certain customer locations and have the capability of delivering special orders on short notice. Through the sales and marketing representatives and support staff, we stay informed of the needs of our customers and acquaint them with new products and services. We also provide ancillary services relating to foodservice distribution, such as providing customers with product usage reports and other data, menu-planning advice, food safety training and assistance in inventory control. Additionally, we provide access to various third-party services designed to add value to our customers’ businesses.
No single customer accounted for 10% or more of Sysco’s total sales for the fiscal year ended July 1, 2023.
We estimate that our sales by type of customer during the past three fiscal years were as follows:
| Type of Customer | 2023 | 2022 | 2021 | ||||||||||||||
| Restaurants (1) | 62 | % | 63 | % | 66 | % | |||||||||||
| Education, government | 8 | 8 | 6 | ||||||||||||||
| Travel and leisure | 8 | 7 | 5 | ||||||||||||||
| Healthcare | 7 | 8 | 9 | ||||||||||||||
| Other (2) | 15 | 14 | 14 | ||||||||||||||
| Totals | 100 | % | 100 | % | 100 | % |
| (1) | Restaurants returned to a pre-pandemic percentage of total sales in fiscal year 2023. For comparability purposes, in both fiscal years 2020 and 2019, restaurants constituted 62% of total sales. | ||||
| (2) | Other includes cafeterias that are not stand-alone restaurants, bakeries, caterers, churches, civic and fraternal organizations, vending distributors, other distributors and international exports, as well as retail food sales and logistics services. None of these types of customers, as a group, exceeded 5% of total sales in any of the years for which information is presented. |
We estimate that sales to our customers in the food service management (FSM) sector, which include large customers that service cafeterias in institutions such as universities, hospitals, and sporting venues, accounted for 7% of sales in fiscal 2023, as compared to 6% of sales in fiscal 2022. These sales are reflected within the respective customer types listed in the table above, depending on the type of customer the FSM operator serves.
Sources of Supply
We purchase from thousands of suppliers, both domestic and international, none of which individually accounted for more than 10% of our purchases for fiscal 2023. These suppliers consist generally of large corporations selling brand name and private label merchandise, as well as independent regional brand and private label processors and packers. We also provide specialty and seasonal products from small to mid-sized producers to meet a growing demand for locally sourced products. Our locally sourced products, including produce, meats, cheese and other products, help differentiate our customers’ offerings, satisfy demands for new products, and support local communities. Merchandise is generally purchased through both centrally developed programs, domestically and internationally, and direct programs established by our various operating sites.
We administer a consolidated product procurement program designed to develop, obtain and ensure consistent quality food and non-food products. The program covers the purchasing and marketing of branded merchandise, as well as products from several national brand suppliers, encompassing substantially all product lines. Some of our products are purchased internationally within global procurement centers to build strategic relationships with international suppliers and to optimize our supply chain network. We also focus on increasing profitability by lowering operating costs and aggregate inventory levels. This reduces future facility expansion needs at our operating sites, while providing greater value to our suppliers and customers.
Working Capital Practices
Our growth is funded through a combination of cash on hand, cash flow from operations, commercial paper issuances and long-term borrowings. See the discussion in Item 7, “Management’s Discussion and Analysis of Financial Condition and Results of Operations – Liquidity and Capital Resources” regarding our liquidity, financial position and sources and uses of funds.
We extend credit terms to some of our customers based on our assessment of each customer’s creditworthiness. We monitor each customer’s account and will suspend shipments if necessary.
A majority of our sales orders are filled within 24 hours of customer order placement. We generally maintain inventory on hand to meet customer demand. The level of inventory on hand will vary by product depending on shelf-life, supplier order fulfillment lead times and customer demand. We also purchase additional volumes of certain products based on supply or pricing opportunities. We take advantage of suppliers’ cash discounts where appropriate. Otherwise, we pay our suppliers according to our payment terms.
Global Support Center
Our Global Support Center (GSC) provides numerous centralized services to our operating sites and performs support activities for employees, suppliers and customers. GSC team members possess experience and expertise in, among other areas,
customer and vendor contract administration, accounting and finance, treasury, legal, information technology, payroll and employee benefits, risk management and insurance, sales and marketing, merchandising, inbound logistics, human resources, strategy and tax compliance services. The GSC also makes available supply chain expertise in warehousing, distribution, and omni-channel strategic services, which provide assistance in operational best practices, including space utilization, energy conservation, fleet management and workflow.
Capital Improvements
During fiscal 2023, 2022 and 2021, $793.3 million, $632.8 million and $470.7 million, respectively, were invested in facilities, technology, equipment, delivery fleet and other capital asset enhancements. From time to time, we dispose of assets in the normal course of business and we consider proceeds from these asset sales to be an offset to capital expenditures. During fiscal 2023, 2022 and 2021, capital expenditures, net of proceeds from sales of assets, were $751.2 million, $608.7 million and $411.5 million, respectively. Capital expenditures, net of proceeds from sales of assets, as a percentage of sales during fiscal 2023, 2022 and 2021 were 1.0%, 0.9% and 0.8%, respectively. During the three years ended July 1, 2023, capital expenditures were financed primarily by internally generated funds along with bank and other borrowings. We expect our capital expenditures, net of proceeds from sales of assets, to continue to approximate 1% of sales in fiscal 2024, and we expect to finance these capital expenditures from cash flows from operations and bank and other borrowings.
Human Capital Resources
We believe engaged and empowered colleagues are key to business success. Attracting, developing and retaining the best talent globally drives the company’s long-term value. Our diverse colleagues and inclusive culture create an environment where colleagues can develop their skills and contribute to our success. As of July 1, 2023, we employed approximately 72,000 employees, including 50,000 U.S. employees and 22,000 employees outside the U.S., as compared to approximately 71,000 employees as of July 2, 2022. Also, approximately 99% of our U.S.-based colleagues are classified as full-time, defined as employees who work 30 or more hours per week. Approximately 15% of our employees were represented by unions, primarily the International Brotherhood of Teamsters and unions in France and Sweden. Approximately 8% of our union U.S. employees and 20% of our union international employees are covered by collective bargaining agreements that are subject to renegotiation in fiscal 2024.
Talent Acquisition and Talent Management — Maintaining a pipeline of talent is critical to our ongoing success and is essential to our succession planning efforts and to growing leaders throughout the organization. Our leadership is responsible for attracting and retaining top talent by facilitating an environment where employees feel supported and encouraged in their professional and personal development. Specifically, we promote employee development by cultivating a high-impact learning culture for our colleagues through a variety of enterprise development programs and learning resources, including goal-setting and career development processes. We commit to investing in our employees through on the job training and coaching. Additionally, through our Sysco Speaks program, we conduct annual, confidential engagement surveys of our global workforce that are administered and analyzed by an independent third party.
Total Rewards — We are committed to equal pay for equal work, regardless of gender, race, ethnicity or other personal characteristics. To deliver on that commitment, we benchmark and set pay ranges based on market data and consider various factors, such as an employee’s role and experience, job location and individual performance. We also regularly review our compensation practices to promote fair and equitable pay. In fiscal 2023, our hourly colleagues received an average hourly wage of $24.15, and 100% of colleagues in our U.S. distribution facilities received pay above state minimum wage thresholds. Also, some of our full-time colleagues receive paid vacation and sick time benefits, short-term and long-term incentives, retirement plans, training and development, access to career opportunities, paid pregnancy and adoption leave benefits, short-term and long-term disability benefits, health and welfare benefits, and recognition, as well as other programs like employee discounts.
Diversity, Equity and Inclusion — Our Diversity, Equity and Inclusion (DEI) team develops global strategic initiatives that are implemented to ensure that the needs specific to each region are addressed. Our vision is to build a diverse, equitable and inclusive work environment that reflects the customers and communities we serve. We use our Global DEI Advisory Council to monitor and enhance our three-year DEI Roadmap and Real Talk Dialogues which provide leaders and colleagues safe forums to have open, honest, two-way and completely voluntary conversations. Our Colleague Resource Groups (CRGs) are voluntary, colleague-led groups organized to foster a diverse, inclusive workplace at Sysco. They are a critical element of our engagement and DEI efforts at both our headquarters and at operating sites.
As of July 1, 2023, our U.S. employee population possessed the gender, ethnic and racial attributes identified below:
| United States Employee Population (1) | Male | Female | White | Hispanic or Latino | Black or African American | Asian | American Indian or Alaskan Native | Native Hawaiian or Other Pacific Islander | Two or more races | Not Available | ||||||||||||||||||||||||||||||||||||||||||||||||||||
| Individual Contributors | 81 | % | 19 | % | 42 | % | 26 | % | 23 | % | 4 | % | 1 | % | 1 | % | 2 | % | 1 | % | ||||||||||||||||||||||||||||||||||||||||||
| Management | 74 | 26 | 63 | 16 | 12 | 5 | 1 | 1 | 2 | — | ||||||||||||||||||||||||||||||||||||||||||||||||||||
| Senior Management | 74 | 26 | 79 | 6 | 6 | 6 | — | — | 2 | 1 | ||||||||||||||||||||||||||||||||||||||||||||||||||||
| Officers | 72 | 28 | 66 | 5 | 14 | 5 | 1 | — | 3 | 6 | ||||||||||||||||||||||||||||||||||||||||||||||||||||
| Total Sysco | 80 | 20 | 45 | 25 | 21 | 4 | 1 | 1 | 2 | 1 |
| (1) | Information is based on self-reported identification. |
Competition
A large number of companies are engaged in the distribution of food and non-food products to the foodservice industry. Our customers may choose to purchase products directly from wholesale or retail outlets, including club, cash and carry and grocery stores, online retailers, or negotiate prices directly with our suppliers. We compete with local and regional distributors and some organizations that operate on a multi-region basis. In addition, these local, regional and multi-regional distributors can create purchasing cooperatives and marketing groups to enhance their competitive abilities by expanding their product mix, improving purchasing power and extending their geographic capabilities. Our customers are accustomed to purchasing from multiple suppliers and channels concurrently. Customers can choose from many broadline foodservice distributors; specialty distributors that focus on specific categories such as produce, meat or seafood; other wholesale channels; club stores; cash and carry stores; grocery stores; and numerous online retailers. Since switching costs are very low, customers can make supplier and channel changes very quickly. We believe that the principal competitive factors in the foodservice industry are effective customer contacts, the ability to deliver a wide range of quality products and related services on a timely and dependable basis, and competitive prices. There are few barriers to market entry.
We estimate we serve more than 17% of the approximately $350 billion annual foodservice market in the U.S., as estimated by Technomic, Inc., for calendar year 2022. Technomic projects the market size to increase to approximately $370 billion by the end of calendar 2023. We also serve certain international geographies that vary in size and amount of market share. We believe, based upon industry trade data, our sales to the U.S. and Canada food-away-from-home industry were the highest of any foodservice distributor during fiscal 2023. While comprehensive industry statistics are not available, we believe that, in most instances, our operations in the U.S. and Canada are among the leading distributors of food and related non-food products to foodservice customers in those trade areas. We believe our competitive advantages include our sales consultants; our diversified product base, which includes quality-assured Sysco brand products; our service reliability; the ancillary services we provide to our customers, such as business reviews and menu analysis; and our multi-regional presence in North America and Europe. These advantages combined with a large geographical footprint of multi-temperature warehouses, mitigates some of the impact of regional economic declines that may occur over time.
Government Regulation
Our company is required to comply, and it is our policy to comply, with all applicable laws and regulations in the numerous countries throughout the world in which we do business.
In the U.S., as a marketer and distributor of food products, we are subject to the Federal Food, Drug and Cosmetic Act and regulations promulgated thereunder by the U.S. Food and Drug Administration (FDA). The FDA regulates food safety and quality through various statutory and regulatory mandates, including manufacturing and holding requirements for foods through good manufacturing practice regulations, hazard analysis and critical control point (HACCP) requirements for certain foods, and the food and color additive approval process. The agency also specifies the standards of identity for certain foods; prescribes the format and content of information required to appear on food product labels; regulates food contact packaging and materials; and maintains a Reportable Food Registry for the industry to report when there is a reasonable probability that an article of food will cause serious adverse health consequences. For certain product lines, we are also subject to the Federal Meat Inspection Act, the Poultry Products Inspection Act, the Perishable Agricultural Commodities Act, the Packers and Stockyard Act and regulations promulgated by the U.S. Department of Agriculture (USDA) to interpret and implement these statutory provisions. The USDA imposes standards for product safety, quality and sanitation through the federal meat and poultry
inspection program. The USDA reviews and approves the labeling of these products and establishes standards for the grading and commercial acceptance of produce shipments from our suppliers. We are also subject to the Public Health Security and Bioterrorism Preparedness and Response Act of 2002, which imposes certain registration and record keeping requirements on facilities that manufacture, process, pack or hold food for human or animal consumption.
The Food Safety Modernization Act (FSMA) has significantly expanded our food safety requirements. The FDA has finalized regulations implementing the FSMA, recognizing that ensuring the safety of the food supply is a shared responsibility among many different points in the global supply chain. The FSMA rules are designed to identify specific actions that must be taken at each of these points to prevent contamination. We have established and continue to maintain comprehensive, prevention-based controls across the food supply chain that are both verified and validated, as required by FDA regulations implementing FSMA. The FSMA further imposes requirements for food products imported into the U.S. and provides the FDA with mandatory recall authority.
We and our products are also subject to state and local regulation through such measures as the licensing of our facilities; enforcement by state and local health agencies of state and local standards for our products; and regulation of our trade practices in connection with the sale of our products. Our facilities are subject to regulations issued pursuant to the U.S. Occupational Safety and Health Act by the U.S. Department of Labor. These regulations require us to comply with certain manufacturing, health and safety standards to protect our employees from accidents and to establish hazard communication programs to transmit information on the hazards of certain chemicals present in products we distribute. We are also subject to the National Labor Relations Act, which governs the process for collective bargaining between employers and employees and protects the rights of both employers and employees in the workplace.
Our processing and distribution facilities must be registered with the FDA biennially and are subject to periodic government agency inspections by the FDA and USDA. Our facilities are generally inspected at least annually by federal and/or state authorities. We also must comply with Federal Trade Commission standards with respect to any claims made about our food products in advertising and marketing materials.
Our customers include several departments of the federal government, including the Department of Defense and Department of Veterans Affairs facilities, as well as certain state and local entities. These customer relationships subject us to additional regulations applicable to government contractors.
We are also subject to regulation by numerous federal, state and local regulatory agencies, including, but not limited to, the U.S. Department of Labor, which sets employment practice standards for workers. We are also subject to regulations by the U.S. Department of Transportation, as well as its agencies, the Surface Transportation Board, the Federal Highway Administration, the Federal Motor Carrier Safety Administration, and the National Highway Traffic Safety Administration, which collectively regulate our trucking operations through the regulation of operations, safety, insurance and hazardous materials. We must comply with the safety and fitness regulations promulgated by the Federal Motor Carrier Safety Administration, including those relating to drug and alcohol testing and hours-of service. Such matters as weight and dimension of equipment also fall under federal and state regulations. We are subject to regulations of the Federal Aviation Administration covering items transported by air. In addition, we are subject to the federal False Claims Act, and similar state statutes, which prohibit knowingly presenting, or causing to be presented, a false or fraudulent claim for payment to the government and the knowing and improper retention of overpayments.
The U.S. Foreign Corrupt Practices Act (FCPA) prohibits bribery of public officials to obtain or retain business in foreign jurisdictions. The FCPA also requires us to keep accurate books and records and to maintain internal accounting controls to detect and prevent bribery and to ensure that transactions are properly authorized and recorded. We have implemented and continue to develop an anti-corruption compliance program applicable to our global operations intended to detect and prevent bribery and to comply with these and other anti-corruption laws in countries where we operate.
Our business is subject to competition laws in the various jurisdictions where we operate, including the Sherman Antitrust Act and related federal and state antitrust laws in the U.S. These laws and regulations generally prohibit competitors from fixing prices, boycotting competitors, or engaging in other conduct that unreasonably restrains competition. In many jurisdictions, compliance with these competition laws is of special importance to us. Our operations may come under special scrutiny by competition law authorities due to our competitive position in those jurisdictions.
Outside the U.S., our business is subject to numerous similar statutes, regulations, and other regulatory requirements. For example, we are subject to legal and regulatory requirements of the European Union (EU), as well as those of EU countries, where we conduct business (including Ireland, France and Sweden). Those requirements relate to, among other things,
competition, product composition, packaging, labeling, advertisement (including nutrition and health claims) and the safety of food products, as well as the health, safety and working conditions of employees. We are subject to privacy laws in the EU, including the General Data Protection Regulation (GDPR), which requires companies to meet certain requirements regarding the handling of personal data. In addition, our business is subject to the U.K. Modern Slavery Act 2015, which requires certain companies that operate in the U.K. to prepare a report describing steps that they have taken to ensure that slavery and human trafficking is not taking place in their supply chain or business. Our business is also subject to the U.K. Bribery Act 2010, an anti-corruption law that criminalizes the failure by a company to prevent persons associated with that company from offering or paying bribes to government officials or non-government persons in order to obtain or retain business or a business advantage for the company, as well as restricting the offer, payment or receipt of bribes to or from governmental officials and non-governmental persons.
All of our company’s facilities and other operations in the U.S. and elsewhere around the world are subject to various environmental protection statutes and regulations, including those in the U.S., the U.K. and the EU, relating to: (1) the use of water resources and the discharge of wastewater; (2) the discharge of pollutants into the air, including vehicle emissions; (3) proper handling, treatment and disposing of solid and hazardous wastes; and (4) protecting against and appropriately investigating and remediating spills and releases. Further, most of our distribution facilities have ammonia-based refrigeration systems and tanks for the storage of diesel fuel and other petroleum products which are subject to laws regulating such systems and storage tanks (including the investigation and remediation of soil and groundwater contamination associated with the use of underground storage tanks). See “Item 1A. Risk Factors - Business and Operational Risks - We may incur significant costs to comply with environmental laws and regulations, and we may be subject to substantial fines, penalties, or third-party claims for non-compliance.”
General
We have numerous trademarks that are of significant importance, including the SYSCO® and Brakes® trademarks, in addition to our privately branded product trademarks that include these trademarks. These trademarks and the private brands on which they are used are widely recognized within the foodservice industry. Both our U.S. and European trademarks are effective for a ten-year period, and we generally renew our trademarks before their expiration dates unless a particular trademark is no longer in use. We believe the loss of the SYSCO® trademark would have a material adverse effect on our results of operations. We do not have any material patents or licenses.
We are not engaged in material research and development activities relating to the development of new products or the improvement of existing products.
Our sales do not generally fluctuate significantly on a seasonal basis; therefore, our business is not deemed to be seasonal.
As of July 1, 2023, we operated 334 distribution facilities throughout North America and Europe.
Item 1A. Risk Factors
The following discussion of “risk factors” identifies the most significant factors that may adversely affect our business, results of operations, financial position and future financial performance. This information should be read in conjunction with Management’s Discussion and Analysis of Financial Condition and Results of Operations and the consolidated financial statements and related notes contained in this report. The following discussion of risks is not all inclusive, but is designed to highlight what we believe are the most significant factors to consider when evaluating our business. These factors could cause our future results to differ from our expectations expressed in the forward-looking statements identified within “Management’s Discussion and Analysis of Financial Condition and Results of Operations” and from other historical trends.
Industry and General Economic Risks
Our industry is characterized by low margins, and periods of significant or prolonged inflation or deflation affect our product costs and may negatively impact our profitability and results of operations.
The foodservice distribution industry is characterized by relatively high inventory turnover with relatively low profit margins. Volatile food costs have a direct impact on our industry. We experienced an elevated inflation rate of approximately 6.1% in our total company operations during fiscal 2023, primarily in the dairy, frozen and canned and dry categories. In periods of significant product cost inflation, if we are unable to pass on all or a portion of such product cost increases to our customers in a timely manner, our results of operations would be adversely affected. In addition, periods of rapidly increasing
inflation may adversely affect our results of operations due to the impact of such inflation on discretionary spending by consumers and our limited ability to increase prices in the current, highly competitive environment. Conversely, our results of operations may be adversely affected by periods of product cost disinflation and deflation, because we make a significant portion of our sales at prices that are based on the cost of products we sell plus a percentage margin, mark-up or fee per case. As a result, our results of operations may be adversely affected during periods of product cost disinflation and deflation, even though our gross profit percentage may remain relatively constant.
A shortage of qualified labor and increases in labor costs could adversely affect our business and materially reduce earnings**.**
The future success of our operations, including the achievement of our strategic objectives, depends on our ability, and the ability of certain third parties on which we rely, to identify, recruit, develop and retain diverse, qualified and talented individuals. As a result, a shortage of qualified labor could adversely affect our business, decrease our ability to effectively serve our customers, and achieve our strategic objectives. We are experiencing a shortage of qualified labor in certain geographies, particularly in the area of warehouse workers and drivers. Such shortages frequently result in increased costs from certain temporary wage actions, such as hiring, referral, and retention bonus programs. See the discussion under “Human Capital Resources” in Item 1, “Business” for additional information regarding our talent acquisition and talent management efforts in the context of these labor shortages. Unsuccessful recruiting and retention efforts as a result of such continuing shortages for a prolonged period of time could have a material adverse effect on our financial condition and results of operations.
Labor shortages also likely lead to higher wages for employees and higher costs to purchase the services of third parties. Increases in labor costs, such as increases in minimum wage requirements, wage inflation and/or increased overtime, reduce our profitability and that of our customers. Increases in such labor costs for a prolonged period of time could have a material adverse effect on our financial condition and results of operations.
Further, potential changes in labor legislation and case law could result in current non-union portions of our workforce, including warehouse and delivery personnel, being subjected to greater organized labor influence. If additional portions of our workforce became subject to collective bargaining agreements, this could result in increased costs of doing business as we would become subject to mandatory, binding arbitration or labor scheduling, costs and standards, which may reduce our operating flexibility.
Global health developments and economic uncertainty resulting from the COVID-19 pandemic or other future public health crises may continue to adversely affect our business, financial condition and results of operations.
Public health crises, pandemics and epidemics could adversely affect our business, financial condition and results of operations. For example, the coronavirus (COVID-19) pandemic adversely impacted our business, results of operations and financial condition directly and disrupted the operations of our business partners, suppliers and customers. While our operations have generally stabilized since the peak of the COVID-19 pandemic, we cannot predict with certainty the extent to which our operations may be impacted in the future by any continuing effects of COVID-19 on us or on our business partners, suppliers and customers. Fear of COVID-19 or similar events may further alter consumer confidence, behavior and spending patterns, and could adversely affect the economies and financial markets of many countries (or globally), resulting in an economic downturn that could affect customers’ demand for our products.
In response to the outbreak of COVID-19 and its development into a pandemic, governmental authorities in many countries in which we, our customers and our suppliers were present and operated, imposed mandatory closures, sought voluntary closures and imposed restrictions on, or advisories with respect to, travel, business operations and public gatherings or interactions. Among other matters, these actions required or strongly urged various venues where foodservice products were served, including restaurants, schools, hotels and cruise liners, to reduce or discontinue operations, which adversely affected demand in the foodservice industry, including demand for our products and services. Mutations of the virus have arisen, and may arise in the future, some of which could prove to be particularly aggressive variants, causing some governmental authorities to reintroduce certain restrictions in the future, which could adversely affect demand in the foodservice industry.
The future outbreak of a public health crisis (including the reemergence of COVID-19) that adversely affects our business, results of operations and financial condition, could also have the effect of heightening many of the other risks described in this Annual Report on Form 10-K and subsequent filings with the SEC, such as those risks relating to our level of indebtedness, and may have an adverse effect on the price of our common stock.
Unfavorable macroeconomic conditions, as well as unfavorable conditions in particular local markets, may adversely affect our results of operations and financial condition.
Our results of operations are susceptible to regional, national and international economic trends and uncertainties. Economic conditions can affect us in the following ways:
-
Unfavorable conditions can depress sales and/or gross margins in a given market.
-
Food cost and fuel cost inflation can lead to reductions in the frequency of dining out and the amount spent by consumers for food-away-from-home purchases, reducing demand for our products.
-
Heightened uncertainty in the financial markets negatively affects consumer confidence and discretionary spending.
-
The inability to c
Showing the first 8K of 62K characters. Open the full section
Item 1B. Unresolved Staff Comments
None.
Item 2. Properties
The table below shows the number of distribution facilities occupied by Sysco in each country and the aggregate square footage devoted to cold and dry storage as of July 1, 2023.
| Location | Number of Facilities | Square Feet (in thousands) | Segment Served (1) | ||||||||||||||
| Bahamas | 1 | 192 | I | ||||||||||||||
| Belgium | 1 | 200 | I | ||||||||||||||
| Canada | 28 | 4,220 | I, O | ||||||||||||||
| Costa Rica | 1 | 188 | I | ||||||||||||||
| France | 41 | 3,004 | I | ||||||||||||||
| Ireland and Northern Ireland | 8 | 656 | I | ||||||||||||||
| Mexico | 6 | 288 | I | ||||||||||||||
| Panama | 1 | 44 | I | ||||||||||||||
| Sweden | 7 | 948 | I | ||||||||||||||
| United Kingdom | 48 | 2,644 | I | ||||||||||||||
| United States and its territories (2) | 192 | 41,583 | U, I, S, O | ||||||||||||||
| Totals (3) | 334 | 53,967 |
| (1) | Segments served include U.S. Foodservice (U), International Foodservice (I), SYGMA (S), and Other (O). | ||||
| (2) | California, Florida, Texas, and Illinois account for 24, 16, 14, and 11 respectively, of the facilities located in the U.S. | ||||
| (3) | Using a comparable definition based on facility size, fiscal 2022 included 333 facilities. |
We own approximately 40,100,000 square feet of our distribution facilities (or 74.4% of the total square feet), and the remainder is occupied under leases expiring at various dates from fiscal 2024 to fiscal 2049, exclusive of renewal options.
Within our Latin American operations, we operate 17 cash and carry facilities and 5 warehouse and storage facilities in Costa Rica and 5 cash and carry facilities and 1 warehouse and storage facility in Panama.
We own our approximately 634,000 square foot headquarters office complex in Houston, Texas.
We are currently constructing expansions or build-outs for various distribution facilities in the United States and Northern Ireland. The various operating sites undergoing significant construction, in the aggregate, contributed approximately 6% of fiscal 2023 sales.
As of July 1, 2023, our fleet of approximately 17,000 delivery vehicles consisted of tractor and trailer combinations, vans and panel trucks, most of which are either wholly or partially refrigerated for the transportation of frozen or perishable foods. We own approximately 89% of these vehicles and lease the remainder.
Item 3. Legal Proceedings
From time to time, we may be party to legal proceedings that arise in the ordinary course of our business. We do not believe there are any pending legal proceedings that, individually or in the aggregate, will have a material adverse effect on the company’s financial condition, results of operations or cash flows.
Environmental Matters
Item 103 of SEC Regulation S-K requires disclosure of certain environmental matters in which a governmental authority is a party to the proceedings and when such proceedings either (i) involve the potential for monetary sanctions that Sysco’s management reasonably believes will exceed a specified threshold or (ii) are material to its business or financial condition. Pursuant to this item, Sysco has chosen a reporting threshold for such proceedings of $1 million. Applying this
threshold, there are no environmental matters to disclose for this period, nor does the company expect a material adverse effect on its business or financial condition.
Item 4. Mine Safety Disclosures
Not applicable.
PART II – FINANCIAL INFORMATION
Item 5. Market for Registrant’s Common Equity, Related Stockholder Matters and Issuer Purchases of Equity Securities
The principal market for Sysco’s common stock (SYY) is the New York Stock Exchange. The number of record owners of Sysco’s common stock as of August 8, 2023 was 7,365.
We currently expect that comparable quarterly cash dividends will continue to be paid in the future; however, future declarations of dividends and the establishment of future record and payment dates are subject to the final determination of our Board of Directors.
We made the following share repurchases during the fourth quarter of fiscal 2023:
| ISSUER PURCHASES OF EQUITY SECURITIES | |||||||||||||||||||||||
| Period | (a) Total Number of Shares Purchased (1) | (b) Average Price Paid per Share | (c) Total Number of Shares Purchased as Part of Publicly Announced Plans or Programs (2) | (d) Maximum Number of Shares that May Yet Be Purchased Under the Plans or Programs | |||||||||||||||||||
| Month #1 | |||||||||||||||||||||||
| April 2 - April 29 | 77,017 | $ | 77.24 | 77,017 | — | ||||||||||||||||||
| Month #2 | |||||||||||||||||||||||
| April 30 - May 27 | 566,283 | 73.46 | 566,283 | — | |||||||||||||||||||
| Month #3 | |||||||||||||||||||||||
| May 28 - July 1 | 1,035,491 | 72.16 | 1,035,491 | — | |||||||||||||||||||
| Totals | 1,678,791 | $ | 72.83 | 1,678,791 | — |
| (1) | The total number of shares repurchased includes no shares tendered by individuals in connection with stock option exercises in Month #1, Month #2 and Month #3. | ||||
| (2) | See the discussion in Item 7, “Management’s Discussion and Analysis of Financial Condition and Results of Operations – Liquidity and Capital Resources – Equity Transactions” for additional information regarding Sysco’s share repurchase program. |
In May 2021, our Board of Directors approved a share repurchase program to authorize the repurchase of up to $5.0 billion of the company’s common stock, which will remain available until fully utilized.
We repurchased 6,231,071 shares for $500.1 million during fiscal 2023. As of July 1, 2023, we had a remaining authorization of approximately $4.0 billion. We purchased 552,463 additional shares under our authorization through August 8, 2023.
Stock Performance Graph
The following performance graph and related information shall not be deemed “soliciting material” or to be “filed” with the Securities and Exchange Commission, nor shall such information be incorporated by reference into any future filing under the Securities Act of 1933, as amended, or the Exchange Act, except to the extent that Sysco specifically incorporates such information by reference into such filing.
The following stock performance graph compares the performance of Sysco’s Common Stock to the S&P 500 Index and to the S&P 500 Food/Staple Retail Index for Sysco’s last five fiscal years.
The graph assumes that the value of the investment in our Common Stock, the S&P 500 Index, and the S&P 500 Food/Staple Retail Index was $100 on the last trading day of fiscal 2018, and that all dividends were reinvested. Performance data for Sysco, the S&P 500 Index and the S&P 500 Food/Staple Retail Index is provided as of the last trading day of each of our last five fiscal years.
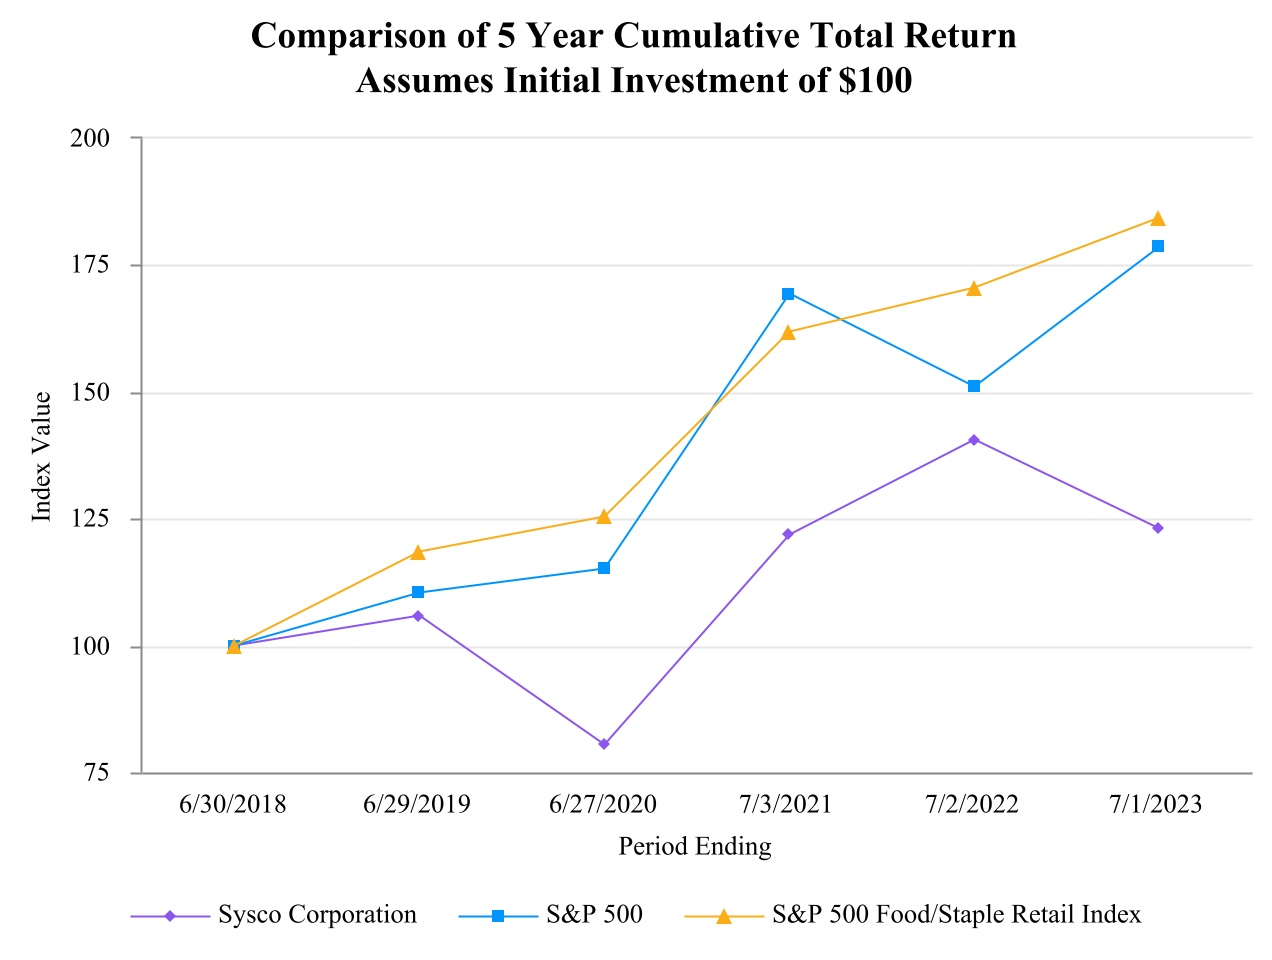
| 6/30/2018 | 6/29/2019 | 6/27/2020 | 7/3/2021 | 7/2/2022 | 7/1/2023 | |||||||||||||||||||||||||||||||||
| Sysco Corporation | $100 | $106 | $80 | $122 | $140 | $123 | ||||||||||||||||||||||||||||||||
| S&P 500 | 100 | 110 | 115 | 169 | 151 | 179 | ||||||||||||||||||||||||||||||||
| S&P 500 Food/Staple Retail Index | 100 | 118 | 125 | 162 | 170 | 184 |
Item 6. [Reserved]
Item 7. Management’s Discussion and Analysis of Financial Condition and Results of Operations
The following discussion and analysis of Sysco’s financial condition, results of operations and liquidity and capital resources for the fiscal years ended July 1, 2023 and July 2, 2022 should be read as a supplement to our Consolidated Financial Statements and the accompanying notes contained in Item 8 of this report, and in conjunction with the “Forward-looking Statements” section set forth in Part II and the “Risk Factors” section set forth in Item 1A of Part I. All discussion of changes in our results of operations from fiscal 2022 to fiscal 2021 has been omitted from this Form 10-K, but may be found in Item 7, “Management’s Discussion and Analysis of Financial Condition and Results of Operations” of our Form 10-K for the year ended July 2, 2022, filed with the Securities and Exchange Commission on August 26, 2022.
Overview
Sysco distributes food and related products to restaurants, healthcare and educational facilities, lodging establishments and other foodservice customers. Our primary operations are in North America and Europe. Under the accounting provisions related to disclosures about segments of an enterprise, we have combined certain operations into three reportable segments. “Other” financial information is attributable to our other operations that do not meet the quantitative disclosure thresholds.
- U.S. Foodservice Operations – primarily includes (a) our U.S. Broadline operations, which distribute a full line of food products, including custom-cut meat, seafood, produce, specialty Italian, specialty imports and a wide variety of non-food products and (b) our U.S. Specialty operations, which include our FreshPoint fresh produce
distribution business, our Specialty Meats and Seafood Group specialty protein operations, our growing Italian Specialty platform anchored by Greco & Sons, our Asian specialty distribution company and a number of other small specialty businesses that are not material to the operations of Sysco;
-
International Foodservice Operations – includes operations outside of the United States (U.S.), which distribute a full line of food products and a wide variety of non-food products. The Americas primarily consists of operations in Canada, Bahamas, Mexico, Costa Rica and Panama, as well as our export operations that distribute to international customers. Our European operations primarily consist of operations in the United Kingdom (U.K.), France, Ireland and Sweden;
-
SYGMA – our U.S. customized distribution operations serving quick-service chain restaurant customer locations; and
-
Other – primarily our hotel supply operations, Guest Worldwide.
We estimate that we serve about 17% of an approximately $350 billion annual foodservice market in the U.S. based on industry data obtained from Technomic, Inc. (Technomic) as of the end of calendar year 2022. Technomic projects the market size to increase to approximately $370 billion by the end of calendar year 2023. From time to time, Technomic may revise the methodology used to calculate the size of the foodservice market and, as a result, our percentage can change not only from our sales results, but also from such revisions. We also serve certain international geographies that vary in size and amount of market share.
According to industry sources, the foodservice, or food-away-from-home, market represents approximately 53% of the total dollars spent on food purchases made at the consumer level in the U.S. as of the end of calendar year 2022.
Highlights
Our fiscal 2023 results were strong, reflecting growth in volumes and market share. Our market share gains in the U.S. segments continued to accelerate through the fiscal year. This demonstrates the favorable impact of our Recipe for Growth strategy on our business, now in its third year. This strategy is helping us advance our capabilities in supply chain and sales. As a result, Sysco achieved an all-time record for annual sales and operating income. We made significant improvements in operating expense leverage, resulting in improved productivity that drove profitable growth. See below for a comparison of our fiscal 2023 results to our fiscal 2022 results, both including and excluding Certain Items (as defined below).
Below is a comparison of results from fiscal 2023 to fiscal 2022:
- Sales:
◦increased 11.2%, or $7.7 billion, to $76.3 billion;
- Operating income:
◦increased 29.5%, or $692.0 million, to $3.0 billion;
◦adjusted operating income increased 21.7%, or $572.0 million, to $3.2 billion;
- Net earnings:
◦increased 30.3%, or $411.4 million, to $1.8 billion;
◦adjusted net earnings increased 22.2%, or $371.2 million, to $2.0 billion;
- Basic earnings per share:
◦increased 31.2%, or $0.83, to $3.49 from the comparable prior year amount of $2.66 per share;
- Diluted earnings per share:
◦increased 31.4%, or $0.83, to $3.47 from the comparable prior year amount of $2.64 per share;
◦adjusted diluted earnings per share were $4.01 in fiscal 2023, a $0.76 increase from the comparable prior year amount of $3.25 per share.
- EBITDA:
◦increased 14.1%, or $444.4 million, to $3.6 billion; and
◦adjusted EBITDA increased 15.6%, or $519.2 million, to $3.8 billion.
The discussion of our results includes certain non-GAAP financial measures, including EBITDA and adjusted EBITDA, that we believe provide important perspective with respect to underlying business trends. Other than free cash flow, any non-GAAP financial measures will be denoted as adjusted measures to remove the impact of restructuring and transformational project costs consisting of: (1) restructuring charges, (2) expenses associated with our various transformation initiatives and (3) severance charges; acquisition-related costs consisting of: (a) intangible amortization expense and (b) acquisition costs and due diligence costs related to our acquisitions; and the reduction of bad debt expense previously
recognized in fiscal 2020 due to the impact of the COVID-19 pandemic on the collectability of our pre-pandemic trade receivable balances. Our results for fiscal 2023 were also impacted by adjustments to a product return allowance pertaining to COVID-related personal protection equipment inventory, a pension settlement charge that resulted from the purchase of a nonparticipating single premium group annuity contract that transferred defined benefit plan obligations to an insurer, and a litigation financing agreement. Our results for fiscal 2022 were also impacted by a write-down of COVID-related personal protection equipment inventory due to the reduction in the net realizable value of inventory, losses on the extinguishment of long-term debt and an increase in reserves for uncertain tax positions.
The fiscal 2023 and fiscal 2022 items discussed above are collectively referred to as “Certain Items.” The results of our operations can be impacted by changes in exchange rates applicable to converting from local currencies to U.S. dollars. We measure our results on a constant currency basis. Our discussion below of our results includes certain non-GAAP financial measures that we believe provide important perspective with respect to underlying business trends. Other than free cash flow, any non-GAAP financial measures will be denoted as adjusted measures and exclude the impact from Certain Items, and certain metrics are stated on a constant currency basis.
Management believes that adjusting its operating expenses, operating income, interest expense, other (income) expense, net earnings and diluted earnings per share to remove these Certain Items, provides an important perspective with respect to our underlying business trends and results. Additionally, it provides meaningful supplemental information to both management and investors that (1) is indicative of the performance of the company’s underlying operations, (2) facilitates comparisons on a year-over-year basis and (3) removes those items that are difficult to predict and are of
Showing the first 8K of 146K characters. Open the full section
Item 7A. Quantitative and Qualitative Disclosures about Market Risk
Our market risks consist of interest rate risk, foreign currency exchange rate risk, fuel price risk and investment risk.
Interest Rate Risk
We do not utilize financial instruments for trading purposes. Our use of debt directly exposes us to interest rate risk. Floating rate debt, where the interest rate fluctuates periodically, exposes us to short-term changes in market interest rates. Fixed rate debt, where the interest rate is fixed over the life of the instrument, exposes us to changes in market interest rates reflected in the fair value of the debt and to the risk that we may need to refinance maturing debt with new debt at higher rates.
We manage our debt portfolio to achieve an overall desired position of fixed and floating rates and may employ interest rate swaps as a tool to achieve that position. The major risks from interest rate derivatives include changes in the interest rates affecting the fair value of such instruments, potential increases in interest expense due to market increases in floating interest rates and the creditworthiness of the counterparties in such transactions.
At July 1, 2023, there were no commercial paper issuances outstanding under our U.S. commercial paper program. Total debt as of July 1, 2023 was $10.4 billion, of which approximately 100% was at fixed rates of interest.
At July 2, 2022, there were no commercial paper issuances outstanding under our U.S. commercial paper program. Total debt as of July 2, 2022 was $10.6 billion, of which approximately 95% was at fixed rates of interest, including the impact of our interest rate swap agreements.
The following tables present our interest rate position as of July 1, 2023. All amounts are stated in U.S. dollar equivalents.
| Interest Rate Position as of July 1, 2023 | |||||||||||||||||||||||||||||||||||||||||||||||
| Principal Amount by Expected Maturity | |||||||||||||||||||||||||||||||||||||||||||||||
| Average Interest Rate | |||||||||||||||||||||||||||||||||||||||||||||||
| 2024 | 2025 | 2026 | 2027 | 2028 | Thereafter | Total | Fair Value | ||||||||||||||||||||||||||||||||||||||||
| (Dollars in thousands) | |||||||||||||||||||||||||||||||||||||||||||||||
| U.S. Dollar Denominated: | |||||||||||||||||||||||||||||||||||||||||||||||
| Fixed Rate Debt | $ | — | $ | — | $ | 750,000 | $ | 1,043,176 | $ | 750,000 | $ | 7,038,879 | $ | 9,582,055 | $ | 8,942,071 | |||||||||||||||||||||||||||||||
| Average Interest Rate | — | % | — | % | 3.75 | % | 3.46 | % | 3.25 | % | 4.82 | % | 4.47 | % | |||||||||||||||||||||||||||||||||
| Canadian Dollar Denominated: | |||||||||||||||||||||||||||||||||||||||||||||||
| Fixed Rate Debt | $ | — | $ | 377,815 | $ | — | $ | — | $ | — | $ | — | $ | 377,815 | $ | 365,385 | |||||||||||||||||||||||||||||||
| Average Interest Rate | — | % | 3.65 | % | — | % | — | % | — | % | — | % | 3.65 | % |
Foreign Currency Exchange Rate Risk
The majority of our foreign subsidiaries use their local currency as their functional currency. To the extent that business transactions are not denominated in a foreign subsidiary’s functional currency, we are exposed to foreign currency exchange rate risk. We will also incur gains and losses within our shareholders’ equity due to the translation of our financial statements from foreign currencies into U.S. dollars. Our largest currency exposures are with Canadian dollars, British pound sterling and Euro currencies. Our income statement trends may be impacted by the translation of the income statements of our
foreign subsidiaries into U.S. dollars. The exchange rates used to translate our foreign sales into U.S. dollars negatively affected sales by 1.3% in fiscal 2023 when compared to fiscal 2022. The exchange rate used to translate our foreign sales into U.S. dollars negatively affected sales by 0.3% in fiscal 2022 when compared to fiscal 2021. The impact to our operating income, net earnings and earnings per share was not material in fiscal 2023 or fiscal 2022. A 10% unfavorable change in the fiscal 2023 weighted year-to-date exchange rate and the resulting impact on our financial statements would have negatively affected fiscal 2023 sales by 1.7% and would not have materially affected our operating income, net earnings and earnings per share.
Our investments and loans to foreign operations create additional foreign currency exposure and from time to time, we enter into agreements to hedge foreign currency exchange rate risks and mitigate impact to our consolidated results of operations. In the fourth quarter of fiscal 2023, we extinguished €500 million of Euro notes issued in June 2016 as a hedge of a portion of our net investment in Euro-denominated foreign operations to reduce foreign currency risk associated with the investment in these operations. Changes in the value of these items resulting from fluctuations in the underlying exchange rates to U.S. Dollar exchange rates were recorded as foreign currency translation adjustments within Accumulated other comprehensive income (loss). Additionally, we periodically enter into agreements to hedge foreign currency risk associated with changes in spot rates on foreign denominated debt instruments, which are designated as fair value hedges. Gains or losses from fair value hedges impact the same category on the consolidated statements of income as the item being hedged, including the earnings impact of the excluded components. Unrealized gains or losses on components excluded from hedge effectiveness are recorded as a component of Accumulated other comprehensive income and recognized into earnings over the life of the hedged instrument.
Fuel Price Risk
Due to the nature of our distribution business, we are exposed to potential volatility in fuel prices. The price and availability of diesel fuel fluctuates due to changes in production, seasonality and other market factors generally outside of our control. Increased fuel costs may have a negative impact on our results of operations in three areas. First, the high cost of fuel can negatively impact consumer confidence and discretionary spending and thus reduce the frequency and amount spent by consumers for food-away-from-home purchases. Second, the high cost of fuel can increase the price we pay for product purchases and we may not be able to pass these costs fully to our customers. Third, increased fuel costs impact the costs we incur to deliver product to our customers. Fuel costs related to outbound deliveries represented approximately 0.6% of sales during fiscal 2023 and 0.5% of sales in fiscal 2022 and fiscal 2021.
Our activities to mitigate fuel costs include routing optimization with the goal of reducing miles driven, improving fleet utilization by adjusting idling time and maximum speeds and using fuel surcharges that primarily track with the change in market prices of fuel. We use diesel fuel swap contracts to fix the price of a portion of our projected monthly diesel fuel requirements. As of July 1, 2023, we had diesel fuel swaps with a total notional amount of approximately 71 million gallons through September 2025. These swaps are expected to lock in the price of approximately 80% of our bulk fuel purchases for fiscal 2024, or 70% of our total projected fuel purchase needs for fiscal 2024. Our remaining fuel purchase needs will occur at market rates unless contracted for a fixed price or hedged at a later date. Using current, published quarterly market price projections for diesel and estimates of fuel consumption, a 10% unfavorable change in diesel prices from the market price would result in a potential increase of approximately $6.1 million in our fuel costs on our non-contracted volumes.
Investment Risk
Our U.S. Retirement Plan holds various investments, including public and private equity, fixed income securities and real estate funds. The amount of our annual contribution to the plan is dependent upon, among other things, the return on the plan’s assets and discount rates used to calculate the plan’s liability. Fluctuations in asset values can cause the amount of our anticipated future contributions to the plan to increase and can result in a reduction to shareholders’ equity on our balance sheet as of fiscal year-end, which is when this plan’s funded status is measured. Also, the projected liability of the plan will be impacted by the fluctuations of interest rates on high quality bonds in the public markets. To the extent the financial markets experience declines, our anticipated future contributions and funded status will be affected for future years. A 10% unfavorable change in the value of the investments held by our company-sponsored retirement plans at the plans’ fiscal year end (December 31, 2022) would not have a material impact on our anticipated future contributions for fiscal 2024; however, such an unfavorable change would increase our pension expense for fiscal 2024 by $23.4 million and would reduce our shareholders’ equity on our balance sheet as of July 1, 2023 by $264.1 million.
Item 8. Financial Statements and Supplementary Data
SYSCO CORPORATION AND SUBSIDIARIES
INDEX TO CONSOLIDATED FINANCIAL STATEMENTS
All schedules are omitted because they are not applicable or the information is set forth in the consolidated financial statements or notes thereto.
REPORT OF MANAGEMENT ON INTERNAL CONTROL OVER FINANCIAL REPORTING
The management of Sysco Corporation (Sysco) is responsible for establishing and maintaining adequate internal control over financial reporting for the company. Sysco’s internal control system is designed to provide reasonable assurance regarding the reliability of financial reporting and the preparation and fair presentation of published financial statements. All internal control systems, no matter how well designed, have inherent limitations. Therefore, even those systems determined to be effective can provide only reasonable assurance with respect to financial statement preparation and presentation.
Sysco’s management assessed the effectiveness of Sysco’s internal control over financial reporting as of July 1, 2023. In making this assessment, management used the criteria set forth by the Committee of Sponsoring Organizations of the Treadway Commission in Internal Control — Integrated Framework (2013). Based on this assessment, management concluded that, as of July 1, 2023, Sysco’s internal control over financial reporting was effective based on those criteria.
Ernst & Young LLP, the independent registered public accounting firm that audited the company’s consolidated financial statements included in this report, has issued an audit report on the effectiveness of Sysco’s internal control over financial reporting as of July 1, 2023.
REPORT OF INDEPENDENT REGISTERED PUBLIC ACCOUNTING FIRM
To the Shareholders and the Board of Directors of Sysco Corporation
Opinion on Internal Control Over Financial Reporting
We have audited Sysco Corporation and its Consolidated Subsidiaries’ internal control over financial reporting as of July 1, 2023, based on criteria established in Internal Control—Integrated Framework issued by the Committee of Sponsoring Organizations of the Treadway Commission (2013 framework) (the COSO criteria). In our opinion, Sysco Corporation and its Consolidated Subsidiaries (the Company) maintained, in all material respects, effective internal control over financial reporting as of July 1, 2023, based on the COSO criteria.
We also have audited, in accordance with the standards of the Public Company Accounting Oversight Board (United States) (PCAOB), the 2023 consolidated financial statements of the Company and our report dated August 24, 2023, expressed an unqualified opinion thereon.
Basis for Opinion
The Company’s management is responsible for maintaining effective internal control over financial reporting and for its assessment of the effectiveness of internal control over financial reporting included in the accompanying Report of Management on Internal Control over Financial Reporting. Our responsibility is to express an opinion on the Company’s internal control over financial reporting based on our audit. We are a public accounting firm registered with the PCAOB and are required to be independent with respect to the Company in accordance with the U.S. federal securities laws and the applicable rules and regulations of the Securities and Exchange Commission and the PCAOB.
We conducted our audit in accordance with the standards of the PCAOB. Those standards require that we plan and perform the audit to obtain reasonable assurance about whether effective internal control over financial reporting was maintained in all material respects.
Our audit included obtaining an understanding of internal control over financial reporting, assessing the risk that a material weakness exists, testing and evaluating the design and operating effectiveness of internal control based on the assessed risk, and performing such other procedures as we considered necessary in the circumstances. We believe that our audit provides a reasonable basis for our opinion.
Definition and Limitations of Internal Control Over Financial Reporting
A company’s internal control over financial reporting is a process designed to provide reasonable assurance regarding the reliability of financial reporting and the preparation of financial statements for external purposes in accordance with generally accepted accounting principles. A company’s internal control over financial reporting includes those policies and procedures that (1) pertain to the maintenance of records that, in reasonable detail, accurately and fairly reflect the transactions and dispositions of the assets of the company; (2) provide reasonable assurance that transactions are recorded as necessary to permit preparation of financial statements in accordance with generally accepted accounting principles, and that receipts and expenditures of the company are being made only in accordance with authorizations of management and directors of the company; and (3) provide reasonable assurance regarding prevention or timely detection of unauthorized acquisition, use, or disposition of the company’s assets that could have a material effect on the financial statements.
Because of its inherent limitations, internal control over financial reporting may not prevent or detect misstatements. Also, projections of any evaluation of effectiveness to future periods are subject to the risk that controls may become inadequate because of changes in conditions, or that the degree of compliance with the policies or procedures may deteriorate.
/s/ Ernst & Young LLP
Houston, Texas
August 24, 2023
REPORT OF INDEPENDENT REGISTERED PUBLIC ACCOUNTING FIRM
To the Shareholders and the Board of Directors of Sysco Corporation
Opinion on the Financial Statements
We have audited the accompanying consolidated balance sheets of Sysco Corporation and its Consolidated Subsidiaries (the Company) as of July 1, 2023 and July 2, 2022, the related consolidated results of operations, statements of comprehensive income, changes in shareholders’ equity and cash flows for each of the three years in the period ended July 1, 2023 and the related notes (collectively referred to as the “consolidated financial statements”). In our opinion, the consolidat
Showing the first 8K of 255K characters. Open the full section
Item 9. Changes in and Disagreements with Accountants on Accounting and Financial Disclosure
None.
Item 9A. Controls and Procedures
Sysco’s management, with the participation of our Chief Executive Officer and Chief Financial Officer, evaluated the effectiveness of our disclosure controls and procedures as of July 1, 2023. The term “disclosure controls and procedures,” as defined in Rules 13a-15(e) and 15d-15(e) under the Exchange Act, means controls and other procedures of a company that are designed to ensure that information required to be disclosed by a company in the reports that it files or submits under the Exchange Act is recorded, processed, summarized and reported, within the time periods specified in the Securities and Exchange Commission’s rules and forms. Disclosure controls and procedures include, without limitation, controls and procedures designed to ensure that information required to be disclosed by a company in the reports that it files or submits under the Exchange Act is accumulated and communicated to the company’s management, including its principal executive and principal financial officers, as appropriate to allow timely decisions regarding the required disclosure. Management recognizes that any controls and procedures, no matter how well designed and operated, can provide only reasonable assurance of achieving their objectives and management necessarily applies its judgment in evaluating the cost-benefit relationship of possible controls and procedures. Sysco’s disclosure controls and procedures have been designed to provide reasonable assurance of achieving their objectives. Based on the evaluation of our disclosure controls and procedures as of July 1, 2023, our Chief Executive Officer and Chief Financial Officer concluded that, as of such date, Sysco’s disclosure controls and procedures were effective at the reasonable assurance level.
Management’s report on internal control over financial reporting is included in Item 8. Financial Statements and Supplementary Data of this Annual Report on Form 10-K.
There have been no changes in our internal control over financial reporting (as that term is defined in Rules 13a-15(f) and 15d-15(f) under the Exchange Act) that occurred during the fourth quarter ended July 1, 2023, that have materially affected, or are reasonably likely to materially affect, our internal control over financial reporting.
Item 9B. Other Information
Insider Trading Arrangements and Policies
The table below shows the outstanding plans or other arrangements (each, a (Plan)) providing for the purchase and/or sale of Sysco securities by Sysco’s directors and Section 16 officers, including those Plans adopted or terminated during the quarter ended July 1, 2023:
| Name | Title | Action | Date | Trading Arrangement | Number of Securities Converted | Expiration Date (4) | |||||||||||||||||
| Rule 10b5-1 (1) | Non-Rule 10b5-1 (2) | ||||||||||||||||||||||
| Kevin Hourican | President and Chief Executive Officer | Adopt | May 4, 2023 | x | 75,019 shares to be sold | Mar. 1, 2024 | |||||||||||||||||
| Greg Bertrand | Executive Vice President, US Foodservice Operations | Adopt | Feb. 15, 2023 | x | 92,145 shares to be sold (3) | Dec. 31, 2024 | |||||||||||||||||
| Neil Russell | Senior Vice President, Corporate Affairs and Chief Administrative Officer | Adopt | Feb. 14, 2023 | x | 1,056 shares to be sold 1,000 shares to be acquired and held upon the exercise of vested stock options | Dec. 29, 2023 | |||||||||||||||||
| Scott Stone | Vice President, Financial Reporting and Interim Chief Accounting Officer | Adopt | Feb. 6, 2023 | x | 21,884 shares to be sold | Mar. 7, 2024 |
| (1) | Intended to satisfy the affirmative defense conditions of SEC Rule 10b5-1(c). | ||||
| (2) | Non-Rule Rule 10b5-1 trading arrangement as defined in Item 408 of Regulation S-K. | ||||
| (3) | The shares reported for Mr. Bertrand include 3,444 shares directly held by Mr. Bertrand’s children and covered under three separate trading plans with identical adoption and expiration dates. | ||||
| (4) | Each Plan terminates on the earlier of: (i) the expiration date listed in the table above; (ii) the first date on which all trades set forth in the Plan have been executed; or (iii) such date the Plan is otherwise terminated according to its terms. |
Item 9C. Disclosure Reporting Regarding Foreign Jurisdictions that Prevent Inspections
Not applicable.
PART III
Item 10. Directors, Executive Officers and Corporate Governance
The information required by this item will be included in our proxy statement for the 2023 Annual Meeting of Stockholders under the following captions, and is incorporated herein by reference thereto: “Corporate Governance,” “Executive Officers,” “Delinquent Section 16(a) Reports,” “Report of the Audit Committee” and “Board of Directors Matters.”
Item 11. Executive Compensation
The information required by this item will be included in our proxy statement for the 2023 Annual Meeting of Stockholders under the following captions, and is incorporated herein by reference thereto: “Compensation Discussion and Analysis,” “Report of the Compensation and Leadership Development Committee,” “Director Compensation” and “Executive Compensation.”
Item 12. Security Ownership of Certain Beneficial Owners and Management and Related Stockholder Matters
The information required by this item will be included in our proxy statement for the 2023 Annual Meeting of Stockholders under the following captions, and is incorporated herein by reference thereto: “Stock Ownership” and “Equity Compensation Plan Information.”
Item 13. Certain Relationships and Related Transactions, and Director Independence
The information required by this item will be included in our proxy statement for the 2023 Annual Meeting of Stockholders under the following caption, and is incorporated herein by reference thereto: “Corporate Governance – Certain Relationships and Related Person Transactions” and “Corporate Governance – Director Independence.”
Item 14. Principal Accountant Fees and Services
The information required by this item will be included in our proxy statement for the 2023 Annual Meeting of Stockholders under the following caption, and is incorporated herein by reference thereto: “Fees Paid to Independent Registered Public Accounting Firm.”
PART IV
Item 15. Exhibit and Financial Statement Schedules
(a)The following documents are filed, or incorporated by reference, as part of this Form 10-K:
1.All financial statements. See Index to Consolidated Financial Statements of this Form 10-K.
2.All financial statement schedules are omitted because they are not applicable or the information is set forth in the consolidated financial statements or notes thereto within Item 8. Financial Statements and Supplementary Data.
3.Exhibits.
The exhibits listed on the Exhibit Index below are filed or furnished as part of this Annual Report on Form 10-K.
EXHIBIT INDEX
Exhibits.
† Executive Compensation Arrangement pursuant to 601(b)(10)(iii)(A) of Regulation S-K
Filed Herewith
Note: Debt instruments of Sysco Corporation and its subsidiaries defining the rights of long-term debt holders in principal amounts not exceeding 10% of Sysco Corporation’s consolidated assets have been omitted and will be provided to the Securities and Exchange Commission upon request.
Item 16. Form 10-K Summary
None.
SIGNATURES
Pursuant to the requirements of Section 13 or 15(d) of the Securities Exchange Act of 1934, Sysco Corporation has duly caused this Form 10-K to be signed on its behalf by the undersigned, thereunto duly authorized, on this 24th day of August 2023.
| SYSCO CORPORATION | |||||
| By: | /s/ KEVIN P. HOURICAN | ||||
| Kevin P. Hourican | |||||
| President and Chief Executive Officer |
Pursuant to the requirements of the Securities Exchange Act of 1934, this report has been signed below by the following persons on behalf of Sysco Corporation in the capacities indicated and on the date indicated above.
PRINCIPAL EXECUTIVE, FINANCIAL & ACCOUNTING OFFICERS:
| /s/ KEVIN P. HOURICAN | President and Chief Executive Officer | ||||
| Kevin P. Hourican | (principal executive officer) | ||||
| /s/ KENNY K. CHEUNG | Executive Vice President and Chief Financial Officer | ||||
| Kenny K. Cheung | (principal financial officer) | ||||
| /s/ SCOTT B. STONE | Vice President of Financial Reporting and Interim Chief Accounting Officer | ||||
| Scott B. Stone | (principal accounting officer) | ||||
DIRECTORS:
| /s/ DANIEL J. BRUTTO | /s/ KEVIN P. HOURICAN | ||||
| Daniel J. Brutto | Kevin P. Hourican | ||||
| /s/ ALI DIBADJ | /s/ HANS-JOACHIM KOERBER | ||||
| Ali Dibadj | Hans-Joachim Koerber | ||||
| /s/ LARRY C. GLASSCOCK | /s/ ALISON KENNEY PAUL | ||||
| Larry C. Glasscock | Alison Kenney Paul | ||||
| /s/ JILL M. GOLDER | /s/ EDWARD D. SHIRLEY | ||||
| Jill M. Golder | Edward D. Shirley | ||||
| /s/ BRADLEY M. HALVERSON | /s/ SHEILA G. TALTON | ||||
| Bradley M. Halverson | Sheila G. Talton | ||||
| /s/ JOHN M. HINSHAW | |||||
| John M. Hinshaw |