 filings.tools
Item 5. MARKET FOR REGISTRANT'S COMMON EQUITY, RELATED STOCKHOLDER MATTERS AND ISSUER PURCHASES OF EQUITY SECURITIES
9K characters. Original on sec.gov · Markdown
Item 5. MARKET FOR REGISTRANT'S COMMON EQUITY, RELATED STOCKHOLDER MATTERS AND ISSUER PURCHASES OF EQUITY SECURITIES
Our Class A common stock and Class B common stock trade on the New York Stock Exchange under the symbols "TAP.A" and "TAP," respectively. In addition, the Class A exchangeable shares and Class B exchangeable shares of our indirect subsidiary, Molson Coors Canada Inc., trade on the Toronto Stock Exchange under the symbols "TPX.A" and "TPX.B," respectively. The Class A and B exchangeable shares are a means for shareholders to defer tax in Canada and have substantially the same economic and voting rights as the respective common shares. The exchangeable shares can be exchanged for our Class A or B common stock at any time and at the exchange ratios described in the Merger documents, and receive the same dividends. At the time of exchange, shareholders' taxes are due. The exchangeable shares have voting rights through special voting shares held by a trustee.
The approximate number of record security holders by class of stock at February 9, 2017, is as follows:
| Title of class | Number of record security holders | |
| Class A common stock, $0.01 par value | 22 | |
| Class B common stock, $0.01 par value | 2,771 | |
| Class A exchangeable shares, no par value | 231 | |
| Class B exchangeable shares, no par value | 2,431 |
The following table sets forth the high and low sales prices per share of our Class A common stock for each quarter of 2016 and 2015 as reported by the New York Stock Exchange, as well as dividends paid in such quarter.
| High | Low | Dividends | |||||||||
| 2016 | |||||||||||
| First quarter | $ | 93.87 | $ | 81.97 | $ | 0.41 | |||||
| Second quarter | $ | 103.78 | $ | 91.85 | $ | 0.41 | |||||
| Third quarter | $ | 110.17 | $ | 91.86 | $ | 0.41 | |||||
| Fourth quarter | $ | 109.99 | $ | 95.07 | $ | 0.41 | |||||
| 2015 | |||||||||||
| First quarter | $ | 94.50 | $ | 78.75 | $ | 0.41 | |||||
| Second quarter | $ | 88.26 | $ | 71.00 | $ | 0.41 | |||||
| Third quarter | $ | 83.84 | $ | 65.50 | $ | 0.41 | |||||
| Fourth quarter | $ | 96.00 | $ | 78.50 | $ | 0.41 |
The following table sets forth the high and low sales prices per share of our Class B common stock for each quarter of 2016 and 2015 as reported by the New York Stock Exchange, as well as dividends paid in such quarter.
| High | Low | Dividends | |||||||||
| 2016 | |||||||||||
| First quarter | $ | 97.00 | $ | 80.78 | $ | 0.41 | |||||
| Second quarter | $ | 104.15 | $ | 91.17 | $ | 0.41 | |||||
| Third quarter | $ | 111.24 | $ | 89.40 | $ | 0.41 | |||||
| Fourth quarter | $ | 112.19 | $ | 94.10 | $ | 0.41 | |||||
| 2015 | |||||||||||
| First quarter | $ | 78.92 | $ | 71.49 | $ | 0.41 | |||||
| Second quarter | $ | 79.14 | $ | 69.70 | $ | 0.41 | |||||
| Third quarter | $ | 85.29 | $ | 64.40 | $ | 0.41 | |||||
| Fourth quarter | $ | 95.74 | $ | 78.17 | $ | 0.41 |
The following table sets forth the high and low sales prices per share of our Class A exchangeable shares for each quarter of 2016 and 2015 as reported by the Toronto Stock Exchange, as well as dividends paid in such quarter.
| High | Low | Dividends | |||||||||
| 2016 | |||||||||||
| First quarter | CAD | 126.34 | CAD | 116.00 | $ | 0.41 | |||||
| Second quarter | CAD | 130.84 | CAD | 121.82 | $ | 0.41 | |||||
| Third quarter | CAD | 137.84 | CAD | 120.00 | $ | 0.41 | |||||
| Fourth quarter | CAD | 140.00 | CAD | 128.20 | $ | 0.41 | |||||
| 2015 | |||||||||||
| First quarter | CAD | 94.75 | CAD | 85.01 | $ | 0.41 | |||||
| Second quarter | CAD | 99.08 | CAD | 88.85 | $ | 0.41 | |||||
| Third quarter | CAD | 110.60 | CAD | 88.20 | $ | 0.41 | |||||
| Fourth quarter | CAD | 125.64 | CAD | 113.03 | $ | 0.41 |
The following table sets forth the high and low sales prices per share of our Class B exchangeable shares for each quarter of 2016 and 2015 as reported by the Toronto Stock Exchange, as well as dividends paid in such quarter.
| High | Low | Dividends | |||||||||
| 2016 | |||||||||||
| First quarter | CAD | 129.87 | CAD | 114.90 | $ | 0.41 | |||||
| Second quarter | CAD | 133.94 | CAD | 118.13 | $ | 0.41 | |||||
| Third quarter | CAD | 145.51 | CAD | 120.02 | $ | 0.41 | |||||
| Fourth quarter | CAD | 147.85 | CAD | 125.01 | $ | 0.41 | |||||
| 2015 | |||||||||||
| First quarter | CAD | 98.25 | CAD | 84.95 | $ | 0.41 | |||||
| Second quarter | CAD | 99.98 | CAD | 86.79 | $ | 0.41 | |||||
| Third quarter | CAD | 112.28 | CAD | 86.14 | $ | 0.41 | |||||
| Fourth quarter | CAD | 132.44 | CAD | 103.56 | $ | 0.41 |
PERFORMANCE GRAPH
The following graph compares our cumulative total stockholder return over the last five fiscal years with the Standard and Poor's 500 Index® ("S&P 500") and a customized index including MCBC, ABI, Carlsberg, Heineken and Asahi (the "Peer Group"). We have used a weighted-average based on market capitalization to determine the return for the Peer Group. The graph assumes $100 was invested on December 31, 2011 (the last trading day of our 2011 fiscal year) in our Class B common stock, the S&P 500 and the Peer Group, and assumes reinvestment of all dividends. SABMiller was included in the Peer Group in previous filings; however, SABMiller was removed from the Peer Group because it was acquired by ABI in October 2016, and SABMiller is no longer a public company. The below is provided for informational purposes and is not indicative of future performance.
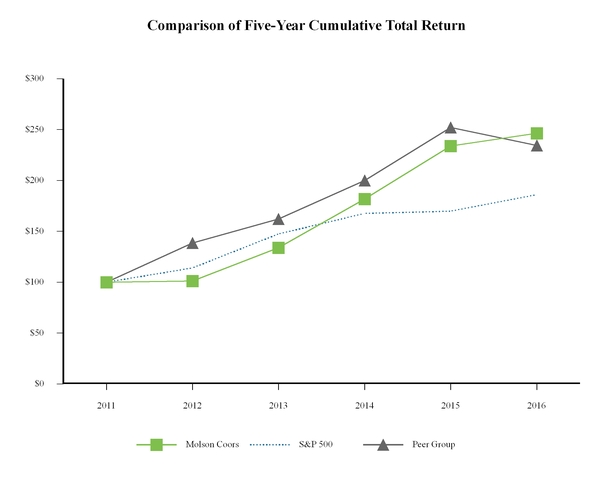
| 2011 | 2012 | 2013 | 2014 | 2015 | 2016 | ||||||||||||||||||
| Molson Coors | $ | 100.00 | $ | 101.14 | $ | 133.88 | $ | 181.68 | $ | 233.89 | $ | 246.43 | |||||||||||
| S&P 500 | $ | 100.00 | $ | 114.07 | $ | 147.26 | $ | 167.41 | $ | 169.70 | $ | 185.89 | |||||||||||
| Peer Group | $ | 100.00 | $ | 138.51 | $ | 162.24 | $ | 199.87 | $ | 251.93 | $ | 234.26 |
Dividends
As a result of the Acquisition, we plan to maintain our current quarterly dividend of $0.41 per share as we pay down debt, and we will revisit our dividend policy once deleveraging is well underway.
Issuer Purchases of Equity Securities
In February 2015, we announced that our board of directors approved and authorized a new program to repurchase up to $1.0 billion of our Class A and Class B common stock. As a result of the Acquisition, we suspended the share repurchase program and thus, there were no shares of Class A or Class B common stock repurchased in 2016. Under the program, shares may be repurchased in privately negotiated and/or open market transactions, including under plans complying with Rule
10b5-1 under the Exchange Act. The number, price and timing of the repurchases will be at the Company’s sole discretion and will be evaluated depending on market conditions, liquidity needs or other factors. The Company’s board of directors may suspend, modify or terminate the share repurchase program at any time without prior notice.
Previous: Item 4. MINE SAFETY DISCLOSURES · Next: Item 6. SELECTED FINANCIAL DATA