 filings.tools
Item 7. MANAGEMENT'S DISCUSSION AND ANALYSIS OF FINANCIAL CONDITION AND RESULTS OF OPERATIONS
128K characters. Original on sec.gov · Markdown
Item 7. MANAGEMENT'S DISCUSSION AND ANALYSIS OF FINANCIAL CONDITION AND RESULTS OF OPERATIONS
The following Management's Discussion and Analysis of Financial Condition and Results of Operations ("MD&A") is provided to assist in understanding our company, operations and current business environment and should be considered a supplement to, and read in conjunction with, the accompanying consolidated financial statements and notes included within Part II—Item 8 Financial Statements and Supplementary Data, as well as the discussion of our business and related risk factors in Part I—Item 1 Business and Part I—Item 1A Risk Factors, respectively. See also "Cautionary Statement Pursuant to Safe Harbor Provisions of the Private Securities Litigation Reform Act of 1995".
A discussion related to the results of operations and changes in financial condition for 2018 compared to 2017 has been omitted from this report, unless significant, but may be found in Part II, Item 7. Management's Discussion and Analysis of Financial Condition and Results of Operations in our fiscal 2018 Form 10-K, filed with the SEC on February 12, 2019, which is available free of charge on the SEC’s website at www.sec.gov and our corporate website at www.molsoncoors.com.
Our Fiscal Year
Unless otherwise indicated, (a) all $ amounts are in USD, (b) comparisons are to comparable prior periods and (c) 2019, 2018 and 2017 refers to the 12 months ended December 31, 2019, December 31, 2018 and December 31, 2017, respectively.
Operational Measures
We have certain operational measures, such as STWs and STRs, which we believe are important metrics. STW is a metric that we use in our business to reflect the sales from our operations to our direct customers, generally wholesalers. We believe the STW metric is important because it gives an indication of the amount of beer and adjacent products that we have produced and shipped to customers. STR is a metric that we use in our business to refer to sales closer to the end consumer than STWs, which generally means sales from our wholesalers or our Company to retailers, who in turn sell to consumers. We believe the STR metric is important because, unlike STWs, it provides the closest indication of the performance of our brands in relation to market and competitor sales trends.
Executive Summary
We are one of the world's largest brewers and have a diverse portfolio of owned and partner brands, including global priority brands Blue Moon, Coors Banquet, Coors Light, Miller Genuine Draft, Miller Lite, and Staropramen, regional champion brands Carling, Molson Canadian and other leading country-specific brands*,* as well as craft and specialty beers such as Creemore Springs, Cobra, Sharp's Doom Bar, Henry's Hard and Leinenkugel's. With centuries of brewing heritage, we craft high-quality, innovative beverages with the purpose of uniting people to celebrate all life’s moments. As a business, our ambition is to be the first choice for our people, our consumers and our customers, and our success depends on our ability to make our products available to meet a wide range of consumer segments and occasions.
Revitalization Plan
On October 28, 2019, we initiated a revitalization plan designed to allow us to invest across our portfolio to drive long-term, sustainable success. As part of this plan, we expect to accelerate investments behind our largest brands, by focusing on recruitment of consumers and by driving relevance with breakthrough marketing and innovating on core brands to attract new legal age drinkers. We additionally plan to invest significantly in the above premium segment, the fastest growing area of the beer industry, with added investment in existing brands, new innovations and potentially through new acquisitions. We expect to invest more in whitespace and beyond beer opportunities. We have had success in the above premium segment, including portfolio transformation in Europe, Peroni growth accelerating and Blue Moon Belgian White improving in the U.S. and Belgian Moon growing in Canada. However, our revitalization plan is designed to give us the resources we need to invest in our core brands and build in the above premium segment through innovation and potential acquisition and investments, including more investment behind brands like Saint Archer Gold, Blue Moon Light Sky, and Coors Pure in the U.S. and Coors Slice and Molson Ultra in Canada. We also intend to expand a “test and learn” approach that allows us to determine market potential for products and then quickly scale up as we are with Movo wine spritzers, and Saint Archer Gold, both expected to be available nationally in the U.S. in 2020. We also expect this plan will allow us to invest behind an even stronger second year of Cape Line sparkling cocktails and a stronger third year of Arnold Palmer Spiked in the U.S. Finally, our pipeline includes the recent introductions of La Colombe hard coffee in the U.S., Pip & Wild premium ciders in the U.K., and Vizzy hard seltzer in the U.S., which we plan to launch early in 2020, and Truss’s expected new line of cannabis-infused non-alcoholic beverages in Canada, subject to and after all of its licenses and regulatory clearances have been obtained, including the recently announced Flow Glow, a CBD-infused spring water.
We also expect to put a greater focus on bringing new beverages to the market faster and with more precision. This includes expanding the model that has reduced the time it takes to bring innovations to market from 18 months to as little as four months in the U.S., and expanding our previously mentioned “test and learn” approach that evaluates market potential for products and then quickly scales up. As part of the revitalization plan, we also intend to invest in improving our digital competencies, expanding data resources and building out innovation systems.
To make these new investments possible, we plan to unlock approximately $150 million in annual savings, increasing our 2020-2022 cost savings program from $450 million to $600 million, by simplifying our structure.
We also made the determination to establish Chicago, Illinois as our North American operational headquarters, close our existing office in Denver, Colorado and consolidate certain administrative functions into our other existing office locations. Effective January 2020, we moved from a corporate center and four business units to two business units - North America and Europe. The North America business unit consolidates the United States, Canada and corporate center, enabling us to move more quickly with an integrated portfolio strategy. The Europe business unit allows for standalone operations, developed and supported by a European-based team, including a local leadership, commercial, supply chain and support functions. The existing International team was reconstituted to more effectively grow our global brands - with the Africa and Asia Pacific businesses reporting into the European business unit and the remaining International business reporting into the North America business unit. The change in structure to two business units and the resulting financial reporting segment changes will not be reflected until our first quarter 2020 results.
In connection with these consolidation activities, certain impacted employees have been extended an opportunity to continue their employment with the Company in the new organization and locations and, for those not continuing with the Company, certain of such employees have been asked to provide transition assistance and offered severance and retention packages in connection with their termination of service. After taking into account all changes in each of the business units, including Europe, the plan is expected to reduce employment levels, in aggregate, by approximately 500 to 600 employees globally. The company expects the costs associated with the restructuring to be substantially recognized by the end of fiscal year 2021.
Further, we currently expect to incur certain cash and non-cash restructuring charges related to employee relocation, severance, retention and transition costs, non-cash asset related costs, lease exit costs in connection with our office lease in Denver, Colorado, and other transition activities estimated in the range of approximately $120 million to $180 million in the aggregate, the majority of which will be cash charges that we began recognizing in the fourth quarter of 2019, and will be further spread through the balance of fiscal years 2020 and 2021. In 2019, we recognized aggregate impairment losses of $2.1 million related to the closure of the Denver, Colorado office facility. Additionally, in 2019 we recognized severance and retention charges of $41.2 million, of which, approximately $40 million remained accrued as of December 31, 2019. We recognized these charges as special items within our consolidated statements of operations. See Part II—Item 8 Financial Statements and Supplementary Data, “Note 7, Special Items” for additional details. Actual severance and retention costs related to this restructuring, which are primarily being recognized ratably over the employees’ required future service period, may differ from original estimates based on actual employee turnover levels prior to achieving severance and retention eligibility requirements. Employee relocation charges are recognized in the period incurred and were immaterial in 2019.
We also changed our name to Molson Coors Beverage Company in January 2020 in order to better reflect our strategic intent to expand beyond beer and into other growth adjacencies.
In addition to the revitalization plan, we intend to continue our ongoing efforts to modernize our brewery footprint and invest several hundred million dollars to modernize our brewery in Golden, Colorado over the next several years. These previously planned brewery investments are intended to allow for more flexible capacity to better meet demand and fulfill future growth opportunities, while increasing supply chain efficiency.
Summary of Consolidated Results of Operations
The following table highlights summarized components of our consolidated statements of operations for the years ended December 31, 2019, December 31, 2018, and December 31, 2017. See Part II—Item 8 Financial Statements and Supplementary Data, “Consolidated Statements of Operations” for additional details of our U.S. GAAP results.
| For the years ended | |||||||||||||||||
| December 31, 2019 | Change | December 31, 2018 | Change | December 31, 2017 | |||||||||||||
| (In millions, except percentages and per share data) | |||||||||||||||||
| Financial volume in hectoliters | 92.722 | (4.0 | )% | 96.627 | (2.9 | )% | 99.563 | ||||||||||
| Net sales | $ | 10,579.4 | (1.8 | )% | $ | 10,769.6 | (2.1 | )% | $ | 11,002.8 | |||||||
| Net income (loss) attributable to MCBC | $ | 241.7 | (78.4 | )% | $ | 1,116.5 | (28.7 | )% | $ | 1,565.6 | |||||||
| Net income (loss) attributable to MCBC per diluted share | $ | 1.11 | (78.4 | )% | $ | 5.15 | (28.8 | )% | $ | 7.23 |
2019 Financial Highlights
| • | In 2019, net income attributable to MCBC decreased 78.4% compared to the prior year primarily driven by the impact of aggregate goodwill and intangible asset impairment losses of $691.9 million, primarily related to our Canada reporting unit. The decrease was also due to lower volume, inflation, restructuring charges and pension and postretirement benefit charges, partially offset by positive global pricing, cost savings, lower incentive compensation, as well as lower interest expense. |
| • | During 2019, we repaid our EUR 500 million variable rate notes, $500 million 1.90% notes, and $500 million 1.45% notes upon their respective maturities throughout the year as part of our deleveraging commitment. |
| • | We generated cash flow from operating activities of approximately $1.9 billion, representing an 18.6% decrease from approximately $2.3 billion in 2018. The decrease in operating cash flow in 2019 compared to 2018 is primarily driven by cycling the proceeds received during the first quarter of 2018 of $328.0 million related to the Adjustment Amount (as defined and further discussed in Part II—Item 8 Financial Statements and Supplementary Data, Note 7, "Special Items") related to the settlement agreement between MCBC and ABI, as well as lower net income adjusted for non-cash add backs and higher cash paid for taxes, partially offset by favorable changes in working capital and lower interest paid. |
| • | Regional financial highlights: |
| • | In the U.S. segment, income before income taxes decreased 1.4% to $1,301.8 million in 2019, versus $1,320.7 million in 2018, primarily driven by lower volume and cost inflation, partially offset by higher net pricing, cycling special charges in the prior year related to restructuring, and cost savings. During the year we grew our share of the premium light segment with Miller Lite, which completed its twenty-first consecutive quarter of increased segment share, and Coors Light, which completed its third consecutive quarter of increased segment share, according to Nielsen. In above premium, we successfully launched Cape Line which was among the industry’s top new franchises in the flavored malt beverage category, according to Nielsen, and we also introduced Sol Chelada which drove double-digit volume growth in the Sol Franchise. Blue Moon remained the number one national craft brand in the U.S. and held industry share. Additionally, Peroni grew volume for the twenty-first consecutive quarter with growth accelerating significantly in 2019 with support of the brand's first national marking campaign. |
| • | In our Canada segment, we reported a loss before income taxes of $508.7 million in 2019, versus income of $157.0 million in 2018, primarily driven by the $668.3 million goodwill impairment loss recognized in the third quarter of 2019 as well as the gross profit impacts of volume declines, higher cost of goods sold per hectoliter, Truss joint venture start-up costs, partially offset by positive pricing and lower incentive compensation. See Part II—Item 8 Financial Statements and Supplementary Data, Note 10, “Goodwill and Intangible Assets” for additional details. |
| • | In our Europe segment, income before income taxes decreased 14.1% to $160.1 million in 2019, versus $186.4 million in 2018, primarily related to increased brand investments, unfavorable foreign currency movements, special charges mainly due to restructuring activities, as well as soft industry demand and inflation, partially offset by positive net pricing and mix and lower incentive compensation. |
| • | Our International segment reported a loss before income taxes of $7.7 million in 2019, compared to a loss of $2.7 million in the prior year, primarily driven by higher special charges due to an aggregate impairment loss of $12.2 million related to our India business along with lower volume and negative geographic mix, partially offset by lower marketing, general and administrative expense and shifting to local production in Mexico. |
| • | Brand highlights: |
| • | Global priority brand volume decreased 2.2% in 2019 versus 2018, due to declines across the U.S., Canada, and International partially offset by growth in Europe. |
| • | Blue Moon Belgian White global brand volume increased 1.1% in 2019 versus 2018, driven by growth in Canada, International and Europe, partially offset by declines in the U.S. |
| • | Carling brand volume in Europe decreased by 4.8% versus 2018, due to lower volumes in the U.K., the brand's primary market. |
| • | Coors global brand volume - Coors Light global brand volume decreased 4.6% in 2019 versus 2018. The overall volume decrease was primarily driven by lower brand volume in the U.S., International, and Canada, partially offset by growth in Europe. Volumes in the U.S. were lower than prior year, although Coors Light gained share of the U.S. premium light segment for the third consecutive quarter. The declines in International were driven by competitive pressures in Mexico along with economic decline in Puerto Rico. The declines in Canada are primarily the result of industry declines due to ongoing competitive pressures in Quebec and Ontario. Coors Banquet global brand volume decreased 2.6% in 2019 versus 2018, driven by the U.S. and Canada, partially offset by the introduction of Coors Original in International markets. |
| • | Miller global brand volume - Miller Lite global brand volumes were flat in 2019 versus 2018, primarily driven by declines in the U.S., partially offset by growth in Canada and International. However, Miller Lite gained share of the U.S. premium light segment for the twenty-first consecutive quarter. Miller Genuine Draft global brand volume decreased 6.9% in 2019 versus 2018, due to decreases in all segments. |
| • | Molson Canadian brand volume in Canada decreased 8.9% during 2019 versus the prior year, primarily driven by industry declines as well as share declines due to competitive pressures in the West and Ontario. |
| • | Staropramen global brand volume, including royalty volume, increased 7.2% during 2019 versus 2018, driven by higher volumes in all major markets for the brand. |
Worldwide Brand Volume
Worldwide brand volume (or "brand volume" when discussed by segment) reflects owned brands sold to unrelated external customers within our geographic markets, net of returns and allowances, royalty volume and an adjustment from STWs to STRs calculated consistently with MCBC owned volume. Contract brewing and wholesaler volume is removed from worldwide brand volume as this is non-owned volume for which we do not directly control performance. We believe this definition of worldwide brand volume more closely aligns with how we measure the performance of our owned brands within the markets in which they are sold. Financial volume represents owned brands sold to unrelated external customers within our geographical markets, net of returns and allowances as well as contract brewing, wholesale non-owned brand volume and company-owned distribution volume. Royalty volume consists of our brands produced and sold by third parties under various license and contract-brewing agreements and because this is owned volume, it is included in worldwide brand volume. The adjustment from STWs to STRs provides the closest indication of the performance of our owned brands in relation to market and competitor sales trends, as it reflects sales volume one step closer to the end consumer and generally means sales from our wholesalers or our company to retailers.
| For the years ended | ||||||||||||||
| December 31, 2019 | Change | December 31, 2018 | Change | December 31, 2017 | ||||||||||
| (In millions, except percentages) | ||||||||||||||
| Volume in hectoliters: | ||||||||||||||
| Financial volume | 92.722 | (4.0 | )% | 96.627 | (2.9 | )% | 99.563 | |||||||
| Less: Contract brewing and wholesaler volume | (7.715 | ) | (5.7 | )% | (8.182 | ) | (4.9 | )% | (8.602 | ) | ||||
| Add: Royalty volume | 4.226 | 4.2 | % | 4.054 | 10.0 | % | 3.685 | |||||||
| Add: STW to STR adjustment | (0.287 | ) | (19.8 | )% | (0.358 | ) | (47.9 | )% | (0.687 | ) | ||||
| Total worldwide brand volume | 88.946 | (3.5 | )% | 92.141 | (1.9 | )% | 93.959 |
Our worldwide brand volume decreased in 2019 compared to 2018, primarily due to lower volume in all segments primarily driven by challenging industry dynamics.
Net Sales Drivers
The following table highlights the drivers of change in net sales for the year ended December 31, 2019 versus December 31, 2018, by segment (in percentages) and excludes Corporate net sales revenue for our water resources and energy operations in the state of Colorado.
| Volume | Price, Product and Geography Mix | Currency | Other | Total | ||||||||||
| Consolidated | (4.0 | )% | 3.6 | % | (1.2 | )% | (0.2 | )% | (1.8 | )% | ||||
| U.S. | (4.2 | )% | 4.1 | % | — | % | (0.2 | )% | (0.3 | )% | ||||
| Canada | (5.8 | )% | 1.9 | % | (2.1 | )% | (0.1 | )% | (6.1 | )% | ||||
| Europe | (2.8 | )% | 4.0 | % | (4.8 | )% | (0.1 | )% | (3.7 | )% | ||||
| International | (15.7 | )% | 7.9 | % | (0.9 | )% | (1.2 | )% | (9.9 | )% |
The following table highlights the drivers of change in net sales on a reported basis for the year ended December 31, 2018 versus December 31, 2017, by segment (in percentages) and excludes Corporate net sales revenue for our water resources and energy operations in the state of Colorado.
| Volume | Price, Product and Geography Mix | Currency | Other**(1)** | Total | ||||||||||
| Consolidated | (2.9 | )% | 0.7 | % | 0.5 | % | (0.4 | )% | (2.1 | )% | ||||
| U.S. | (5.1 | )% | 1.9 | % | — | % | (0.1 | )% | (3.3 | )% | ||||
| Canada | (2.9 | )% | (1.6 | )% | — | % | — | % | (4.5 | )% | ||||
| Europe | 2.1 | % | 0.4 | % | 3.3 | % | (2.6 | )% | 3.2 | % | ||||
| International | (7.5 | )% | 3.5 | % | (1.3 | )% | — | % | (5.3 | )% |
| (1) | Europe "Other" column includes the release of an indirect tax provision in 2017. |
Adoption of Revenue Recognition Guidance
On January 1, 2018, we adopted the FASB's new accounting pronouncement related to revenue recognition using the modified retrospective approach, therefore, prior period results were not restated. Results for the years ended December 31, 2019 and 2018 are presented under the new guidance, while the year ended December 31, 2017 is reported in accordance with historical accounting guidance. The adoption of this guidance in 2018 did not have a significant impact to our core revenue generating activities, however, resulted in the reclassification of certain cash payments to customers from marketing, general and administrative expenses to a reduction of revenue. This classification change resulted in a reduction of revenue and marketing, general and administrative expenses by approximately $60 million during 2018 versus 2017, primarily within our Canada segment. The adoption of this guidance also resulted in a change in the timing of recognition of certain promotional discounts and cash payments to customers, which shifted financial statement recognition primarily amongst quarters, however, the full-year impact was not significant to our financial results. See Part II—Item 8 Financial Statements and Supplementary Data, Note 1, "Basis of Presentation and Summary of Significant Accounting Policies" for additional details.
Cost Savings Initiatives
Total cost savings in 2019 exceeded our targets and totaled approximately $230 million, resulting in a total of approximately $725 million of cost savings delivered over the course of the 2017 to 2019 program.
Depreciation and Amortization
Depreciation and amortization expense was $859.0 million in 2019, an increase of $1.5 million compared to 2018, primarily driven by incremental accelerated depreciation related to brewery closures largely offset by impacts of foreign exchange movements.
Income Taxes
| For the years ended | ||||||||
| December 31, 2019 | December 31, 2018 | December 31, 2017 | ||||||
| Effective tax rate | 49 | % | 17 | % | (15 | )% |
The increase in the effective income tax rate for 2019 versus 2018 is primarily driven by the $668.3 million impairment loss attributable to nondeductible goodwill of our Canada reporting unit, increased valuation allowances, the recognition of other one-time tax expenses in 2019, as well as cycling one-time tax benefits in 2018. The increase in the effective income tax rate for 2018 versus 2017 was primarily driven by the one-time impacts of the 2017 Tax Act recognized when enacted in 2017, most notably the remeasurement of our deferred taxes from the reduction in the U.S. statutory federal corporate income tax rate.
Our tax rate is volatile and may increase or decrease with changes in, among other things, the amount and source of income or loss, our ability to utilize foreign tax credits, excess tax benefits or deficiencies from share-based compensation, changes in tax laws, and the movement of liabilities established pursuant to accounting guidance for uncertain tax positions as statutes of limitations expire, positions are effectively settled, or when additional information becomes available. There are proposed or pending tax law changes in various jurisdictions in which we do business that, if enacted, may have an impact on our effective tax rate.
Since 2018, the U.S. Department of Treasury has continued to issue proposed, temporary and final regulations to implement provisions of the 2017 Tax Act. We have continued to monitor these and while temporary and final regulations have not yet resulted in material adverse impacts to us, there are certain proposed regulations, which are not yet considered law, that if finalized as proposed, could result in a material adverse impact on our consolidated financial statements. Specifically, if certain of the proposed regulations are finalized as proposed with full retroactive application to January 1, 2018, then we would be required to recognize estimated income tax expense of approximately $100 million to $200 million upon enactment related to the proposed retroactive period through December 31, 2019, for fiscal years 2018 and 2019. This estimated range contains significant uncertainty and could be impacted by various factors, including any differences between the proposed and ultimately finalized regulations.
See Part II—Item 8 Financial Statements and Supplementary Data, Note 6, "Income Tax" for additional details regarding our effective tax rate.
Results of Operations
United States Segment
| For the years ended | |||||||||||||||||
| December 31, 2019 | Change | December 31, 2018 | Change | December 31, 2017 | |||||||||||||
| (In millions, except percentages) | |||||||||||||||||
| Financial volume in hectoliters(1) | 61.600 | (4.2 | )% | 64.272 | (5.1 | )% | 67.731 | ||||||||||
| Sales(1) | $ | 8,187.0 | (0.6 | )% | $ | 8,234.4 | (3.6 | )% | $ | 8,541.7 | |||||||
| Excise taxes | (945.7 | ) | (3.0 | )% | (974.5 | ) | (5.9 | )% | (1,036.0 | ) | |||||||
| Net sales(1) | 7,241.3 | (0.3 | )% | 7,259.9 | (3.3 | )% | 7,505.7 | ||||||||||
| Cost of goods sold(1) | (4,294.5 | ) | 0.4 | % | (4,277.5 | ) | (1.1 | )% | (4,324.2 | ) | |||||||
| Gross profit | 2,946.8 | (1.2 | )% | 2,982.4 | (6.3 | )% | 3,181.5 | ||||||||||
| Marketing, general and administrative expenses | (1,621.1 | ) | (0.6 | )% | (1,631.3 | ) | (8.5 | )% | (1,782.7 | ) | |||||||
| Special items, net(2) | (26.6 | ) | (29.6 | )% | (37.8 | ) | 147.1 | % | (15.3 | ) | |||||||
| Operating income | 1,299.1 | (1.1 | )% | 1,313.3 | (5.1 | )% | 1,383.5 | ||||||||||
| Interest income (expense), net | 3.0 | (65.9 | )% | 8.8 | (32.8 | )% | 13.1 | ||||||||||
| Other income (expense), net | (0.3 | ) | (78.6 | )% | (1.4 | ) | (41.7 | )% | (2.4 | ) | |||||||
| Income (loss) before income taxes | $ | 1,301.8 | (1.4 | )% | $ | 1,320.7 | (5.3 | )% | $ | 1,394.2 |
| (1) | Includes gross inter-segment sales, purchases, and volumes, which are eliminated in the consolidated totals. |
| (2) | See Part II—Item 8 Financial Statements and Supplementary Data, Note 7, "Special Items" for detail of special items. |
Significant events
Following management approval in December 2019, in January 2020, we announced plans to cease production at our Irwindale, California brewery and entered into an option agreement with Pabst Brewing Company, LLC ("Pabst"), granting Pabst an option to purchase our Irwindale, California brewery, including plant equipment and machinery and the underlying land.
Pursuant to the agreement, Pabst will have 120 days from receipt of the notice of the Irwindale brewery closure from MillerCoors to exercise the option to purchase the Irwindale brewery. If Pabst exercises its option to purchase the Irwindale brewery, the agreement provides (i) the purchase price will be $150 million, subject to adjustment as further specified in the agreement, (ii) the closing will be within six months from Pabst’s exercise of the option, but no earlier than September 1, 2020 and no later than December 31, 2020, subject to the satisfaction of certain customary closing conditions, (iii) for the treatment and allocation of certain liabilities related to the operation of the Irwindale brewery prior to closing, and (iv) for customary representations and warranties and certain post-closing restrictions on Pabst regarding the operations and disposal of the Irwindale brewery. In conjunction with the agreement, MillerCoors and Pabst also executed mutual releases of claims related to their ongoing litigation and agreed to dismiss the litigation with prejudice.
We recorded special charges related to the planned Irwindale brewery closure totaling approximately $16 million in the fourth quarter of 2019, and will continue to incur special charges during each reporting period through the planned closure of the brewery in September 2020. While analysis of the implications of the announced brewery closure remain underway, total special charges associated with the planned closure are currently expected to be approximately $150 million to $175 million, consisting primarily of accelerated depreciation charges. However, this estimated range contains significant uncertainty, and actual results could differ materially from these estimates due to uncertainty regarding the ultimate net cost associated with the disposition of assets, restructuring charges, as well as the overall outcome of the Pabst purchase option, which if exercised, could significantly impact these estimates.
As part of our revitalization plan announced during the fourth quarter of 2019, we initiated restructuring activities and will continue to incur severance and other employee-related costs as special items.
In order to align our cost base with our scale of business, during the third quarter of 2018, we initiated restructuring activities in the U.S. and reduced U.S. employment levels by approximately 300 employees in the fourth quarter of 2018. As a result, severance costs related to these restructuring activities were recorded as special charges.
The volatility of aluminum, inclusive of Midwest Premium and tariffs, and freight and fuel costs continued to significantly impact our results during 2019. To the extent these prices continue to fluctuate, our business and financial results could be materially adversely impacted. We continue to monitor these risks and rely on our risk management hedging program to help mitigate price risk exposure for commodities including aluminum and fuel.
In order to increase overall operating efficiency, during the first quarter of 2018, we announced plans to close the Colfax, California cidery. The cidery closed in January 2019 and cider production has moved to the 10th Street Brewery in Milwaukee, Wisconsin. We recognized special charges in 2019 and 2018 associated with the cidery closure consisting primarily of accelerated depreciation in excess of normal depreciation.
Volume and net sales
Brand volume decreased 3.6% in 2019 compared to 2018, primarily driven by challenging industry dynamics. STWs, excluding contract brewing volume, decreased 3.7% in 2019 compared to 2018, reflective of brand volume performance.
Net sales per hectoliter on a brand volume basis increased 3.3% in 2019 compared to 2018, driven by higher net pricing. Net sales per hectoliter on a reported basis for 2019, increased 4.1% in 2019 compared to 2018.
Cost of goods sold
Cost of goods sold per hectoliter increased 4.8% in 2019 compared to prior year driven by inflation, volume deleverage and other factors, including a substantial unanticipated increase in property tax at our Golden, Colorado brewery and increased packaging costs associated with our bottle furnace rebuild, partially offset by cost savings.
Marketing, general and administrative expenses
Marketing, general and administrative expenses decreased 0.6% in 2019 compared to 2018 primarily driven by spending optimization and efficiencies including incremental cost reductions related to the restructuring initiated in the third quarter of 2018, partially offset by cycling lower employee incentive compensation.
Canada Segment
| For the years ended | |||||||||||||||||
| December 31, 2019 | Change | December 31, 2018 | Change | December 31, 2017 | |||||||||||||
| (In millions, except percentages) | |||||||||||||||||
| Financial volume in hectoliters(1) | 8.059 | (5.8 | )% | 8.554 | (2.9 | )% | 8.805 | ||||||||||
| Sales(1) | $ | 1,728.8 | (6.6 | )% | $ | 1,850.6 | (2.9 | )% | $ | 1,906.2 | |||||||
| Excise taxes | (421.4 | ) | (8.1 | )% | (458.5 | ) | 2.3 | % | (448.2 | ) | |||||||
| Net sales(1) | 1,307.4 | (6.1 | )% | 1,392.1 | (4.5 | )% | 1,458.0 | ||||||||||
| Cost of goods sold(1) | (824.5 | ) | (2.7 | )% | (847.0 | ) | — | % | (847.0 | ) | |||||||
| Gross profit | 482.9 | (11.4 | )% | 545.1 | (10.8 | )% | 611.0 | ||||||||||
| Marketing, general and administrative expenses | (336.1 | ) | (1.7 | )% | (341.9 | ) | (14.0 | )% | (397.5 | ) | |||||||
| Special items, net(2) | (640.4 | ) | N/M | (23.8 | ) | 65.3 | % | (14.4 | ) | ||||||||
| Operating income (loss) | (493.6 | ) | N/M | 179.4 | (9.9 | )% | 199.1 | ||||||||||
| Interest income (expense), net | (0.2 | ) | N/M | — | — | % | — | ||||||||||
| Other income (expense), net(3) | (14.9 | ) | (33.5 | )% | (22.4 | ) | N/M | 11.1 | |||||||||
| Income (loss) before income taxes | $ | (508.7 | ) | N/M | $ | 157.0 | (25.3 | )% | $ | 210.2 |
N/M = Not meaningful
| (1) | Includes gross inter-segment sales, purchases, and volumes, which are eliminated in the consolidated totals. |
| (2) | See Part II—Item 8 Financial Statements and Supplementary Data, Note 7, "Special Items" for detail of special items. |
| (3) | See Part II—Item 8 Financial Statements and Supplementary Data, Note 5, "Other Income and Expense" for detail of other income (expense). |
Significant events
As part of our revitalization plan announced during the fourth quarter of 2019, we initiated restructuring activities and will continue to incur severance and other employee-related costs as special items.
We identified a triggering event requiring an interim impairment assessment of the goodwill within our Canada reporting unit at the end of the third quarter of 2019, as a result, in part, of prolonged weakening of the Canadian beer industry negatively impacting the performance of the Canada business in the current year and the expected future cash flows of the Canada reporting unit. The interim goodwill impairment analysis resulted in a goodwill impairment loss recognized within our Canada reporting unit of $668.3 million, which was recorded as a special item. See Part II—Item 8 Financial Statements and Supplementary Data, Note 10, "Goodwill and Intangible Assets" for additional information.
As part of our ongoing assessment of our Canadian supply chain network, we have incurred significant capital expenditures associated with the completion of the new brewery in Chilliwack, British Columbia, most of which was funded with the previously received proceeds from the sale of the Vancouver brewery in 2016. The transition of production to the new brewery in Chilliwack and final closure of the leased Vancouver brewery was completed in third quarter of 2019, and the new Chilliwack brewery is now operational.
In further efforts to help optimize the Canada brewery network, in the third quarter of 2017, we announced a plan to build a more efficient and flexible brewery in Longueuil, Quebec. Additionally, during the second quarter of 2019, we completed the sale of our Montreal brewery for $96.2 million (CAD 126 million), resulting in a $61.3 million gain, which was recorded as a special item. In conjunction with the sale, we agreed to lease back the existing property to continue operations on an uninterrupted basis until the new brewery is operational, which we currently expect to occur in 2021. However, due to the uncertainty inherent in our estimates, the timing of the brewery closure is subject to change. We will continue to incur significant capital expenditures associated with the construction of the new brewery in Longueuil, Quebec.
In June 2019, the Ontario government adopted a bill that, if enacted, would terminate a 10-year Master Framework Agreement that was originally signed between the previous government administration and MCBC, Labatt Brewing Company Limited, Sleeman Breweries Ltd., and BRI in 2015 and governs the terms of the beer distribution and retail systems in Ontario through 2025. The government has not yet proclaimed the bill as law. The impacts of these potential legislative changes are unknown at this time, but could have a negative impact on the results of operations, cash flows and financial position of the
Canada segment. While discussions remain ongoing with the government to reach a mutually agreeable alternative to the enactment of the law, the Company and the other Master Framework Agreement signatories are prepared to vigorously defend their rights and pursue legal recourse, should the Master Framework Agreement be unilaterally terminated by the enactment of the legislation. For additional information, see Part II—Item 8 Financial Statements and Supplementary Data, Note 18, "Commitments and Contingencies."
In June 2019, Health Canada released final regulations resulting in the legalization of new classes of cannabis products including edibles and cannabis infused beverages on October 17, 2019, with product sales being permitted sixty days after submission of the beverage formulations to Health Canada and satisfaction of all other licensing and regulatory preconditions. Our Truss joint venture with HEXO has been preparing for the launch of cannabis-infused products in the Canadian market, including the on-going construction of a production facility in Belleville, Ontario. We currently expect that Truss will launch products in 2020, subject to and after all of its licenses and regulatory clearances have been obtained.
Foreign currency impact on results
During 2019, the CAD appreciated versus the USD on an average basis, resulting in an increase of $9.2 million to our 2019 USD earnings before income taxes. Included in these amounts are both translational and transactional impacts of changes in foreign exchange rates. The impact of transactional foreign currency gains and losses is recorded within other income (expense) in our consolidated statements of operations.
Volume and net sales
Our Canada brand volume decreased 5.7% in 2019 compared to 2018, primarily due to weakened brand performance and industry declines.
Our net sales per hectoliter on a brand volume basis increased 1.7% in local currency in 2019 compared to 2018, driven by positive net pricing. Net sales per hectoliter on a reported basis in local currency increased 1.9% in 2019 compared to 2018.
Cost of goods sold
Cost of goods sold per hectoliter in local currency increased 5.7% in 2019 compared to 2018, driven primarily driven by volume deleverage and mix, increased distribution costs, brewery startup costs and inflation, partially offset by cost savings.
Marketing, general and administrative expenses
Our marketing, general and administrative expenses increased 0.6% in local currency in 2019 compared to 2018, primarily driven by Truss joint venture start-up costs, partially offset by lower employee-related expenses, including lower incentive compensation and benefits.
Other income (expense), net
Other expense of $14.9 million in 2019 was primarily driven by unrealized mark-to-market losses of $17.8 million on the HEXO warrants received in connection with the formation of the Truss joint venture, as further discussed in Note 16, "Derivative Instruments and Hedging Activities", partially offset by a gain of $1.5 million related to the historical sale of Molson Inc.'s ownership interest in the Montreal Canadiens. Other expense in 2018 was also primarily driven by unrealized mark-to-market losses of $23.8 million on the HEXO warrants.
Europe Segment
| For the years ended | |||||||||||||||||
| December 31, 2019 | Change | December 31, 2018 | Change | December 31, 2017 | |||||||||||||
| (In millions, except percentages) | |||||||||||||||||
| Financial volume in hectoliters(1)(2) | 23.101 | (2.8 | )% | 23.772 | 2.1 | % | 23.290 | ||||||||||
| Sales(2) | $ | 2,950.8 | (4.5 | )% | $ | 3,088.6 | 6.9 | % | $ | 2,888.3 | |||||||
| Excise taxes | (1,022.1 | ) | (5.9 | )% | (1,086.0 | ) | 14.6 | % | (947.6 | ) | |||||||
| Net sales(2) | 1,928.7 | (3.7 | )% | 2,002.6 | 3.2 | % | 1,940.7 | ||||||||||
| Cost of goods sold | (1,233.2 | ) | (2.9 | )% | (1,269.4 | ) | 8.1 | % | (1,174.4 | ) | |||||||
| Gross profit | 695.5 | (5.1 | )% | 733.2 | (4.3 | )% | 766.3 | ||||||||||
| Marketing, general and administrative expenses | (515.4 | ) | (3.6 | )% | (534.6 | ) | 0.8 | % | (530.3 | ) | |||||||
| Special items, net(3) | (10.7 | ) | 78.3 | % | (6.0 | ) | 20.0 | % | (5.0 | ) | |||||||
| Operating income (loss) | 169.4 | (12.0 | )% | 192.6 | (16.6 | )% | 231.0 | ||||||||||
| Interest income (expense), net | (5.7 | ) | 11.8 | % | (5.1 | ) | N/M | 3.6 | |||||||||
| Other income (expense), net | (3.6 | ) | N/M | (1.1 | ) | N/M | 0.3 | ||||||||||
| Income (loss) before income taxes | $ | 160.1 | (14.1 | )% | $ | 186.4 | (20.6 | )% | $ | 234.9 |
N/M = Not meaningful
| (1) | Excludes royalty volume of 1.765 million hectoliters, 1.787 million hectoliters and 1.694 million hectoliters for 2019, 2018 and 2017, respectively. |
| (2) | Includes gross inter-segment sales and volumes, which are eliminated in the consolidated totals. |
| (3) | See Part II—Item 8 Financial Statements and Supplementary Data, Note 7, "Special Items" for detail of special items. |
Significant events
As part of our revitalization plan announced during the fourth quarter of 2019, we initiated restructuring activities and will continue to incur severance and other employee-related costs as special items.
The U.K. exited the EU on January 31, 2020, which subjects our Europe segment to regulatory and market uncertainty as the U.K. remains in the EU customs union and single market until December 31, 2020, while the full terms of future trade agreements continue to be negotiated. The GBP has recently become volatile as a result of the government discussions related to the uncertainty and terms of the exit, including the weakening of the GBP to the USD during the third quarter of 2019 leading up to the initial extended exit date of October 31, 2019, which had an adverse impact on our European revenues as reported in USD due to the significance of U.K. sales. Any further weakening of the GBP to the USD could have a further adverse impact on our results. See Part I—Item 1A Risk Factors under "Risks Specific to the Europe Segment" for further discussion of the risks specific to the U.K.'s exit from the EU.
In 2019, our Grolsch joint venture arrangement as well as the related brewing and distribution agreements for the Grolsch brands in the U.K. and Ireland were terminated. See Part II—Item 8 Financial Statements and Supplementary Data, Note 4, "Investments" for further information.
In January 2018, the Europe segment completed the acquisition of Aspall Cyder Limited, an established premium cider business in the U.K.
Foreign currency impact on results
Our Europe segment operates in numerous countries within Europe, and each country's operations utilize distinct currencies. During 2019, foreign currency movements unfavorably impacted our Europe USD income before income taxes by $8.2 million. Included in these amounts are both translational and transactional impacts of changes in foreign exchange rates. The impact of transactional foreign currency gains and losses is recorded within other income (expense) in our consolidated statements of operations.
Volume and net sales
Our Europe brand volume decreased 2.6% in 2019 compared to 2018 due to soft industry demand.
Net sales per hectoliter on a brand volume basis increased 4.5% in local currency in 2019 compared to 2018, primarily driven by positive net pricing and favorable sales mix. Net sales per hectoliter on a reported basis in local currency increased 4.0% in 2019 compared to 2018.
Cost of goods sold
Cost of goods sold per hectoliter increased 4.9% in local currency in 2019 compared to 2018, primarily due to inflation and volume deleverage.
Marketing, general and administrative expenses
Marketing, general and administrative expenses increased 1.7% in local currency in 2019 compared to 2018, primarily due to higher marketing investments focused on our national champion brands and premiumization initiatives, as well as cycling a benefit from the partial reversal of bad debt provisions in 2018, partially offset by lower incentive compensation.
International Segment
| For the years ended | |||||||||||||||||
| December 31, 2019 | Change | December 31, 2018 | Change | December 31, 2017 | |||||||||||||
| (In millions, except percentages) | |||||||||||||||||
| Financial volume in hectoliters(1) | 1.866 | (15.7 | )% | 2.214 | (7.5 | )% | 2.394 | ||||||||||
| Sales | $ | 265.8 | (11.3 | )% | $ | 299.5 | (0.5 | )% | $ | 300.9 | |||||||
| Excise taxes | (40.5 | ) | (18.0 | )% | (49.4 | ) | 33.9 | % | (36.9 | ) | |||||||
| Net sales | 225.3 | (9.9 | )% | 250.1 | (5.3 | )% | 264.0 | ||||||||||
| Cost of goods sold(2) | (142.7 | ) | (11.0 | )% | (160.4 | ) | (11.1 | )% | (180.5 | ) | |||||||
| Gross profit | 82.6 | (7.9 | )% | 89.7 | 7.4 | % | 83.5 | ||||||||||
| Marketing, general and administrative expenses | (74.6 | ) | (8.6 | )% | (81.6 | ) | (19.8 | )% | (101.7 | ) | |||||||
| Special items, net(3) | (15.5 | ) | 66.7 | % | (9.3 | ) | N/M | (1.6 | ) | ||||||||
| Operating income (loss) | (7.5 | ) | N/M | (1.2 | ) | (93.9 | )% | (19.8 | ) | ||||||||
| Other income (expense), net | (0.2 | ) | (86.7 | )% | (1.5 | ) | N/M | 0.1 | |||||||||
| Income (loss) before income taxes | $ | (7.7 | ) | 185.2 | % | $ | (2.7 | ) | (86.3 | )% | $ | (19.7 | ) |
N/M = Not meaningful
| (1) | Excludes royalty volume of 2.461 million hectoliters, 2.267 million hectoliters and 1.991 million hectoliters in 2019, 2018 and 2017, respectively. |
| (2) | Includes gross inter-segment purchases, which are eliminated in the consolidated totals. |
| (3) | See Part II—Item 8 Financial Statements and Supplementary Data, Note 7, "Special Items" for detail of special items. |
Significant events
As part of our revitalization plan announced during the fourth quarter of 2019, we initiated restructuring activities and will continue to incur severance and other employee-related costs as special items.
During the third quarter of 2019, we recognized an aggregate impairment loss of $12.2 million related to the goodwill of our India reporting unit and a definite-lived brand intangible asset, which were recorded as special items. See Part II—Item 8 Financial Statements and Supplementary Data, Note 10, "Goodwill and Intangible Assets" for additional information.
During the first half of 2018, we decided to formally exit our business in China and, as such, have incurred special charges. See Part II—Item 8 Financial Statements and Supplementary Data, Note 7, "Special Items" for further detail.
Foreign currency impact on results
Our International segment operates in numerous countries around the world and each country's operations utilize distinct currencies. Foreign currency movements unfavorably impacted our International USD loss before income taxes by $1.5 million for 2019. Included in these amounts are both translational and transactional impacts of changes in foreign exchange rates. The impact of transactional foreign currency gains and losses is recorded within other income (expense) in our consolidated statements of operations.
Volume and net sales
Our International brand volume decreased 3.5% in 2019 compared to 2018, primarily driven by India supply chain and demand constraints along with economic decline in Paraguay and Puerto Rico, partially offset by growth in several of our focus markets. Our International financial volume decreased 15.7% in 2019 compared to 2018, driven by India supply chain and demand constraints and shifting to local third party production in Mexico, which increased our royalty volume.
Net sales per hectoliter on a brand volume basis decreased 5.8% in local currency in 2019 compared to 2018, primarily driven by geographic mix and shifting to local production in Mexico. Net sales per hectoliter on a reported basis increased 7.9% in local currency in 2019 compared to 2018 due to geographic mix.
Cost of goods sold
Cost of goods sold per hectoliter increased 5.9% in local currency in 2019 compared to 2018, primarily driven by inflation and geographic mix.
Marketing, general and administrative expenses
Marketing, general and administrative expenses decreased 8.0% in local currency in 2019 compared to 2018, primarily due to lower marketing investments, overhead and integration costs, partially offset by cycling the $2.0 million of settlement proceeds received related to our Colombia business in the first quarter of 2018.
Corporate Segment
| For the years ended | |||||||||||||||||
| December 31, 2019 | Change | December 31, 2018 | Change | December 31, 2017 | |||||||||||||
| (In millions, except percentages) | |||||||||||||||||
| Financial volume in hectoliters | — | — | % | — | — | % | — | ||||||||||
| Sales | $ | 0.8 | — | % | $ | 0.8 | (11.1 | )% | $ | 0.9 | |||||||
| Excise taxes | — | — | % | — | — | % | — | ||||||||||
| Net sales | 0.8 | — | % | 0.8 | (11.1 | )% | 0.9 | ||||||||||
| Cost of goods sold | (7.4 | ) | (95.6 | )% | (166.4 | ) | N/M | 122.9 | |||||||||
| Gross profit | (6.6 | ) | (96.0 | )% | (165.6 | ) | N/M | 123.8 | |||||||||
| Marketing, general and administrative expenses | (180.8 | ) | (15.2 | )% | (213.3 | ) | (11.1 | )% | (239.8 | ) | |||||||
| Special items, net(1) | (15.6 | ) | N/M | 326.6 | N/M | (0.1 | ) | ||||||||||
| Operating income (loss) | (203.0 | ) | N/M | (52.3 | ) | (55.0 | )% | (116.1 | ) | ||||||||
| Interest expense, net | (269.8 | ) | (10.6 | )% | (301.9 | ) | (16.1 | )% | (360.0 | ) | |||||||
| Other pension and postretirement benefits (costs), net | 2.9 | (92.4 | )% | 38.2 | (19.4 | )% | 47.4 | ||||||||||
| Other income (expense), net | 4.3 | (70.1 | )% | 14.4 | N/M | (7.7 | ) | ||||||||||
| Income (loss) before income taxes | $ | (465.6 | ) | 54.4 | % | $ | (301.6 | ) | (30.9 | )% | $ | (436.4 | ) |
N/M = Not meaningful
| (1) | See Part II—Item 8 Financial Statements and Supplementary Data, Note 7, "Special Items" for detail of special items. |
Significant events
As a result of our revitalization plan, during the fourth quarter of 2019, we initiated restructuring activities and have and will continue to incur severance and other employee-related costs as special items. We also recorded impairment losses in connection with the closure of our office in Denver, Colorado, which were also recorded as special items.
Cost of goods sold
The unrealized changes in fair value on our commodity swaps, which are economic hedges, are recorded as cost of goods sold within our Corporate activities. As the exposure we are managing is realized, we reclassify the gain or loss to the segment in which the underlying exposure resides, allowing our segments to realize the economic effects of the derivative without the resulting unrealized mark-to-market volatility. Lower commodity market prices relative to our hedged positions on our commodity swaps drove a total unrealized mark-to-market loss of $0.8 million recognized in cost of goods sold for the year ended December 31, 2019, as compared to an unrealized mark-to-market loss of $166.2 million recognized in cost of goods sold for the year ended December 31, 2018. Cost of goods sold for the year ended December 31, 2017 include an unrealized mark-to-market gain of $123.3 million on these commodity swaps.
Marketing, general and administrative expenses
Marketing, general and administrative expenses decreased in 2019 compared to 2018, primarily due to lower incentive compensation in the current year as well as higher integration costs recognized in the prior year. Specifically, we recorded integration costs of $23.1 million for the year ended December 31, 2019 and $36.9 million for the year ended December 31, 2018 related to the Acquisition within marketing, general and administrative expenses.
Interest expense, net
Net interest expense decreased in 2019 compared to 2018, primarily driven by the repayment of debt as part of our deleveraging commitments as well as risk management strategies to reduce interest expense. See Part II—Item 8 Financial Statements and Supplementary Data, Note 16, "Derivative Instruments and Hedging Activities" and Note 11, "Debt" for further details.
Other income (expense), net and Other pension and postretirement benefits (costs), net
Net other income decreased in 2019 compared to 2018, primarily driven by an $11.7 million gain recorded on the sale of a non-operating asset in 2018. The decrease in other pension and postretirement benefits in 2019 was primarily driven by a pension settlement charge of $29.8 million recognized in 2019. See Part II—Item 8 Financial Statements and Supplementary Data, Note 5, "Other Income and Expense" for further discussion of other income (expense) amounts and Note 15, "Employee Retirement Plans and Postretirement Benefits" for discussion of changes in pension and postretirement benefits (costs) as all non-service cost components of pension and postretirement benefits (costs) are reported within Corporate.
Liquidity and Capital Resources
Our primary sources of liquidity include cash provided by operating activities and access to external capital. We believe that cash flows from operations and cash provided by short-term and long-term borrowings, when necessary, will be more than adequate to meet our ongoing operating requirements, scheduled principal and interest payments on debt, anticipated dividend payments and capital expenditures for the next twelve months, and our long-term liquidity requirements.
While a significant portion of our cash flows from operating activities is generated within the U.S., our cash balances may be comprised of cash held outside the U.S. and in currencies other than USD. As of December 31, 2019, approximately 90% of our cash and cash equivalents was located outside the U.S., largely denominated in foreign currencies. We accrue for tax consequences on the earnings of our foreign subsidiaries upon repatriation. When the earnings are considered indefinitely reinvested outside of the U.S., we do not accrue taxes. However, we continue to assess the impact of the 2017 Tax Act, and related U.S. Department of Treasury proposed, temporary and final regulations, on the tax consequences of future repatriations. We utilize a variety of tax planning and financing strategies in an effort to ensure that our worldwide cash is available in the locations in which it is needed. We periodically review and evaluate these strategies, including external committed and non-committed credit agreements accessible by MCBC and each of our operating subsidiaries. We believe these financing arrangements, along with the cash generated from the operations of our U.S. business, are sufficient to fund our current cash needs in the U.S.
Cash Flows and Use of Cash
Our business generates positive operating cash flow each year, and our debt maturities are of a longer-term nature. However, our liquidity could be impacted significantly by the risk factors described in Part I, Item 1A. Risk Factors.
Cash Flows from Operating activities
Net cash provided by operating activities of approximately $1.9 billion in 2019 decreased by $434.0 million compared to 2018. This decrease was primarily driven by cycling the proceeds received during the first quarter of 2018 of $328.0 million related to the Adjustment Amount (as defined and further discussed in Part II—Item 8 Financial Statements and Supplementary Data, Note 7, "Special Items"), lower net income adjusted for non-cash add backs and higher cash paid for taxes, partially offset by favorable changes in working capital and lower interest paid during 2019.
Cash Flows from Investing activities
Net cash used in investing activities of $433.3 million in 2019 decreased by $235.8 million compared to 2018. This decrease was primarily driven by the receipt of $94.2 million of net proceeds from the sale of our Montreal brewery during the second quarter of 2019, lower capital expenditures in the current year, proceeds received from the voluntary settlement of our cross currency swaps during the second quarter of 2019 and lower cash paid for acquisitions in the current year.
Cash Flows from Financing activities
Net cash used in financing activities of approximately $2.0 billion in 2019 increased by $998.1 million compared to 2018. This increase was primarily driven by higher net repayments on debt and borrowings in 2019 compared to 2018, as well as increased dividend payments in 2019, partially offset by higher net repayments of borrowings under our commercial paper program in 2018.
See Part II—Item 8 Financial Statements and Supplementary Data, Note 11, "Debt" for a summary of our financing activities and debt position as of December 31, 2019 and December 31, 2018.
Capital Resources
Cash and Cash Equivalents
As of December 31, 2019, we had total cash and cash equivalents of $523.4 million compared to approximately $1.1 billion as of December 31, 2018. The decrease in cash and cash equivalents as of December 31, 2019 from December 31, 2018 was primarily driven by cash use related to increased debt and dividend payments in 2019, as well as capital spend, partially offset by cash generated from operating activities. See Part II—Item 8 Financial Statements and Supplementary Data, Consolidated Statements of Cash Flows for additional detail. The majority of our cash and cash equivalents are invested in a variety of highly liquid investments with original maturities of 90 days or less. These investments are viewed by management as low-risk investments on which there are little to no restrictions regarding our ability to access the underlying cash to fund our operations as necessary. While we have some investments in prime money market funds, these are classified as cash and cash equivalents; however, we continually monitor the need for reclassification under the updated SEC requirements for money market funds, and the potential that the shares of such funds could have a net asset value of less than one dollar. We also utilize cash pooling arrangements to facilitate the access to cash across our geographies.
Working Capital
We actively manage working capital through inventory management as well as management of accounts payable and accounts receivable to ensure we are able to meet short-term obligations and we are effectively using assets to increase profitability.
Borrowings
During 2019, we repaid our EUR 500 million variable rate notes, $500 million 1.90% notes, and $500 million 1.45% notes upon their respective maturities throughout the year. Notional amounts are presented in USD based on the applicable exchange rate as of December 31, 2019. Refer to Part II—Item 8 Financial Statements and Supplementary Data, Note 11, "Debt" for details regarding the $500 million and $400 million cross currency swaps on our $500 million 2.25% senior notes due 2020 and on a portion of our $1.0 billion 2.1% senior notes due 2021, respectively, which economically converted these notes to EUR denominated.

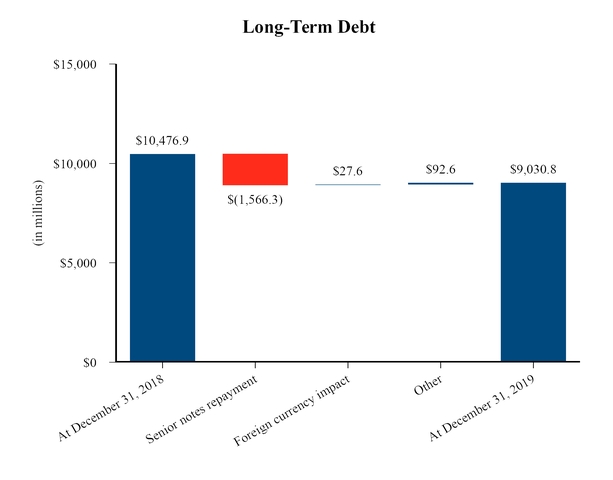
The impact of the reclassification of long-term finance leases to long-term debt is included in the "other" column in the table above. See Part II—Item 8 Financial Statements and Supplementary Data, Note 2, "New Accounting Pronouncements" for further details.
Based on the credit profile of our lenders that are party to our credit facilities, we are confident in our ability to draw on our revolving credit facility if the need arises. As of December 31, 2019 and December 31, 2018, we had $1.5 billion available to draw under our $1.5 billion revolving credit facility, which we extended the maturity date in the current year to July 7, 2024, as there were no outstanding revolving credit facility or commercial paper borrowings. In addition, we intend to further utilize our cross-border, cross-currency cash pool for liquidity as needed. We also have JPY, CAD, GBP and USD overdraft facilities as well as an additional JPY line of credit across several banks should we need additional short-term liquidity.
Under the terms of each of our debt facilities, we must comply with certain restrictions. These include customary events of default and specified representations, warranties and covenants, as well as covenants that restrict our ability to incur certain additional priority indebtedness (certain thresholds of secured consolidated net tangible assets), certain leverage threshold percentages, create or permit liens on assets, and restrictions on mergers, acquisitions, and certain types of sale lease-back transactions. Additionally, under the $1.5 billion revolving credit facility, the maximum leverage ratio as of December 31, 2019 is 4.25x net debt to EBITDA, with a decline to 4.00x net debt to EBITDA as of the last day of the fiscal quarter ending December 31, 2020. As of December 31, 2019 and December 31, 2018, we were in compliance with all of these restrictions, have met such financial ratios and have met all debt payment obligations. All of our outstanding senior notes as of December 31, 2019 rank pari-passu.
See Part II—Item 8 Financial Statements and Supplementary Data, Note 11, "Debt" for a complete discussion and presentation of all borrowings and available sources of borrowing, including lines of credit.
Credit Rating
Our current long-term credit ratings are BBB-/Stable Outlook, Baa3/Stable Outlook and BBB(Low)/Stable Outlook with Standard & Poor's, Moody's and DBRS, respectively. Our short-term credit ratings are A-3, Prime-3 and R-2(low),
respectively. A securities rating is not a recommendation to buy, sell or hold securities, and it may be revised or withdrawn at any time by the rating agency.
Foreign Exchange
Foreign exchange risk is inherent in our operations primarily due to the significant operating results that are denominated in currencies other than USD. Our approach is to reduce the volatility of cash flows and reported earnings which result from currency fluctuations rather than business related factors. Therefore, we closely monitor our operations in each country and seek to adopt appropriate strategies that are responsive to foreign currency fluctuations. Our financial risk management policy is intended to offset a portion of the potentially unfavorable impact of exchange rate changes on net income and earnings per share. See Part II—Item 8 Financial Statements and Supplementary Data, Note 16, "Derivative Instruments and Hedging Activities" for additional information on our financial risk management strategies.
Our consolidated financial statements are presented in USD, which is our reporting currency. Assets and liabilities recorded in foreign currencies that are the functional currencies for the respective operations are translated at the prevailing exchange rate at the balance sheet date. Translation adjustments resulting from this process are reported as a separate component of other comprehensive income. Revenue and expenses are translated at the average exchange rates during the respective period throughout the year. Gains and losses from foreign currency transactions are included in earnings for the period. The significant exchange rates to the USD used in the preparation of our consolidated financial results for the primary foreign currencies used in our foreign operations (functional currency) are as follows:
| For the years ended | ||||||||
| December 31, 2019 | December 31, 2018 | December 31, 2017 | ||||||
| Weighted-Average Exchange Rate (1 USD equals) | ||||||||
| Canadian dollar (CAD) | 1.32 | 1.30 | 1.27 | |||||
| Euro (EUR) | 0.89 | 0.84 | 0.88 | |||||
| British pound (GBP) | 0.79 | 0.77 | 0.77 | |||||
| Czech Koruna (CZK) | 22.78 | 21.93 | 23.43 | |||||
| Croatian Kuna (HRK) | 6.60 | 6.32 | 6.59 | |||||
| Serbian Dinar (RSD) | 104.81 | 99.74 | 112.49 | |||||
| Romanian Leu (RON) | 4.26 | 4.00 | 4.01 | |||||
| Bulgarian Lev (BGN) | 1.74 | 1.67 | 1.72 | |||||
| Hungarian Forint (HUF) | 292.42 | 267.65 | 276.49 |
| As of | |||||
| December 31, 2019 | December 31, 2018 | ||||
| Closing Exchange Rate (1 USD equals) | |||||
| Canadian dollar (CAD) | 1.30 | 1.36 | |||
| Euro (EUR) | 0.89 | 0.87 | |||
| British pound (GBP) | 0.75 | 0.78 | |||
| Czech Koruna (CZK) | 22.70 | 22.43 | |||
| Croatian Kuna (HRK) | 6.63 | 6.46 | |||
| Serbian Dinar (RSD) | 104.93 | 103.20 | |||
| Romanian Leu (RON) | 4.27 | 4.06 | |||
| Bulgarian Lev (BGN) | 1.74 | 1.71 | |||
| Hungarian Forint (HUF) | 295.21 | 279.94 |
The weighted-average exchange rates in the above table have been calculated based on the average of the foreign exchange rates during the relevant period and have been weighted according to the foreign denominated earnings from operations of the USD equivalent. If foreign currencies in the countries in which we operate devalue significantly in future periods, most significantly the CAD, GBP and other European operating currencies included in the above table, then the impact on USD reported earnings may be material.
Capital Expenditures
In 2019, we incurred $593.0 million, and have paid $593.8 million, for capital improvement projects worldwide, excluding capital spending by equity method joint ventures, representing an approximate 8% decrease versus 2018 capital expenditures incurred of $643.2 million. This decrease is primarily due to cycling higher investments in 2018 versus 2019 associated with the U.S. bottle furnace rebuild as well as lower spend to drive cost savings related to our 2017 to 2019 cost savings program as the timing of spend associated with this program was more heavily weighted towards the first two years of the three year program. Additionally, we are cycling higher investments incurred in 2018 around the construction of our new Chilliwack, British Columbia brewery, which was completed in 2019. This favorability was partially offset by higher expenditures associated with the new Longueuil, Quebec brewery, for which construction is currently underway and not expected to be completed until 2021, as well as the consolidated capital expenditures related to a new manufacturing facility in Belleville, Ontario as part of our Truss joint venture with HEXO in Canada.
We continue to focus on where and how we employ our planned capital expenditures, specifically strengthening our focus on required returns on invested capital as we determine how to best allocate cash within the business.
Contractual Obligations and Commercial Commitments
Contractual Obligations
A summary of our consolidated contractual obligations as of December 31, 2019, based on foreign exchange rates as of December 31, 2019, is as follows:
| Payments due by period | |||||||||||||||||||
| Total | Less than 1 year | 1 - 3 years | 3 - 5 years | More than 5 years | |||||||||||||||
| (In millions) | |||||||||||||||||||
| Debt obligations | $ | 8,993.6 | $ | 897.2 | $ | 1,510.2 | $ | 1,291.3 | $ | 5,294.9 | |||||||||
| Interest payments on debt obligations | 3,993.1 | 280.7 | 499.2 | 441.0 | 2,772.2 | ||||||||||||||
| Retirement plan expenditures(1) | 415.4 | 47.6 | 85.1 | 84.2 | 198.5 | ||||||||||||||
| Operating leases | 182.7 | 52.2 | 75.0 | 34.2 | 21.3 | ||||||||||||||
| Finance leases | 133.6 | 38.9 | 13.0 | 13.0 | 68.7 | ||||||||||||||
| Other long-term obligations(2) | 2,916.3 | 666.6 | 1,025.2 | 490.8 | 733.7 | ||||||||||||||
| Total obligations | $ | 16,634.7 | $ | 1,983.2 | $ | 3,207.7 | $ | 2,354.5 | $ | 9,089.3 |
See Part II—Item 8 Financial Statements and Supplementary Data, Note 11, "Debt", Note 15, "Employee Retirement Plans and Postretirement Benefits," Note 16, "Derivative Instruments and Hedging Activities," Note 18, "Commitments and Contingencies" and Note 19, "Leases" for additional information.
| (1) | Represents expected contributions under our defined benefit pension plans in the next twelve months and our benefit payments under postretirement benefit plans for all periods presented. The net underfunded liability as of December 31, 2019, of our defined benefit pension plans (excluding our overfunded plans) and postretirement benefit plans is $90.8 million and $672.5 million, respectively. Defined benefit pension plan contributions in future years will vary based on a number of factors, including actual plan asset returns and interest rates, and as such, have been excluded from the above table. We fund pension plans to meet the requirements set forth in applicable employee benefits laws. We may also voluntarily increase funding levels to meet financial goals. Excluding BRI and BDL, in 2020 we expect to make contributions to our defined benefit pension plans of approximately $5 million and benefit payments under our OPEB plans of approximately $43 million, based on foreign exchange rates as of December 31, 2019. |
Our U.K. pension plan is subject to a statutory valuation for funding purposes every three years. The most recent valuation as of June 30, 2019 indicated that the plan does not have a funding deficit relative to the plan's statutory funding objective, and therefore, no MCBC contributions are currently required.
We have taken numerous steps to reduce our exposure to these long-term pension obligations, including the closure of the U.K. and U.S. pension plans to future earning of service credit, benefit modifications in several of our Canada plans and entering into partial buy-in and buy-out contracts for some of our plans. However, given the dependence upon the global financial markets for the financial health of our plans, the plans may continue to periodically require potentially significant amounts of cash funding.
| (2) | Primarily includes non-cancelable purchase commitments as of December 31, 2019 that are enforceable and legally binding. Approximately $2.0 billion of the total other long-term obligations relate to long-term supply contracts with third parties to purchase raw material, packaging material and energy used in production. Our aggregate commitments for advertising and promotions, including sports sponsorship, total approximately $555 million. The remaining amounts relate to derivative payments, sales and marketing, distribution, information technology services, open purchase orders and other commitments. Included in other long-term obligations are $6.9 million of unrecognized tax benefits, excluding positions we would expect to settle using deferred tax assets, and $10.2 million of indemnities provided to FEMSA for which we cannot reasonably estimate the timing of future cash flows, and we have therefore included these amounts in the more than 5 years column. |
Guarantees
We guarantee indebtedness and other obligations to banks and other third parties for some of our equity method investments and consolidated subsidiaries. Guarantees of the outstanding third-party debt of our equity method investments, which are classified as current on the consolidated balance sheets, have been excluded from the contractual obligations table above. See Part II—Item 8 Financial Statements and Supplementary Data, Note 4, "Investments" and Note 18, "Commitments and Contingencies" for further discussion.
Other Commercial Commitments
Based on foreign exchange rates as of December 31, 2019, future commercial commitments are as follows:
| Amount of commitment expiration per period | |||||||||||||||||||
| Total amounts committed | Less than 1 year | 1 - 3 years | 3 - 5 years | More than 5 years | |||||||||||||||
| (In millions) | |||||||||||||||||||
| Standby letters of credit | $ | 60.9 | $ | 57.6 | $ | 3.2 | $ | — | $ | 0.1 |
Contingencies
We are party to various legal proceedings arising in the ordinary course of business, environmental litigation and indemnities associated with our sale of Kaiser to FEMSA. See Part II—Item 8 Financial Statements and Supplementary Data, Note 18, "Commitments and Contingencies" for further discussion.
Off-Balance Sheet Arrangements
Refer to Part II—Item 8 Financial Statements, Note 18, "Commitments and Contingencies" for discussion of off-balance sheet arrangements. As of December 31, 2019, we did not have any other material off-balance sheet arrangements (as defined in Item 303(a)(4)(ii) of Regulation S-K).
Outlook for 2020
On October 28, 2019, we initiated a revitalization plan designed to get Molson Coors back to consistent topline growth. The plan is designed to streamline the Company, allow us to move faster, and free up resources to invest in our brands and capabilities. The components of the revitalization plan include investing in our iconic brands, aggressively growing our above premium business - in beer and flavored beverages, growing beyond beer, strengthening our capabilities and streamlining our company.
We believe our core brands have the power to recruit new legal-age drinkers, which is why investing in our core brands is a key part of the revitalization plan. In the fourth quarter of 2019, we released new creative pieces in the Coors Light “Made to Chill” campaign and the Miller Lite “It’s Miller Time” campaign in the U.S., and we have already unveiled additional spots in 2020. In above premium, volume and net sales revenue improved for the full year 2019 and accelerated in the fourth quarter. We intend to support this acceleration by providing more fuel to our fastest growing brands and new innovations in the above premium space. We recently launched a new creative for Peroni in the U.S. that we believe presents an opportunity for continued success in 2020. We have also recently launched two new innovations in the U.S. with Blue Moon LightSky and Saint Archer Gold. LightSky is a low calorie, low carb beer brewed with tangerine peel that pushes the Blue Moon brand into incremental occasions and consumers. Saint Archer Gold is a premium light lager that we introduced to consumers with a broad media campaign that kicked off in early February 2020 and showcases how the brand is a better tasting light beer than other competitors. Additionally, in January 2020, we agreed to acquire Atwater Brewery, a regional craft brewer in Michigan. It fills a geographic void, gives us distilled spirits capability and we anticipate it will help position our craft portfolio to continue
outperforming the broader craft market. We plan to invest more in flavored malt beverages and white spaces that differentiate us and allow us to reach more consumers. Building on our 2019 successes, we expect to continue to invest behind Cape Line sparkling cocktails in the U.S. and plan to expand La Colombe hard coffee to additional markets. In Canada, we intend to continue to invest in Mad Jack - a popular flavored malt beverage. In March 2020, we plan to also launch Vizzy, a hard seltzer that offers differentiated ingredients, in the U.S. which we expect will help it carve out a meaningful space in the hard seltzer category. Lastly, we intend to expand beyond the beer aisle altogether. In November 2019, we announced an investment in and partnership with L.A. Libations, an incubator of "better-for-you" non-alcoholic beverages. We intend to be selective about where we compete, always looking to leverage our unique strengths. Additionally, we are taking a definitive step into the wine category with the expected national launch of Movo wine spritzers in March 2020.
The organizational restructuring is well under way and we are making progress toward our goal of improving efficiency and unlocking an additional $150 million in annual savings, bringing our total expected costs savings to $600 million over the three year cost savings program discussed below. Effective January 2020, we have simplified our structure from four business units and a corporate center to two streamlined business units - North America and Europe. In North America our new organizational design is now in place. All teams have been selected and people are transitioning to new office locations. In Europe, we have announced all senior leadership changes and anticipate the organization will be complete by the end of March 2020. As part of our updated structure, we have a new data and analytics team and are expanding and developing new commercial and operational capabilities, which we believe will make us smarter and more efficient. The resulting financial reporting changes of this new operating structure will be reflected in our first quarter 2020 results. We continue to estimate the cost of all of these changes will result in total one-time cash and non-cash charges in the range of approximately $120 million to $180 million. We expect the majority of these charges will be cash charges which we began recognizing in the fourth quarter of 2019, and will be further spread through the balance of fiscal years 2020 and 2021. We recognized approximately $43 million as special items within our consolidated statements of operations during the fourth quarter of 2019 related to our revitalization plan. We currently expect to record the remainder of these costs as special items within our consolidated statements of operations.
Cost Savings
Our next generation cost savings program, which began in 2020 and includes the anticipated benefits of the revitalization plan, is currently expected to deliver approximately $600 million over the three year program term through 2022 and is focused around many of the same functions of the business as the 2017 to 2019 program. We plan to reinvest these additional cost savings behind our brands and other capability building.
Capital Expenditures
We currently expect to incur total capital expenditures of approximately $700 million in 2020, based on foreign exchange rates as of December 31, 2019, including capital expenditures associated with the construction of our new Longueuil, Quebec brewery and increased investment to modernize our Golden, Colorado brewery, excluding capital spending by equity method joint ventures.
Interest
We anticipate 2020 consolidated net interest expense of approximately $280 million, based on foreign exchange and interest rates as of December 31, 2019.
Tax
We expect our effective tax rate to be in the range of 20 to 24 percent for 2020 and beyond, which remains subject to additional definitive guidance and finalized regulations from the U.S. government regarding the implementation of the 2017 Tax Act.
Deleverage & Dividends
We currently intend to maintain our investment grade debt rating and we are committed to further deleverage in 2020 in accordance with our plans. We have suspended our share repurchase program as we continue to pay down debt which we plan to revisit as we further deleverage. Our most recent quarterly dividend was declared and paid at $0.57 per share, which when annualized, is consistent with our ongoing target dividend payout ratio of 20% to 25% of trailing annual EBITDA, which we currently intend to maintain in the future.
Critical Accounting Estimates
Our consolidated financial statements are prepared in accordance with U.S. GAAP. In connection with the preparation of our consolidated financial statements, we are required to make judgments and estimates that significantly affect the reported
amounts of assets, liabilities, revenues and expenses and related disclosures. Our estimates are based on historical experience, current trends and various other assumptions we believe to be relevant under the circumstances. We review the underlying factors used in our estimates regularly, including reviewing the significant accounting policies impacting the estimates, to ensure compliance with U.S. GAAP. However, due to the uncertainty inherent in our estimates, actual results may be materially different. We have identified the accounting estimates below as critical to understanding and evaluating the financial results reported in our consolidated financial statements.
For a complete description of our significant accounting policies, see Part II—Item 8 Financial Statements and Supplementary Data, Note 1, "Basis of Presentation and Summary of Significant Accounting Policies."
Pension and Other Postretirement Benefits
Our defined benefit pension plans cover certain current and former employees in the U.S., Canada, the U.K. and Japan. Benefit accruals for the majority of employees in our U.S. and U.K. plans have been frozen and the plans are closed to new entrants. In the U.S., we also participate in, and make contributions to, multi-employer pension plans. Our OPEB plans provide medical benefits for retirees and their eligible dependents as well as life insurance and, in some cases, dental and vision coverage, for certain retirees in Canada, the U.S., Corporate, and Europe. The U.S., Canada and U.K. defined benefit pension plans are primarily funded, but the Japan plan and all OPEB plans are unfunded. We also offer defined contribution plans in each of our segments.
Accounting for pension and OPEB plans requires that we make assumptions that involve considerable judgment which are significant inputs in the actuarial models that measure our net pension and OPEB obligations and ultimately impact our earnings. These include the discount rate, long-term expected rate of return on assets, compensation trends, inflation considerations, health care cost trends and other assumptions, as well as determining the fair value of assets in our funded plans. Specifically, the discount rates, as well as the expected rates of return on assets and plan asset fair value determination, are important assumptions used in determining the plans' funded status and annual net periodic pension and OPEB costs. We evaluate these critical assumptions at least annually on a plan and country-specific basis. We also, with the help of actuaries, periodically evaluate other assumptions involving demographic factors, such as retirement age, mortality and turnover, and update them to reflect our experience and expectations for the future. While we believe that our assumptions are appropriate, significant differences in our actual experience or significant changes in our assumptions may materially affect our net pension and postretirement benefit obligations and related expense.
Discount Rates
The assumed discount rates are used to present-value future benefit obligations based on each plan's respective estimated duration. Our pension and postretirement discount rates are based on our annual evaluation of high quality corporate bonds in various markets based on appropriate indices and actuarial guidance. We believe that our discount rate assumptions are appropriate; however, significant changes in our assumptions may materially affect our pension and OPEB obligations and related expense.
As of December 31, 2019, on a weighted-average basis, the discount rates used were 2.55% for our defined benefit pension plans and 2.91% for our OPEB plans. The change from the weighted-average discount rates of 3.44% for our defined benefit pension plans and 3.92% for our postretirement plans as of December 31, 2018 is primarily the result of declining interest rates during 2019.
A 50 basis point change in our discount rate assumptions would have had the following effects on the projected benefit obligation balances as of December 31, 2019 for our pension and OPEB plans:
| Impact to projected benefit obligation as of December 31, 2019 - 50 basis points | |||||||
| Decrease | Increase | ||||||
| (In millions) | |||||||
| Projected benefit obligation - unfavorable (favorable) | |||||||
| Pension obligation | $ | 370.6 | $ | (330.0 | ) | ||
| OPEB obligation | 36.5 | (34.4 | ) | ||||
| Total impact to the projected benefit obligation | $ | 407.1 | $ | (364.4 | ) |
Our U.K. pension plan includes benefits linked to inflation. The above sensitivity analysis does not consider the implications to inflation resulting from the above contemplated discount rate changes. This sensitivity holds all other assumptions constant.
Long-Term Expected Rates of Return on Assets
The assumed long-term expected return on assets is used to estimate the actual return that will occur on each individual funded plan's respective plan assets in the upcoming year. We determine each plan's EROA with substantial input from independent investment specialists, including our actuaries and other consultants. In developing each plan's EROA, we consider current and expected asset allocations, historical market rates as well as historical and expected returns on each plan's individual asset classes. In developing future return expectations for each of our plan's assets, we evaluate general market trends as well as key elements of asset class returns such as expected earnings growth, yields and spreads. The calculation includes inputs for interest, inflation, credit, and risk premium (active investment management) rates and fees paid to service providers. Based on the above factors and expected asset allocations, we have assumed, on a weighted-average basis, an EROA of 3.24% for our defined benefit pension plan assets for cost recognition in 2020. This is a decrease from the weighted-average rate of 4.38% we had assumed for 2019. We believe that our EROA assumptions are appropriate; however, significant changes in our assumptions or actual returns that differ significantly from estimated returns may materially affect our net periodic pension costs.
To compute the expected return on plan assets, we apply the EROA to the market-related value of the pension plan assets adjusted for projected benefit payments to be made from the plan assets and projected contributions to the plan assets. We use the fair value approach to calculate the market-related value of pension plan assets used to determine net periodic pension cost, which includes measuring the market-related value of plan assets at fair value for purposes of determining the expected return on plan assets and amount of gain or loss subject to amortization.
A 50 basis point change in our discount rate and expected return on assets assumptions made at the beginning of 2019 would have had the following effects on 2019 net periodic pension and postretirement benefit costs:
| Impact to 2019 pension and postretirement benefit costs - 50 basis points (unfavorable) favorable | |||||||
| Decrease | Increase | ||||||
| (In millions) | |||||||
| Description of pension and postretirement plan sensitivity item | |||||||
| Expected return on pension plan assets | $ | (23.9 | ) | $ | 23.9 | ||
| Discount rate on pension plans | $ | 1.4 | $ | (6.1 | ) | ||
| Discount rate on postretirement plans | $ | (2.0 | ) | $ | 1.9 |
Fair Value of Plan Assets
We recognize our defined benefit pension plans as assets or liabilities in the consolidated balance sheets based on their underfunded or overfunded status as of our year end and recognize changes in the funded status due to changes in actuarial assumptions in the year in which the changes occur within other comprehensive income. Our funded status of our defined benefit pension plans is measured as the difference between each plan's projected benefit obligation and its assets' fair values. The fair value of plan assets is determined by us using available market information and appropriate valuation methodologies. However, considerable judgment is required in selecting an appropriate methodology and interpreting market data to develop the estimates of fair value, especially in the absence of quoted market values in an active market. Changes in these assumptions or the use of different market inputs may have a material impact on the estimated fair values or the ultimate amount at which the plan assets are available to satisfy our plan obligations.
Equity assets are diversified between domestic and other international investments. Relative allocations reflect the demographics of the respective plan participants. See Part II—Item 8 Financial Statements and Supplementary Data, Note 15, "Employee Retirement Plans and Postretirement Benefits" for a comparison of target asset allocation percentages to actual asset allocations as of December 31, 2019.
Other Considerations
Our net periodic pension and postretirement benefit costs are also influenced by the potential amortization (or non-amortization) from accumulated other comprehensive income (loss) of deferred gains and losses, which occur when actual experience differs from estimates. We employ the corridor approach for determining each plan's amortization. This approach defines the “corridor” as the greater of 10% of the PBO or 10% of the market-related value of plan assets (as discussed above)
and requires amortization of the excess net gain or loss that exceeds the corridor over the average remaining service periods of active plan participants. For our closed plans or plans that are primarily inactive, the average remaining life expectancy of all plan participants (including retirees) is used. If our actuarial losses significantly exceed this corridor in the future, significant incremental pension and postretirement costs could result. As of year-end 2019, the deferred losses of several of our Canadian plans, as well as those in our U.K. plan, and the deferred gains of our U.S. plan, exceeded the 10% corridor.
The assumed health care cost trend rates represent the rates at which health care costs are assumed to increase and are based on actuarial input and consideration of historical and expected experience. We use these trends as a significant assumption in determining our postretirement benefit obligation and related costs. Changes in our projections of future health care costs due to general economic conditions and those specific to health care will impact this trend rate. An increase in the trend rate would increase our obligation and expense of our postretirement health care plan. We believe that our health care cost trend rate assumptions are appropriate; however, significant changes in our assumptions may materially affect our postretirement benefit obligations and related costs. As of December 31, 2019, the health care trend rates used were ranging ratably from 6.25% in 2020 to 3.57% in 2040, consistent with our health care trend rates ranging ratably from 6.5% in 2019 to 4.5% in 2037 used as of December 31, 2018. See Part II—Item 8 Financial Statements and Supplementary Data, Note 15, "Employee Retirement Plans and Postretirement Benefits" for further information.
Contingencies, Environmental and Litigation Reserves
Contingencies, environmental and litigation reserves are recorded, when probable, using our best estimate of loss. This estimate, involving significant judgment, is based on an evaluation of the range of loss related to such matters and where the amount and range can be reasonably estimated. These matters are generally resolved over a number of years and only when one or more future events occur or fail to occur. Following our initial determination, we regularly reassess and revise the potential liability related to any pending matters as new information becomes available. Unless capitalization is allowed or required by U.S. GAAP, environmental and legal costs are expensed when incurred. We disclose pending loss contingencies when the loss is deemed reasonably possible, which requires significant judgment. As a result of the inherent uncertainty of these matters, the ultimate conclusion and actual cost of settlement may materially differ from our estimates. We recognize contingent gains upon the determination that realization is assured beyond a reasonable doubt, regardless of the perceived probability of a favorable outcome prior to achieving that assurance. In the instance of gain contingencies resulting from favorable litigation, due to the numerous uncertainties inherent in a legal proceeding, gain contingencies resulting from legal settlements are not recognized in income until cash or other forms of payment are received. If significant and probable, we disclose as appropriate.
See Part I—Item 3 Legal Proceedings and Part II—Item 8 Financial Statements and Supplementary Data, Note 18, "Commitments and Contingencies" for a discussion of our contingencies, environmental and litigation reserves as of December 31, 2019.
Goodwill and Intangible Asset Valuation
Goodwill is allocated to the reporting unit in which the business that created the goodwill resides. A reporting unit is an operating segment, or a business unit one level below that operating segment, for which discrete financial information is prepared and regularly reviewed by segment management. As of the date of completion of our 2019 impairment testing, the operations in each of the specific regions within our U.S., Canada, Europe and International segments are components based on the availability of discrete financial information and the regular review by segment management. Therefore, the components within each respective segment must be evaluated for aggregation to determine if the components have similar economic characteristics. As a result, in certain cases, we have aggregated components, within an operating segment, into one reporting unit if the specific aggregation criteria under U.S. GAAP is met. Specifically, we have concluded that the components within the U.S., Canada and Europe segment each meet the criteria as having similar economic characteristics and therefore have aggregated these components into the U.S., Canada and Europe reporting units, respectively. Therefore, the U.S., Canada and Europe reporting units are consistent with our operating segments. However, for our India business, the reporting unit is one level below the International operating segment. Any change to the conclusion of our reporting units or the aggregation of components within our reporting units, including potential changes resulting from our revitalization plan, could result in a different outcome to our annual impairment test. As of the date of our annual impairment test, our significant indefinite-lived intangible assets included the Coors and Miller brand families in the U.S., the Coors Light distribution rights in Canada, and the Carling and Staropramen brands in Europe.
We evaluate the carrying value of our goodwill and indefinite-lived intangible assets for impairment at least annually or when an interim triggering event occurs that would indicate that impairment may have taken place. We identified a triggering event requiring an interim impairment assessment of the goodwill within our Canada and India reporting units at the end of the third quarter of 2019. Our annual impairment test of indefinite-lived intangible assets was performed as of October 1, the first day of the last fiscal quarter. We evaluate our other definite-lived intangible assets for impairment when evidence exists that
certain events or changes in circumstances indicate that the carrying amount of these assets may not be recoverable. Significant judgments and assumptions are required in such impairment evaluations.
Our annual evaluation involves comparing each reporting unit's fair value to its respective carrying value, including goodwill. If the fair value exceeds carrying value, then we conclude that no goodwill impairment has occurred. If a reporting unit's carrying value exceeds its fair value, we would recognize an impairment loss in an amount equal to the excess up to the total amount of goodwill allocated to that reporting unit.
We use a combination of discounted cash flow analyses and market approaches to determine the fair value of each of our reporting units, and an excess earnings approach to determine the fair values of our Coors and Miller brand families in the U.S., the Staropramen brand in Europe, and the Coors Light distribution rights in Canada. We utilized a qualitative assessment of the Carling brand in Europe and water rights in the U.S., in order to determine whether the fair value of those indefinite-lived intangible assets was in excess of its carrying value. The decision to utilize a qualitative assessment in the current year for the Carling brand was the result of taking several factors into consideration, including the excess of the brand's fair value over its carrying value in the most recent quantitative impairment analysis. Our discounted cash flow projections include assumptions for growth rates for sales, costs and profits, which are based on various long-range financial and operational plans of each reporting unit or each indefinite-lived intangible asset. Additionally, discount rates used in our goodwill analysis are based on weighted-average cost of capital, driven by the prevailing interest rates in geographies where these businesses operate, as well as the credit ratings, financing abilities and opportunities of each reporting unit, among other factors. Discount rates for the indefinite-lived intangible analysis by brand largely reflect the rates supporting the overall reporting unit valuation but may differ slightly to adjust for country or market specific risk associated with a particular brand. Our market-based valuations utilize earnings multiples of comparable public companies, which are reflective of the market in which each respective reporting unit operates, and recent comparable market transactions.
Changes in the factors used in our fair value estimates, including declines in industry or company-specific beer volume sales, margin erosion, termination of brewing and/or distribution agreements with other brewers, and discount rates used, could have a significant impact on the fair values of the reporting units and indefinite-lived intangible assets.
Interim Impairment Assessment
We identified a triggering event requiring an interim impairment assessment of the goodwill within our Canada reporting unit at the end of the third quarter of 2019, which resulted in a goodwill impairment loss of $668.3 million. The goodwill impairment trigger was the result of continued challenges and steepening declines within the Canadian beer industry reflected in the prolonged weakened performance of the Canada reporting unit through the third quarter of 2019. These performance headwinds have been countered, in part, by the benefit of the recent interest rate environment, which resulted in a decrease in the risk-free rate included in our current year discount rate calculations. Specifically, the discount rate used in developing our interim fair value estimate for the Canada reporting unit was 8.50%, as compared to 9.25% used as of the October 1, 2018 annual testing date. However, the performance declines and increased challenges within the beer industry in Canada, coupled with significant increases in cost inflation, volume deleverage, and resulting margin erosion, has had a material adverse impact on the expected future cash flows utilized in the valuation approaches for the Canada reporting unit, such that it was determined that the fair value of the reporting unit was more likely than not reduced below its carrying amount during the third quarter. As a result of this triggering event, we performed an interim quantitative analysis, using a combination of discounted cash flow analyses and market-based approaches, consistent with our annual impairment testing, in which it was determined that the carrying value of the Canada reporting unit exceeded its fair value by $668.3 million.
We also evaluated the indefinite-lived and definite-lived intangible assets within our Canada reporting unit, prior to recording the goodwill impairment, and concluded that no impairments were required; however, the Coors Light distribution agreement indefinite-lived intangible asset is considered to be at risk of future impairment as further discussed below.
Separately, during the third quarter of 2019 we also identified an interim triggering event related to goodwill within our India reporting unit resulting from significant declines in performance in the current year, coupled with the continuation of challenging business conditions, which required us to perform an interim quantitative impairment analysis at the end of the third quarter of 2019. As a result of this interim analysis, we determined that the carrying value of the India reporting unit exceeded its fair value, resulting in an aggregate impairment loss of $12.2 million related to the goodwill of our India reporting unit and a definite-lived brand intangible asset.
Annual Impairment Assessment
We completed our required annual goodwill and indefinite-lived intangible asset impairment testing as of October 1, 2019, the first day of our fourth quarter, and concluded there were no additional impairments of goodwill within any of our reporting units. Further, there were no impairments of our other indefinite-lived intangible assets as a result of the annual review process.
Reporting Units and Goodwill
The fair value of the U.S., Europe and Canada reporting units were estimated at approximately 17%, 12% and 0% in excess of carrying value, respectively, as of the October 1, 2019 testing date. In the current year testing, it was determined that the fair value of the U.S. and Canada reporting units declined during the year, while there was a slight increase in the fair value of the Europe reporting unit versus the prior year. As a result of our testing, the Europe and Canada reporting units continue to be considered at risk of impairment. The decline in fair value of the U.S. and Canada reporting units in the current year is largely due to weakening of the overall North American beer market in the current year, which adversely impacted the results of our impairment testing. These challenges were partially offset by the benefits to our discount rate as a result of the recent interest rate environment. In the U.S. reporting unit, industry driven declines negatively impacted brand volumes as compared to the prior year; however these headwinds were partially offset by continued investment behind above premium brands and innovation benefiting management's forward-looking plans. In the Europe reporting unit, while weather and tourism-related headwinds had an adverse impact on current year brand volumes, forward-looking plans continue to focus on management's premiumization agenda, which is positively impacting the forecasted future cash flows of the reporting unit. Following the interim goodwill impairment charge recorded during the third quarter within the Canada reporting unit, the fair value of the Canada reporting unit was reduced to its carrying value. No further deterioration in value was identified in the fourth quarter testing, and therefore, the fair value of the Canada reporting unit goodwill equals its carrying value as of the October 1, 2019 testing date. As a result of the interim goodwill impairment charge within the India reporting unit, the goodwill balance was reduced to zero and is no longer subject to evaluation for impairment on a go-forward basis.
Although the fair value of each of our reporting units was determined to be either equal to or in excess of its respective carrying value as of the October 1, 2019, testing date, the fair value determinations are sensitive to further unfavorable changes in forecasted cash flows, macroeconomic conditions, market multiples or discount rates that could negatively impact future analyses. The key assumptions used to derive the estimated fair values of our reporting units represent Level 3 measurements.
Indefinite-Lived Intangible Assets
The Coors and Miller indefinite-lived brands in the U.S. continue to be sufficiently in excess of their respective carrying values as of the annual testing date.
The fair value of the indefinite-lived Coors Light brand distribution rights in Canada is considered to be at risk of future impairment with a fair value estimated at approximately 11% in excess of its carrying value as of the annual testing date. The fair value decline of the Coors Light brand distribution rights versus the prior year was a result of continued volume declines through 2019. The performance deterioration in the current year follows the goodwill impairment charge that was taken in the third quarter of 2019 that resulted from prolonged Canada beer industry declines.
The fair values of our indefinite-lived intangible assets in Europe, including the Staropramen and Carling brands, continue to be sufficiently in excess of their respective carrying values as of the annual testing date.
We utilized Level 3 fair value measurements in our impairment analysis of certain indefinite-lived intangible brand assets, including the Coors and Miller brands in the U.S., the Coors Light distribution rights in Canada, and the Staropramen brand in Europe, which utilizes an excess earnings approach to determine the fair values of these assets as of the testing date. The future cash flows used in the analysis are based on internal cash flow projections based on our long range plans and include significant assumptions by management as noted below. Separately, we performed qualitative assessments of certain indefinite-lived intangible assets, including the Carling brand in Europe and water rights in the U.S., to determine whether it was more likely than not that the fair values of these assets were greater than their respective carrying amounts. Based on the qualitative assessments, we determined that a full quantitative analysis was not necessary.
Key Assumptions
As of the date of our annual impairment test, performed as of October 1, the Europe and Canada reporting unit goodwill balances are at risk of future impairment in the event of significant unfavorable changes in the forecasted cash flows (including prolonged weakening of economic conditions, or significant unfavorable changes in tax, environmental or other regulations, including interpretations thereof), terminal growth rates, market multiples and/or weighted-average cost of capital utilized in the discounted cash flow analyses. For testing purposes of our reporting units, management's best estimates of the expected future results are the primary driver in determining the fair value. Current projections used for our Canada reporting unit testing reflect continued challenges within the beer industry in Canada adversely impacting the projected cash flows of the business. Current projections used for our Europe reporting unit incorporate volume and revenue growth driven by management's premiumization agenda, slightly off-set by adverse impacts to cash flows in the current year generated by underperformance of brand volumes driven by external factors such as weather and tourism-related activity. Challenges in both Canada and Europe were partially offset by the benefits to our discount rate as a result of the recent interest rate environment.
Fair value determinations require considerable judgment and are sensitive to changes in underlying assumptions and factors. As a result, there can be no assurance that the estimates and assumptions made for purposes of the annual goodwill and indefinite-lived intangible impairment tests will prove to be an accurate prediction of the future. Examples of events or circumstances that could reasonably be expected to negatively affect the underlying key assumptions and ultimately impact the estimated fair value of our reporting units and indefinite-lived intangible assets may include such items as: (i) a decrease in expected future cash flows, specifically, a decrease in sales volume and increase in costs that could significantly impact our immediate and long-range results, a decrease in sales volume driven by a prolonged weakness in consumer demand or other competitive pressures adversely affecting our long-term volume trends, a continuation of the trend away from core brands in certain of our markets, especially in markets where our core brands represent a significant portion of the market, unfavorable working capital changes and an inability to successfully achieve our cost savings targets, (ii) adverse changes in macroeconomic conditions or an economic recovery that significantly differs from our assumptions in timing and/or degree (such as a recession), (iii) volatility in the equity and debt markets or other country specific factors which could result in a higher weighted-average cost of capital, (iv) sensitivity to market multiples; and (v) regulation limiting or banning the manufacturing, distribution or sale of alcoholic beverages.
Based on known facts and circumstances, we evaluate and consider recent events and uncertain items, as well as related potential implications, as part of our annual assessment and incorporate into the analyses as appropriate. These facts and circumstances are subject to change and may impact future analyses. For example, we continue to monitor the challenges within the beer industry for further weakening or additional systemic structural declines. Separately, the Ontario provincial government adopted a bill that, if enacted, could adversely impact the existing terms of the beer distribution and retail systems in the province, as further described in Part II—Item 8 Financial Statements and Supplementary Data, Note 18, "Commitments and Contingencies".
In 2019, the discount rate used in developing our annual fair value estimates for the U.S., Europe and Canada reporting units was 8.50% for all reporting units, based on market-specific factors, as compared to 9.00%, 9.50% and 9.25%, respectively used as of the October 1, 2018 annual testing date. The recent interest rate environment has resulted in a decrease to the risk-free rate used in the current year discount rate calculations, which has resulted in a discount rate decrease for each of the reporting units when also taking into consideration the market or country specific risk premium for each geography in which our brands are based. The discount rates for the Coors and Miller brands in the U.S., the Staropramen brand in Europe and the Coors Light distribution rights in Canada decreased compared to the discount rates used in the prior year analysis, primarily due to the decrease in the risk-free rates included in our current year discount rate calculations, as noted above.
We identified a triggering event requiring an interim impairment assessment of the goodwill within our Canada and India reporting units at the end of the third quarter of 2019, which resulted in goodwill impairment charges during the year as noted above and within Part II—Item 8 Financial Statements and Supplementary Data, Note 10, "Goodwill and Intangible Assets". Current expectations driving our annual impairment testing as of October 1, 2019 have resulted in fair values of our reporting units either equal to or in excess of carrying values. However, if our assumptions are not realized, it is possible that further impairment charges may need to be recorded in the future. For example, a 50 basis point increase in our discount rate assumptions, which is within a reasonable range of historical discount rate fluctuations between test dates, would have had the following effects on the fair value cushion in excess of carrying value for the U.S., Europe and Canada reporting units, as well as the at risk Coors Light brand distribution right indefinite-lived intangible asset in Canada, as of the October 1, 2019 test date:
| Impact to the fair value cushion as of October 1, 2019 - 50 basis points increase | |||
| Cushion (as reported) | Cushion (post-sensitivity) | ||
| % of fair value in excess of carrying value | |||
| Reporting Units: | |||
| United States | 17% | 14% | |
| Europe | 12% | 8% | |
| Canada | —% | (3)% | |
| Indefinite-Lived Intangible Assets: | |||
| Coors Light brand distribution rights, Canada | 11% | 2% |
Post sensitivity, the fair values of the U.S. and Europe reporting units as well as the Coors Light brand distribution right indefinite-lived intangible asset remain in excess of their carrying values, while the fair value of the Canada reporting unit falls below its carrying value. The discount rate sensitivity holds all other assumptions and inputs constant.
Regarding definite-lived intangible assets, we continuously monitor the performance of the underlying asset for potential triggering events suggesting an impairment review should be performed. With the exception of the impairment losses related to the Grolsch brand and distribution agreement definite-lived intangible assets discussed in Part II—Item 8 Financial Statements and Supplementary Data, Note 4, "Investments" and the brand intangible asset related to our India business discussed above, no such triggering events resulting in an impairment loss were identified in 2019, 2018 or 2017. See Part II—Item 8 Financial Statements and Supplementary Data, Note 10, "Goodwill and Intangible Assets" for further discussion.
As of December 31, 2019, the carrying values of goodwill and intangible assets were approximately $7.6 billion and $13.7 billion, respectively. If actual performance results differ significantly from our projections or we experience significant fluctuations in our other assumptions, a material impairment loss may occur in the future. See Part II—Item 8 Financial Statements and Supplementary Data, Note 10, "Goodwill and Intangible Assets" for further discussion and presentation of these amounts.
Income Taxes
Income taxes are accounted for in accordance with U.S. GAAP. Judgment is required in determining our consolidated provision for income taxes. In the ordinary course of our global business, there are many transactions for which the ultimate tax outcome is uncertain. Additionally, our income tax provision is based on calculations and assumptions that are subject to examination by many different tax authorities. See Part II—Item 8 Financial Statements and Supplementary Data, Note 6, "Income Tax" for further discussion on the implications of the 2017 Tax Act on our financial statements.
We are periodically subject to tax return audits by both foreign and domestic tax authorities, which can involve questions regarding our tax positions. Settlement of any challenge resulting from these audits can result in no change, a complete disallowance, or some partial adjustment reached through negotiations or litigation. We recognize the tax benefit from an uncertain tax position only if it is more likely than not that the tax position will be sustained based on its technical merits. We measure and record the tax benefits from such a position based on the largest benefit that has a greater than 50% likelihood of being realized upon ultimate settlement. Our estimated liabilities related to these matters are adjusted in the period in which the uncertain tax position is effectively settled, the statute of limitations for examination expires or when additional information becomes available. Our liability for unrecognized tax benefits requires the use of assumptions and significant judgment to estimate the exposures associated with our various filing positions. Although we believe that the judgments and estimates made are reasonable, actual results could differ and resulting adjustments could materially affect our effective income tax rate and income tax provision.
We annually distribute cash from our foreign subsidiaries’ current year earnings and record the tax impacts associated with these transactions. Any current earnings not otherwise distributed or planned to be distributed in the current year are considered permanently reinvested in our foreign operations. The aggregate of these earnings is currently a deficit for U.S. tax purposes and would not result in any material taxes, if distributed. We have no plans to dispose of foreign subsidiaries and would not expect outside basis differences in foreign subsidiaries to reverse with material tax consequences.
We record a valuation allowance to reduce our deferred tax assets to the amount that is more likely than not to be realized. We evaluate our ability to realize the tax benefits associated with deferred tax assets by assessing the adequacy of future expected taxable income, including the reversal of existing temporary differences, historical and projected operating results, and the availability of prudent and feasible tax planning strategies. The realization of tax benefits is evaluated by jurisdiction and the realizability of these assets can vary based on the character of the tax attribute and the carryforward periods specific to each jurisdiction. In the event we were to determine that we would be able to realize our deferred tax assets in the future in excess of its net recorded amount, an adjustment to the deferred tax asset would decrease income tax expense in the period a determination was made. Likewise, should we determine that we would not be able to realize all or part of our net deferred tax asset in the future, an adjustment to the deferred tax asset would be recorded to income tax expense in the period such determination was made.
There are proposed or pending tax law changes in various jurisdictions in which we do business. For example, as discussed in Part II—Item 8 Financial Statements and Supplementary Data, Note 6, "Income Tax", since 2018, the U.S. Department of Treasury has continued to issue proposed, temporary and final regulations to implement provisions of the 2017 Tax Act. We recognize the impacts of changes in tax law upon enactment, and therefore, proposed changes in tax law, regulations and rules are not reflected within our income tax provision. As a result, such changes may, upon ultimate enactment, result in material impacts to our financial statements.
New Accounting Pronouncements
New Accounting Pronouncements Not Yet Adopted
See Part II-Item 8 Financial Statements and Supplementary Data, Note 2, "New Accounting Pronouncements" for a description of all new accounting pronouncements.
Previous: Item 6. SELECTED FINANCIAL DATA · Next: Item 7A. QUANTITATIVE AND QUALITATIVE DISCLOSURES ABOUT MARKET RISK