 filings.tools
Item 2. MANAGEMENT'S DISCUSSION AND ANALYSIS OF FINANCIAL CONDITION AND RESULTS OF OPERATIONS
81K characters. Original on sec.gov · Markdown
Item 2. MANAGEMENT'S DISCUSSION AND ANALYSIS OF FINANCIAL CONDITION AND RESULTS OF OPERATIONS
Overview
For over two centuries, we have been brewing beverages that unite people to celebrate all life’s moments. From Coors Light, Miller Lite, Molson Canadian, Carling and Staropramen to Coors Banquet, Blue Moon Belgian White, Blue Moon LightSky, Vizzy, Leinenkugel’s Summer Shandy, Creemore Springs, Hop Valley and more, we produce many beloved and iconic beer brands. While the company’s history is rooted in beer, Molson Coors Beverage Company offers a modern portfolio that expands beyond the beer aisle as well. As a business, our ambition is to be the first choice for our people, our consumers and our customers, and our success depends on our ability to make our products available to meet a wide range of consumer segments and occasions.
Management's Discussion and Analysis of Financial Condition and Results of Operations ("MD&A") in this Quarterly Report on Form 10-Q is provided as a supplement to, and should be read in conjunction with, our audited consolidated financial statements, the accompanying notes and the MD&A included in our Annual Report on Form 10-K for the fiscal year ended December 31, 2020 ("Annual Report"), as well as our unaudited condensed consolidated interim financial statements and the accompanying notes included in this report. Due to the seasonality of our operating results, quarterly financial results are not an appropriate basis from which to project annual results.
Unless otherwise noted in this report, any description of "we," "us" or "our" includes Molson Coors Beverage Company ("MCBC" or the "Company"), principally a holding company, and its operating and non-operating subsidiaries included within our reporting segments. Our reporting segments include North America and Europe. Our North America segment operates in the U.S., Canada and various countries in Latin and South America and our Europe segment operates in Bulgaria, Croatia, Czech Republic, Hungary, Montenegro, the Republic of Ireland, Romania, Serbia, the U.K., various other European countries, and certain countries within the Middle East, Africa and Asia Pacific.
Unless otherwise indicated, information in this report is presented in USD and comparisons are to comparable prior periods. Our primary operating currencies, other than the USD, include the CAD, the GBP, and our Central European operating currencies such as the EUR, CZK, HRK and RSD.
Operational Measures
We have certain operational measures, such as STWs and STRs, which we believe are important metrics. STW is a metric that we use in our business to reflect the sales from our operations to our direct customers, generally wholesalers. We believe the STW metric is important because it gives an indication of the amount of beer and adjacent products that we have produced and shipped to customers. STR is a metric that we use in our business to refer to sales closer to the end consumer than STWs, which generally means sales from wholesalers or our company to retailers, who in turn sell to consumers. We believe the STR metric is important because, unlike STWs, it provides the closest indication of the performance of our brands in relation to market and competitor sales trends.
Items Affecting Reported Results
Items Affecting Consolidated Results of Operations
Cybersecurity Incident
During March 2021, we experienced a systems outage that was caused by a cybersecurity incident. We engaged leading forensic information technology firms and legal counsel to assist our investigation into the incident and we restored our systems after working to get the systems back up as quickly as possible. Despite these actions, we experienced delays and disruptions to our business, including brewery operations, production and shipments. This incident caused us to not produce or ship as much as we would have in the first quarter of 2021. Subsequent to the first quarter of 2021, we made progress recovering from the incident with increased shipments and continue to expect to operationally recover fully by the end of 2021. In addition, we incurred certain incremental net one-time costs of $2.4 million in the nine months ended September 30, 2021 related to consultants, experts and data recovery efforts, net of insurance recoveries.
Coronavirus Global Pandemic
Starting at the end of the first quarter of 2020, the coronavirus pandemic has had a material adverse effect on our operations, liquidity, financial condition and results of operations in 2020 and 2021. In 2021, we have seen improvements in the marketplace related to the coronavirus global pandemic as on-premise locations begin to open across the world, including in the U.S. which led to a shift in revenue from off-premise to on-premise starting in the second quarter of 2021. The extent to which our operations will continue to be impacted by the coronavirus pandemic will depend largely on future developments, which are
highly uncertain and cannot be accurately predicted, including the level of governmental or societal orders or restrictions on public gatherings and on-premise venues, including any vaccine mandates or testing requirements, the severity and duration of the coronavirus pandemic by market, including outbreaks of variants, the rate of vaccination and the efficacy of vaccines against the coronavirus and related variants. We continue to actively monitor the ongoing evolution of the coronavirus pandemic and resulting impacts to our business.
Despite the improvements in re-openings of on-premise locations, closures and openings with restrictions impacted the financial results during the three and nine months ended September 30, 2021. Certain governmental entities across Europe, particularly throughout the U.K., required that bars and restaurants close during the first quarter of 2021 which negatively impacted the on-premise sales of our beverages in the first and second quarter of 2021. Certain countries in Europe have begun to lift lockdown restrictions, particularly in the U.K. which resulted in the reopening of certain on-premise locations early in the second quarter of 2021 with full measures removed early in the third quarter of 2021. While Western European countries have seen an increase in vaccination levels, certain Eastern European countries have lagged, and therefore, the risk of further COVID-19 restrictions and governmental imposed lockdowns remains throughout Europe. In addition, during the first half of 2021, certain provinces of Canada, including the most populous provinces, endured lockdowns pursuant to which bars and restaurants were required to close. During the third quarter of 2021, these venues began to reopen with varying degrees of restrictions. Throughout the first nine months of 2021, the U.S. progressively reopened, and by the end of the third quarter of 2021, sales to restaurants and bars have returned to near pre-coronavirus pandemic levels. Certain sporting events, festivals and other large public gatherings where our products are served have started to return with restrictions including proof of vaccination or negative coronavirus testing requirements. See "Outlook" for additional details. Sales to on-premise customers tend to be higher margin than sales to off-premise (retail outlets) customers. Throughout the world, any governmental or societal impositions of restrictions on public gatherings, especially if prolonged in nature will continue to impact on-premise traffic and, in turn, our business.
During the nine months ended September 30, 2020, we recorded charges of $15.5 million within cost of goods sold related to temporary "thank you" pay for certain essential North America brewery employees. Additionally, in order to support and demonstrate our commitment to the continued viability of the many bars and restaurants which were negatively impacted by the coronavirus pandemic, during the first quarter of 2020, we initiated temporary keg relief programs in many of our markets. We committed to provide customers with reimbursements for untapped kegs that met certain established return requirements in conjunction with the voluntary programs. As a result, during the nine months ended September 30, 2020, we recognized a reduction to net sales of $31.1 million, ($14.1 million for the North America segment and $17.0 million for the Europe segment), substantially all of which was recognized in the first quarter of 2020 other than immaterial adjustments for changes in estimates during the second and third quarter of 2020, reflecting estimated sales returns and reimbursements through these keg relief programs.
Further, during the nine months ended September 30, 2020, we recognized charges of $12.6 million ($9.7 million for the North America segment and $2.9 million for the Europe segment), substantially all of which was recognized in the first quarter other than immaterial adjustments for changes in estimates during the second and third quarter of 2020, within cost of goods sold related to obsolete finished goods keg inventories that were not expected to be sold within our freshness specifications, as well as the estimated costs to facilitate the above mentioned keg returns. See Part I—Item 1. Financial Statements, Note 1, “Basis of Presentation and Summary of Significant Accounting Policies” for additional details.
As a result of the ongoing impacts of the coronavirus pandemic, we continue to take various mitigating actions to offset some of the implications to our employees and communities, as well as the challenges to performance, while also ensuring liquidity and deleveraging remain key priorities. We continue to monitor the coronavirus pandemic and will take additional actions as necessary if the coronavirus pandemic takes a negative turn. Such potential actions may include, but are not limited to, drawing on our revolving line of credit facility, issuing additional commercial paper under our U.S. commercial paper program (see Part I—Item 1. Financial Statements, Note 8, "Debt" for further discussion of the facilities and our remaining capacity), further accessing the capital markets, reducing discretionary spending as well as capital expenditures and asset monetization.
In response to the global economic uncertainty created by the coronavirus pandemic, our board of directors suspended our regular quarterly dividends on our Class A and Class B common and exchangeable shares in May 2020. In the third quarter of 2021, a quarterly dividend was reinstated. See "Liquidity and Capital Resources" for additional information regarding the impact of the global coronavirus pandemic on our liquidity. While we are encouraged by the improvements through the third quarter of 2021, we continue to monitor the impacts of the coronavirus pandemic on the recoverability of our assets, including goodwill and indefinite-lived intangible assets. Given the length and severity of the impacts of the coronavirus pandemic on our Europe business, as well as the protracted recovery expected in certain on-premise markets, we recorded a goodwill impairment loss of $1,484.3 million in the fourth quarter of 2020. If the duration of the coronavirus pandemic is prolonged and the severity
of its impact worsens, it could result in additional significant impairment losses. See Part I—Item 1. Financial Statements, Note 7, "Goodwill and Intangible Assets" for further detail as well as Part I - Item 1A. "Risk Factors" in our Annual Report.
Revitalization Plan
On October 28, 2019, we initiated a revitalization plan designed to allow us to invest across our portfolio to drive long-term, sustainable success. The revitalization plan established Chicago, Illinois as our North American operational headquarters. We closed our office in Denver, Colorado and consolidated certain administrative functions into our other existing office locations. As of January 1, 2020, we changed our name to Molson Coors Beverage Company and changed our management structure to two segments - North America and Europe. We began to incur charges related to these restructuring activities during the fourth quarter of 2019 and will continue to incur charges through fiscal year 2021. See Part I—Item 1. Financial Statements, Note 5, "Special Items" for further details.
Items Affecting North America Segment Results of Operations
Texas Storm
In February 2021, a winter ice storm severely impacted the southern United States. In particular, local government authorities in Texas were forced to impose energy restrictions, causing the Fort Worth brewery to be offline which resulted in our inability to produce or ship product during the downtime.
Irwindale, California Brewery Sale
Following management approval in December 2019, in January 2020, we announced plans to cease production at our Irwindale, California brewery and entered into an option agreement with Pabst Brewing Company, LLC ("Pabst"), granting Pabst an option to purchase our Irwindale, California brewery, including plant equipment and machinery and the underlying land for $150 million, subject to adjustment as further specified in the option agreement. Pursuant to the option agreement, on May 4, 2020, Pabst exercised its option to purchase the Irwindale brewery and the purchase was completed in the fourth quarter of 2020. Production at the Irwindale brewery ceased during the third quarter of 2020. We recorded special items charges related to the Irwindale brewery closure during the nine months ended September 30, 2020 as further discussed in Part I—Item 1. Financial Statements, Note 5, "Special Items."
Montreal Brewery Sale
In further efforts to help optimize the North America brewery network, in the third quarter of 2017, we announced a plan to build a more efficient and flexible brewery in Longueuil, Quebec. During the second quarter of 2019, we completed the sale of our Montreal brewery for $96.2 million, resulting in a $61.3 million gain, which was recorded as a special item. In conjunction with the sale, we agreed to lease back the existing property to continue operations on an uninterrupted basis until the new brewery is operational, which we currently expect to occur in the fourth quarter of 2021. We will continue to incur significant capital expenditures associated with the construction of the new brewery in Longueuil, Quebec, through its estimated completion.
Aluminum Prices
The volatility of aluminum prices, inclusive of Midwest Premium and tariffs, continued to significantly impact our results during the first three quarters of 2021. To the extent these prices continue to fluctuate, our business and financial results could be materially adversely impacted. We continue to monitor these risks and rely on our risk management hedging program to help mitigate price risk exposure for commodities including aluminum and fuel.
Consolidated Results of Operations
The following table highlights summarized components of our unaudited condensed consolidated statements of operations for the three and nine months ended September 30, 2021 and September 30, 2020. See Part I-Item 1. Financial Statements for additional details of our U.S. GAAP results.
| Three Months Ended | Nine Months Ended | ||||||||||||||||||||||||||||||||||
| September 30, 2021 | September 30, 2020 | % change | September 30, 2021 | September 30, 2020 | % change | ||||||||||||||||||||||||||||||
| (In millions, except percentages and per share data) | |||||||||||||||||||||||||||||||||||
| Financial volume in hectoliters | 22.851 | 23.789 | (3.9) | % | 62.891 | 64.803 | (3.0) | % | |||||||||||||||||||||||||||
| Net sales | $ | 2,822.7 | $ | 2,753.5 | 2.5 | % | $ | 7,660.5 | $ | 7,359.7 | 4.1 | % | |||||||||||||||||||||||
| Net income (loss) attributable to MCBC | $ | 453.0 | $ | 342.8 | 32.1 | % | $ | 925.7 | $ | 420.8 | 120.0 | % | |||||||||||||||||||||||
| Net income (loss) attributable to MCBC per diluted share | $ | 2.08 | $ | 1.58 | 31.6 | % | $ | 4.26 | $ | 1.94 | 119.6 | % |
N/M = Not meaningful
Third Quarter 2021 Financial Highlights
Net sales of approximately $2.8 billion in the third quarter of 2021 increased 2.5% from the prior year, primarily due to strong net pricing in both North America and Europe, favorable brand mix from premiumization of the portfolio, as well as positive channel mix as the on-premise continues to reopen, particularly in Europe and Canada, partially offset by the impact of lower financial volumes driven by economy brand declines and U.S. domestic shipment timing. Financial volumes declined 3.9% primarily due to lower brand volumes. Brand volumes decreased 3.6% primarily due to a decline in the U.S. driven by economy brands including the de-prioritzation of non-core SKUs, as well as lower Central Europe volumes and the cycling of prior year volumes of our India business which was disposed of in the first quarter of 2021, partially offset by brand volume growth in Canada and Latin America as the on-premise continues to re-open.
During the third quarter of 2021, we recognized net income attributable to MCBC of $453.0 million compared to $342.8 million in the prior year. The increase was primarily due to lower tax expense primarily driven by a tax benefit recorded due to the effective settlement reached on a tax audit resulting in the release of certain unrecognized tax positions, strong net pricing, favorable brand and channel mix, lower special items charges, lower incentive compensation and favorable movement on unrealized mark-to-market valuations on our commodity positions, partially offset by increases in cost of goods sold from both inflation and mix, lower financial volumes and higher marketing spend.
Worldwide Brand and Financial Volume
Worldwide brand volume (or "brand volume" when discussed by segment) reflects owned or actively managed brands sold to unrelated external customers within our geographic markets (net of returns and allowances), royalty volume and our proportionate share of equity investment worldwide brand volume calculated consistently with MCBC owned volume. Financial volume represents owned brands sold to unrelated external customers within our geographical markets, net of returns and allowances as well as contract brewing, wholesale non-owned brand volume and company-owned distribution volume. Contract brewing and wholesaler volume is included within financial volume, but is removed from worldwide brand volume, as this is non-owned volume for which we do not directly control performance. Royalty volume consists of our brands produced and sold by third parties under various license and contract-brewing agreements and because this is owned volume, it is included in worldwide brand volume. Our worldwide brand volume definition also includes an adjustment from Sales-to-Wholesaler (STW) volume to Sales-to-Retailer (STR) volume. We believe the brand volume metric is important because, unlike financial volume and STWs, it provides the closest indication of the performance of our brands in relation to market and competitor sales trends.
| Three Months Ended | Nine Months Ended | ||||||||||||||||||||||||||||||||||
| September 30, 2021 | September 30, 2020 | % change | September 30, 2021 | September 30, 2020 | % change | ||||||||||||||||||||||||||||||
| (In millions, except percentages) | |||||||||||||||||||||||||||||||||||
| Volume in hectoliters: | |||||||||||||||||||||||||||||||||||
| Financial volume | 22.851 | 23.789 | (3.9) | % | 62.891 | 64.803 | (3.0) | % | |||||||||||||||||||||||||||
| Less: Contract brewing and wholesaler volume | (1.973) | (1.739) | 13.5 | % | (5.044) | (4.902) | 2.9 | % | |||||||||||||||||||||||||||
| Add: Royalty volume | 1.220 | 1.116 | 9.3 | % | 3.270 | 2.668 | 22.6 | % | |||||||||||||||||||||||||||
| Add: STW to STR adjustment | 0.443 | 0.211 | 110.0 | % | (0.197) | 0.148 | N/M | ||||||||||||||||||||||||||||
| Total worldwide brand volume | 22.541 | 23.377 | (3.6) | % | 60.920 | 62.717 | (2.9) | % | |||||||||||||||||||||||||||
| Worldwide Brand Volume by Segment in hectoliters | |||||||||||||||||||||||||||||||||||
| North America | 15.927 | 16.561 | (3.8) | % | 44.744 | 46.458 | (3.7) | % | |||||||||||||||||||||||||||
| Europe | 6.614 | 6.816 | (3.0) | % | 16.176 | 16.259 | (0.5) | % | |||||||||||||||||||||||||||
| Total | 22.541 | 23.377 | (3.6) | % | 60.920 | 62.717 | (2.9) | % |
Our worldwide brand volumes decreased 3.6% and 2.9% for the three and nine months ended September 30, 2021, respectively, compared to prior year. Financial volumes decreased 3.9% and 3.0% for the three and nine months ended September 30, 2021 respectively, compared to prior year. The decline in financial volumes for the three months ended September 30, 2021 was primarily due to lower brand volumes which decreased 3.6%. The decline in brand volumes was primarily due to a decline in the U.S. driven by economy brands including the de-prioritization of non-core SKUs, as well as lower Central Europe volumes and the cycling of prior year volumes of our India business that was disposed of in the first quarter of 2021, partially offset by brand volume growth in Canada and Latin America as the on-premise continues to re-open. The decline in financial volumes for the nine months ended September 30, 2021 was primarily due to the impacts of the coronavirus pandemic which had a greater impact in the 2021 first quarter due to on-premise restrictions in both Europe and North America, particularly in the U.K. and Canada, as well as the cycling of the March 2020 pantry loading at the onset of the coronavirus pandemic and the cycling of the prior year volumes of our India business that was disposed of in the first quarter of 2021.
Net Sales Drivers
For the three months ended September 30, 2021 versus September 30, 2020, by segment (in percentages)
| Financial Volume | Price, Product and Geography Mix | Currency | Total | ||||||||||||||||||||||||||
| Consolidated | (3.9) | % | 4.9 | % | 1.5 | % | 2.5 | % | |||||||||||||||||||||
| North America | (4.8) | % | 2.7 | % | 0.9 | % | (1.2) | % | |||||||||||||||||||||
| Europe | (2.0) | % | 16.7 | % | 4.5 | % | 19.2 | % |
For the nine months ended September 30, 2021 versus September 30, 2020, by segment (in percentages)
| Financial Volume | Price, Product and Geography Mix | Currency | Total | ||||||||||||||||||||||||||
| Consolidated | (3.0) | % | 4.9 | % | 2.2 | % | 4.1 | % | |||||||||||||||||||||
| North America | (3.7) | % | 4.1 | % | 1.2 | % | 1.6 | % | |||||||||||||||||||||
| Europe | (0.8) | % | 10.5 | % | 8.0 | % | 17.7 | % |
Income taxes
| Three Months Ended | Nine Months Ended | ||||||||||||||||||||||
| September 30, 2021 | September 30, 2020 | September 30, 2021 | September 30, 2020 | ||||||||||||||||||||
| Effective tax rate | 6 | % | 23 | % | 18 | % | 38 | % |
The decrease in the effective tax rate during the three and nine months ended September 30, 2021 compared to the prior year was primarily driven by a tax benefit of $68 million, including $49 million of a discrete tax benefit. This benefit was recorded due to the effective settlement reached on a tax audit resulting in the release of certain unrecognized tax positions during the third quarter of 2021. For the nine months ended September 30, 2021, the decrease in the effective tax rate from prior year was further impacted by the recognition of approximately $135 million of discrete tax expense related to the hybrid regulations enacted in the second quarter of 2020, as further discussed below.
During the second quarter of 2021, the U.K. government enacted, and royal assent was received for, legislation to increase the corporate income tax rate from 19% to 25%. Remeasurement of our deferred tax liabilities under the higher income tax rate resulted in the recognition of additional discrete tax expense of approximately $18 million in the second quarter of 2021. During the third quarter of 2020, the U.K. government enacted, and royal assent was received for, legislation to repeal the previously enacted reduction to the corporate income tax rate that had been due to take effect April 1, 2020, that changed the previously anticipated corporate income tax rate from 17% to 19%. Remeasurement of our deferred tax liabilities under the higher income tax rate resulted in the recognition of additional discrete tax expense of approximately $6 million in the third quarter of 2020.
Our tax rate is volatile and may increase or decrease with changes in, among other things, the amount and source of income or loss, our ability to utilize foreign tax credits, excess tax benefits or deficiencies from share-based compensation, changes in tax laws, and the movement of liabilities established pursuant to accounting guidance for uncertain tax positions as statutes of limitations expire, positions are effectively settled, or when additional information becomes available. There are proposed or pending tax law changes in various jurisdictions and other changes to regulatory environments in countries in which we do business that, if enacted, may have an impact on our effective tax rate.
Since 2018, the U.S. Department of Treasury has continued to issue proposed, temporary and final regulations to implement provisions of the 2017 Tax Act. The final hybrid regulations issued in April 2020 resulted in recognition of approximately $135 million of tax expense in the second quarter of 2020. As a result of the effective settlement reached during the third quarter of 2021, which included resolution of the impact of the hybrid regulations, we expect to pay cash tax and associated interest of approximately $125 million during the fourth quarter of 2021 in finalization of the audit.
Our unrecognized tax benefit position balance was reduced by approximately $250 million during the third quarter of 2021 due to the settlement reached on the tax audit including the hybrid regulations and certain other tax positions, with the amount of the anticipated cash tax payment after application of available net operating losses reclassified to accrued income taxes payable as of September 30, 2021. As of September 30, 2021, we anticipate immaterial changes to our remaining unrecognized tax benefit position within the next 12 months.
Refer to Part I - Item 1. Financial Statements, Note 6, "Income Tax" for discussion regarding our effective tax rate.
Segment Results of Operations
North America Segment
| Three Months Ended | Nine Months Ended | ||||||||||||||||||||||||||||||||||
| September 30, 2021 | September 30, 2020 | % change | September 30, 2021 | September 30, 2020 | % change | ||||||||||||||||||||||||||||||
| (In millions, except percentages) | |||||||||||||||||||||||||||||||||||
| Financial volume in hectoliters(1)(2) | 16.505 | 17.329 | (4.8) | % | 47.593 | 49.433 | (3.7) | % | |||||||||||||||||||||||||||
| Sales(2) | $ | 2,563.8 | $ | 2,609.4 | (1.7) | % | $ | 7,275.4 | $ | 7,213.2 | 0.9 | % | |||||||||||||||||||||||
| Excise taxes | (339.1) | (357.1) | (5.0) | % | (936.3) | (971.0) | (3.6) | % | |||||||||||||||||||||||||||
| Net sales(2) | 2,224.7 | 2,252.3 | (1.2) | % | 6,339.1 | 6,242.2 | 1.6 | % | |||||||||||||||||||||||||||
| Cost of goods sold(2) | (1,347.5) | (1,304.4) | 3.3 | % | (3,909.4) | (3,738.8) | 4.6 | % | |||||||||||||||||||||||||||
| Gross profit | 877.2 | 947.9 | (7.5) | % | 2,429.7 | 2,503.4 | (2.9) | % | |||||||||||||||||||||||||||
| Marketing, general and administrative expenses | (524.6) | (517.3) | 1.4 | % | (1,492.8) | (1,439.1) | 3.7 | % | |||||||||||||||||||||||||||
| Special items, net(3) | (7.1) | (29.3) | (75.8) | % | (19.4) | (172.5) | (88.8) | % | |||||||||||||||||||||||||||
| Operating income (loss) | 345.5 | 401.3 | (13.9) | % | 917.5 | 891.8 | 2.9 | % | |||||||||||||||||||||||||||
| Interest income (expense), net | (0.3) | (0.3) | 0.0 | % | (1.0) | (2.0) | (50.0) | % | |||||||||||||||||||||||||||
| Other income (expense), net | 0.5 | (0.2) | N/M | 1.6 | (1.3) | N/M | |||||||||||||||||||||||||||||
| Income (loss) before income taxes | $ | 345.7 | $ | 400.8 | (13.7) | % | $ | 918.1 | $ | 888.5 | 3.3 | % |
N/M = Not meaningful
(1)Excludes royalty volume of 0.619 million hectoliters and 1.771 million hectoliters for the three and nine months ended September 30, 2021, respectively, and excludes royalty volume of 0.584 million hectoliters and 1.387 million hectoliters for the three and nine months ended September 30, 2020, respectively.
(2)Includes gross inter-segment sales, purchases, and volumes, which are eliminated in the consolidated totals.
(3)See Part I—Item 1. Financial Statements, Note 5, "Special Items" for detail of special items.
Foreign currency impact on results
During the three and nine months ended September 30, 2021, foreign currency movements favorably impacted our income (loss) before income taxes by $2.1 million and $3.0 million, respectively. Included in these amounts are both translational and transactional impacts of changes in foreign exchange rates. The impact of transactional foreign currency gains and losses is recorded within other income (expense) in our unaudited condensed consolidated statements of operations.
Volume and net sales
Brand volume decreased 3.8% and 3.7% for the three and nine months ended September 30, 2021, respectively, compared to prior year. The decrease in the three months ended September 30, 2021 was primarily due to a decline in the U,S. driven by economy brands including the de-prioritzation of non-core SKUs, partially offset by growth in above premium. Brand volumes in Canada and Latin America grew as a result of the lower impact of on-premise restrictions in the third quarter of 2021. The decrease in the nine months ended September 30, 2021 was primarily due to a decline in the U.S. driven by economy brands including the de-prioritziation of non-core SKUs and declines in Canada, partially offset by growth in both Latin America and the U.S. above premium portfolio. Financial volume decreased 4.8% and 3.7% for the three and nine months ended September 30, 2021, compared to the prior year. The decrease for the three months ended September 30, 2021 was primarily due to lower brand volumes and unfavorable shipment timing in the U.S. The decrease for the nine months ended September 30, 2021 was primarily due to lower brand volume and lower U.S. shipments attributed to the March 2021 cybersecurity incident and the February 2021 Fort Worth, Texas brewery shut down due to a winter storm, offset by partial recovery subsequent from the first quarter of 2021 from those incidents.
Net sales per hectoliter on a brand volume basis in local currency increased 2.4% and 3.3% for the three and nine months ended September 30, 2021, respectively, compared to prior year. The increase in the three months ended September 30, 2021 was primarily due to net pricing increases and positive brand mix, partially offset by unfavorable geographic mix attributed to growing license volume in Latin America. The increase for the nine months ended September 30, 2021 was primarily due to net pricing increases, positive brand mix and the cycling of prior year estimated keg sales returns and reimbursement related to the on-premise impacts of the coronavirus pandemic, partially offset by unfavorable geographic mix attributed to growing license
volume in Latin America. Net sales per hectoliter on a financial volume basis in local currency increased 2.8% and 4.3% for the three and nine months ended September 30, 2021, respectively, compared to the prior year.
Cost of goods sold
Cost of goods sold per hectoliter in local currency increased 7.5% and 7.2% for the three and nine months ended September 30, 2021, respectively, compared to prior year primarily due to cost inflation, including higher transportation costs and other input costs, mix impacts due to the premiumization efforts and volume deleverage, partially offset by cost savings. The increase in the nine months ended September 30, 2021 was also due to increased inventory obsolescence and the cycling of the favorable prior year resolution of a property tax appeal for the Golden, Colorado brewery, partially offset by the cycling of finished good obsolescence reserves and related costs recognized in the first quarter of 2020 resulting from the on-premise impacts of the coronavirus pandemic and the cycling of prior year charges for the temporary "thank you" pay for certain essential North America brewery employees.
Marketing, general and administrative expenses
Marketing, general and administrative expenses increased 1.4% and 3.7% for the three and nine months ended September 30, 2021, respectively, compared to the prior year primarily due to increased marking investment behind innovation brands, Miller Lite and Coors Light as well as the cycling of lower spend in the prior year in areas impacted by the coronavirus pandemic, partially offset by lower incentive compensation expense, cost savings related to the revitalization plan, and equity income related to the TYC joint venture which started distribution in Texas in the third quarter of 2021.
Other income (expense), net
The change in other income (expense), net during the three and nine months ended September 30, 2021 was primarily due to foreign currency transaction (gains) losses and the unrealized mark-to-market changes on our HEXO warrants.
Europe Segment
| Three Months Ended | Nine Months Ended | ||||||||||||||||||||||||||||||||||
| September 30, 2021 | September 30, 2020 | % change | September 30, 2021 | September 30, 2020 | % change | ||||||||||||||||||||||||||||||
| (In millions, except percentages) | |||||||||||||||||||||||||||||||||||
| Financial volume in hectoliters(1)(2) | 6.351 | 6.478 | (2.0) | % | 15.317 | 15.443 | (0.8) | % | |||||||||||||||||||||||||||
| Sales(2) | $ | 874.6 | $ | 771.9 | 13.3 | % | $ | 1,987.1 | $ | 1,744.1 | 13.9 | % | |||||||||||||||||||||||
| Excise taxes | (273.6) | (267.8) | 2.2 | % | (658.7) | (615.3) | 7.1 | % | |||||||||||||||||||||||||||
| Net sales(2) | 601.0 | 504.1 | 19.2 | % | 1,328.4 | 1,128.8 | 17.7 | % | |||||||||||||||||||||||||||
| Cost of goods sold(2) | (376.5) | (313.9) | 19.9 | % | (877.3) | (783.8) | 11.9 | % | |||||||||||||||||||||||||||
| Gross profit | 224.5 | 190.2 | 18.0 | % | 451.1 | 345.0 | 30.8 | % | |||||||||||||||||||||||||||
| Marketing, general and administrative expenses | (140.2) | (117.2) | 19.6 | % | (396.6) | (349.6) | 13.4 | % | |||||||||||||||||||||||||||
| Special items, net(3) | 9.7 | (30.4) | N/M | 2.1 | (38.1) | N/M | |||||||||||||||||||||||||||||
| Operating income (loss) | 94.0 | 42.6 | 120.7 | % | 56.6 | (42.7) | N/M | ||||||||||||||||||||||||||||
| Interest income (expense), net | (1.5) | (1.3) | 15.4 | % | (4.5) | (4.0) | 12.5 | % | |||||||||||||||||||||||||||
| Other income (expense), net | (0.8) | (0.4) | 100.0 | % | (2.4) | (0.2) | N/M | ||||||||||||||||||||||||||||
| Income (loss) before income taxes | $ | 91.7 | $ | 40.9 | 124.2 | % | $ | 49.7 | $ | (46.9) | N/M |
N/M = Not meaningful
(1)Excludes royalty volume of 0.601 million hectoliters and 1.499 million hectoliters for the three and nine months ended September 30, 2021, respectively, and excludes royalty volume of 0.532 million hectoliters and 1.281 million hectoliters for the three and nine months ended September 30, 2020, respectively.
(2)Includes gross inter-segment sales, purchases, and volumes, which are eliminated in the consolidated totals.
(3)See Part I - Item I. Financial Statements, Note 5, "Special Items" for detail of special items.
Foreign currency impact on results
Our Europe segment operates in numerous countries and each country's operations utilize distinct currencies. During the three months ended September 30, 2021, foreign currency movements favorably impacted our income before income taxes by $2.6 million and during the nine months ended September 30, 2021, foreign currency movements unfavorably impacted our income before income taxes by $0.9 million. Included in this amount are both translational and transactional impacts of changes in foreign exchange rates. The impact of transactional foreign currency gains and losses is recorded within other income (expense) in our unaudited condensed consolidated statements of operations.
Volume and net sales
Brand volume decreased 3.0% and 0.5% for the three and nine months ended September 30, 2021, respectively, compared to prior year. The decrease in brand volume was primarily due to increased on-premise restrictions in certain Central and Eastern European markets and the cycling of prior year volumes of our India business which was disposed of in the first quarter of 2021. Financial volume decreased 2.0% and 0.8% for the three and nine months ended September 30, 2021, respectively, compared to prior year.
Net sales per hectoliter on a brand volume basis in local currency increased 11.0% and 8.0% for the three and nine months ended September 30, 2021, respectively, compared to prior year. The increase in the three and nine months ended September 30, 2021 was primarily due to favorable sales mix and positive net pricing, as well as cycling prior year estimated keg sales returns related to the on-premise impacts of the coronavirus pandemic. Net sales per hectoliter on a financial volume basis in local currency increased 17.0% and 10.6% for the three and nine months ended September 30, 2021, respectively, compared to prior year.
Cost of goods sold
Cost of goods sold per hectoliter in local currency increased 17.5% and 5.1% for the three and nine months ended September 30, 2021, respectively, compared to prior year. The increase in the three and nine months ended September 30, 2021 was primarily due to the impact of sales mix and cost inflation, partially offset by cost savings.
Marketing, general and administrative expenses
Marketing, general and administrative expenses increased 19.6% and 13.4% for the three and nine months ended September 30, 2021, respectively, compared to prior year. The increase in the three and nine months ended September 30, 2021 was primarily due to increased support for our brands, as well as the reinstatement of certain general and administrative expenses to respond efficiently to the market as it begins to recover from the impact of the coronavirus pandemic and unfavorable impacts of foreign currency.
Unallocated
| Three Months Ended | Nine Months Ended | ||||||||||||||||||||||||||||||||||
| September 30, 2021 | September 30, 2020 | % change | September 30, 2021 | September 30, 2020 | % change | ||||||||||||||||||||||||||||||
| (In millions, except percentages) | |||||||||||||||||||||||||||||||||||
| Financial volume in hectoliters | — | — | — | % | — | — | — | % | |||||||||||||||||||||||||||
| Sales | $ | — | $ | — | — | % | $ | — | $ | — | — | % | |||||||||||||||||||||||
| Excise taxes | — | — | — | % | — | — | — | % | |||||||||||||||||||||||||||
| Net sales | — | — | — | % | — | — | — | % | |||||||||||||||||||||||||||
| Cost of goods sold | 91.9 | 64.4 | 42.7 | % | 315.3 | 24.7 | N/M | ||||||||||||||||||||||||||||
| Gross profit | 91.9 | 64.4 | 42.7 | % | 315.3 | 24.7 | N/M | ||||||||||||||||||||||||||||
| Marketing, general and administrative expenses | — | — | — | % | — | — | — | % | |||||||||||||||||||||||||||
| Special items, net | — | — | — | % | — | — | — | % | |||||||||||||||||||||||||||
| Operating income (loss) | 91.9 | 64.4 | 42.7 | % | 315.3 | 24.7 | N/M | ||||||||||||||||||||||||||||
| Interest income (expense), net | (61.5) | (66.3) | (7.2) | % | (191.0) | (200.5) | (4.7) | % | |||||||||||||||||||||||||||
| Other pension and postretirement benefits (costs), net | 12.9 | 7.6 | 69.7 | % | 38.9 | 22.7 | 71.4 | % | |||||||||||||||||||||||||||
| Other income (expense), net | (0.1) | 3.0 | N/M | (1.5) | 4.9 | N/M | |||||||||||||||||||||||||||||
| Income (loss) before income taxes | $ | 43.2 | $ | 8.7 | N/M | $ | 161.7 | $ | (148.2) | N/M |
N/M = Not meaningful
Cost of goods sold
The unrealized changes in fair value on our commodity swaps, which are economic hedges, are recorded as cost of goods sold within unallocated and make up the entirety of the activity presented within cost of goods sold in the table above for the three and nine months ended September 30, 2021 and September 30, 2020. As the exposure we are managing is realized, we reclassify the gain or loss to the segment in which the underlying exposure resides, allowing our segments to realize the economic effects of the derivative without the resulting unrealized mark-to-market volatility. See Part I—Item 1. Financial Statements, Note 11, "Derivative Instruments and Hedging Activities" for further information.
Interest income (expense), net
Net interest expense decreased for the three and nine months ended September 30, 2021 compared to the prior year, primarily due to the repayment of debt as part of our deleveraging commitments. See Part I—Item 1. Financial Statements, Note 8, "Debt" for further details.
Other pension and postretirement benefit (costs), net
Unallocated other pension and postretirement benefits increased for the three and nine months ended September 30, 2021 compared to the prior year primarily due to lower pension and postretirement non-service costs.
Liquidity and Capital Resources
Our primary sources of liquidity have included cash provided by operating activities and access to external capital. However, the worldwide disruption caused by the coronavirus pandemic could materially affect our future access to our sources of liquidity. In the event of a sustained market deterioration and declines in net sales, profit and operating cash flow, we may need additional liquidity, which would require us to evaluate available alternatives and take appropriate actions. We currently believe that our cash and cash equivalents, cash flows from operations and cash provided by short-term and long-term borrowings, when necessary, will be adequate to meet our ongoing operating requirements, scheduled principal and interest payments on debt, capital expenditures and other obligations for the twelve months subsequent to the date of the issuance of this quarterly report, and our long-term liquidity requirements.
We continue to focus on navigating the lingering challenges presented by the coronavirus pandemic by preserving our liquidity and managing our cash flow through taking preemptive action to enhance our ability to meet our short-term liquidity needs. Specifically, we have taken several actions and considered various potential actions that may be needed to meet short-term and mid-term liquidity needs and have resources in place should we need to act on any of these quickly. Such potential actions include, but are not limited to, drawing on our $1.5 billion revolving credit facility, including issuing commercial paper
under our U.S. commercial paper program (see Part I—Item 1. Financial Statements, Note 8, "Debt" regarding details of our current borrowings and remaining capacities under these programs), further accessing the capital markets, reducing discretionary spending including marketing, general and administrative expenses as well as capital expenditures, asset monetization, and taking advantage of certain government-sponsored legislation and programs. In addition, we and our board of directors continue to actively evaluate various capital allocation considerations.
While we currently expect to have the necessary cash on hand to repay obligations when due, declines in net sales and profit could have a material adverse effect on our financial operations, cash flow and our ability to raise capital. The effects of the coronavirus pandemic are ongoing, and because of its dynamic nature, including uncertainties relating to the spread of variants, the rate of vaccinations and the efficacy of vaccines, the duration of the coronavirus pandemic, the duration of on-premise restrictions and closures and related prolonged weakening of economic or other negative conditions, including the impacts on the global supply chain and governmental reactions, we cannot fully anticipate future conditions given the substantial uncertainties in the economy in general. We may have unexpected costs and liabilities; revenue and cash provided by operations may decline; macroeconomic conditions may weaken; prolonged and severe levels of unemployment may negatively impact our consumers; and competitive pressures may increase. These factors may result in difficulty maintaining liquidity, meeting our deleverage commitments and complying with our revolving credit facility covenants. As a result, our credit ratings could be downgraded, which would increase our costs of future borrowing and harm our ability to refinance our debt in the future on acceptable terms or at all. However, in anticipation of these uncertainties, we entered into Amendment No. 2 to our $1.5 billion revolving credit facility on June 19, 2020. While the amendment did not increase our borrowing capacity or extend the term of the facility, it, among other things, (i) temporarily increased certain levels of the applicable rate by 25 basis points for the period that began June 19, 2020 and ended on the last day of the fiscal quarter ended September 30, 2021, and (ii) revised the leverage ratios under the financial maintenance covenant for each fiscal quarter ending on or after June 30, 2020 through the maturity of the credit agreement.
There can be no assurance that we will be able to secure additional liquidity if our revolving credit facility is fully drawn, the capital markets become inaccessible or if our credit rating is adversely impacted, which may result in difficulties in accessing debt markets or increase our debt costs. Even if we have access to the capital markets, we may not be able to raise capital on acceptable terms or at all. If we are unable to maintain or access adequate liquidity, our ability to timely pay our obligations when due could be adversely affected.
Continued disruption and declines in the global economy could also impact our customers' liquidity and capital resources and therefore our ability to collect, or the timeliness of collection of our accounts receivable from them, which may have a material adverse impact on our performance, cash flows and capital resources. We continue to monitor our accounts receivable aging and have recorded reserves as appropriate. In addition, measures taken by governmental agencies to provide relief to businesses could further impact our ability to collect from customers. See Part I—Item 1. Financial Statements, Note 1, “Basis of Presentation and Summary of Significant Accounting Policies” for additional discussion related to our accounts receivable and associated reserves.
Additionally, in response to the coronavirus pandemic, various governmental authorities globally have implemented relief programs which we continue to monitor and evaluate, such as the CARES Act in the U.S. Certain of these relief programs provide temporary deferrals of non-income based tax payments, which positively impacted our operating cash flows in 2020. Of the $130 million of temporary tax payment deferrals as of December 31, 2020, approximately $75 million was repaid during the three months ended September 30, 2021, with approximately $55 million outstanding as of September 30, 2021. Of the remaining balance, more than half is expected to be paid in the fourth quarter of 2021.
While a significant portion of our cash flows from operating activities is generated within the U.S., our cash balances may be comprised of cash held outside the U.S. and in currencies other than USD. As of September 30, 2021, approximately 89% of our cash and cash equivalents were located outside the U.S., largely denominated in foreign currencies. The recent fluctuations in foreign currency exchange rates may have a material impact on these foreign cash balances. When the earnings are considered indefinitely reinvested outside of the U.S., we do not accrue taxes. To the extent necessary, we accrue for tax consequences on the earnings of our foreign subsidiaries upon repatriation. However, we continue to assess the impact of the 2017 Tax Act and related U.S. Department of Treasury proposed, temporary and final regulations, on the tax consequences of future cash repatriations. We utilize a variety of tax planning and financing strategies in an effort to ensure that our worldwide cash is available in the locations in which it is needed. We periodically review and evaluate these strategies, including external committed and non-committed credit agreements accessible by MCBC and each of our operating subsidiaries. We believe these financing arrangements, along with the cash generated from the operations of our U.S. business and other liquidity measures resulting from considerations of the on-going coronavirus global pandemic, as discussed above, are sufficient to fund our current cash needs in the U.S.
Additionally, our cash balances in foreign countries are often subject to additional restrictions and covenants. We may, therefore, have difficulties repatriating cash held outside of the U.S. which would also be subject to various repatriation taxes.
In some countries repatriation of certain foreign balances is restricted by local laws and could have adverse tax consequences if we were to move the cash to another country. These limitations may affect our ability to fully utilize our cash resources for needs in the U.S. or other countries and may adversely affect our liquidity.
Separately, as discussed in Part I - Item 1. Financial Statements, Note 6, "Income Tax", the U.S. Department of Treasury issued final hybrid regulations in April 2020, which resulted in recognition of approximately $135 million in the second quarter of 2020. As a result of the effective settlement reached during the third quarter of 2021, which included resolution of the impact of the hybrid regulations, we expect to pay cash tax and associated interest of approximately $125 million during the fourth quarter of 2021 in finalization of the audit.
Cash Flows and Use of Cash
Our business generates positive operating cash flow each year, and our debt maturities are of a longer-term nature. However, our liquidity could be impacted significantly by the risk factors we described in Part I—Item 1A. "Risk Factors" in our Annual Report, Part II-Item 1A. "Risk Factors" in this report and the items listed above.
Cash Flows from Operating Activities
Net cash provided by operating activities of $1,267.7 million for the nine months ended September 30, 2021 decreased $225.5 million compared to $1,493.2 million for the nine months ended September 30, 2020, primarily due to the unfavorable timing of working capital, higher cash paid for taxes and lower net income adjusted for non-cash add-backs, partially offset by lower interest paid. The nine months ended September 30, 2020 benefited from over $200 million of net tax payment deferrals related to various government-sponsored deferral programs associated with the coronavirus pandemic while during the nine months ended September 30, 2021, we made approximately $75 million of net repayments against the tax payment deferral.
Cash Flows from Investing Activities
Net cash used in investing activities of $353.1 million for the nine months ended September 30, 2021 decreased $98.2 million compared to $451.3 million for the nine months ended September 30, 2020, primarily due to lower capital expenditures and higher proceeds from sales of properties and other assets, partially offset by higher cash outflows from other investing activities. Lower capital expenditures were the result of the timing of capital projects.
Cash Flows from Financing Activities
Net cash used in financing activities of $1,049.6 million for the nine months ended September 30, 2021 increased $208.3 million compared to $841.3 million for the nine months ended September 30, 2020 primarily due to lower borrowings under our revolving credit facility and commercial paper program and higher net debt repayments, partially offset by lower dividend payments and lower net cash outflows from other financing activities.
Capital Resources
Cash and Cash Equivalents
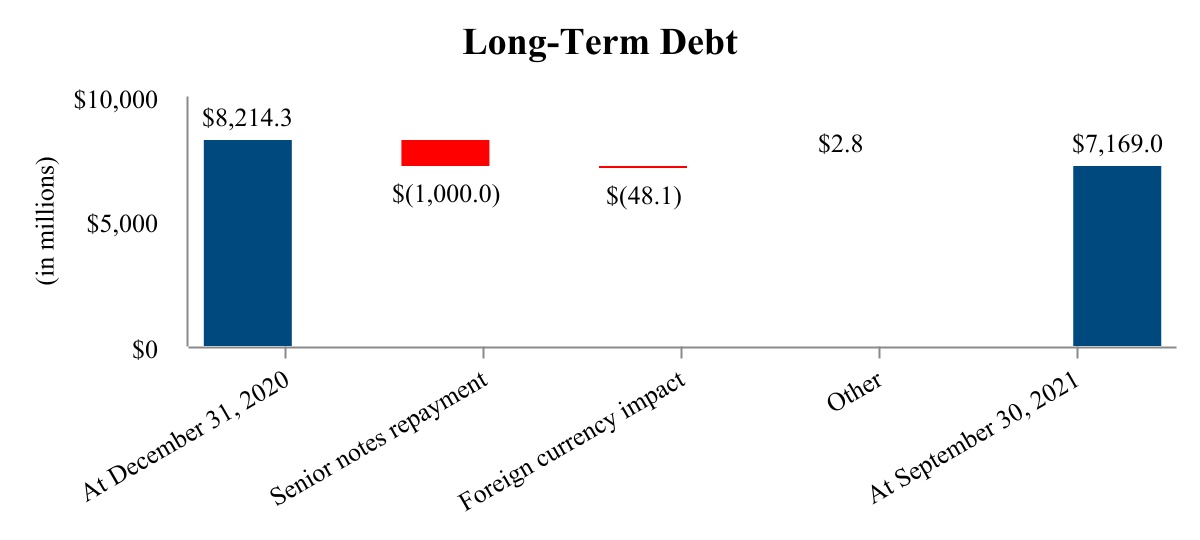
We had total cash and cash equivalents of $616.3 million as of September 30, 2021, compared to $770.1 million as of December 31, 2020 and $731.3 million as of September 30, 2020. The decrease in cash and cash equivalents from December 31, 2020 and September 30, 2020 was primarily due to net debt repayments, including the repayment of our $1.0 billion 2.1% senior notes which matured in July 2021, capital expenditures and dividend payments, partially offset by net cash provided by operating activities and proceeds from the sale of properties and other assets. The decrease from September 30, 2020 was further driven by net commercial paper repayments.
Borrowings
We repaid in full our $1.0 billion 2.1% notes that matured on July 15, 2021 using a combination of commercial paper borrowings and cash on hand and also settled the associated cross currency swap. Notional amounts below are presented in USD based on the applicable exchange rate as of September 30, 2021. Refer to Part I—Item 1. Financial Statements, Note 8, "Debt" for details.
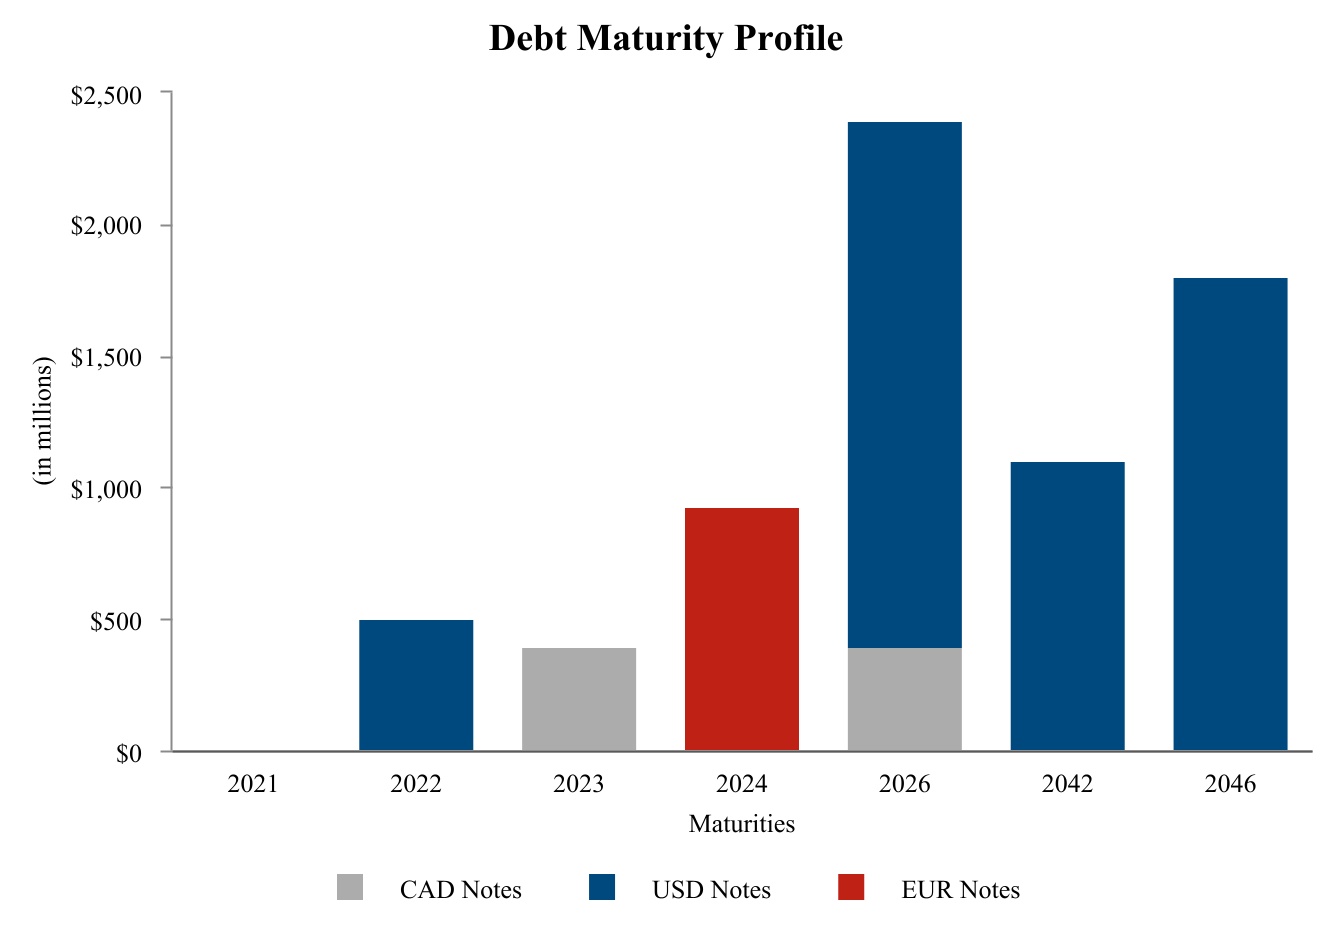
Based on the credit profile of our lenders that are party to our credit facilities, we are confident in our ability to continue to draw on our revolving credit facility if the need arises. As of September 30, 2021, we had $1.5 billion available to draw on our $1.5 billion revolving credit facility. The borrowing capacity is also reduced by borrowings under our commercial paper program. As of September 30, 2021, we had total outstanding borrowings under our commercial paper program of approximately $45 million.
We intend to further utilize our cross-border, cross currency cash pool as well as our commercial paper programs for liquidity as needed. We also have JPY, CAD, GBP and USD overdraft facilities as well as an additional JPY line of credit across several banks should we need additional short-term liquidity.
Under the terms of each of our debt facilities, we must comply with certain restrictions. These include customary events of default and specified representations, warranties and covenants, as well as covenants that restrict our ability to incur certain additional priority indebtedness (certain thresholds of secured consolidated net tangible assets), certain leverage threshold percentages, create or permit liens on assets and restrictions on mergers, acquisitions and certain types of sale lease-back transactions. Additionally, under the $1.5 billion revolving credit facility, the maximum leverage ratio as of September 30, 2021 is 4.50x net debt to EBITDA with a 0.50x reduction to 4.00x net debt to EBITDA for the fiscal quarter ending December 31, 2021 through maturity of the credit facility. As of September 30, 2021 and December 31, 2020, we were in compliance with all of these restrictions, have met such financial ratios and have met all debt payment obligations. All of our outstanding senior notes as of September 30, 2021 rank pari-passu.
See Part I—Item 1. Financial Statements, Note 8, "Debt" for further discussion of our borrowings and available sources of borrowing, including lines of credit.
Credit Rating
Our current long-term credit ratings are BBB-/Negative Outlook, Baa3/Stable Outlook and BBB(Low)/Negative Outlook with Standard & Poor's, Moody's and DBRS, respectively. Our short-term credit ratings are A-3, Prime-3 and R-2(low), respectively. A securities rating is not a recommendation to buy, sell or hold securities, and it may be revised or withdrawn at any time by the applicable rating agency.
Guarantor Information
SEC Registered Securities
For purposes of this disclosure, including the tables, "Parent Issuer" shall mean MCBC. "Subsidiary Guarantors" shall mean certain Canadian and U.S. subsidiaries reflecting the substantial operations of our North America segment.
Pursuant to the indenture dated May 3, 2012 (as amended, the "May 2012 Indenture"), MCBC issued its outstanding 3.5% senior notes due 2022 and 5.0% senior notes due 2042. Additionally, pursuant to the indenture dated July 7, 2016, MCBC issued its outstanding 2.1% senior notes due 2021 (subsequently repaid in July 2021), 3.0% senior notes due 2026, 4.2% senior notes due 2046 and 1.25% senior notes due 2024. The senior notes issued under the May 2012 Indenture and the July 2016 Indenture were registered under the Securities Act of 1933, as amended. These senior notes are guaranteed on a senior unsecured basis by certain subsidiaries of MCBC, which are listed on Exhibit 22 of our Annual Report (the "Subsidiary Guarantors", and together with the Parent Issuer, the "Obligor Group"). "Parent Issuer" in this section is specifically referring to
MCBC in its capacity as the issuer of the senior notes under the May 2012 Indenture and the July 2016 Indenture. Each of the Subsidiary Guarantors is 100% owned by the Parent Issuer. The guarantees are full and unconditional and joint and several.
None of our other outstanding debt was issued in a transaction that was registered with the SEC, and such other outstanding debt is issued or otherwise generally guaranteed on a senior unsecured basis by the Obligor Group or other consolidated subsidiaries of MCBC. These other guarantees are also full and unconditional and joint and several.
The senior notes and related guarantees rank pari-passu with all other unsubordinated debt of the Obligor Group and senior to all future subordinated debt of the Obligor Group. The guarantees can be released upon the sale or transfer of a Subsidiary Guarantors' capital stock or substantially all of its assets, or if such Subsidiary Guarantor ceases to be a guarantor under our other outstanding debt.
See Part I—Item 1. Financial Statements, Note 8, "Debt" for details of all debt issued and outstanding as of September 30, 2021.
The following summarized financial information relates to the Obligor Group as of September 30, 2021 on a combined basis, after elimination of intercompany transactions and balances between the Obligor Group, and excluding the investments in and equity in the earnings of any non-guarantor subsidiaries. The balances and transactions with non-guarantor subsidiaries have been separately presented.
Summarized Financial Information of Obligor Group
| Nine Months Ended | |||||
| September 30, 2021 | |||||
| (in millions) | |||||
| Net sales, out of which: | $ | 6,274.3 | |||
| Intercompany sales to non-guarantor subsidiaries | $ | 23.2 | |||
| Gross profit, out of which: | $ | 2,683.5 | |||
| Intercompany net costs from non-guarantor subsidiaries | $ | (312.3) | |||
| Net interest expense third parties | $ | (191.8) | |||
| Intercompany net interest income from non-guarantor subsidiaries | $ | 91.6 | |||
| Income before income taxes | $ | 1,146.3 | |||
| Net income | $ | 924.1 |
| As of September 30, 2021 | As of December 31, 2020 | ||||||||||
| (in millions) | |||||||||||
| Total current assets, out of which: | $ | 1,970.9 | $ | 1,662.5 | |||||||
| Intercompany receivables from non-guarantor subsidiaries | $ | 274.2 | $ | 184.4 | |||||||
| Total noncurrent assets, out of which: | $ | 25,293.4 | $ | 25,378.7 | |||||||
| Noncurrent intercompany notes receivable from non-guarantor subsidiaries | $ | 3,963.7 | $ | 3,962.2 | |||||||
| Total current liabilities, out of which: | $ | 2,720.6 | $ | 3,089.4 | |||||||
| Current portion of long-term debt and short-term borrowings | $ | 548.4 | $ | 1,001.4 | |||||||
| Intercompany payables due to non-guarantor subsidiaries | $ | 79.8 | $ | 72.3 | |||||||
| Total noncurrent liabilities, out of which: | $ | 13,723.2 | $ | 14,046.4 | |||||||
| Long-term debt | $ | 6,586.6 | $ | 7,129.8 | |||||||
| Noncurrent intercompany notes payable due to non-guarantor subsidiaries | $ | 4,289.4 | $ | 4,117.6 |
Foreign Exchange
Foreign exchange risk is inherent in our operations primarily due to the significant operating results that are denominated in currencies other than USD. Our approach is to reduce the volatility of cash flows and reported earnings which result from currency fluctuations rather than business related factors. Therefore, we closely monitor our operations in each country and seek
to adopt appropriate strategies that are responsive to foreign currency fluctuations. Our financial risk management policy is intended to offset a portion of the potentially unfavorable impact of exchange rate changes on net income and earnings per share. See Part II—Item 8. Financial Statements and Supplementary Data, Note 16, "Derivative Instruments and Hedging Activities" of our Annual Report for additional information on our financial risk management strategies.
Our consolidated financial statements are presented in USD, which is our reporting currency. Assets and liabilities recorded in foreign currencies that are the functional currencies for the respective operations are translated at the prevailing exchange rate at the balance sheet date. Translation adjustments resulting from this process are reported as a separate component of other comprehensive income. Revenue and expenses are translated at the average exchange rates during the respective period throughout the year. Gains and losses from foreign currency transactions are included in earnings for the period. The significant exchange rates to the USD used in the preparation of our consolidated financial results for the primary foreign currencies used in our foreign operations (functional currency) are as follows:
| Three Months Ended | Nine Months Ended | ||||||||||||||||||||||
| September 30, 2021 | September 30, 2020 | September 30, 2021 | September 30, 2020 | ||||||||||||||||||||
| Weighted-Average Exchange Rate (1 USD equals) | |||||||||||||||||||||||
| Canadian Dollar (CAD) | 1.26 | 1.34 | 1.26 | 1.35 | |||||||||||||||||||
| Euro (EUR) | 0.85 | 0.85 | 0.83 | 0.86 | |||||||||||||||||||
| British Pound (GBP) | 0.73 | 0.77 | 0.72 | 0.79 | |||||||||||||||||||
| Czech Koruna (CZK) | 21.63 | 22.72 | 21.32 | 23.71 | |||||||||||||||||||
| Croatian Kuna (HRK) | 6.36 | 6.46 | 6.26 | 6.68 | |||||||||||||||||||
| Serbian Dinar (RSD) | 99.81 | 101.25 | 98.23 | 104.16 | |||||||||||||||||||
| Romanian Leu (RON) | 4.17 | 4.12 | 4.12 | 4.22 | |||||||||||||||||||
| Bulgarian Lev (BGN) | 1.66 | 1.68 | 1.64 | 1.74 | |||||||||||||||||||
| Hungarian Forint (HUF) | 300.22 | 304.53 | 298.80 | 306.34 |
| As of | |||||||||||
| September 30, 2021 | December 31, 2020 | ||||||||||
| Closing Exchange Rate (1 USD equals) | |||||||||||
| Canadian Dollar (CAD) | 1.27 | 1.27 | |||||||||
| Euro (EUR) | 0.86 | 0.82 | |||||||||
| British Pound (GBP) | 0.74 | 0.73 | |||||||||
| Czech Koruna (CZK) | 21.89 | 21.47 | |||||||||
| Croatian Kuna (HRK) | 6.47 | 6.18 | |||||||||
| Serbian Dinar (RSD) | 101.52 | 96.34 | |||||||||
| Romanian Leu (RON) | 4.27 | 3.98 | |||||||||
| Bulgarian Lev (BGN) | 1.69 | 1.60 | |||||||||
| Hungarian Forint (HUF) | 310.43 | 296.94 |
The weighted-average exchange rates in the above table have been calculated based on the average of the foreign exchange rates during the relevant period and have been weighted according to the foreign denominated earnings from operations of the USD equivalent. If foreign currencies in the countries in which we operate devalue significantly in future periods, most significantly the CAD, GBP, EUR and other European operating currencies included in the above table, then the impact on USD reported earnings may be material.
Capital Expenditures
We incurred $334.5 million, and paid $363.4 million, for capital improvement projects worldwide in the nine months ended September 30, 2021, excluding capital spending by equity method joint ventures, representing a decrease of $38.8 million from the $373.3 million of capital expenditures incurred in the nine months ended September 30, 2020. This decrease was primarily due to the timing of expenditures for capital projects. We continue to focus on where and how we employ our planned capital expenditures, with an emphasis on strengthening our focus on required returns on invested capital as we determine how to best allocate cash within the business.
Contractual Obligations and Commercial Commitments
There were no material changes to our contractual obligations and commercial commitments outside the ordinary course of business or due to factors similar in nature to inflation, changing prices on operations or changes in the remaining terms of the contracts since December 31, 2020, as reported in Part II - Item 7. Management's Discussion and Analysis of Financial Condition and Results of Operations, Contractual Obligations and Commercial Commitments in our Annual Report with the exception of the repayment of our $1.0 billion 2.1% notes in July 2021. We continue to review and monitor our contractual obligations and commitments relative to the potential considerations resulting from the on-going coronavirus pandemic.
Guarantees
We guarantee indebtedness and other obligations to banks and other third parties for some of our equity method investments and consolidated subsidiaries. See Part I - Item 1. Financial Statements, Note 12, "Commitments and Contingencies" for further discussion.
Contingencies
We are party to various legal proceedings arising in the ordinary course of business, environmental litigation and indemnities associated with our sale of Kaiser to FEMSA. See Part I—Item 1. Financial Statements, Note 12, "Commitments and Contingencies" for further discussion.
Off-Balance Sheet Arrangements
Refer to Part II—Item 8 Financial Statements, Note 18, "Commitments and Contingencies" in our Annual Report for discussion of off-balance sheet arrangements. As of September 30, 2021, we did not have any other material off-balance sheet arrangements.
Outlook
While we have had setbacks in the year like the challenge with the February 2021 Texas winter storm, the March 2021 cybersecurity incident and the continued government restrictions related to the coronavirus pandemic, including those that shut down the entire on-premise channel in the U.K. in the first quarter, we are making progress against our strategic priorities and revitalization plan. We continue to strive to build on the strength of our iconic core brands, grow our above premium portfolio, expand beyond the beer aisle, invest in our capabilities and support our people and communities. Uncertainty still exists in the level of governmental or societal orders or restrictions on public gatherings and on-premise venues, including any vaccine mandates or testing requirements, the severity and duration of the coronavirus pandemic by market, including outbreaks of variants, the rate of vaccination and the efficacy of vaccines against the coronavirus and related variants and the impact this has on our customers and consumers. In addition, we experienced and continue to expect to incur higher than expected inflation, including increased transportation costs and input materials.
We made progress against our plan to build on the strength of our core brands, Coors Light and Miller Lite, by putting even more marketing behind these two iconic brands. This investment has proven fruitful as Coors Light increased its share of the total beer category in the United States in the third quarter of 2021. We plan to continue to build the strength of these two iconic brands and continue to invest in marketing behind the brands.
Our revitalization plan continues to deliver results as we grow our above premium portfolio and expand beyond the beer aisle. We focused efforts to de-prioritize non-core SKUs in the economy segment and premiumize our portfolio which has driven positive brand mix and incremental net sales revenue in 2021. Our growth in the above premium portfolio has been driven by the growth in our hard seltzer portfolio. We expanded our hard seltzer portfolio around the world with Vizzy and Coors Seltzer launching in Canada and will launch Topo Chico Hard Seltzer across Canada beginning in 2022. We plan to also expand distribution of Topo Chico Hard Seltzer to all markets in the U.S. and expand our product offerings including new packages and flavors. We launched the Three Fold hard seltzer brand in the U.K. and extended seltzers into Central Europe as well. We plan to continue to grow our share of the hard seltzer market. We invested in our hard seltzer production capacity in the U.S., Canada and the U.K. which we believe will drive efficiencies and improve our profit margin. In addition we announced the launch of our new flavor of Blue Moon LightSky.
During the third quarter 2021, TYC commenced retail operations with its first product sales in the state of Texas.
We are mindful of the continued challenges and the uncertainty that remains and are focused on doing what is best not only in the near-term, but also positioning the business for medium- and long-term success. Our improved financial flexibility has enabled us to invest in our business while continuing to de-lever our balance sheet and to issue a quarterly dividend.
Interest
We anticipate 2021 consolidated net interest expense of approximately $270 million, plus or minus 5%.
Deleverage & Dividends
We currently intend to maintain our investment grade debt rating and we are committed to further deleveraging in 2021 in accordance with our plans.
Tax
Our effective tax rate for 2021 will be significantly impacted by the tax benefit recorded during the third quarter of 2021 related to the effective settlement reached on a tax audit, which resulted in release of certain unrecognized tax positions. As a result of this settlement, we expect to pay cash tax and associated interest of approximately $125 million during the fourth quarter of 2021 in finalization of the audit.
Critical Accounting Estimates
Our accounting policies and accounting estimates critical to our financial condition and results of operations are set forth in our Annual Report and did not change during the first three quarters of 2021, except as noted below. See Part I—Item 1. Financial Statements, Note 2, "New Accounting Pronouncements" for discussion of recently adopted accounting pronouncements. See also Part I—Item 1. Financial Statements, Note 7, "Goodwill and Intangible Assets" for discussion of the results of our 2020 annual impairment testing analysis, the related risks to our indefinite-lived intangible brand assets and the goodwill amounts associated with our reporting units.
New Accounting Pronouncements Not Yet Adopted
See Part I—Item 1. Financial Statements, Note 2, "New Accounting Pronouncements" for a description of any new accounting pronouncements that have or could have a significant impact on our financial statements.
Previous: Item 1. FINANCIAL STATEMENTS (UNAUDITED) · Next: Item 3. QUANTITATIVE AND QUALITATIVE DISCLOSURES ABOUT MARKET RISK