 filings.tools
Item 5. MARKET FOR THE REGISTRANT’S COMMON EQUITY, RELATED SHAREHOLDER
3K characters. Original on sec.gov · Markdown
Item 5. MARKET FOR THE REGISTRANT’S COMMON EQUITY, RELATED SHAREHOLDER
MATTERS AND ISSUER PURCHASES OF EQUITY SECURITIES
Market Price of Common Stock
The Company’s common stock trades on the NASDAQ Global Select Market under the symbol "TECH." The following table sets forth for the periods indicated the high and low sales price per share for the Company’s common stock as reported by the NASDAQ Global Select Market.
| Fiscal 2015 Price | Fiscal 2014 Price | |||||||||||||||
|---|---|---|---|---|---|---|---|---|---|---|---|---|---|---|---|---|
| High | Low | High | Low | |||||||||||||
| 1st Quarter | $ | 97.15 | $ | 89.03 | $ | 83.83 | $ | 69.30 | ||||||||
| 2nd Quarter | 95.89 | 86.01 | 94.78 | 77.14 | ||||||||||||
| 3rd Quarter | 101.60 | 87.24 | 96.96 | 82.51 | ||||||||||||
| 4th Quarter | 103.56 | 95.37 | 93.06 | 82.63 |
Holders of Common Stock and Dividends Paid
As of August 26, 2015, there were over 31,000 beneficial shareholders of the Company’s common stock and over 150 shareholders of record. The Company paid quarterly cash dividends totaling $47.1 million, $45.4 million and $43.5 million in fiscal 2015, 2014 and 2013, respectively. The Board of Directors periodically considers the payment of cash dividends, and there is no guarantee that the Company will pay comparable cash dividends, or any cash dividends, in the future. The Company entered into a revolving line of credit in July 2014, which would prohibit payment of dividends to Company shareholders in the event of a default thereunder. The Credit Agreement that governs the revolving line of credit contains customary events of default.
Issuer Purchases of Equity Securities
There was no share repurchase activity by the Company in fiscal 2015. The maximum approximate dollar value of shares that may yet be purchased under the Company’s existing stock repurchase plan is approximately $125 million. The plan does not have an expiration date.
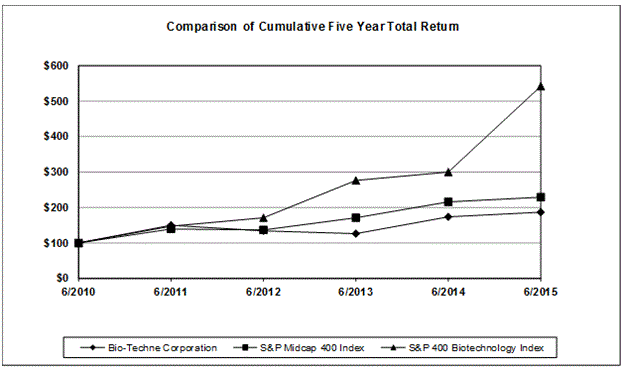
Stock Performance Graph
The following chart compares the cumulative total shareholder return on the Company’s common stock with the S&P Midcap 400 Index and the S&P 400 Biotechnology Index. The comparison assumes $100 was invested on the last trading day before July 1, 2010 in the Company’s common stock and in each of the foregoing indices and assumes reinvestment of dividends.
Previous: Item 3. LEGAL PROCEEDINGS · Next: Item 6. SELECTED FINANCIAL DATA