 filings.tools
Bio-Techne 2021 10-K Annual Report
TECH · CIK 842023 · Form 10-K · Fiscal year ended June 30, 2021 · Filed August 25, 2021
22 sections, 351K characters. Original on sec.gov · Markdown · JSON
Risk FactorsBusinessMD&AFinancial StatementsWhat changed vs 2020
Cover and table of contents
UNITED STATES
SECURITIES AND EXCHANGE COMMISSION
Washington, DC 20549
FORM 10-K
| ☒ | ANNUAL REPORT PURSUANT TO SECTION 13 OR 15(d) OF THE SECURITIES EXCHANGE ACT OF 1934 |
|---|
For the fiscal year ended June 30, 2021, or
| ☐ | TRANSITION REPORT PURSUANT TO SECTION 13 OR 15(d) OF THE SECURITIES EXCHANGE ACT OF 1934 |
|---|
For the transition period
from to
Commission file number 0-17272
BIO-TECHNE CORPORATION
(Exact name of registrant as specified in its charter)
| Minnesota | 41-1427402 | |
|---|---|---|
| (State or other jurisdiction of incorporation or organization) | (I.R.S. Employer Identification No.) | |
| 614 McKinley Place N.E. Minneapolis, MN 55413 | (612) 379-8854 | |
| (Address of principal executive offices) (Zip Code) | (Registrant's telephone number, including area code) |
Securities registered pursuant to Section 12(b) of the Act:
| Title of each class | Trading Symbol(s) | Name of each exchange on which registered |
|---|---|---|
| Common Stock, $0.01 par value | TECH | The NASDAQ Stock Market LLC |
Securities registered pursuant to Section 12(g) of the Act: None
Indicate by check mark if the registrant is a well-known seasoned issuer, as defined in Rule 405 of the Securities Act. Yes ☒ No ☐
Indicate by check mark if the registrant is not required to file reports pursuant to Section 13 or Section 15(d) of the Act. Yes ☐ No ☒
Indicate by check mark whether the registrant (1) has filed all reports required to be filed by Section 13 or 15(d) of the Securities Exchange Act of 1934 during the preceding 12 months (or for such shorter period that the registrant was required to file such reports), and (2) has been subject to such filing requirements for the past 90 days. Yes ☒ No ☐
Indicate by check mark whether the registrant has submitted electronically every Interactive Data File required to be submitted pursuant to Rule 405 of Regulation S-T during the preceding 12 months (or for such shorter period that the registrant was required to submit such files). Yes ☒ No ☐
Indicate by check mark if disclosure of delinquent filers pursuant to Item 405 of Regulation S-K is not contained herein, and will not be contained, to the best of registrant’s knowledge, in definitive proxy or information statements incorporated by reference in Part III of this Form 10-K or any amendment to this Form 10-K. ☒
Indicate by check mark whether the registrant is a large accelerated filer, an accelerated filer, a non-accelerated filer, smaller reporting company or an emerging growth company. See the definitions of “large accelerated filer,” “accelerated filer,” “smaller reporting company” and “emerging growth company” in Rule 12b-2 of the Exchange Act. (Check one):
| Large accelerated filer | ☒ | Accelerated filer | ☐ |
|---|---|---|---|
| Non-accelerated filer | ☐ | Smaller reporting company | ☐ |
| Emerging growth company | ☐ |
If an emerging growth company, indicate by check mark if the registrant has elected not to use the extended transition period for complying with any new or revised financial accounting standards provided pursuant to Section 13(a) of the Exchange Act. ☐
Indicate by check mark whether the registrant is a shell company (as defined in Rule 12b-2 of the Act). Yes ☐ No ☒
Indicate by check mark whether the registrant has filed a report on and attestation to its management’s assessment of the effectiveness of its internal control over financial reporting under Section 404(b) of the Sarbanes-Oxley Act (15 USC. 7262(b)) by the registered public accounting firm that prepared or issued its audit report. Yes ☒ No ☐
As of December 31, 2020 the aggregate market value of the Common Stock held by non-affiliates of the Registrant was $12.4 billion based upon the closing sale price as reported on The Nasdaq Stock Market ($317.55 per share). Shares of Common Stock held by each officer and director and by each person who owns 5% or more of the outstanding Common Stock have been excluded.
As of August 20, 2021, 39,079,539 shares of the Company’s Common Stock ($0.01 par value) were outstanding.
DOCUMENTS INCORPORATED BY REFERENCE
Portions of the Company’s Proxy Statement for its 2021 Annual Meeting of Shareholders are incorporated by reference into Part III.
In this Annual Report, the terms “Bio-Techne” or the “Company” refer to Bio-Techne Corporation, Bio-Techne Corporation and its consolidated subsidiaries, or the consolidated subsidiaries of Bio-Techne Corporation, as the context requires.
FORWARD-LOOKING INFORMATION AND CAUTIONARY STATEMENTS
Certain statements included or incorporated by reference in this Annual Report, in other documents we file with or furnish to the Securities and Exchange Commission (“SEC”), in our press releases, webcasts, conference calls, materials delivered to shareholders and other communications, are “forward-looking statements” within the meaning of the U.S. federal securities laws. All statements other than historical factual information are forward-looking statements, including without limitation statements regarding: projections of revenue, expenses, profit, profit margins, pricing, tax rates, tax provisions, cash flows, our liquidity position or other projected financial measures; management’s plans and strategies for future operations, including statements relating to anticipated operating performance, cost reductions, new product and service developments, competitive strengths or market position, acquisitions and the integration thereof, strategic opportunities, dividends and executive compensation; growth, declines and other trends in markets we sell into; new or modified laws, regulations and accounting pronouncements; future regulatory approvals and the timing and conditionality thereof; outstanding claims, legal proceedings, tax audits and assessments and other contingent liabilities; future foreign currency exchange rates and fluctuations in those rates; the potential or anticipated direct or indirect impact of COVID-19 on our business, results of operations and/or financial condition; general economic and capital markets conditions; the anticipated timing of any of the foregoing; assumptions underlying any of the foregoing; and any other statements that address events or developments that Bio-Techne intends or believes will or may occur in the future. Terminology such as “believe,” “anticipate,” “should,” “could,” “intend,” “will,” “plan,” “expect,” “estimate,” “project,” “target,” “may,” “possible,” “potential,” “forecast” and “positioned” and similar references to future periods are intended to identify forward-looking statements, although not all forward-looking statements are accompanied by such words. Forward-looking statements are based on assumptions and assessments made by our management in light of their experience and perceptions of historical trends, current conditions, expected future developments and other factors they believe to be appropriate. These forward-looking statements are subject to a number of risks and uncertainties, including but not limited to the risks and uncertainties set forth below and under “Item 1A. Risk Factors” in this Annual Report.
Forward-looking statements are not guaranties of future performance and actual results may differ materially from the results, developments and business decisions contemplated by our forward-looking statements. Accordingly, you should not place undue reliance on any such forward-looking statements. Forward-looking statements speak only as of the date of the report, document, press release, webcast, call, materials or other communication in which they are made. Except to the extent required by applicable law, we do not assume any obligation to update or revise any forward-looking statement, whether as a result of new information, future events and developments or otherwise.
Investment in our securities involves risk and uncertainty and you should carefully consider all information in this Annual Report on Form 10-K prior to making an investment decision regarding our securities. Below is a summary of material risks and uncertainties we face, which are discussed more fully in “Item 1A. Risk Factors”:
Business and Strategic Risks
| ● | Conditions in the global economy, the particular markets we serve and the financial markets brought about by material global crises may adversely affect our business and financial statements. |
|---|
| ● | U.S. and international political, economic, compliance and business factors, including the United Kingdom’s recent withdrawal from the European Union, can negatively impact our operations and financial results. |
|---|
| ● | The healthcare and life sciences industries that we serve face constant pressures and changes in an effort to reduce healthcare costs or increase their predictability, all of which may adversely affect our business and financial results. |
|---|
Acquisition and Investment Risks
| ● | Our inability to complete acquisitions at our historical rate and at appropriate prices, and to make appropriate investments that support our long-term strategy, could negatively impact our growth rate and stock price. |
|---|
| ● | Our acquisition of businesses, investments, joint ventures and other strategic relationships, if not properly implemented or integrated, could negatively impact our business and financial statements. |
|---|
| ● | We may be required to record a significant charge to earnings if our goodwill and other amortizable intangible assets, or other investments may become impaired, which could negatively impact our financial statements or stock price. |
|---|
Operational Risks
| ● | Our success will be dependent on recruiting and retaining highly qualified personnel and creating and maintaining a culture that includes the employees joining through acquisition. |
|---|
| ● | Our growth depends in part on the timely development and commercialization of new and enhanced products and services that meet our customers’ needs. Our growth can also be negatively impacted if our customers do not grow as anticipated. |
|---|
| ● | We face intense competition, and if we are unable to compete effectively, we may experience decreased demand and decreased market share or need to reduce prices to remain competitive. |
|---|
| ● | A significant disruption in, or breach of security of, our information technology systems or data, or violation of data privacy laws, could result in damage to our reputation, data integrity, and/or subject us to costs, fines, or lawsuits under data privacy or other laws or contractual requirements. |
|---|
| ● | If we suffer a loss to our facilities, supply chains, distribution systems or information technology systems due to catastrophe or other events, our operations could be seriously harmed. |
|---|
| ● | The manufacture of many of our products is a complex process, and if we directly or indirectly encounter problems manufacturing products, our business and financial statements could suffer. |
|---|
| ● | If we cannot adjust our manufacturing capacity or purchases required for our manufacturing activities to reflect changes in market conditions or customer demand, our business and financial statements may suffer. In addition, our reliance upon sole or limited sources of supply for certain materials, components and services can cause production interruptions, delays and inefficiencies. |
|---|
| ● | The Company relies heavily on internal manufacturing and related operations to produce, package and distribute its products which, if disrupted, could materially impair our business operations. Our business could be adversely affected by disruptions at our sites. |
|---|
| ● | Defects, unanticipated use of or inadequate disclosure with respect to our products, or allegations thereof, can adversely affect our business and financial statements. |
|---|
| ● | Because we rely heavily on third-party package-delivery services, a significant disruption in these services or significant increases in prices may disrupt our ability to ship products, increase our costs and lower our profitability. |
|---|
Intellectual Property Risks
| ● | We are dependent on maintaining our intellectual property rights. If we are unable to adequately protect our intellectual property, or if third parties infringe our intellectual property rights, we may suffer competitive injury or expend significant resources enforcing our rights. |
|---|
| ● | We may be involved in disputes to determine the scope, coverage and validity of others' proprietary rights, or to defend against third-party claims of intellectual property infringement, any of which could be time-intensive and costly and may adversely impact our business. |
|---|
Financial and Tax Risks
| ● | We have entered into and drawn on a revolving credit facility, and we may incur additional debt in the future. The burden of this additional debt could adversely affect us, make us more vulnerable to adverse economic or industry conditions, and prevent us from funding our expansion strategy. |
|---|
| ● | Our business and financial statements can be adversely affected by foreign currency exchange rates, changes in our tax rates and tax liabilities and assessments (including as a result of changes in tax laws). |
|---|
| ● | Dividends on our common stock could be reduced or eliminated in the future. |
|---|
Legal, Regulatory, Compliance and Reputational Risks
| ● | Our business is subject to extensive regulation; failure to comply with these regulations could adversely affect our business and financial results. |
|---|
| ● | Significant developments or changes in U.S. laws or policies, including changes in U.S. trade policies and tariffs and the reaction of other countries thereto, particularly in China, can have an adverse effect on our business and financial statements. |
|---|
| ● | Our business and financial statements can be impaired by improper conduct of any of our employees, agents, or business partners. |
|---|
| ● | Certain of our businesses are subject to extensive regulation by the U.S. FDA and by comparable agencies of other countries, as well as laws regulating fraud and abuse in the healthcare industry and the privacy and security of health information. Failure to comply with those regulations could adversely affect our business and financial statements. |
|---|
| ● | Failure to comply with privacy and security laws and regulations could result in fines, penalties and damage to the Company’s reputation and have a material adverse effect upon the Company’s business, a risk that has been elevated with the acquisition of Exosome Diagnostics, whose laboratory testing service is a healthcare provider that obtains and uses protected health information. |
|---|
Item 1. BUSINESS
OVERVIEW
Bio-Techne and its subsidiaries, collectively doing business as Bio-Techne Corporation (Bio-Techne, we, our, us or the Company), develop, manufacture and sell life science reagents, instruments and services for the research, diagnostics and bioprocessing markets worldwide. With our broad product portfolio and application expertise, we sell integral components of scientific investigations into biological processes and molecular diagnostics, revealing the nature, diagnosis, etiology and progression of specific diseases. Our products aid in drug discovery efforts and provide the means for accurate clinical tests and diagnoses.
We manage the business in two operating segments – our Protein Sciences segment and our Diagnostics and Genomics segment. Our Protein Sciences segment is a leading developer and manufacturer of high-quality biological reagents used in all aspects of life science research, diagnostics and cell and gene therapy. This segment also includes proteomic analytical tools, both manual and automated, that offer researchers and pharmaceutical manufacturers efficient and streamlined options for automated western blot and multiplexed ELISA workflow. Our Diagnostics and Genomics segment develops and manufactures diagnostic products, including controls, calibrators, and diagnostic assays for the regulated diagnostics market, exosome-based molecular diagnostic assays, advanced tissue-based in-situ hybridization assays for spatial genomic and tissue biopsy analysis, and genetic and oncology kits for research and clinical applications.
We are a Minnesota corporation with our global headquarters in Minneapolis, Minnesota. We were founded forty-five years ago, in 1976, as Research and Diagnostic Systems, Inc. We became a publicly traded company in 1985 through a merger with Techne Corporation, now Bio-Techne Corporation. Our common stock is listed on the NASDAQ under the symbol “TECH.” We operate globally, with offices in many locations throughout North America, Europe and Asia. Today, our product lines extend to over 350,000 products, most of which we manufacture ourselves in multiple locations in North America, as well as the U.K. and China.
Our historical focus was on providing high quality proteins, antibodies and immunoassays to the life science research market and hematology controls to the diagnostics market. Over the last eight years, we have been implementing a disciplined strategy to accelerate growth in part by acquiring businesses and product portfolios that leveraged and diversified our existing product lines, filled portfolio gaps with differentiated high growth businesses, and expanded our geographic scope. From fiscal years 2013 through 2021 we have acquired or made investments in seventeen companies that have expanded the product offerings and geographic footprint of both operating segments. Recognizing the importance of an integrated, global approach to meeting our mission and accomplishing our strategies, we have maintained many of the brands of the companies we have acquired, but unified under a single global brand -- Bio-Techne.
We are committed to providing the life sciences community with innovative, high-quality scientific tools that allow our customers to make extraordinary discoveries. We intend to build on Bio-Techne’s past accomplishments, high product quality reputation and sound financial position by executing strategies that position us to serve as the standard for biological content in the research market, and to leverage that leadership position to enter the diagnostics and other adjacent markets. Our strategies include:
Continued innovation in core products. Through collaborations with key opinion leaders, participation in scientific discussions and societies, and leveraging our internal talent we expect to be able to convert our continued significant investment in our research and development activities to be first-to-market with quality products that are at the leading edge of life science researchers’ needs.
Market and geographic expansion. We will continue to expand our sales staff and distribution channels globally in order to increase our global presence and make it easier for customers to transact with us. We will also leverage our existing portfolio to expand our product offerings into novel research fields and further into diagnostics and therapeutics markets.
Culture development and talent recruitment and retention. As we continue to grow both organically and through acquisition, we are intentionally fostering an “EPIC” culture based on the ideals of Empowerment, Passion, Innovation and Collaboration. We strive to recruit, train and retain the most talented staff, who will live out these EPIC ideals and implement our strategies effectively.
Targeted acquisitions and investments. We will continue to leverage our strong balance sheet to gain access to new and differentiated technologies and products that improve our competitiveness in the current market, meet customers’ expanding workflow needs and allow us to enter adjacent markets.
PROTEIN SCIENCES SEGMENT
Protein Sciences Segment Products and Markets
The Protein Sciences segment is the larger of our two segments, representing about 75% of our net sales in fiscal 2021. It is comprised of two divisions with complementary product offerings serving many of the same customers – the Reagent Solutions division and the Analytical Solutions division.
The Reagent Solutions division consists of specialized proteins, such as cytokines and growth factors, antibodies, small molecules, tissue culture sera and cell selection technologies traditionally used by researchers to further their life science experimental activities and by companies developing next generation diagnostics and therapeutics, including companies developing cell and gene-based therapeutics. Key product brands include R&D Systems, Tocris Biosciences and Novus Biologicals. Our combined chemical and biological reagents portfolio provides high quality tools that customers can use in solving complex biological pathways and glean knowledge that may lead to a more complete understanding of biological processes, and, ultimately, to the development of novel therapeutic strategies to address different pathologies. With the 2019 acquisitions of Quad Technologies, which has novel Quickgel™ technologies for cell separation and activation, and B-MoGen Technologies, which has a non-viral, transposon-based technology for gene editing called TcBuster, we have expanded our product offerings for the cell and gene therapy market. Through a collaborative marketing venture with two other companies, we have leveraged these and other products we have or are developing to provide a more complete offering for the cell and gene therapy market.
The Analytical Solutions division includes manual and automated protein analysis instruments and immunoassays that are used in quantifying proteins in a variety of biological fluids. Products in this division include traditional manual plate-based immunoassays, fully automated multiplex immunoassays on various instrument platforms, and automated western blotting and isoelectric focusing analysis of complex protein samples. Key product brands include R&D Systems and ProteinSimple. A number of our products have been demonstrated to have the potential to serve as predictive biomarkers and therapeutic targets for a variety of human diseases and conditions including cancer, autoimmunity, diabetes, hypertension, obesity, inflammation, neurological disorders, and kidney failure. Immunoassays can also be useful in clinical diagnostics. In fact, we have received Food and Drug Administration (FDA) marketing clearance for a few of our immunoassays for use as in vitro diagnostic devices. In response to the COVID-19 pandemic, we partnered with Mount Sinai Hospital and its commercial entity, Kantaro Biosciences, to rapidly develop and commercialize an immunoassay kit intended to test for antibodies to COVID-19, which has received regulatory clearance in several jurisdictions, including an Emergency Use Authorization from the FDA.
Protein Sciences Segment Customers and Distribution Methods
Our customers for this segment include researchers in academia, government and industry (chiefly pharmaceutical and biotech companies), as well as diagnostic/companion diagnostic and therapeutic customers, especially customers engaged in the development of cell and gene based therapies. Our biologics line of products in the Analytical Solutions division is used primarily by production and quality control departments at biotech and pharmaceutical companies. We sell our products directly to customers who are primarily located in North America, Europe and China, as well as through a distribution agreement with Fisher Scientific. We also sell through third party distributors in China, Japan, certain eastern European countries and the rest of the world. Our sales are widely distributed, and no single end-user customer accounted for more than 10% of the Protein Sciences segment's net sales during fiscal 2021, 2020 or 2019.
DIAGNOSTICS AND GENOMICS SEGMENT
The Diagnostics and Genomics segment, representing about 25% of our net revenues in fiscal 2021, is focused primarily on the diagnostics market and includes diagnostics reagents, genomics, our Exosome acquisition, and our Asuragen acquisition.
Diagnostics and Genomics Segment Products
The Diagnostic Reagents division consists of regulated products traditionally used as calibrators and controls in the clinical setting. Also included are instrument and process control products for hematology, blood chemistry, blood gases, coagulation controls and reagents used in various diagnostic applications. Often we manufacture these reagents on a custom basis, tailored to a customer's specific diagnostic assay technology. We supply these reagents in various formats including liquid, frozen, or in lyophilized form. Most of these products are sold on an Original Equipment Manufacturer (OEM) basis to instrument manufacturers, with most products being FDA-cleared.
The Genomics division includes products using nucleic acid (RNA or DNA) analysis that can be used for diagnostic or research applications. Key product brands include Advanced Cell Diagnostics, or ACD, Exosome Diagnostics, and Asuragen. ACD products are aimed at tissue biopsy and spatial analysis. Exosome Diagnostics focuses on exosome-based liquid biopsy techniques that analyze genes or their transcripts. The first commercialized test from Exosome Diagnostics is a urine-based assay for early detection of high-grade prostate cancer used as an aid in deciding the need for an initial biopsy. Our most recent acquisition is Asuragen, which makes and sells products for genetic carrier screening, oncology diagnostics, molecular controls, and research.
Diagnostics and Genomics Segment Customers and Distribution Methods
The majority of Diagnostic Reagents Division's sales are through OEM agreements, but we sell some of our diagnostics reagents products directly to customers and, in Europe and Asia, also through distributors. The customers for the ACD research products include researchers in academia as well as investigators in pharmaceutical and biotech companies. We sell our products directly to those customers who are primarily located in North America, Europe and China, and through distributors elsewhere. In addition to being useful research tools, our DNA and RNA in situ hybridization assays have diagnostics applications as well, and several are cleared or currently under review by the FDA in partnership with diagnostics instrument manufacturers and pharmaceutical companies. In the United States, we offer test services to physicians using our lab-developed non-invasive urine-based assay for prostate cancer detection. Our diagnostic laboratory is certified under and regulated by the State of Massachusetts pursuant to the Clinical Laboratory Improvement Amendments, or CLIA. Customers are physicians prescribing such tests for their patients. Finally, the Asuragen products are sold primarily to laboratories for use in lab-developed tests or in kit form as regulated diagnostic tests.
No customers accounted for 10% or more of the reporting segment's consolidated net sales during fiscal years 2021, 2020 or 2019.
MANUFACTURING AND MATERIALS
Our manufacturing operations use a wide variety of raw materials and components, including electronic components, chemicals and biological materials. No single supplier is material, although for some components that require particular specifications or regulatory or other qualifications there may be a single supplier or a limited number of suppliers that can readily provide such components. We utilize a number of techniques to address potential disruption in and other risks relating to our supply chain, including in certain cases the use of safety stock, alternative materials and qualification of multiple supply sources.
The majority of our products are shipped within one day of receipt of the customers' orders, other than our instruments and related cartridges, which are typically shipped within one to two weeks of receipt of an order. There was no significant backlog of orders for our products as of the date of this Annual Report on Form 10-K or as of a comparable date for fiscal 2021. For additional discussion of risks relating to supply chain and manufacturing, refer to “Item 1A. Risk Factors.”
COMPETITION
Although our segments both generally operate in highly competitive markets, it is difficult to determine our competitive position, either in the aggregate or by segment, since none of our competitors offer all of the same product and service lines or serve all of the same markets as the Company, or any of its segments, does. Because of the range of the products and services we sell, we encounter a wide variety of competitors, including a number of large, global companies or divisions of such companies with substantial capabilities and resources, as well a number of smaller, niche competitors with specialized product offerings. We have increased competition in a number of our markets as a result of the entry of new companies into certain markets, the entry of competitors based in low-cost manufacturing locations, and increasing consolidation in particular markets. The number of competitors varies by product line. Key competitive factors vary among the Company’s businesses, but include the specific factors noted above with respect to each particular business and typically also include price, quality and safety, performance, delivery speed, application expertise, service and support, technology and innovation, distribution network, breadth of product, service and software offerings and brand name recognition. We believe our competitive position is strong due to the unique aspects of many of our products and our product quality. For a discussion of risks related to competition, refer to “Item 1A. Risk Factors.”
SEASONALITY OF BUSINESS
Bio-Techne believes there is some seasonality as a result of vacation and academic schedules of its worldwide customer base, particularly for the Protein Sciences segment. A majority of Diagnostics Reagents division products are manufactured in large bulk lots and sold on a schedule set by the customer. Consequently, sales for that segment can be unpredictable, and not necessarily based on seasonality. As a result, we can experience material and sometimes unpredictable fluctuations in our revenue from the Diagnostics and Genomics segment.
RESEARCH AND DEVELOPMENT
Bio-Techne is engaged in continuous research and development in all of our major product lines. We believe that our future success depends, to a large extent, on our ability to keep pace with changing technologies and market needs. In response to the global pandemic that emerged in early 2020, we diverted some of our development resources to new and existing products to meet the needs associated with COVID-19, including a major effort by the development teams in our Protein Sciences Segment to develop a diagnostic immunoassay for testing antibodies to COVID-19. That immunoassay product has thus far had limited sales. However, there is no assurance that any of the products in the research and development phase can be successfully completed or, if completed, can be successfully introduced into the marketplace.
HUMAN CAPITAL
Through its subsidiaries, Bio-Techne employed approximately 2,600 full-time and part-time employees as of June 30, 2021, of whom approximately 2,000 were employed in the United States and approximately 600 outside the United States. None of the United States employees are unionized. Outside the United States, the Company has government-mandated collective bargaining arrangements or work councils in certain countries.
Bio-Techne is committed to attracting, developing, engaging and retaining the best people possible from around the world to sustain and grow our leadership position in life sciences tools and diagnostics. Our human capital strategy spans multiple key dimensions, including the following:
Culture and Governance
Our commitment to our people is reflected in our four EPIC values of Empowerment, Passion, Innovation and Collaboration. Those four values (together with their 12 supporting EPIC behaviors) are the backbone for the way we approach the leadership and direction of our work force. Employees are empowered to realize their potential. Our culture supports and encourages a collaborative approach to working with each other and with our customers. We encourage innovation to continually improve our products, services and processes, and our passion for science and the missions of our customers is our guiding light.
Our EPIC values are embedded in our culture and practices. By way of example, our performance management system and annual review processes incorporate our EPIC values. Each employee is measured against the behaviors and attributes that support those values. To further amplify our desired behaviours, we have an annual employee recognition program in which we ask for nominations and recognize winning individuals and teams form across our business who have best demonstrated our EPIC values during the previous year.
Bio-Techne’s Board of Directors reviews management succession planning annually, and its Executive Compensation Committee reviews the Company’s human capital strategy periodically in connection with significant initiatives and acquisitions, as well as part of its oversight of our executive and equity compensation programs. At the management level, our Vice President of Human Resources, who reports directly to our President and CEO, is responsible for the development and execution of the Company’s human capital strategy.
Engagement; Diversity and Belonging
Our engagement strategy focuses on developing the best workplace and best people leaders to meet our employees’ needs. We believe that strong employee engagement helps enable higher retention and better business performance. We assess our engagement performance through regular consultation with our managers and more formally via an annual engagement survey that assesses our employees’ overall experience.
This feedback informs and shapes our future employee-focused initiatives. These initiatives in the past have resulted in changes in programs and policies, including expansion of our management and leadership development programs, addition of a parental leave program, expansion of our incentive programs to include annual cash bonuses to all professional employees and above, introduction of flexible working and expanding the breadth of our Diversity & Belonging Council and Employee Resource Groups (ERGs).
We believe a diverse workforce and culture of inclusion is essential to drive innovation, fuel growth and help ensure our technologies and products effectively serve a global customer base. The Company’s executive-sponsored Diversity and Belonging initiative is focused on providing a welcoming working environment for all employees, continued education, broadening our candidate pools, and implementing and sustaining programs. Our ERGs, coordinated under the guidance of our executive-sponsored Employee Resource Group Council, offer mentorship, support and engagement to help our employees, including those from underrepresented groups, succeed and thrive. As of June 30, 2021, we had 8 ERGs operating globally. Furthermore, as of June 30, 2021, 50% of our total employee population was female, and 44% of our managerial employees were female. In the United States, 33% of our total employee population identified as nonwhite and 28% of our managerial employees identified as nonwhite.
Talent Development and Learning and Development
Bio-Techne invests in people development in the belief that growing and promoting employees from within the Company creates a more sustainable organization. High potential and promotable employees are identified through our annual Talent Management program, and are then equipped with a personal development and career advancement plan. These plans involve training and development from internal and external programs, together with mentoring and coaching.
Our global Learning and Development program delivers a wide range of initiatives including a validated suite of compliance training, soft skills, technical skills, business skills, interpersonal skills and career skills. Many of these programs are assigned to individuals specifically, but in addition, there is an expansive menu available to employees in order to accelerate their own development. As a company that regularly acquires other businesses, we believe it is important for employees to be trained in the skills and mindsets that enable them to respond positively to change. This initiative allows individuals to deal with change easily and reduces the need to run large scale change management programs.
Community
The Company believes in giving back and in supporting the local communities in which we live and work. Most sites or departments engage in local charitable causes and activities. In some of our sites, employees are encouraged to give through regular payroll deductions and through the annual campaign week where employee contributions are matched by the Company. United States employees receive a paid day off to participate in local opportunities to give back to the community.
INTELLECTUAL PROPERTY
Our success depends in part upon our ability to protect our core technologies and intellectual property. To accomplish this, we rely on a combination of intellectual property rights, including patents, trade secrets and trademarks, as well as customary contractual protections in our terms and conditions and other sales-related documentation.
As of June 30, 2021, we had rights to approximately 350 granted patents and approximately 250 pending patent applications. In particular, products in the Analytical Solutions and Genomics divisions are protected primarily through pending patent applications and issued patents. In addition, certain of our products are covered by licenses from third parties to supplement our own patent portfolio. Patent protection, if granted, generally has a life of 20 years from the date of the patent application or patent grant. We cannot provide assurance that any of our pending patent applications will result in the grant of a patent, whether the examination process will require us to narrow our claims, and whether our claims will provide adequate coverage of our competitors' products or services.
In addition to pursuing patents on our products, we also preserve much of our innovation as trade secrets, particularly in the Reagent Solutions division of our Protein Sciences segment. We have taken steps to protect our intellectual property and proprietary technology, in part by entering into confidentiality agreements and intellectual property assignment agreements with our employees, consultants, corporate partners and, when needed, our advisors. See the description of risks associated with the Company's intellectual property in “Item 1A. Risk Factors.”
We can give no assurance that Bio-Techne's products do not infringe upon patents or proprietary rights owned or claimed by others. Bio-Techne has not conducted a patent infringement study for each of its products. Where we have been contacted by patent holders with certain intellectual property rights, Bio-Techne typically has entered into licensing agreements with patent holders under which it has the exclusive and/or non-exclusive right to use patented technology as well as the right to manufacture and sell certain patented products to the research and/or diagnostics markets.
LAWS AND REGULATIONS
Our operations, and some of the products we offer, are subject to a number of complex laws and regulations governing the production, marketing, handling, transportation and distribution of our products and services. The following sections describe certain significant regulations pertinent to the Company. These are not the only laws and regulations applicable to the Company’s business. For a description of risks related to laws and regulations to which we are subject, refer to Item 1.A. Risk Factors.”
Medical Device Regulations
A number of our products are classified as medical devices and are subject to restrictions under domestic and foreign laws, rules, regulations, self-regulatory codes and orders, including but not limited to the U.S. Food, Drug and Cosmetic Act (the “FDCA”). The FDCA requires these products, when sold in the United States, to be safe and effective for their intended uses and to comply with the regulations administered by the U.S. Food and Drug Administration (“FDA”). The FDA regulates the design, development, testing, manufacture, advertising, labeling, packaging, marketing, distribution, import and export and record keeping for such products. Many medical device products are also regulated by comparable agencies in non-U.S. countries in which they are produced or sold.
Any medical devices we manufacture and distribute are subject to pervasive and continuing regulation by the FDA and certain state and non-U.S. agencies. As a medical device manufacturer, our manufacturing facilities are subject to inspection on a routine basis by the FDA. We are required to adhere to the Current Good Manufacturing Practices (“GMP”) requirements, as set forth in the Quality Systems Regulation (“QSR”), which require manufacturers, including third-party manufacturers, to follow stringent design, testing, control, documentation and other quality assurance procedures during all phases of the design and manufacturing process.
We must also comply with post-market surveillance regulations, including medical device reporting, or MDR, requirements which require that we review and report to the FDA any incident in which our products may have caused or contributed to a death or serious injury. We must also report any incident in which our product has malfunctioned if that malfunction would likely cause or contribute to a death or serious injury it if were to recur.
Labeling and promotional activities are subject to scrutiny by the FDA and, in certain circumstances, by the Federal Trade Commission. Medical devices approved or cleared by the FDA may not be promoted for unapproved or uncleared uses, otherwise known as “off-label” promotion. The FDA and other agencies actively enforce the laws and regulations prohibiting the promotion of off-label uses.
In the European Union (“EU”), our products are subject to the medical device laws of the various member states, which are currently based on a Directive of the European Commission. However, the EU has adopted the In Vitro Diagnostic Regulation (the “EU IVDR”), which imposes stricter requirements for the marketing and sale of in vitro diagnostic medical devices, including in the area of clinical evaluation requirements, quality systems and post-market surveillance. Manufacturers of currently approved in vitro diagnostics medical devices have until May 2022 to meet the EU IVDR. Complying with EU IVDR, the regulation applicable to the Company, requires material modifications to our quality management systems, additional resources in certain functions, updates to technical files and additional clinical data in some cases, among other changes.
One of our products under our Exosome Diagnostics brand is offered as a test by a certified laboratory under CLIA. Our Asuragen business also maintains a CLIA certification. Consequently, we must comply with state licensing regulations applicable to laboratories regulated under CLIA, governing laboratory practices and procedures.
Other Healthcare Laws
Several of the products sold in our Diagnostics and Genomics segment are subject to various health care related laws regulating fraud and abuse, research and development, pricing and sales and marketing practices, and the privacy and security of health information, including, among others:
| ● | U.S. federal regulations regarding quality and cost by the U.S. Department of Health and Human Services (“HHS”), including the Centers for Medicare & Medicaid Services (“CMS”), as well as comparable state and non-U.S. agencies responsible for reimbursement and regulation of healthcare goods and services, including laws and regulations related to kickbacks, false claims, self-referrals and healthcare fraud. |
|---|
| ● | U.S. Federal Anti-Kickback Statute prohibits persons from knowingly and willfully soliciting, offering, receiving or providing remuneration (including any kickback or bribe), directly or indirectly, in exchange for or to induce either the referral of an individual, or the furnishing or arranging for a good or service, for which payment may be made in whole or in part under a federal health care program, such as Medicare or Medicaid. |
|---|
| ● | Comparable laws and regulations similar to, and in some cases more stringent than, the U.S. federal regulations discussed above and below, including the UK Bribery Act and similar anti-bribery laws. |
|---|
| ● | The Health Insurance Portability and Accountability Act of 1996 (“HIPAA”), which prohibits knowingly and willfully (1) executing, or attempting to execute, a scheme to defraud any health care benefit program, including private payors, or (2) falsifying, concealing or covering up a material fact or making any materially false, fictitious or fraudulent statement in connection with the delivery of or payment for health care benefits, items or services. In addition, HIPAA, as amended by the Health Information Technology for Economic and Clinical Health Act of 2009, also restricts the use and disclosure of patient identifiable health information, mandates the adoption of standards relating to the privacy and security of patient identifiable health information and requires the reporting of certain security breaches with respect to such information. |
|---|
| ● | The False Claims Act, which imposes liability on any person or entity that, among other things, knowingly presents, or causes to be presented, a false or fraudulent claim for payment by a federal health care program, knowingly makes, uses or causes to be made or used, a false record or statement material to a false or fraudulent claim, or knowingly makes a false statement to avoid, decrease or conceal an obligation to pay money to the U.S. federal government. |
|---|
| ● | The Open Payments Act requires manufacturers of medical devices covered under Medicare to, in certain circumstances, record payments and other transfers of value to a broad range of healthcare providers and teaching hospitals and to report this data as well as ownership and investment interests held by the physicians described above and their immediate family members to HHS for subsequent public disclosure, as well as similar reporting requirements in some states and in other countries. |
|---|
For a discussion of risks related to regulation by the FDA and comparable agencies of other countries, and the other regulatory regimes referenced above, please refer to section entitled “Item 1A. Risk Factors.”
Data Privacy and Security Laws
As a global organization, we are subject to data privacy and security laws, regulations, and customer-imposed controls in numerous jurisdictions as a result of having access to and processing confidential, personal and/or sensitive data in the course of our business. In addition to the U.S. HIPAA privacy and security rules mentioned above, which impact some parts of our business, individual states also regulate data breach and security requirements and multiple governmental bodies assert authority over aspects of the protection of personal privacy. In particular, a broad privacy law in California, the California Consumer Privacy Act (“CCPA”), came into effect in January 2020. The CCPA has some of the same features as the GDPR (discussed below), and has already prompted several other states to follow with similar laws. The EU General Data Protection Regulation that became effective in May 2018 (“GDPR”) has imposed significantly stricter requirements in how we collect, transmit, process and retain personal data, including, among other things, in certain circumstances a requirement for almost immediate notice of data breaches to supervisory authorities and prompt notice to data subjects with significant fines for non-compliance. Several other countries such as China and Russia have passed, and other countries are considering passing, laws that require personal data relating to their citizens to be maintained on local servers and impose additional data transfer restrictions. For a discussion of risks related to improper disclosure of private information particularly as a result of cyber security incidents, please refer to section entitled “Item 1A. Risk Factors.”
Environmental Health and Safety Laws
We are also subject to various environmental health and safety laws and regulations both within and outside the U.S. Like other companies in our industry, our manufacturing and research activities involve the use and transportation of substances regulated under environmental health and safety laws including those relating to the transportation of hazardous materials.
Other Laws and Regulations Governing Our Sales, Marketing and Shipping Activities.
We are subject to the U.S. Foreign Corrupt Practices Act and various other similar anti-corruption and anti-bribery acts, which are particularly relevant to our operations in countries where the customers are government entities or are controlled by government officials. Both we directly, and indirectly through our distributors, must comply with such laws when interacting with those entities.
As Bio-Techne’s businesses also include export and import activities, we are subject to pertinent laws enforced by the U.S. Departments of Commerce, State and Treasury. Other nations’ governments have implemented similar export/import control and economic sanction regulations, which may affect the Company’s operations or transactions subject to their jurisdictions.
In addition, under U.S. laws and regulations, U.S. companies and their subsidiaries and affiliates outside the United States are prohibited from participating or agreeing to participate in unsanctioned foreign boycotts in connection with certain business activities, including the sale, purchase, transfer, shipping or financing of goods or services within the United States or between the United States and countries outside of the United States. If we, or certain third parties through which we sell or provide goods or services, violate anti-boycott laws and regulations, we may be subject to civil or criminal enforcement action and varying degrees of liability.
We are subject to laws and regulations governing government contracts, and failure to address these laws and regulations or comply with government contracts could harm our business by a reduction in revenue associated with these customers. We have agreements relating to the sale of our products to government entities and, as a result, we are subject to various statutes and regulations that apply to companies doing business with the government. We are also subject to investigation for compliance with the regulations governing government contracts. A failure to comply with these regulations could result in suspension of these contracts, criminal, civil and administrative penalties or debarment.
For a discussion of risks related to the above-referenced regulations, particularly with respect to our international operations, please refer to section entitled “Item 1A. Risk Factors.”
INVESTOR INFORMATION
We are subject to the information requirements of the Securities Exchange Act of 1934 (the Exchange Act). Therefore, we file periodic reports, proxy statements, and other information with the Securities and Exchange Commission (SEC). The SEC maintains an internet site (http://www.sec.gov) that contains reports, proxy and information statements, and other information regarding issuers that file electronically.
Financial and other information about us is available on our web site (https://investors.bio-techne.com/). We make available on our web site copies of our Annual Report on Form 10-K, Quarterly Reports on Form 10-Q, Current Reports on Form 8-K, and amendments to those reports filed or furnished pursuant to Section 13 or 15(d) of the Exchange Act as soon as reasonably practicable after filing such material electronically or otherwise furnishing it to the SEC.
EXECUTIVE OFFICERS OF THE REGISTRANT
Currently, the names, ages, positions and periods of service of each executive officer of the Company are as follows:
| Name | Age | Position | Officer Since | |||
|---|---|---|---|---|---|---|
| Charles Kummeth | 61 | President, Chief Executive Officer and Director | 2013 | |||
| James Hippel | 50 | Executive Vice President and Chief Financial Officer | 2014 | |||
| David Eansor | 60 | President, Protein Sciences | 2014 | |||
| Kim Kelderman | 54 | President, Diagnostics and Genomics | 2018 | |||
| Brenda Furlow | 63 | Executive Vice President, General Counsel and Corporate Secretary | 2014 |
Set forth below is information regarding the business experience of each executive officer. There are no family relationships among any of the officers named, nor is there any arrangement or understanding pursuant to which any person was selected as an officer.
Charles Kummeth has been President and Chief Executive Officer of the Company since April 1, 2013. Prior to joining the Company, he served as President of Mass Spectrometry and Chromatography at Thermo Fisher Scientific Inc. from September 2011. He was President of that company's Laboratory Consumables Division from 2009 to September 2011. Prior to Thermo Fisher, Mr. Kummeth served in various roles at 3M Corporation, most recently as the Vice President of the company's Medical Division from 2006 to 2008.
James Hippel has been Chief Financial Officer of the Company since April 1, 2014. Prior to joining the Company, Mr. Hippel served as Senior Vice President and Chief Financial Officer for Mirion Technologies, Inc., a global company that provided radiation detection and identification products. Prior to Mirion, Mr. Hippel served as Vice President, Finance at Thermo Fisher Scientific, Inc., leading finance operations for its Mass Spectrometry & Chromatography division and its Laboratory Consumables division. In addition, Mr. Hippel's experience includes nine years of progressive financial leadership at Honeywell International, within its Aerospace Segment. Mr. Hippel started his career with KPMG LLP.
David Eansor has been President of the Protein Sciences segment since July 1, 2018. Prior to that, he served as Senior Vice President, Biotechnology Division and as Senior Vice President, Novus Biologicals since the Company completed its acquisition of Novus on July 2, 2014. From January 2013 until the date of the acquisition, Mr. Eansor was the Senior Vice President of Corporate Development of Novus Biologicals. Prior to joining Novus Biologicals, Mr. Eansor was the President of the Bioscience Division of Thermo Fisher Scientific. Mr. Eansor was promoted to Division President in early 2010 after 5 years as President of Thermo Fisher's Life Science Research business.
Kim Kelderman joined Bio-Techne on April 30, 2018 as President, Diagnostics and Genomics. Prior to Bio-Techne, Mr. Kelderman was employed at Thermo Fisher Scientific where he led three different businesses of increasing scale and complexity. For the last three years, Mr. Kelderman managed the Platforms and Content of the Genetic Sciences Division, where he was responsible for the Instrumentation, Software, Consumables and Assays businesses, and brands such as Applied Biosystems and legacy Affymetrix. Before joining Thermo Fisher, Kim served as Senior Segment Leader at Becton Dickinson, managing the global Blood Tubes “Vacutainer” business.
Brenda Furlow joined the Company as General Counsel and Corporate Secretary on August 4, 2014. Prior to joining Bio-Techne, Ms. Furlow served as general counsel to emerging growth technology companies. Ms. Furlow was General Counsel for TomoTherapy, a global, publicly traded company that manufactured and sold radiation therapy equipment, from 2007 to 2011. From 1998 to 2007, Ms. Furlow served as General Counsel for Promega Corporation, a global life sciences company.
Item 1A. RISK FACTORS
Set forth below are risks and uncertainties we believe are material to our investors. You should refer to the explanation of the qualifications and limitations on forward-looking statements in the section titled Information Relating to Forward-Looking Statements at the beginning of this Annual Report on Form 10-K.
Economic and Industry Risks
Conditions in the global economy, the particular markets we serve and the financial markets brought about by material global crises may adversely affect our business and financial statements.
Our global operations expose us to risks associated with many types of crises, whether political, social, economic, climate or otherwise. In particular, given our industry, we have exposure to public health crises, including epidemics and pandemics such as COVID-19. Most recently, COVID-19 has had, and likely will continue to have, an adverse impact on our employees, operations, supply chains, and sales and distribution systems, including as a result of impacts associated with protective health measures that we, other businesses and governments are taking or might have to take again in the future. For example, as the world has grappled with the COVID-19 pandemic, many governments issued “stay-at-home” orders which restricted business and personal activities, and many employers required employees to work from home and cease all travel. While many of these travel and activity restrictions have been partially or fully lifted in certain countries where the pandemic has been controlled, they may be reinstituted in the future and jurisdictions may continue to close borders, impose prolonged quarantines and further restrict travel and other activities.
In the past eighteen months, we have introduced new products or modified existing products to serve the research and healthcare markets as they address the global pandemic through novel diagnostic and therapeutic products. The direct impact of COVID-19 and the preventive and precautionary measures implemented as a result thereof have adversely affected, and are expected to continue to adversely affect, certain elements of our Company (including to a different degree our operations, commercial organizations, supply chains and distribution systems) and the future impact may be material, though the impact on our different businesses and the different elements of our businesses varies (please see “Management’s Discussion and Analysis of Financial Condition and Results of Operations” for a discussion of how COVID-19 impacted our results of operations and financial position in fiscal 2021). Without limiting the foregoing, we have experienced and/or may in the future experience:
| ● | adverse impacts on customer orders and purchases and unpredictable reductions in demand for many of our products; |
|---|
| ● | constraints on the movement of our products through the supply chain; |
|---|
| ● | adverse impacts on our collections of accounts receivable, including delays in collections and increases in uncollectible receivables; |
|---|
| ● | supply chain capacity constraints and price increases, including with respect to freight services; |
|---|
| ● | failure of COVID-19 related products to be adopted in the market as anticipated; |
|---|
| ● | adverse impacts on our workforce and/or key employees; |
|---|
| ● | unpredictable increases in demand for certain products; and |
|---|
| ● | increased cybersecurity attack activity. |
|---|
Any of these developments may adversely affect our business and financial statements.
U.S. and international political, economic, compliance and business factors, including the United Kingdom’s recent withdrawal from the European Union, can negatively impact our operations and financial results.
Changes, potential changes or uncertainties in U.S. social, political, regulatory and economic conditions or laws and policies governing foreign trade, manufacturing, and development and investment in the territories and countries where we or our customers operate, or governing the health care system, can adversely affect our business and financial statements. For example, the current U.S. administration has continued to keep in place many of the significant tariff increases for goods imported into the United States, particularly from China, imposed by the prior administration. Congress and the U.S. administration is also considering significant changes to healthcare in the United States, including government negotiation/regulation of drug prices paid by government programs.
Additionally, the UK’s exit from the European Union at the end of calendar year 2020 has created political and economic uncertainty, particularly in the UK and the EU, and has disrupted the free flow of goods and people between the UK and the EU. In addition, our business could be negatively affected by new trade agreements between the UK and other countries, including the United States, and by the possible imposition of trade or other regulatory barriers in the UK. Any of these factors have affected and could continue to adversely affect customer demand, our relationships with customers and suppliers, and our business and financial results, particularly since our European headquarters and primary shipping facilities have been located in the UK. Additionally, attracting and retaining qualified employees who are citizens of EU countries to our UK facilities may be more difficult given the uncertainties resulting from the UK's withdrawal.
We engage in business globally, with approximately 46% of our sales revenue in fiscal 2021 coming from outside the U.S. In addition, one of our strategies is to expand geographically, particularly in China, India and in developing countries, both through distribution and through direct operations. This subjects us to a number of risks, including international economic, political, and labor conditions; currency fluctuations; tax laws (including U.S. taxes on foreign subsidiaries); increased financial accounting and reporting burdens and complexities; unexpected changes in, or impositions of, legislative or regulatory requirements; failure of laws to protect intellectual property rights adequately; inadequate local infrastructure and difficulties in managing and staffing international operations; delays resulting from difficulty in obtaining export licenses for certain technology; tariffs, quotas and other trade barriers and restrictions; transportation delays; operating in locations with a higher incidence of corruption and fraudulent business practices; and other factors beyond our control, including terrorism, war, natural disasters, climate change and diseases.
The application of laws and regulations impacting global transactions is often unclear and may at times conflict. Compliance with these laws and regulations may involve significant costs or require changes in our business practices that result in reduced revenue and profitability. Non-compliance could also result in fines, damages, criminal sanctions, prohibited business conduct, and damage to our reputation. We incur additional legal compliance costs associated with our global operations and could become subject to legal penalties in foreign countries if we do not comply with local laws and regulations, which may be substantially different from those in the U.S.
We continue to expand our operations in countries with developing economies, where it may be common to engage in business practices that are prohibited by U.S. regulations applicable to the Company, such as the Foreign Corrupt Practices Act. Although we implement policies and procedures designed to ensure compliance with these laws, there can be no assurance that all of our employees, contractors, and agents, as well as those companies to which we outsource certain aspects of
Showing the first 8K of 64K characters. Open the full section
Item 1B. UNRESOLVED STAFF COMMENTS
There are no unresolved staff comments as of the date of this report.
Item 2. PROPERTIES
The Company owns the facilities that its headquarters and R&D Systems subsidiary occupy in Minneapolis, Minnesota. The Minneapolis facilities are utilized by both the Company's Protein Sciences and Diagnostics and Genomics segments.
The Minneapolis complex includes approximately 800,000 square feet of space in several adjoining buildings. Bio-Techne uses approximately 625,000 square feet of the complex for administrative, research, manufacturing, shipping and warehousing activities. The Company is currently leasing the remaining space in the complex as retail and office space. The Company also owns a 54,000 square foot facility in Saint Paul, Minnesota that will be utilized for additional manufacturing capabilities and activities.
The Company also owns a 34,000 square foot manufacturing facility in Flowery Branch, Georgia. This facility is utilized by the Company’s Protein Sciences segment.
The Company owns a 17,000 square foot facility that its Bio-Techne Europe subsidiary occupies in Abingdon, England. This facility is utilized by the Company's Protein Sciences and Diagnostics and Genomics segments.
The Company owns a 9,000 square foot facility that its Canada subsidiaries occupy in Toronto, Canada. This facility is utilized by the Company's Protein Sciences and Diagnostics and Genomics segments.
The Company owns a 52,700 square foot manufacturing facility in Wallingford, Connecticut. This facility is utilized by the Company's Protein Sciences segment.
The Company leases the following material facilities, all of which are primarily utilized by the Company's Protein Sciences segment with the exception of the locations used by the Company's ProteinSimple and CyVek subsidiaries, which support both the Protein Sciences segment and the Diagnostics & Genomics segment). Certain locations are not named because they were not significant individually or in the aggregate as of the date of this report.
| Subsidiary | Location | Type | Square Feet | ||||
|---|---|---|---|---|---|---|---|
| Bio-Techne Europe | Langley, United Kingdom | Warehouse | 14,300 | ||||
| Bio-Techne China | Shanghai and Beijing, China | Office/warehouse | 17,000 | ||||
| Boston Biochem | Cambridge, Massachusetts | Office/lab | 7,400 | ||||
| Tocris | Bristol, United Kingdom | Office/manufacturing/lab/warehouse | 30,000 | ||||
| PrimeGene | Shanghai, China | Office/manufacturing/lab | 20,600 | ||||
| Bionostics | Devens, Massachusetts | Office/manufacturing | 70,000 | ||||
| Novus Biologicals | Centennial, Colorado | Office/warehouse | 22,500 | ||||
| ProteinSimple | San Jose, California | Office/manufacturing/warehouse | 167,000 | ||||
| ProteinSimple Ltd. | Ottawa, Canada | Office/manufacturing/warehouse | 10,800 | ||||
| CyVek | Wallingford, Connecticut | Office/manufacturing/warehouse | 17,500 | ||||
| Cliniqa | San Marcos, California | Office/manufacturing/warehouse | 62,200 | ||||
| Advanced Cell Diagnostics | Newark, California | Office/manufacturing/warehouse | 55,900 | ||||
| Bio-Techne France | Rennes, France | Office/warehouse | 11,000 | ||||
| Exosome Diagnostics | Waltham, Massachusetts | Office/manufacturing/warehouse | 28,000 | ||||
| R&D Systems | Minneapolis, Minnesota | Office/manufacturing/warehouse | 10,700 | ||||
| Asuragen | Austin, Texas | Office/manufacturing/warehouse | 47,400 |
The Company entered into a definitive agreement to lease a 25,000 square foot facility in Dublin, Ireland. Construction is currently underway and once complete, the commencement of the lease will occur. The Company believes the owned and leased properties, inclusive of the leased property in Ireland, are adequate to meet its occupancy needs in the foreseeable future.
Item 3. LEGAL PROCEEDINGS
As of August 20, 2021, the Company is not a party to any legal proceedings that, individually or in the aggregate, are reasonably expected to have a material adverse effect on the Company's business, results of operations, financial condition or cash flows.
Item 4. MINE SAFETY DISCLOSURES
Item 5. MARKET FOR THE REGISTRANT'S COMMON EQUITY, RELATED SHAREHOLDER
MATTERS AND ISSUER PURCHASES OF EQUITY SECURITIES
Holders of Common Stock and Dividends Paid
As of August 20, 2021 there were over 55,000 beneficial shareholders of the Company's common stock and over 90 shareholders of record. The Company paid annual cash dividends totaling $49.6 million, $48.9 million, and $48.4 million in fiscal 2021, 2020, and 2019, respectively. The Board of Directors periodically considers the payment of cash dividends, and there is no guarantee that the Company will pay comparable cash dividends, or any cash dividends, in the future.
In connection with the acquisition of Exosome Diagnostics, Inc. on August 1, 2018, the Company entered into a new credit facility that provides for a revolving credit facility of $600 million, which can be increased by an additional $200 million subject to certain conditions, and a term loan of $250 million. The credit facility is governed by a Credit Agreement dated August 1, 2018 and matures on August 1, 2023. The Credit Agreement that governs the revolving line of credit contains customary events of default and would prohibit payment of dividends to Company shareholders in the event of a default thereunder.
Issuer Purchases of Equity Securities
During the years ended June 30, 2021 and June 30, 2020, the Company repurchased 120,000 shares of its common stock at an average share price of $359.82 and 279,381 shares at an average share price of $179.37, respectively. During fiscal 2019, the Board implemented a new repurchase plan, which grants management the discretion to mitigate the dilutive effect of stock option exercises by authorizing repurchase of shares up to the amount of stock returned to the corporation through stock option exercises, beginning with those option exercises occurring in fiscal year 2018. As of June 30, 2021, we have authorization of approximately $63 million that may yet be used to purchase additional shares under our current stock repurchase program.
Stock Performance Graph
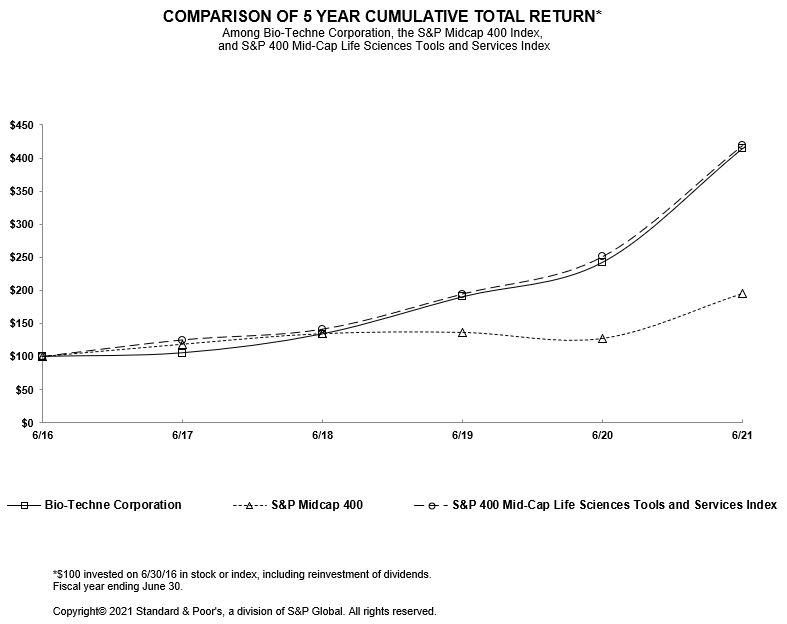
The following chart compares the cumulative total shareholder return on the Company's common stock with the S&P Midcap 400 Index and the S&P 400 MidCap Life Sciences Tools and Services Index. The comparison assumes $100 was invested on the last trading day before July 1, 2016 in the Company's common stock and in each of the foregoing indices and assumes reinvestment of dividends.
 | ||
|---|---|---|
Item 6. SELECTED FINANCIAL DATA
RESERVED
Item 7. MANAGEMENT'S DISCUSSION AND ANALYSIS OF FINANCIAL
CONDITION AND RESULTS OF OPERATIONS
The following management discussion and analysis (“MD&A”) provides information that we believe is useful in understanding our operating results, cash flows and financial condition. We provide quantitative information about the material sales drivers including the effect of acquisitions and changes in foreign currency at the corporate and segment level. We also provide quantitative information about discrete tax items and other significant factors we believe are useful for understanding our results. The MD&A should be read in conjunction with the consolidated financial information and related notes included in this Form 10-K. This discussion contains various “Non-GAAP Financial Measures” and also contains various “Forward-Looking Statements” within the meaning of the Private Securities Litigation Reform Act of 1995. We refer readers to the statements entitled “Non-GAAP Financial Measures” located at the end of this MD&A and “Forward-Looking Information and Cautionary Statements” and “Risk Factors” within Items 1 and 1A of this Form 10-K.
OVERVIEW
Bio-Techne develops, manufactures and sells life science reagents, instruments and services for the research and clinical diagnostic markets worldwide. With our deep product portfolio and application expertise, we sell integral components of scientific investigations into biological processes and molecular diagnostics, revealing the nature, diagnosis, etiology and progression of specific diseases. Our products aid in drug discovery efforts and provide the means for accurate clinical tests and diagnoses.
During our fiscal year 2021, we operated with two operating segments – our Protein Sciences segment and our Diagnostics and Genomics segment. Our Protein Sciences segment is a leading developer and manufacturer of high-quality purified proteins and reagent solutions, most notably cytokines and growth factors, antibodies, immunoassays, biologically active small molecule compounds, tissue culture reagents and T-Cell activation technologies. This segment also includes protein analysis solutions that offer researchers efficient and streamlined options for automated western blot and multiplexed ELISA workflow. Our Genomics and Diagnostics segment develops and manufactures diagnostic products, including FDA-regulated controls, calibrators, blood gas and clinical chemistry controls and other reagents for OEM and clinical customers, as well as a portfolio of clinical molecular diagnostic oncology assays, including the ExoDx® Prostate test (EPI) for prostate cancer diagnosis. This segment also manufactures and sells advanced tissue-based in-situ hybridization assays (ISH) for spatial genomics research and clinical use.
OVERALL RESULTS
Operational Update
For fiscal 2021, consolidated net sales increased 26% as compared to fiscal 2020. Organic growth was 22%, with currency translation and acquisitions having a 3% and 1% impact on revenue respectively. Organic revenue growth was broad based and driven by accelerated momentum of the Company's long-term growth strategy as well as customer site closures in the latter half of fiscal 2020 due to the COVID-19 pandemic.
For fiscal 2021, consolidated earnings, including non-controlling interest, decreased 39% compared to fiscal 2020. The decrease in earnings was primarily due to a non-operating loss of approximately $67.9 million on our ChemoCentryx investment, compared to a gain on investment of $137 million in the last fiscal year. After adjusting for acquisition related costs, intangibles amortization, stock-based compensation, restructuring costs, the loss on investment, certain income tax items in both years, and non-controlling interest, adjusted net earnings increased 52% in fiscal 2021 as compared to fiscal 2020. Adjusted earnings growth was driven by volume leverage, operational productivity, and product mix.
For fiscal 2020, consolidated net sales increased 4% as compared to fiscal 2019. Organic growth was 4%, with currency translation and acquisitions having an immaterial impact on revenue. The Company experienced broad-based organic revenue growth in most major geographic regions and end-markets prior to the onset of the COVID-19 pandemic. This broad-based organic growth was partially offset by the negative impacts associated with the COVID-19 pandemic experienced by the Company in the latter half of fiscal year 2020.
For fiscal 2020, consolidated earnings, including non-controlling interest, increased 139% compared to fiscal 2019. The increase in earnings was primarily due to a non-operating gain of approximately $137 million on our ChemoCentryx investment and a gain of approximately $7 million on the settlement of the escrow balance associated with the Exosome acquisition. After adjusting for acquisition related costs, stock-based compensation, and certain income tax items in both years, adjusted net earnings increased 2% in fiscal 2020 as compared to fiscal 2019. Adjusted earnings growth was driven by volume leverage, which was partially offset by business impacts associated with the COVID-19 pandemic.
COVID-19 Business Update
The global spread of COVID-19 in the past 18 months has led to unprecedented restrictions on, and disruptions in, business and personal activities, including as a result of preventive and precautionary measures that we, other businesses, our communities and governments have taken and are taking to mitigate the spread of the virus and to manage its impact. While a number of vaccines developed in response to the pandemic appear to be effective in mitigating spread of the disease, we continue to actively monitor the pandemic on a global scale. We have taken and intend to continue taking steps to identify and mitigate the adverse impacts on, and risks to, our business (including but not limited to our employees, customers, business partners, manufacturing capabilities and capacity, and supply and distribution channels) posed by the spread of COVID-19 and the governmental and community responses thereto.
The Company has responded to the pandemic by leveraging our deep product portfolio and scientific expertise to develop robust COVID-19 product and service offerings providing critical support for both clinical care and therapeutic development. While our sales related to COVID-19 specific products have been modest, fiscal 2021 growth benefited from the reopening of customer sites initially closed in the latter half of fiscal 2021 and our ongoing efforts to utilize our portfolio of products and services to enable solutions for this evolving pandemic.
We are unable to forecast the impact of COVID-19 on future revenue given the uncertainty that some customer sites may close again due to increases in COVID-19 cases occurring in their region and over the duration of the COVID-19 pandemic, especially if current vaccines prove to be ineffective against new strains of the Coronavirus that may develop over time. We anticipate a positive long-term outlook for sales growth resulting from expected future funding increases within life-science research in response to the current pandemic. Similar to current periods, we anticipate the impact on EPS to be similar to that of sales growth.
The Company remains in a strong financial position with sufficient available cash as well as access to additional funding, if necessary, through our long-term debt agreement. We did not experience any material changes to our June 30, 2021 nor our June 30, 2020 Balance Sheet, resulting from COVID-19 for items such as additional reserves or asset impairments resulting from the pandemic.
The Company has remained fully operational as we abided by local COVID-19 safety regulations across the world this past year. As the pandemic has eased, in most locations we will be returning all employees to on site work, although in certain instances we will continue to operate with appropriate safety measures, including staggered shifts, social distancing and hygiene best practices recommended by public health officials. In addition, the Company has taken and will continue to take additional steps to monitor and strengthen our supply chain to maintain an uninterrupted supply of our critical products and services.
RESULTS OF OPERATIONS
Net Sales
Consolidated organic net sales exclude the impact of companies acquired during the first 12 months post-acquisition and the effect of the change from the prior year in exchange rates used to convert sales in foreign currencies (primarily the euro, British pound sterling, and Chinese yuan) into U.S. dollars.
Consolidated net sales growth was as follows:
| Year Ended June 30, | ||||||||||||
|---|---|---|---|---|---|---|---|---|---|---|---|---|
| 2021 | 2020 | 2019 | ||||||||||
| Organic sales growth | 22 | % | 4 | % | 10 | % | ||||||
| Acquisitions sales growth | 1 | % | 0 | % | 2 | % | ||||||
| Impact of foreign currency fluctuations | 3 | % | 0 | % | (1 | )% | ||||||
| Consolidated net sales growth | 26 | % | 4 | % | 11 | % |
Consolidated net sales by segment were as follows (in thousands):
| Year Ended June 30, | ||||||||||||
|---|---|---|---|---|---|---|---|---|---|---|---|---|
| 2021 | 2020 | 2019 | ||||||||||
| Protein Sciences | $ | 704,564 | $ | 555,352 | $ | 543,159 | ||||||
| Diagnostics and Genomics | 227,744 | 184,549 | 171,674 | |||||||||
| Intersegment | (1,276 | ) | (1,210 | ) | (827 | ) | ||||||
| Consolidated net sales | $ | 931,032 | $ | 738,691 | $ | 714,006 |
In fiscal 2021, Protein Sciences segment net sales increased 27% compared to fiscal 2020. Organic growth for the segment was 24% for the fiscal year, with foreign currency translation having a favorable impact of 3%, and acquisitions contributing an immaterial amount.
Overall segment growth was driven by continued market acceptance of our portfolio of productivity enhancing solutions across end-markets and geographies combined with the reopening of customer sites that were closed in the latter half of fiscal 2020 due to COVID-19.
In fiscal 2021, Diagnostics and Genomics segment net sales increased 23% compared to fiscal 2020. Organic growth was 18% with acquisitions and foreign currency having a favorable impact of 4% and 1% impact on revenue, respectively.
Overall segment revenue growth was broad based across product lines and geographies. RNAscope products had an exceptional year in both the Academia and Bio-Pharma end markets, while the Exosome product line also provided year over year growth despite navigating limitations and/or customer avoidance of non-essential medical procedures throughout fiscal 2021 associated with the COVID-19 pandemic.
In fiscal 2020, Protein Sciences segment net sales increased 2% compared to fiscal 2019. Organic growth for the segment was 3% for the fiscal year, with foreign currency translation having an unfavorable impact of 1%, and acquisitions contributing an immaterial amount.
Overall segment growth was driven by strong Bio-Pharma sales in North America and strong overall performance in China, which was partially offset by the disruption in research markets due to numerous customer site closures relating to the COVID-19 pandemic that occurred in the second half of fiscal 2020.
In fiscal 2020, Diagnostics and Genomics segment net sales increased 8% compared to fiscal 2019. Organic growth was 8% with acquisitions and foreign currency having an immaterial impact on revenue.
Overall segment revenue growth was driven by strong performance in our ExoDx Prostate Test, RNAscope, hematology, and assay development products lines prior to the onset of the COVID-19 pandemic. The closure of academic site labs and limitation of non-essential medical procedures resulting from the COVID-19 pandemic significantly impacted sales of our RNAscope product line and our ExoDx Prostate Test, respectively, in the latter portion of the fiscal year. These negative sales impacts were partially offset through growth in supplying specialty diagnostic antibodies and other raw materials to COVID-19 testing manufacturers.
Gross Margins
Consolidated gross margins were 68.0%, 65.4%, and 66.3% in fiscal 2021, 2020, and 2019. Consolidated gross margins were positively impacted as a result of broad based revenue growth and cost management. Excluding the impact of acquired inventory sold, amortization of intangibles, and stock compensation expense, adjusted gross margins were 72.2%, 70.3%, and 71.5% in fiscal 2021, 2020, and 2019 respectively. Fiscal 2021 adjusted gross margin was positively impacted by volume leverage and product mix when compared to fiscal 2020 and fiscal 2019.
A reconciliation of the reported consolidated gross margin percentages, adjusted for acquired inventory sold and intangible amortization included in cost of sales, is as follows:
| Year Ended June 30, | ||||||||||||
|---|---|---|---|---|---|---|---|---|---|---|---|---|
| 2021 | 2020 | 2019 | ||||||||||
| Consolidated gross margin percentage | 68.0 | % | 65.4 | % | 66.3 | % | ||||||
| Identified adjustments: | ||||||||||||
| Costs recognized upon sale of acquired inventory | 0.2 | % | - | % | 0.5 | % | ||||||
| Amortization of intangibles | 3.8 | % | 4.7 | % | 4.7 | % | ||||||
| Stock compensation expense - COGS | 0.2 | % | 0.2 | % | - | % | ||||||
| Non-GAAP adjusted gross margin percentage | 72.2 | % | 70.3 | % | 71.5 | % |
Fluctuations in adjusted gross margins, as a percentage of net sales, have primarily resulted from changes in foreign currency exchange rates and changes in product mix. We expect that, in the future, gross margins will continue to be impacted by the mix of our portfolio growing at different rates as well as future acquisitions.
Management uses adjusted operating results to monitor and evaluate performance of the Company’s two segments. Segment gross margins, as a percentage of net sales, were as follows:
| Year Ended June 30, | ||||||||||||
|---|---|---|---|---|---|---|---|---|---|---|---|---|
| 2021 | 2020 | 2019 | ||||||||||
| Protein Sciences | 76.0 | % | 75.0 | % | 76.8 | % | ||||||
| Diagnostics and Genomics | 60.5 | % | 55.6 | % | 54.4 | % |
The changes in the Protein Sciences segment’s gross margin percentage for fiscal 2021 as compared to fiscal 2020 and 2019 was primarily attributable to mix of product sales within the segment.
The increase in Diagnostics and Genomics in gross margin for fiscal 2021 as compared to fiscal 2020 was primarily due to volume leverage. The increase in Diagnostics and Genomics in gross margin for fiscal 2020 as compared to fiscal 2019 was primarily due to volume leverage, operational productivity, and revenue growth against a similar cost base in recent acquisitions.
Selling, General and Administrative Expenses
Selling, general and administrative expenses increased $64.4 million (25%) in fiscal 2021 when compared to fiscal 2020. Selling, general, and administrative expenses increased primarily due to investments made by the Company to support volume growth within each of the segments as well as additional expenses related to the acquisition of Asuragen, Inc.
Selling, general and administrative expenses decreased $3.8 million (1%) in fiscal 2020 when compared to fiscal 2019. Selling, general, and administrative expenses decreased primarily due to a reduction in corporate expenses and a gain resulting from a settlement of amounts held in escrow from the ExosomeDx acquisition between the Company and the former shareholders. These reductions to our selling, general, and administrative expenses were partially offset by an increase in expense within the segments.
Consolidated selling, general and administrative expenses were composed of the following (in thousands):
| Year Ended June 30, | ||||||||||||
|---|---|---|---|---|---|---|---|---|---|---|---|---|
| 2021 | 2020 | 2019 | ||||||||||
| Protein Sciences | $ | 159,489 | $ | 138,792 | $ | 135,513 | ||||||
| Diagnostics and Genomics | 75,160 | 65,407 | 61,646 | |||||||||
| Total segment expenses | 234,649 | 204,199 | 197,159 | |||||||||
| Amortization of intangibles | 27,788 | 26,358 | 25,210 | |||||||||
| Acquisition related expenses | 7,097 | 415 | 2,282 | |||||||||
| Gain on escrow litigation | - | (7,159 | ) | - | ||||||||
| Restructuring costs | 142 | 87 | - | |||||||||
| Stock-based compensation | 50,200 | 32,667 | 33,057 | |||||||||
| Corporate selling, general and administrative expenses | 5,075 | 4,016 | 6,651 | |||||||||
| Total selling, general and administrative expenses | $ | 324,951 | $ | 260,583 | $ | 264,359 |
Research and Development Expenses
Research and development expenses increased $5.4 million (8%) and $2.8 million (4%) in fiscal 2021 and 2020, respectively, as compared to prior year periods. The increase in research and development expenses in fiscal 2021 as compared to fiscal 2020 was primarily attributable to continued investment in future growth platforms of the Company and recent acquisitions. The increase in research and development expenses in fiscal 2020 as compared to fiscal 2019 was primarily attributable to continued investment in future growth platforms of the Company, recent acquisitions, and the development of new COVID-19 products.
| Year Ended June 30, | ||||||||||||
|---|---|---|---|---|---|---|---|---|---|---|---|---|
| 2021 | 2020 | 2019 | ||||||||||
| Protein Sciences | $ | 46,361 | $ | 43,022 | $ | 40,735 | ||||||
| Diagnostics and Genomics | 24,242 | 22,170 | 21,678 | |||||||||
| Total segment expenses | 70,603 | 65,192 | 62,413 | |||||||||
| Unallocated corporate expenses | - | - | - | |||||||||
| Total research and development expenses | $ | 70,603 | $ | 65,192 | $ | 62,413 |
Net Interest Income / (Expense)
Net interest income/(expense) for fiscal 2021, 2020, and 2019 was $(13.5) million, $(18.6) million, and $(21.1) million, respectively. Net interest expense in fiscal 2021 decreased when compared to fiscal 2020 due to a reduction in our average long-term debt, which coincided with a reduction in the notional amount on our variable interest derivative. Net interest expense in fiscal 2020 decreased when compared to fiscal 2019 due to a reduction in our average long-term debt.
Other Non-Operating Expense, Net
Other non-operating expense, net, consists of foreign currency transaction gains and losses, rental income, building expenses related to rental property and the Company's gains and losses on investments as follows (in thousands):
| Year Ended June 30, | ||||||||||||
|---|---|---|---|---|---|---|---|---|---|---|---|---|
| 2021 | 2020 | 2019 | ||||||||||
| Foreign currency gains (losses) | $ | (6,650 | ) | $ | 1,703 | $ | (455 | ) | ||||
| Rental income | 1,036 | 1,140 | 1,141 | |||||||||
| Real estate taxes, depreciation and utilities | (1,845 | ) | (1,915 | ) | (1,897 | ) | ||||||
| Gain (loss) on investment | (68,047 | ) | 137,508 | (12,370 | ) | |||||||
| Miscellaneous (expense) income | (136 | ) | (786 | ) | 13 | |||||||
| Other non-operating income (expense), net | $ | (75,642 | ) | $ | 137,650 | $ | (13,568 | ) |
During fiscal 2021, the Company recognized losses of $67.9 million related to changes in fair value associated with changes in the stock price of our ChemoCentryx, Inc. (CCXI) investment.
During fiscal 2020, the Company recognized gains of $137.5 million related to changes in fair value associated with changes in the stock price of our ChemoCentryx, Inc. (CCXI) investment.
During fiscal 2019, the Company recognized losses of $16.1 million related to changes in fair value associated with changes in the stock price of our ChemoCentryx, Inc. (CCXI) investment, which were partially offset by a $3.7 million gain realized upon acquisition from our historical investment in B-MoGen.
Income Taxes
Income taxes for fiscal 2021, 2020, and 2019 were at effective rates of 5.8%, 17.1%, and 14.2%, respectively, of consolidated earnings before income taxes. The change in the effective tax rate was driven by discrete tax items. The Company's discrete tax benefits in fiscal 2021 primarily related to share-based compensation excess tax benefits of $28.1 million. The Company's discrete tax benefits in fiscal 2020 primarily related to share-based compensation excess tax benefits of $17.7 million. The Company's discrete tax benefits in fiscal 2019 primarily related to share-based compensation excess tax benefits of $7.2 million, $3.2 million related to deductible acquisition payments made to employees and third parties, and $2.0 million for tax refunds relating to certain state apportionments.
Net Earnings
Non-GAAP adjusted consolidated net earnings and earnings per share are as follows (in thousands):
| Year Ended June 30, | ||||||||||||
|---|---|---|---|---|---|---|---|---|---|---|---|---|
| 2021 | 2020 | 2019 | ||||||||||
| Earnings before taxes - GAAP | $ | 148,175 | $ | 276,477 | $ | 112,015 | ||||||
| Identified adjustments attributable to Bio-Techne: | ||||||||||||
| Costs recognized upon sale of acquired inventory | 1,565 | - | 3,739 | |||||||||
| Amortization of intangibles | 64,239 | 60,865 | 58,550 | |||||||||
| Acquisition related expenses | 7,489 | 793 | 2,656 | |||||||||
| Gain on escrow settlement | - | (7,170 | ) | - | ||||||||
| Restructuring costs | 142 | 87 | - | |||||||||
| Stock-based compensation, inclusive of employer taxes | 51,846 | 34,262 | 33,057 | |||||||||
| Realized (gain) loss on investments and other | 68,391 | (136,716 | ) | 12,370 | ||||||||
| Impact of non-controlling interest (pre-tax) | 680 | - | - | |||||||||
| Earnings before taxes - Adjusted | $ | 342,527 | $ | 228,598 | $ | 222,387 | ||||||
| Non-GAAP tax rate | 20.2 | % | 21.6 | % | 21.1 | % | ||||||
| Non-GAAP tax expense | 69,334 | 49,280 | 46,931 | |||||||||
| Non-GAAP adjusted net earnings attributable to Bio-Techne | $ | 273,193 | 179,318 | 175,456 | ||||||||
| Earnings per share - diluted - Adjusted | 6.75 | 4.55 | 4.51 |
Depending on the nature of discrete tax items, our reported tax rate may not be consistent on a period to period basis. The Company independently calculates a non-GAAP adjusted tax rate considering the impact of discrete items and jurisdictional mix of the identified non-GAAP adjustments. The following table summarizes the reported GAAP tax rate and the effective Non-GAAP adjusted tax rate for the periods ended June 30, 2021, 2020, and 2019.
| Year Ended June 30, | ||||||||||||
|---|---|---|---|---|---|---|---|---|---|---|---|---|
| 2021 | 2020 | 2019 | ||||||||||
| GAAP effective tax rate | 5.8 | % | 17.1 | % | 14.2 | % | ||||||
| Discrete items | 19.0 | 7.0 | 11.2 | |||||||||
| Long-term GAAP tax rate | 24.8 | % | 24.1 | % | 25.4 | |||||||
| Rate impact items | ||||||||||||
| Stock based compensation | (5.7 | )% | (2.4 | )% | (4.8 | )% | ||||||
| Acquisition costs | (0.2 | ) | 0.4 | 0.5 | ||||||||
| Change in fair value of investments | 0.5 | (0.4 | ) | - | ||||||||
| Other | 0.8 | (0.1 | ) | - | ||||||||
| Total rate impact items | (4.6 | )% | (2.5 | )% | (4.3 | )% | ||||||
| Non-GAAP tax rate | 20.2 | % | 21.6 | % | 21.1 | % |
Refer to Note 11 for additional discussion relating to the change in discrete tax items between fiscal 2021 and fiscal 2020.
LIQUIDITY AND CAPITAL RESOURCES
Cash, cash equivalents and available-for-sale investments at June 30, 2021 were $231.6 million compared to $270.9 million at June 30, 2020. Included in available-for-sale investments at June 30, 2021 and June 30, 2020 was the fair value of the Company's investment in CCXI of $20.0 million and $87.8 million, respectively.
At June 30, 2021, approximately 12% of the Company's cash and equivalent account balances of $199.1 million were located in the U.S., with the remainder located in primarily in Canada, China, the U.K. and other European countries.
At June 30, 2021, approximately 61% of the Company's available-for-sale investment account balances of $32.5 million were located in the U.S., with the remaining 39% in China.
The Company has either paid U.S. taxes on its undistributed foreign earnings or intends to indefinitely reinvest the undistributed earnings in the foreign operations or expects the earnings will be remitted in a tax neutral transaction. Management of the Company expects to be able to meet its cash and working capital requirements for operations, facility expansion, capital additions, and cash dividends for the foreseeable future, and at least the next 12 months, through currently available funds, including funds available through our line-of-credit and cash generated from operations.
Future acquisition strategies may or may not require additional borrowings under the line-of-credit facility or other outside sources of funding.
Cash Flows From Operating Activities
The Company generated cash from operations of $352.2 million, $205.2 million, and $181.6 million in fiscal 2021, 2020, and 2019 respectively. The increase in cash generated from operating activities in fiscal 2021 as compared to fiscal 2020 was mainly a result of an increase in year over year operating income of $79.9 million and a $29.3 million benefit to operating cash from year-over-year changes in operating assets and liabilities as well as a non-cash stock-based compensation expense of $16.6 million. The increase in cash generated from operating activities in fiscal 2020 as compared to fiscal 2019 was mainly a result of higher GAAP earnings and lower accounts receivable balances in fiscal 2020, which were partially offset by the gain on investments included within earnings.
Cash Flows From Investing Activities
We continue to make investments in our business, including capital expenditures. The Company acquired Eminence Biotechnology and Asuragen, Inc. during fiscal year 2021 for a total of approximately $225.4 million, net of cash acquired. The Company did not make any acquisitions in fiscal 2020. Net cash paid for acquisitions of Quad, Exosome, and B-MoGen was $289.5 million in fiscal 2019.
The Company's net proceeds (outflow) from the purchase, sale and maturity of available-for-sale investments in fiscal 2021, 2020, and 2019 were $26.7 million, $76.9, and ($21.9 million) million, respectively. The decrease in fiscal 2021 compared to fiscal 2020 was driven by the sale of a portion of the CCXI investment in fiscal year 2020, which did not reoccur in fiscal year 2021. The increase in fiscal 2020 compared to fiscal 2019 was driven by the sale of a portion of the Company’s investment in CCXI in fiscal 2020.The Company's investment policy is to place excess cash in certificates of deposit with the objective of obtaining the highest possible return while minimizing risk and keeping the funds accessible.
Capital additions in fiscal year 2021, 2020, and 2019 were $44.3 million, $51.7 million, and $25.4 million. Fiscal 2021 capital expenditures related to investments in new buildings, in particular, the Company's GMP manufacturing facility. Capital additions planned for fiscal 2022 are approximately $68.4 million and are expected to be financed through currently available cash and cash generated from operations. Increase in expected additions in fiscal 2022 is related to increasing capacity to meet expected sales growth across the Company and reduced expenditures in the comparable period, fiscal year 2021, due to the COVID-19 pandemic.
Cash Flows From Financing Activities
In fiscal 2021, 2020, and 2019, the Company paid cash dividends of $49.6 million, $48.9 million, $48.4 million, respectively. The Board of Directors periodically considers the payment of cash dividends.
The Company received $65.1 million, $71.0 million, $38.0 million, for the exercise of options for 627,000, 743,000, 382,000 shares of common stock in fiscal 2021, 2020 and 2019, respectively.
During fiscal 2021, 2020, and 2019, the Company repurchased $43.2 million, $50.1 million, and $15.4 million, respectively, in share repurchases included as a cash outflow within Financing Activities.
During fiscal 2021, 2020, and 2019, the Company drew $256.0 million, $40.0 million, and $580.0 million, respectively, under its revolving line-of-credit facility. Repayments of $271.5 million, $188.5 million, and $413.5 million were made on its line-of-credit in fiscal 2021, 2020, and 2019, respectively.
During fiscal 2021, there were no payments related to contingent consideration classified as financing activities. The Company made $0.3 million in contingent consideration payments, which were classified within operating activities. During fiscal 2020, the Company made $4.4 million ($4 million for Quad and $0.4 million for B-MoGen) in cash payments towards the Quad, Exosome, and B-MoGen contingent consideration liabilities. Of the $4.4 million in total payments, $3.4 million is classified as financing on the statement of cash flows. The remaining $1 million is recorded as operating on the statement of cash flows as it represents the consideration liability that exceeds the amount of the contingent consideration liability recognized at the acquisition date. During fiscal 2019, the Company made no cash payments towards the Quad, Exosome, and B-MoGen contingent consideration liabilities.
During fiscal 2021 and 2020, the Company paid $19.3 million and $3.8 million, respectively, for net share settlements. During fiscal 2019, other financial activities includes payments for net share settlements as well as the final payment of $1.4 million related to Eurocell. This is included as a cash outflow within the other financing activities line of the consolidated statements of cash flows.
CRITICAL ACCOUNTING POLICIES
Management's discussion and analysis of the Company's financial condition and results of operations are based upon the Company's Consolidated Financial Statements, which have been prepared in accordance with accounting principles generally accepted in the United States of America (U.S. GAAP). The preparation of these financial statements requires management to make estimates and judgments that affect the reported amounts of assets, liabilities, revenues and expenses, and related disclosure of contingent assets and liabilities. On an ongoing basis, management evaluates its estimates. Management bases its estimates on historical experience and on various other assumptions that are believed to be reasonable under the circumstances, the results of which form the basis for making judgments about the carrying values of assets and liabilities that are not readily apparent from other sources. Actual results may differ from these estimates under different assumptions or conditions.
The Company has identified the policies outlined below as critical to its business operations and an understanding of results of operations. The listing is not intended to be a comprehensive list of all accounting policies; investors should also refer to Note 1 to the Consolidated Financial Statements included in Item 8 of this Annual Report on Form 10-K.
Business Combinations
We allocate the purchase price of acquired businesses to the estimated fair values of the assets acquired and liabilities assumed as of the date of the acquisition. The calculations used to determine the fair value of the long-lived assets acquired, primarily intangible assets, can be complex and require significant judgment. We weigh many factors when completing these estimates including, but not limited to, the nature of the acquired company’s business; its competitive position, strengths, and challenges; its historical financial position and performance; estimated customer retention rates; discount rates; and future plans for the combined entity. We may also engage independent valuation specialists, when necessary, to assist in the fair value calculations for significant acquired long-lived assets.
The fair value of acquired technology is generally the primary asset identified and therefore estimated using the multi-period excess earnings method. The multi-period excess earnings method model estimates revenues and cash flows derived from the primary asset and then deducts portions of the cash flow that can be attributed to supporting assets, such as Trade Names and in-process research and development, that contributed to the generation of the cash flows. The resulting cash flow, which is attributable solely to the primary asset acquired, is then discounted at a rate of return commensurate with the risk of the asset to calculate a present value. The Trade Name is generally calculated using the relief from royalty method, which calculates the cost savings associated with owning rather than licensing the technology. Assumed royalty rates are applied to the projected revenues for the remaining useful life of the technology to estimate the royalty savings. In-process research and development assets are valued using the multi-period excess earnings method when the cash flows from the in-process research and development assets are separately identifiable from the primary asset. In circumstances that Customer Relationship assets are identified that are not the primary asset, they are valued using the distributor model income approach, which isolates revenues and cash flow associated with the sales and distribution function of the entity and attributable to customer-related assets, which are then discounted at a rate of return commensurate with the risk of the asset to calculate a present value.
We estimate the fair value of liabilities for contingent consideration by discounting to present value the probability weighted contingent payments expected to be made. For potential payments related to financial performance based milestones, projected revenue and/or EBITDA amounts, volatility and discount rates assumptions are included in the estimated amounts. For potential payments related to product development milestones, the fair value is based on the probability of achievement of such milestones. The excess of the purchase price over the estimated fair value of the net assets acquired is recorded as goodwill. Goodwill is not amortized, but is subject to impairment testing on at least an annual basis.
We are also required to estimate the useful lives of the acquired intangible assets, which determines the amount of acquisition-related amortization expense we will record in future periods. Each reporting period, we evaluate the remaining useful lives of our amortizable intangibles to determine whether events or circumstances warrant a revision to the remaining period of amortization.
While we use our best estimates and assumptions, our fair value estimates are inherently uncertain and subject to refinement. As a result, during the measurement period, which may be up to one year from the acquisition date, we may record adjustments to the assets acquired and liabilities assumed, with the corresponding offset to goodwill. Any adjustments required after the measurement period are recorded in the consolidated statements of earnings.
The judgments required in determining the estimated fair values and expected useful lives assigned to each class of assets and liabilities acquired can significantly affect net income. For example, different classes of assets will have useful lives that differ. Consequently, to the extent a longer-lived asset is ascribed greater value than a shorter-lived asset, net income in a given period may be higher. Additionally, assigning a lower value to amortizable intangibles would result in a higher amount assigned to goodwill. As goodwill is not amortized, this would benefit net income in a given period, although goodwill is subject to annual impairment analysis.
Impairment of Goodwill
Goodwill
Goodwill was $843.1 million as of June 30, 2021, which represented 37.3% of total assets. Goodwill is tested for impairment on an annual basis in the fourth quarter of each year, or more frequently if events occur or circumstances change that could indicate a possible impairment.
To analyze goodwill for impairment, we must assign our goodwill to individual reporting units. Identification of reporting units includes an analysis of the components that comprise each of our operating segments, which considers, among other things, the manner in which we operate our business and the availability of discrete financial information. Components of an operating segment are aggregated to form one reporting unit if the components have similar economic characteristics. We periodically review our reporting units to ensure that they continue to reflect the manner in which we operate our business.
There has been no impairment of goodwill since the adoption of Financial Accounting Standards Board (“FASB”) ASC 350 guidance for goodwill and other intangibles on July 1, 2002.
2021 Goodwill Impairment Analyses
In completing our 2021 annual goodwill impairment analyses, we elected to perform a quantitative assessment for each of our five reporting units. A quantitative assessment involves comparing the carrying value of the reporting unit, including goodwill, to its estimated fair value. Carrying value is based on the assets and liabilities associated with the operations of the reporting unit, which often requires the allocation of shared or corporate items among reporting units. In accordance with ASU 2017-04, a goodwill impairment charge is recorded for the amount by which the carrying value of a reporting unit exceeds the fair value of the reporting unit. In determining the fair values of our reporting units, we utilized the income approach. The income approach is a valuation technique under which we estimated future cash flows using the reporting unit's financial forecast from the perspective of an unrelated market participant. Using historical trending and internal forecasting techniques, we projected revenue and applied our fixed and variable cost experience rates to the projected revenue to arrive at the future cash flows. A terminal value was then applied to the projected cash flow stream. Future estimated cash flows were discounted to their present value to calculate the estimated fair value. The discount rate used was the value-weighted average of our estimated cost of capital derived using both known and estimated customary market metrics. In determining the estimated fair value of a reporting unit, we were required to estimate a number of factors, including projected operating results, terminal growth rates, economic conditions, anticipated future cash flows, the discount rate and the allocation of shared or corporate items.
Because our 2021 quantitative analyses included all of our reporting units, the summation of our reporting units' fair values, as indicated by our discounted cash flow calculations, were compared to our consolidated fair value, as indicated by our market capitalization, to evaluate the reasonableness of our calculations. This impairment assessment is sensitive to changes in forecasted cash flows, as well as our selected discount rate. Changes in the reporting unit's results, forecast assumptions and estimates could materially affect the estimation of the fair value of the reporting units.
The quantitative assessment completed as of April 1, 2021 indicated that all of the reporting units had a substantial amount of headroom. Accordingly, the Company determined there was no indication of impairment of goodwill in our annual goodwill impairment analysis. Further, no triggering events were identified in the year ended June 30, 2021 that would require an additional goodwill impairment assessment beyond our required annual goodwill impairment assessment.
2020 Goodwill Impairment Analyses
In completing our 2020 annual goodwill impairment analyses, we elected to perform a quantitative assessment for all of our reporting units. A quantitative assessment involves comparing the carrying value of the reporting unit, including goodwill, to its estimated fair value. Carrying value is based on the assets and liabilities associated with the operations of the reporting unit, which often requires the allocation of shared or corporate items among reporting units. In accordance with ASU 2017-04, a goodwill impairment charge is recorded for the amount by which the carrying value of a reporting unit exceeds the fair value of the reporting unit. In determining the fair values of our reporting units, we utilized the income approach. The income approach is a valuation technique under which we estimated future cash flows using the reporting unit's financial forecast from the perspective of an unrelated market participant. Using historical trending and internal forecasting techniques, we projected revenue and applied our fixed and variable cost experience rates to the projected revenue to arrive at the future cash flows. A terminal value was then applied to the projected cash flow stream. Future estimated cash flows were discounted to their present value to calculate the estimated fair value. The discount rate used was the value-weighted average of our estimated cost of capital derived using both known and estimated customary market metrics. In determining the estimated fair value of a reporting unit, we were required to estimate a number of factors, including projected operating results, terminal growth rates, economic conditions, anticipated future cash flows, the discount rate and the allocation of shared or corporate items.
Because our 2020 quantitative analyses included all of our reporting units, the summation of our reporting units' fair values, as indicated by our discounted cash flow calculations, were compared to our consolidated fair value, as indicated by our market capitalization, to evaluate the reasonableness of our calculations. This impairment assessment is sensitive to changes in forecasted cash flows, as well as our selected discount rate. Changes in the reporting unit's results, forecast assumptions and estimates could materially affect the estimation of the fair value of the reporting units.
The quantitative assessment completed as of April 1, 2020 indicated that all of the reporting units had a substantial amount of headroom. Accordingly, the Company determined there was no indication of impairment of goodwill in our annual goodwill impairment analysis. Further, no triggering events were identified in the year ended June 30, 2020 that would require an additional goodwill impairment assessment beyond our required annual goodwill impairment assessment.
2019 Goodwill Impairment Analyses
At the beginning of the quarter ended March 31, 2019, the Company realigned the management of certain business processes between reporting units within the same segment. A goodwill allocation was performed between the impacted reporting units based on the relative fair value of the processes realigned. In conjunction with the realignment, a quantitative goodwill impairment assessment was performed both prior to and subsequent to the realignment. The quantitative impairment assessments performed utilized a consistent process with our fiscal 2021 quantitative goodwill impairment assessment described above. The quantitative assessment indicated that all of the impacted reporting units had substantial headroom both prior to and subsequent to the realignment. This impairment assessment performed was sensitive to changes in forecasted cash flows, as well as our selected discount rate. Changes in the reporting unit's results, forecast assumptions and estimates could materially affect the estimation of the fair value of the reporting units.
In conducting our annual goodwill impairment test as of April 1, 2019, we elected to perform a qualitative assessment to determine whether changes in events or circumstances since our most recent quantitative test for goodwill impairment indicated that it is more likely than not that the fair value of a reporting unit is less than its carrying amount. Based on its annual analysis, the Company determined there was no indication of impairment of goodwill.
NEW ACCOUNTING PRONOUNCEMENTS
Information regarding the accounting policies adopted during fiscal 2021 and those not yet adopted can be found under caption “Note 1: Description of Business and Summary of Significant Accounting Policies” of the Notes to the Consolidated Financial Statements appear in Item 8 of this report.
SUBSEQUENT EVENTS
None
NON-GAAP FINANCIAL MEASURES
This Annual Report on Form 10-K, including “Management’s Discussion and Analysis of Financial Condition and Results of Operations” in Item 7, contains financial measures that have not been calculated in accordance with accounting principles generally accepted in the U.S. (GAAP). These non-GAAP measures include:
| ● | Organic growth |
|---|---|
| ● | Adjusted gross margin |
| ● | Adjusted operating margin |
| ● | Adjusted net earnings |
| ● | Adjusted effective tax rate |
We provide these measures as additional information regarding our operating results. We use these non-GAAP measures internally to evaluate our performance and in making financial and operational decisions, including with respect to incentive compensation. We believe that our presentation of these measures provides investors with greater transparency with respect to our results of operations and that these measures are useful for period-to-period comparison of results.
Our non-GAAP financial measure of organic growth represents revenue growth excluding revenue from acquisitions within the preceeding 12 months as well as the impact of foreign currency. Excluding these measures provides more useful period-to-period comparison of revenue results as it excludes the impact of foreign currency exchange rates, which can vary significantly from period to period, and revenue from acquisitions that would not be included in the comparable prior period.
Our non-GAAP financial measures for adjusted gross margin, adjusted operating margin, and adjusted net earnings, in total and on a per share basis, exclude stock-based compensation, the costs recognized upon the sale of acquired inventory, amortization of acquisition intangibles, acquisition related expenses inclusive of the changes in fair value of contingent consideration, and other non-recurring items including non-recurring costs and gains. Stock-based compensation is excluded from non-GAAP adjusted net earnings because of the nature of this charge, specifically the varying available valuation methodologies, subjective assumptions, variety of award types, and unpredictability of amount and timing of employer related tax obligations. The Company excludes amortization of purchased intangible assets, purchase accounting adjustments, including costs recognized upon the sale of acquired inventory and acquisition-related expenses inclusive of the changes in fair value contingent consideration, and other non-recurring items including gains or losses on legal settlements and one-time assessments from this measure because they occur as a result of specific events, and are not reflective of our internal investments, the costs of developing, producing, supporting and selling our products, and the other ongoing costs to support our operating structure. Additionally, these amounts can vary significantly from period to period based on current activity.
The Company’s non-GAAP adjusted operating margin and adjusted net earnings, in total and on a per share basis, also excludes stock-based compensation expense, which is inclusive of the employer portion of payroll taxes on those stock awards, restructuring, impairments of equity method investments, gain and losses from investments, and certain adjustments to income tax expense. Impairments of equity investments are excluded as they are not part of our day-to-day operating decisions. Additionally, gains and losses from other investments that are either isolated or cannot be expected to occur again with any predictability are excluded. Costs related to restructuring activities, including reducing overhead and consolidating facilities, are excluded because we believe they are not indicative of our normal operating costs. The Company independently calculates a non-GAAP adjusted tax rate to be applied to the identified non-GAAP adjustments considering the impact of discrete items on these adjustments and the jurisdictional mix of the adjustments. In addition, the tax impact of other discrete and non-recurring charges which impact our reported GAAP tax rate are adjusted from net earnings. We believe these tax items can significantly affect the period-over-period assessment of operating results and not necessarily reflect costs and/or income associated with historical trends and future results.
The Company periodically reassesses the components of our non-GAAP adjustments for changes in how we evaluate our performance, changes in how we make financial and operational decisions, and considers the use of these measures by our competitors and peers to ensure the adjustments are still relevant and meaningful.
Readers are encouraged to review the reconciliations of the adjusted financial measures used in management's discussion and analysis of the financial condition of the Company to their most directly comparable GAAP financial measures provided within the Company's consolidated financial statements.
Item 7A. QUANTITATIVE AND QUALITATIVE DISCLOSURES
ABOUT MARKET RISK
The Company operates internationally, and thus is subject to potentially adverse movements in foreign currency exchange rates. Approximately 31% of the Company's consolidated net sales in fiscal 2021 were made in foreign currencies, including 13% in euro, 5% in British pound sterling, 7% in Chinese yuan and the remaining 6% in other currencies. The Company is exposed to market risk primarily from foreign exchange rate fluctuations of the euro, British pound sterling, Chinese yuan and Canadian dollar as compared to the U.S. dollar as the financial position and operating results of the Company's foreign operations are translated into U.S. dollars for consolidation.
Month-end exchange rates between the euro, British pound sterling, Chinese yuan, Canadian dollar and the U.S. dollar, which have not been weighted for actual sales volume in the applicable months in the periods, were as follows:
| Year Ended June 30, | ||||||||||||
|---|---|---|---|---|---|---|---|---|---|---|---|---|
| 2021 | 2020 | 2019 | ||||||||||
| Euro: | ||||||||||||
| High | $ | 1.23 | $ | 1.12 | $ | 1.17 | ||||||
| Low | 1.16 | 1.09 | 1.12 | |||||||||
| Average | 1.20 | 1.11 | 1.14 | |||||||||
| British pound sterling: | ||||||||||||
| High | $ | 1.42 | $ | 1.32 | $ | 1.32 | ||||||
| Low | 1.29 | 1.22 | 1.27 | |||||||||
| Average | 1.35 | 1.26 | 1.29 | |||||||||
| Chinese yuan: | ||||||||||||
| High | $ | 0.16 | $ | 0.15 | $ | 0.15 | ||||||
| Low | 0.14 | 0.14 | 0.14 | |||||||||
| Average | 0.15 | 0.14 | 0.15 | |||||||||
| Canadian dollar: | ||||||||||||
| High | $ | 0.83 | $ | 0.77 | $ | 0.77 | ||||||
| Low | 0.75 | 0.71 | 0.74 | |||||||||
| Average | 0.78 | 0.74 | 0.76 |
The Company's exposure to foreign exchange rate fluctuations also arises from trade receivables and intercompany payables denominated in one currency in the financial statements, but receivable or payable in another currency.
The Company does not enter into foreign currency forward contracts to reduce its exposure to foreign currency rate changes on forecasted intercompany sales transactions or on intercompany foreign currency denominated balance sheet positions. Foreign currency transaction gains and losses are included in "Other non-operating expense, net" in the Consolidated Statement of Earnings and Comprehensive Income. The effect of translating net assets of foreign subsidiaries into U.S. dollars are recorded on the Consolidated Balance Sheet as part of "Accumulated other comprehensive income (loss)."
The effects of a hypothetical simultaneous 10% appreciation in the U.S. dollar from June 30, 2021 levels against the euro, British pound sterling, Chinese yuan and Canadian dollar are as follows (in thousands):
| Decrease in translation of 2021 earnings into U.S. dollars | $ | 4,456 | ||
|---|---|---|---|---|
| Decrease in translation of net assets of foreign subsidiaries | 56,008 | |||
| Additional transaction losses | 1,755 |
Item 8. FINANCIAL STATEMENTS AND SUPPLEMENTARY DATA
CONSOLIDATED STATEMENTS OF EARNINGS AND COMPREHENSIVE INCOME
Bio-Techne Corporation and Subsidiaries (in thousands, except per share data)
| Year Ended June 30, | ||||||||||||
|---|---|---|---|---|---|---|---|---|---|---|---|---|
| 2021 | 2020 | 2019 | ||||||||||
| Net sales | $ | 931,032 | $ | 738,691 | $ | 714,006 | ||||||
| Cost of sales | 298,182 | 255,497 | 240,515 | |||||||||
| Gross margin | 632,850 | 483,194 | 473,491 | |||||||||
| Operating expenses: | ||||||||||||
| Selling, general and administrative | 324,951 | 260,583 | 264,359 | |||||||||
| Research and development | 70,603 | 65,192 | 62,413 | |||||||||
| Total operating expenses | 395,554 | 325,775 | 326,772 | |||||||||
| Operating income | 237,296 | 157,419 | 146,719 | |||||||||
| Other income (expense): | ||||||||||||
| Interest expense | (13,952 | ) | (19,197 | ) | (21,705 | ) | ||||||
| Interest income | 473 | 605 | 569 | |||||||||
| Other non-operating income (expense), net | (75,642 | ) | 137,650 | (13,568 | ) | |||||||
| Total other income (expense), net | (89,121 | ) | 119,058 | (34,704 | ) | |||||||
| Earnings before income taxes | 148,175 | 276,477 | 112,015 | |||||||||
| Income taxes (benefit) | 8,590 | 47,181 | 15,943 | |||||||||
| Net earnings, including noncontrolling interest | 139,585 | 229,296 | 96,072 | |||||||||
| Net earnings (loss) attributable to noncontrolling interest | (825 | ) | - | - | ||||||||
| Net earnings attributable to Bio-Techne | 140,410 | 229,296 | 96,072 | |||||||||
| Other comprehensive income (loss): | ||||||||||||
| Foreign currency translation adjustments | 32,951 | (9,963 | ) | (4,487 | ) | |||||||
| Unrealized gains (losses) on derivative instruments - cash flow hedges, net of tax amounts disclosed in Note 8. | 7,060 | (3,715 | ) | (9,537 | ) | |||||||
| Other comprehensive income (loss) | 40,011 | (13,678 | ) | (14,024 | ) | |||||||
| Other comprehensive income (loss) attributable to noncontrolling interest | 103 | - | - | |||||||||
| 39,908 | (13,678 | ) | (14,024 | ) | ||||||||
| Comprehensive income attributable to Bio-Techne | $ | 180,318 | 215,618 | $ | 82,048 | |||||||
| Earnings per share: | ||||||||||||
| Basic | $ | 3.62 | $ | 6.00 | $ | 2.54 | ||||||
| Diluted | $ | 3.47 | $ | 5.82 | $ | 2.47 | ||||||
| Weighted average common shares outstanding: | ||||||||||||
| Basic | 38,747 | 38,201 | 37,781 | |||||||||
| Diluted | 40,483 | 39,401 | 38,892 |
See Notes to Consolidated Financial Statements.
CONSOLIDATED BALANCE SHEETS
Bio-Techne Corporation and Subsidiaries (in thousands, except share and per share data)
| June 30, | ||||||||
|---|---|---|---|---|---|---|---|---|
| 2021 | 2020 | |||||||
| ASSETS | ||||||||
| Current assets: | ||||||||
| Cash and cash equivalents | $ | 199,091 | $ | 146,625 | ||||
| Short-term available-for-sale investments | 32,463 | 124,268 | ||||||
| Accounts receivable, less allowance for doubtful accounts of $1,229 and $775, respectively | 145,385 | 122,534 | ||||||
| Inventories | 116,748 | 103,152 | ||||||
| Other current assets | 16,919 | 24,341 | ||||||
| Total current assets | 510,606 | 520,920 | ||||||
| Property and equipment, net | 207,907 | 176,829 | ||||||
| Right of use asset | 73,834 | 71,465 | ||||||
| Goodwill | 843,067 | 728,308 | ||||||
| Intangible assets, net | 615,968 | 516,545 | ||||||
| Other assets | 11,575 | 13,522 | ||||||
| Total assets | $ | 2,262,957 | $ | 2,027,589 | ||||
| LIABILITIES AND SHAREHOLDERS' EQUITY | ||||||||
| Current liabilities: | ||||||||
| Trade accounts payable | $ | 29,384 | $ | 23,090 | ||||
| Salaries, wages and related accruals | 51,294 | 31,087 | ||||||
| Accrued expenses | 15,282 | 9,093 | ||||||
| Contract liabilities | 18,995 | 13,049 | ||||||
| Income taxes payable | 5,336 | 2,376 | ||||||
| Operating lease liabilities - current | 11,602 | 9,535 | ||||||
| Contingent consideration payable | 4,000 | 5,938 | ||||||
| Current portion of long-term debt obligations | 12,500 | 12,500 | ||||||
| Other current liabilities | 3,891 | - | ||||||
| Total current liabilities | 152,284 | 106,668 | ||||||
| Deferred income taxes | 93,125 | 101,090 | ||||||
| Long-term debt obligations | 328,827 | 344,243 | ||||||
| Long-term contingent consideration payable | 25,400 | 199 | ||||||
| Operating lease liabilities | 67,625 | 67,248 | ||||||
| Other long-term liabilities | 24,462 | 26,949 | ||||||
| Bio-Techne's shareholders' equity: | ||||||||
| Undesignated capital stock, no par; authorized 5,000,000 shares; none issued or outstanding | - | - | ||||||
| Common stock, par value $.01 a share; authorized 100,000,000 shares; issued and outstanding 38,955,484 and 38,453,046 shares, respectively | 390 | 385 | ||||||
| Additional paid-in capital | 534,411 | 420,536 | ||||||
| Retained earnings | 1,085,461 | 1,057,470 | ||||||
| Accumulated other comprehensive loss | (57,291 | ) | (97,199 | ) | ||||
| Total Bio-Techne shareholders' equity | 1,562,971 | 1,381,192 | ||||||
| Noncontrolling interest | 8,263 | - | ||||||
| Total shareholders' equity | 1,571,234 | 1,381,192 | ||||||
| Total liabilities and shareholders’ equity | $ | 2,262,957 | $ | 2,027,589 |
See Notes to Consolidated Financial Statements.
CONSOLIDATED STATEMENTS OF SHAREHOLDERS' EQUITY Bio-Techne Corporation and Subsidiaries (in thousands)
| Common Stock | Additional Paid-in | Retained | Accumulated Other Comprehensive | Noncontrolling Interest | ||||||||||||||||||||||||
|---|---|---|---|---|---|---|---|---|---|---|---|---|---|---|---|---|---|---|---|---|---|---|---|---|---|---|---|---|
| Shares | Amount | Capital | Earnings | Income(Loss) | Total | |||||||||||||||||||||||
| Balances at June 30, 2018 | 37,608 | $ | 376 | $ | 246,568 | $ | 876,931 | $ | (44,814 | ) | $ | - | $ | 1,079,061 | ||||||||||||||
| Cumulative effect adjustments due to adoption of new accounting standards and other | 25,276 | (24,682 | ) | 594 | ||||||||||||||||||||||||
| Net earnings | 96,072 | 96,072 | ||||||||||||||||||||||||||
| Other comprehensive income (loss) | (14,024 | ) | (14,024 | ) | ||||||||||||||||||||||||
| Share repurchases | (95 | ) | (1 | ) |
Showing the first 8K of 149K characters. Open the full section
Item 9. CHANGES IN AND DISAGREEMENTS WITH ACCOUNTANTS ON ACCOUNTING AND FINANCIAL DISCLOSURE
None.
Item 9A. CONTROLS AND PROCEDURES
| (a) | Evaluation of Disclosure Controls and Procedures |
|---|
As required by Rule 13a-15(b) of the Securities Exchange Act of 1934 (the "Exchange Act"), management, with the participation of our Chief Executive Officer and Chief Financial Officer, evaluated, as of the end of the period covered by this report, the effectiveness of our disclosure controls and procedures as defined in Exchange Act Rule 13a-15(e). The evaluation was based upon reports and certifications provided by a number of executives. Based on that evaluation, our Chief Executive Officer and Chief Financial Officer concluded that, as of June 30, 2021, our disclosure controls and procedures were effective.
| (b) | Management's Annual Report on Internal Control Over Financial Reporting |
|---|
The Company's internal control over financial reporting is a process designed to provide reasonable assurance regarding the reliability of financial reporting and the preparation of financial statements for external purposes in accordance with generally accepted accounting principles. A company's internal control over financial reporting also includes those policies and procedures that:
| (i) | Pertain to the maintenance of records that, in reasonable detail, accurately and fairly reflect the transactions and dispositions of the assets of the company; |
|---|
| (ii) | Provide reasonable assurance that transactions are recorded as necessary to permit preparation of financial statements in accordance with generally accepted accounting principles, and that receipts and expenditures of the company are being made only in accordance with authorizations of management and directors of the company; and |
|---|
| (iii) | Provide reasonable assurance regarding prevention or timely detection of unauthorized acquisition, use or disposition of the company's assets that could have a material effect on the financial statements. |
|---|
Because of its inherent limitations, internal control over financial reporting may not prevent or detect misstatements. Also, projections of any evaluation of effectiveness to future periods are subject to the risk that controls may become inadequate because of changes in conditions, or that the degree of compliance with the policies or procedures may deteriorate.
A material weakness is a deficiency, or combination of deficiencies, in internal control over financial reporting such that there is a reasonable possibility that a material misstatement of the Company's annual or interim financial statements will not be prevented or detected on a timely basis.
We acquired a controlling interest in Eminence Biotechnology (Eminence) on October 20, 2020 and acquired Asuragen, Inc. (Asuragen) on April 6, 2021. Eminence and Asuragen represented approximately 12.0% of our total assets and 0.8% of our total revenues as of and for the year ended June 30, 2021. We excluded internal control over financial reporting associated with Eminence and Asuragen from our assessment of the effectiveness of our internal control over financial reporting as of June 30, 2021.
Under the supervision of the Audit Committee of the Board of Directors and with the participation of our management, including our Chief Executive Officer and Chief Financial Officer, we conducted an evaluation of the effectiveness of our internal control over financial reporting using the criteria established in Internal Control - Integrated Framework (2013) issued by the Committee of Sponsoring Organizations of the Treadway Commission (COSO). Based on our assessment and those criteria, our Chief Executive Officer and Chief Financial Officer concluded that our internal control over financial reporting was effective as of June 30, 2021.
The attestation report on our internal control over financial reporting issued by KPMG LLP appears in Item 8 of this report.
| (c) | Changes in Internal Control Over Financial Reporting |
|---|
As previously announced, we acquired Eminence Biotechnology on October 20, 2020 and Asuragen, Inc on April 6, 2021. We have not fully evaluated any changes in internal control over financial reporting associated with these acquisitions and therefore any material changes that may result from these acquisitions have not been disclosed in this report. We intend to disclose all material changes resulting from the acquisitions within or prior to the time of our first annual assessment of internal control over financial reporting that is required to include these entities.
There were no other changes in the Company's internal control over financial reporting during fiscal year 2021 that have materially affected, or are reasonably likely to materially affect, the Company's internal control over financial reporting.
Item 9B. OTHER INFORMATION
Item 10. DIRECTORS, EXECUTIVE OFFICERS AND CORPORATE GOVERNANCE
Other than "Executive Officers of the Registrant" which is set forth at the end of Item 1 in Part I of this report, the information required by Item 10 is incorporated herein by reference to the sections entitled "Election of Directors," "Principle Shareholders" and "Additional Corporate Governance Matters" in the Company's Proxy Statement for its 2021 Annual Meeting of Shareholders which will be filed with the Securities and Exchange Commission pursuant to Regulation 14A within 120 days after the close of the fiscal year for which this report is filed.
Item 11. EXECUTIVE COMPENSATION
The information required by Item 11 is incorporated herein by reference to the sections entitled "Election of Directors" and "Executive Compensation" in the Company's Proxy Statement for its 2021 Annual Meeting of Shareholders which will be filed with the Securities and Exchange Commission pursuant to Regulation 14A within 120 days after the close of the fiscal year for which this report is filed.
Item 12. SECURITY OWNERSHIP OF CERTAIN BENEFICIAL
OWNERS AND MANAGEMENT AND RELATED SHAREHOLDER MATTERS
The information required by Item 12 is incorporated by reference to the sections entitled "Principal Shareholders" and "Management Shareholdings" in the Company's Proxy Statement for its 2021 Annual Meeting of Shareholders which will be filed with the Securities and Exchange Commission pursuant to Regulation 14A within 120 days after the close of the fiscal year for which this report is filed.
Item 13. CERTAIN RELATIONSHIPS AND RELATED TRANSACTIONS, AND DIRECTOR INDEPENDENCE
The information required by Item 13 is incorporated by reference to the sections entitled "Election of Directors" and "Additional Corporate Governance Matters" in the Company's Proxy Statement for its 2021 Annual Meeting of Shareholders which will be filed with the Securities and Exchange Commission pursuant to Regulation 14A within 120 days after the close of the fiscal year for which this report is filed.
Item 14. PRINCIPAL ACCOUNTING FEES AND SERVICES
The information required by Item 14 is incorporated herein by reference to the section entitled "Audit Matters" in the Company's Proxy Statement for its 2021 Annual Meeting of Shareholders which will be filed with the Securities and Exchange Commission pursuant to Regulation 14A within 120 days after the close of the fiscal year for which this report is filed.
Item 15. EXHIBITS, FINANCIAL STATEMENT SCHEDULES
A. (1) List of Financial Statements.
The following Consolidated Financial Statements are filed as part of this Annual Report on Form 10-K:
Consolidated Statements of Earnings and Comprehensive Income for the Years Ended June 30, 2021, 2020, and 2019
Consolidated Balance Sheets as of June 30, 2021 and 2020
Consolidated Statements of Shareholders' Equity for the Years Ended June 30, 2021, 2020, and 2019
Consolidated Statements of Cash Flows for the Years Ended June 30, 2021, 2020, and 2019
Notes to Consolidated Financial Statements for the Years Ended June 30, 2021, 2020, and 2019
Reports of Independent Registered Public Accounting Firm
A. (2) Financial Statement Schedules.
All financial statement schedules are omitted because they are not applicable, not material or the required information is shown in the Consolidated Financial Statements or Notes thereto.
A. (3) Exhibits.
EXHIBIT INDEX
for Form 10-K for the 2021 Fiscal Year
| 21 | Subsidiaries of the Company |
|---|---|
| 23 | Consent of KPMG LLP, Independent Registered Public Accounting Firm |
| 31.1 | Certification of Chief Executive Officer pursuant to Section 302 of the Sarbanes-Oxley Act of 2002 |
| 31.2 | Certification of Chief Financial Officer pursuant to Section 302 of the Sarbanes-Oxley Act of 2002 |
| 32.1 | Certification of Chief Executive Officer pursuant to Section 906 of the Sarbanes-Oxley Act of 2002 |
| 32.2 | Certification of Chief Financial Officer pursuant to Section 906 of the Sarbanes-Oxley Act of 2002 |
| 101 | The following financial statements from the Company's Annual Report on Form 10-K for the fiscal year ended June 30, 2021, formatted in Inline Extensible Business Reporting Language (iXBRL): (i) the Consolidated Statements of Earnings and Comprehensive Income, (ii) the Consolidated Balance Sheets, (iii) the Consolidated Statements of Shareholders' Equity, (iv) the Consolidated Statements of Cash Flows, and (v) Notes to the Consolidated Financial Statements. |
| 104 | Cover Page Interactive Data File (formatted as Inline XBRL and contained in Exhibit 101) |
-------------
* Incorporated by reference; SEC File No. 000-17272
** Management contract or compensatory plan or arrangement
Exhibits for Form 10-K have not been included in this report. Exhibits have been filed with the Securities and Exchange Commission. Upon request to the Investor Relations Department, Bio-Techne Corporation will furnish, without charge, any such exhibits as well as copies of periodic reports filed with the Securities and Exchange Commission.
Item 16. FORM 10-K SUMMARY
None.
Pursuant to the requirements of Section 13 or 15(d) of the Securities Exchange Act of 1934, the Registrant has duly caused this Report to be signed on its behalf by the undersigned, thereunto duly authorized.
| BIO-TECHNE CORPORATION | |||
|---|---|---|---|
| Date: August 25, 2021 | /s/ Charles Kummeth | ||
| By: Charles Kummeth | |||
| Its: President and CEO |
Pursuant to the requirements of the Securities Exchange Act of 1934, this Report has been signed by the following persons on behalf of the Registrant and in the capacities and on the dates indicated.
| Date | Signature and Title |
|---|---|
| August 25, 2021 | /s/ Robert V. Baumgartner |
| Robert V. Baumgartner | |
| Chairman of the Board and Director | |
| August 25, 2021 | /s/ Julie Bushman |
| Julie Bushman, Director | |
| August 25, 2021 | /s/ Rupert Vessey |
| Dr. Rupert Vessey, Director | |
| August 25, 2021 | /s/ Joseph Keegan, Ph.D. |
| Dr. Joseph Keegan, Director | |
| August 25, 2021 | /s/ John L. Higgins |
| John L. Higgins, Director | |
| August 25, 2021 | /s/ Roeland Nusse, Ph.D. |
| Dr. Roeland Nusse, Director | |
| August 25, 2021 | /s/ Alpna Seth, Ph.D. |
| Dr. Alpna Seth, Director | |
| August 25, 2021 | /s/ Randolph C. Steer, Ph.D., M.D. |
| Dr. Randolph C. Steer, Director | |
| August 25, 2021 | /s/ Charles Kummeth |
| Charles Kummeth, Director and Chief Executive Officer (principal executive officer) | |
| August 25, 2021 | /s/ James Hippel |
| James Hippel, Chief Financial Officer | |
| (principal financial officer and principal accounting officer) |