 filings.tools
Item 7. Management’s Discussion and Analysis of Financial Condition and Results of Operations
74K characters. Original on sec.gov · Markdown
Item 7. Management’s Discussion and Analysis of Financial Condition and Results of Operations
| --- | --- |
Overview
We are a leading global supplier of automation equipment for test and industrial applications. We design, develop, manufacture and sell automatic test systems used to test semiconductors, wireless products, data storage and complex electronics systems in the consumer electronics, wireless, automotive, industrial, computing, communications, and aerospace and defense industries. Our industrial automation products include collaborative robots used by global manufacturing and light industrial customers to improve quality, increase manufacturing efficiency and decrease manufacturing costs. Our automatic test equipment and industrial automation products and services include:
| • | semiconductor test (“Semiconductor Test”) systems; |
|---|
| • | defense/aerospace (“Defense/Aerospace”) test instrumentation and systems, storage test (“Storage Test”) systems, and circuit-board test and inspection (“Production Board Test”) systems (collectively these products represent “System Test”); |
|---|
| • | wireless test (“Wireless Test”) systems; and |
|---|
| • | industrial automation (“Industrial Automation”) products. |
|---|
We have a broad customer base which includes integrated device manufacturers (“IDMs”), outsourced semiconductor assembly and test providers (“OSATs”), wafer foundries, fabless companies that design, but contract with others for the manufacture of integrated circuits (“ICs”), developers of wireless devices and consumer electronics, manufacturers of circuit boards, automotive suppliers, wireless product manufacturers, storage device manufacturers, aerospace and military contractors, and distributors that sell collaborative robots.
On June 11, 2015, we acquired Universal Robots A/S (“Universal Robots”) for approximately $284 million of cash plus up to an additional $65 million of cash if certain performance targets are met extending through 2018. Universal Robots is the leading supplier of collaborative robots which are low-cost, easy-to-deploy and simple-to-program robots that work side by side with production workers to improve quality, increase manufacturing efficiency and decrease manufacturing costs. Universal Robots is a separate operating and reportable segment, Industrial Automation. The acquisition of Universal Robots provides a growth engine to our business and complements our existing System Test and Wireless Test segments. The total purchase price for Universal Robots was approximately $315 million.
In 2014, we acquired Avionics Interface Technologies, LLC (“AIT”), a supplier of equipment for testing state-of-the-art data communication buses. The acquisition of AIT complements our Defense/Aerospace line of bus test instrumentation for commercial and defense avionics systems. AIT is included in our System Test
Table of Contents
segment. The total purchase price for AIT was approximately $21 million, which included cash paid of approximately $19 million and $2 million in fair value of contingent consideration payable upon achievement of revenue and gross margin targets in 2015 and 2016. No contingent consideration was paid for 2015. The maximum remaining contingent consideration that could be paid is $1.1 million.
In 2013, we acquired ZTEC Instruments Inc. (“ZTEC”), a supplier of modular wireless test instruments. The acquisition of ZTEC expands our Wireless Test segment into the design verification test of wireless components and chipsets. The total purchase price for ZTEC was approximately $17 million, which included cash paid of approximately $15 million and $2 million in fair value of contingent consideration payable upon achievement of certain customer order and revenue targets through 2015. None of the contingent consideration was paid.
We believe our recent acquisitions have enhanced our opportunities for growth. We will continue to invest in our business, grow market share in our markets and expand further our addressable markets while tightly managing our costs.
The sales of our products and services are dependent, to a large degree, on customers who are subject to cyclical trends in the demand for their products. These cyclical periods have had, and will continue to have, a significant effect on our business since our customers often delay or accelerate purchases in reaction to changes in their businesses and to demand fluctuations in the semiconductor and electronics industries. Historically, these demand fluctuations have resulted in significant variations in our results of operations. The sharp swings in the semiconductor and electronics industries in recent years have generally affected the semiconductor and electronics test equipment and services industries more significantly than the overall capital equipment sector.
In the fourth quarter of 2014, we performed our annual goodwill impairment test and recorded a goodwill impairment charge of $98.9 million in our Wireless Test segment as a result of decreased projected demand attributable to an estimated smaller future wireless test market due to reuse of wireless test equipment, price competition and different testing techniques. Further reductions in the size of the wireless test market may occur, which may result in additional goodwill impairment charges, increased risk of excess and obsolete inventories, asset write-offs and restructuring charges.
Critical Accounting Policies and Estimates
We have identified the policies discussed below as critical to understanding our business and our results of operations and financial condition. The impact and any associated risks related to these policies on our business operations is discussed throughout Management’s Discussion and Analysis of Financial Condition and Results of Operations where such policies affect our reported and expected financial results.
Revenue Recognition
We recognize revenues when there is persuasive evidence of an arrangement, title and risk of loss have passed, delivery has occurred or the services have been rendered, the sales price is fixed or determinable and collection of the related receivable is reasonably assured. Title and risk of loss generally pass to our customers upon shipment or at delivery destination point. In circumstances where either title or risk of loss pass upon destination, acceptance or cash payment, we defer revenue recognition until such events occur except when title transfer is tied to cash payment outside the United States. Outside the United States, we recognize revenue upon shipment or at delivery destination point, even if we retain a form of title to products delivered to customers, provided the sole purpose is to enable us to recover the products in the event of customer payment default and the arrangement does not prohibit the customer’s use or resale of the product in the ordinary course of business.
Our equipment has non-software and embedded software components that function together to deliver the equipment’s essential functionality. Revenue is recognized upon shipment or at delivery destination point, provided that customer acceptance criteria can be demonstrated prior to shipment. Certain contracts require us to
Table of Contents
perform tests of the product to ensure that performance meets the published product specifications or customer requested specifications, which are generally conducted prior to shipment. Where the criteria cannot be demonstrated prior to shipment, revenue is deferred until customer acceptance has been received. We also defer the portion of the sales price that is not due until acceptance, which represents deferred profit.
For multiple element arrangements, we allocate revenue to all deliverables based on their relative selling prices. In such circumstances, a hierarchy is used to determine the selling price for allocating revenue to deliverables as follows: (i) vendor-specific objective evidence of selling price (“VSOE”), (ii) third-party evidence of selling price (“TPE”), and (iii) best estimate of the selling price (“BESP”). For a delivered item to be considered a separate unit, the delivered item must have value to the customer on a standalone basis and the delivery or performance of the undelivered item must be considered probable and substantially in our control.
Our post-shipment obligations include installation, training services, one-year standard warranties, and extended warranties. Installation does not alter the product capabilities, does not require specialized skills or tools and can be performed by the customers or other vendors. Installation is typically provided within five days of product shipment and is completed within one to two days thereafter. Training services are optional and do not affect the customers’ ability to use the product. We defer revenue for the selling price of installation and training. Extended warranties constitute warranty obligations beyond one year and we defer revenue in accordance with Financial Accounting Standards Board (“FASB”) Accounting Standards Codification (“ASC”) 605-20, “Separately Priced Extended Warranty and Product Maintenance Contracts” and ASC 605-25, “Revenue Recognition Multiple-Element Arrangements.” Service revenue is recognized over the contractual period or as services are performed.
Our products are generally subject to warranty and the related costs of the warranty are provided for in cost of revenues when product revenue is recognized. We classify shipping and handling costs in cost of revenues.
We do not provide our customers with contractual rights of return for any of our products.
Translation of Non-U.S. Currencies
The functional currency for all non-U.S. subsidiaries is the U.S. dollar, except for the Industrial Automation segment for which the local currency is its functional currency. All foreign currency denominated monetary assets and liabilities are remeasured on a monthly basis into the functional currency using exchange rates in effect at the end of the period. All foreign currency denominated non-monetary assets and liabilities are remeasured into the functional currency using historical exchange rates. Net foreign exchange gains and losses resulting from remeasurement are included in other (income) expense, net. For Industrial Automation, assets and liabilities are translated into U.S. dollars using exchange rates in effect at the end of the period. Revenue and expense amounts are translated using an average of exchange rates in effect during the period. Translation adjustments are recorded within accumulated other comprehensive income (loss).
Retirement and Postretirement Plans
We recognize net actuarial gains and losses and the change in the fair value of the plan assets in our operating results in the year in which they occur or upon any interim remeasurement of the plans. We calculate the expected return on plan assets using the fair value of the plan assets. Actuarial gains and losses are generally measured annually as of December 31 and, accordingly, recorded during the fourth quarter of each year or upon any interim remeasurement of the plans.
Inventories
Inventories are stated at the lower of cost (first-in, first-out basis) or net realizable value. On a quarterly basis, we use consistent methodologies to evaluate all inventories for net realizable value. We record a provision
Table of Contents
for both excess and obsolete inventory when such write-downs or write-offs are identified through the quarterly review process. The inventory valuation is based upon assumptions about future demand, product mix, and possible alternative uses.
Equity Incentive and Stock Purchase Plans
Stock-based compensation expense is based on the grant-date fair value estimated in accordance with the provisions of ASC 718, “Compensation—Stock Compensation.” As required by ASC 718, we have made an estimate of expected forfeitures and are recognizing compensation costs only for those stock-based compensation awards expected to vest.
Income Taxes
Deferred tax assets and liabilities are determined based on differences between financial reporting and tax basis of assets and liabilities and are measured using the enacted tax rates and laws that will be in effect when the differences are expected to reverse. The measurement of deferred tax assets is reduced by a valuation allowance if it is more likely than not that some or all of the deferred tax assets will not be realized. We performed the required assessment of positive and negative evidence regarding the realization of the net deferred tax assets in accordance with ASC 740, “Accounting for Income Taxes.” This assessment included the evaluation of scheduled reversals of deferred tax liabilities, estimates of projected future taxable income and tax-planning strategies. Although realization is not assured, based on our assessment, we concluded that it is more likely than not that such assets, net of the existing valuation allowance, will be realized. U.S. income taxes are not provided for on the earnings of non-U.S. subsidiaries which are expected to be reinvested indefinitely in operations outside the U.S. For intra-period tax allocations, we first utilize non-equity related tax attributes, such as net operating losses and credit carryforwards, and then equity-related tax attributes. We use the with-and-without method for calculating excess stock compensation deductions and do not take into account any indirect impacts of excess stock compensation deductions on its research and development tax credits, domestic production activities deduction, and other differences between financial reporting and tax reporting.
Investments
We account for our investments in debt and equity securities in accordance with the provisions of ASC 320-10, “Investments—Debt and Equity Securities.” On a quarterly basis, we review our investments to identify and evaluate those that have an indication of a potential other-than-temporary impairment. Factors considered in determining whether a loss is other-than-temporary include:
| • | The length of time and the extent to which the market value has been less than cost; |
|---|
| • | The financial condition and near-term prospects of the issuer; and |
|---|
| • | The intent and ability to retain the investment in the issuer for a period of time sufficient to allow for any anticipated recovery in market value. |
|---|
Goodwill, Intangible and Long-Lived Assets
We assess goodwill for impairment at least annually in the fourth quarter, as of December 31, on a reporting unit basis, or more frequently, when events and circumstances occur indicating that the recorded goodwill may be impaired. If the book value of a reporting unit exceeds its fair value, the implied fair value of goodwill is compared with the carrying amount of goodwill. If the carrying amount of goodwill exceeds the implied fair value, an impairment charge is recorded in an amount equal to that excess. No goodwill impairment was identified in 2015 or 2013. In the fourth quarter of 2014, we performed our annual goodwill impairment test and recorded a goodwill impairment charge of $98.9 million in our Wireless Test segment as a result of decreased projected demand attributable to an estimated smaller future wireless test market due to reuse of wireless test equipment, price competition and different testing techniques.
Table of Contents
We assess the impairment of intangible and long-lived assets whenever events or changes in circumstances indicate that the carrying value may not be recoverable. Factors we consider important in the determination of an impairment include significant underperformance relative to historical or projected future operating results, significant changes in the manner that we use the acquired asset and significant negative industry or economic trends.
There were no events or circumstances indicating that the carrying value may not be recoverable in 2015 or 2013. As a result of the Wireless Test segment goodwill impairment charge in the fourth quarter of 2014 described above, we performed an impairment test of the Wireless Test segment’s intangible and long-lived assets based on a comparison of the estimated undiscounted cash flows to the recorded value of the assets and there was no indication of impairment. When we determine that the carrying value of intangible and long-lived assets may not be recoverable based upon the existence of one or more of the above indicators of impairment, we measure any impairment based on a projected discounted cash flow method using a discount rate commensurate with the associated risks.
SELECTED RELATIONSHIPS WITHIN THE CONSOLIDATED
STATEMENTS OF OPERATIONS
| Years Ended December 31, | ||||||||||||
| 2015 | 2014 | 2013 | ||||||||||
| Percentage of revenues: | ||||||||||||
| Revenues: | ||||||||||||
| Products | 81.8 | % | 82.8 | % | 80.9 | % | ||||||
| Services | 18.2 | 17.2 | 19.1 | |||||||||
| Total revenues | 100.0 | 100.0 | 100.0 | |||||||||
| Cost of revenues: | ||||||||||||
| Cost of products | 36.1 | 38.9 | 34.9 | |||||||||
| Cost of services | 8.1 | 7.8 | 8.4 | |||||||||
| Total cost of revenues (exclusive of acquired intangible assets amortization shown separately below) | 44.2 | 46.7 | 43.4 | |||||||||
| Gross profit | 55.8 | 53.3 | 56.6 | |||||||||
| Operating expenses: | ||||||||||||
| Engineering and development | 17.8 | 17.7 | 18.5 | |||||||||
| Selling and administrative | 18.7 | 19.4 | 19.6 | |||||||||
| Goodwill impairment | — | 6.0 | — | |||||||||
| Acquired intangible assets amortization | 4.2 | 4.3 | 5.1 | |||||||||
| Restructuring and other | 0.3 | 0.1 | 0.1 | |||||||||
| Total operating expenses | 41.0 | 47.5 | 43.3 | |||||||||
| Income from operations | 14.8 | 5.9 | 13.4 | |||||||||
| Non-operating (income) expenses: | ||||||||||||
| Interest income | (0.4 | ) | (0.4 | ) | (0.3 | ) | ||||||
| Interest expense | 0.1 | 0.4 | 1.8 | |||||||||
| Other (income) expense, net | (0.3 | ) | — | (2.3 | ) | |||||||
| Income before income taxes | 15.4 | 5.8 | 14.1 | |||||||||
| Income tax provision | 2.8 | 0.9 | 2.6 | |||||||||
| Net income | 12.6 | % | 4.9 | % | 11.6 | % | ||||||
Table of Contents
Results of Operations
Book to Bill Ratio
Book to bill ratio is calculated as net bookings divided by net sales. Book to bill ratio by reportable segment was as follows:
| Three months ended December 31, | ||||||||||||
| 2015 | 2014 | 2013 | ||||||||||
| Semiconductor Test | 2.0 | 1.0 | 1.0 | |||||||||
| System Test | 1.1 | 1.5 | 1.0 | |||||||||
| Wireless Test | 0.9 | 1.0 | 0.7 | |||||||||
| Industrial Automation | 0.8 | — | — | |||||||||
| Total Company | 1.6 | 1.0 | 1.0 |
Revenues
Revenues for our four reportable segments were as follows:
| 2015 | 2014 | 2013 | 2014-2015 Dollar Change | 2013-2014 Dollar Change | ||||||||||||||||
| (in millions) | ||||||||||||||||||||
| Semiconductor Test | $ | 1,201.5 | $ | 1,300.8 | $ | 1,023.0 | $ | (99.3 | ) | $ | 277.8 | |||||||||
| System Test | 211.6 | 162.5 | 153.0 | 49.1 | 9.5 | |||||||||||||||
| Wireless Test | 184.6 | 184.5 | 251.9 | 0.1 | (67.4 | ) | ||||||||||||||
| Industrial Automation | 41.9 | — | — | 41.9 | — | |||||||||||||||
| $ | 1,639.6 | $ | 1,647.8 | $ | 1,427.9 | $ | (8.2 | ) | $ | 219.9 | ||||||||||
The decrease in Semiconductor Test revenues of $99.3 million, or 8%, from 2014 to 2015 was primarily due to a decrease in system-on-a-chip (“SOC”) product volume, driven by smaller microcontroller, power management and radio frequency test markets.
The increase in Semiconductor Test revenues of $277.8 million, or 27%, from 2013 to 2014 was primarily due to higher SOC product volume, driven by a larger application processor test market.
The increase in System Test revenues of $49.1 million, or 30%, from 2014 to 2015 was primarily due to higher sales in Storage Test of 3.5” hard disk drive testers used for testing drives for cloud storage applications.
The increase in System Test revenues of $9.5 million, or 6%, from 2013 to 2014 was primarily due to higher product volume in Storage Test driven by solid state disk testers and by Production Board Test driven by automotive test applications, partially offset by lower Defense/Aerospace product sales.
Wireless Test revenues were approximately flat from 2014 to 2015 as an increase in cellular product volume was offset by lower connectivity product volume.
The decrease in Wireless Test revenues of $67.4 million, or 27%, from 2013 to 2014 was primarily due to lower cellular and connectivity product volume driven by a smaller wireless test market.
The acquisition of Universal Robots, completed in June of 2015, added $41.9 million of revenue in 2015. Universal Robots is our Industrial Automation segment.
Table of Contents
Our four reportable segments accounted for the following percentages of consolidated revenues:
| 2015 | 2014 | 2013 | ||||||||||
| Semiconductor Test | 73 | % | 79 | % | 71 | % | ||||||
| System Test | 13 | 10 | 11 | |||||||||
| Wireless Test | 11 | 11 | 18 | |||||||||
| Industrial Automation | 3 | — | — | |||||||||
| 100 | % | 100 | % | 100 | % | |||||||
Revenues by country as a percentage of total revenues were as follows (1):
| 2015 | 2014 | 2013 | ||||||||||
| Taiwan | 27 | % | 30 | % | 19 | % | ||||||
| China | 16 | 18 | 23 | |||||||||
| United States | 13 | 13 | 16 | |||||||||
| Japan | 8 | 4 | 6 | |||||||||
| Korea | 7 | 9 | 8 | |||||||||
| Europe | 7 | 7 | 6 | |||||||||
| Singapore | 6 | 7 | 8 | |||||||||
| Philippines | 6 | 4 | 4 | |||||||||
| Malaysia | 5 | 5 | 6 | |||||||||
| Thailand | 4 | 2 | 2 | |||||||||
| Rest of the World | 1 | 1 | 2 | |||||||||
| 100 | % | 100 | % | 100 | % | |||||||
| (1) | Revenues attributable to a country are based on the location of the customer site. |
|---|
The breakout of product and service revenues was as follows:
| 2015 | 2014 | 2013 | 2014-2015 Dollar Change | 2013-2014 Dollar Change | ||||||||||||||||
| (in millions) | ||||||||||||||||||||
| Product Revenues | $ | 1,340.6 | $ | 1,364.0 | $ | 1,154.9 | $ | (23.4 | ) | $ | 209.1 | |||||||||
| Service Revenues | 299.0 | 283.8 | 273.0 | 15.2 | 10.8 | |||||||||||||||
| $ | 1,639.6 | $ | 1,647.8 | $ | 1,427.9 | $ | (8.2 | ) | $ | 219.9 | ||||||||||
Our product revenues decreased $23.4 million, or 2%, in 2015 from 2014 primarily due to lower SOC product volume, driven by smaller microcontroller, power management and radio frequency test markets. This decrease was partially offset by higher sales in Storage Test of 3.5” hard disk drive testers for cloud storage and the addition of Universal Robots in 2015. Service revenues, which are derived from the servicing of our installed base of products and include equipment maintenance contracts, repairs, extended warranties, parts sales, and applications support, increased $15.2 million or 5%.
Our product revenues increased $209.1 million, or 18%, in 2014 from 2013 primarily due to an increase in SOC test product volume, driven by a larger application processor test market. This increase was partially offset by lower cellular and connectivity product volume in Wireless Test. Service revenues increased $10.8 million or 4%.
In 2015, revenues from one customer accounted for 13% of our consolidated revenues. In 2013, revenues from a different customer accounted for 12% of our consolidated revenues. In 2014, no single customer
Table of Contents
accounted for more than 10% of our consolidated revenues. In each of the years, 2015, 2014 and 2013, our three largest customers in aggregate accounted for 25%, 21% and 26%, respectively, of our consolidated revenues.
Gross Profit
| 2015 | 2014 | 2013 | 2014-2015 Dollar / Point Change | 2013-2014 Dollar / Point Change | ||||||||||||||||
| (dollars in millions) | ||||||||||||||||||||
| Gross Profit | $ | 915.6 | $ | 878.8 | $ | 808.8 | $ | 36.8 | $ | 70.0 | ||||||||||
| Percent of Total Revenues | 55.8 | % | 53.3 | % | 56.6 | % | 2.5 | (3.3 | ) |
Gross profit as a percent of total revenues increased from 2014 to 2015 by 2.5 points due to favorable Semiconductor Test product mix and sales of previously leased testers in Semiconductor Test.
Gross profit as a percent of total revenues decreased from 2013 to 2014 by 3.3 points, of which 2.8 points was related to unfavorable product mix in SOC Semiconductor Test and lower Wireless Test sales and 1.1 points was due to pension expense in 2014 as a result of increases in life expectancy in the U.S., compared to pension income in 2013, partially offset by an increase of 1.1 points due to higher sales volume.
The breakout of product and service gross profit was as follows:
| 2015 | 2014 | 2013 | 2014-2015 Dollar / Point Change | 2013-2014 Dollar / Point Change | ||||||||||||||||
| (dollars in millions) | ||||||||||||||||||||
| Product Gross Profit | $ | 748.8 | $ | 723.2 | $ | 655.9 | $ | 25.6 | $ | 67.3 | ||||||||||
| Percent of Product Revenues | 55.9 | % | 53.0 | % | 56.8 | % | 2.9 | (3.8 | ) | |||||||||||
| Service Gross Profit | $ | 166.8 | $ | 155.6 | $ | 152.9 | $ | 11.2 | $ | 2.7 | ||||||||||
| Percent of Service Revenues | 55.8 | % | 54.8 | % | 56.0 | % | 1.0 | (1.2 | ) |
We assess the carrying value of our inventory on a quarterly basis by estimating future demand and comparing that demand against on-hand and on-order inventory positions. Forecasted revenue information is obtained from the sales and marketing groups and incorporates factors such as backlog and future product demand. This quarterly process identifies obsolete and excess inventory. Obsolete inventory, which represents items for which there is no demand, is fully reserved. Excess inventory, which represents inventory items that are not expected to be consumed during the next twelve quarters for our Semiconductor Test, System Test and Industrial Automation segments and next four quarters for our Wireless Test segment, is written-down to estimated net realizable value.
During the year ended December 31, 2015, we recorded an inventory provision of $21.3 million included in cost of revenues, due to the following factors:
| — | A charge of $15.3 million due to downward revisions to previously forecasted demand levels, of which $8.2 million was for our 2.5” hard disk drive testers in Storage Test, $4.5 million was in Semiconductor Test and $2.5 million was in Wireless Test; and |
|---|
| — | A $6.0 million inventory write-down as a result of product transition in Semiconductor Test. |
|---|
During the year ended December 31, 2014, we recorded an inventory provision of $22.2 million included in cost of revenues, due to the following factors:
| — | A charge of $15.4 million due to downward revisions to previously forecasted demand levels, of which $8.1 million was in Semiconductor Test, $5.2 million was in Wireless Test and $2.1 million was in System Test; and |
|---|
Table of Contents
| — | A $6.8 million inventory write-down as a result of product transition, of which $6.3 million was in Semiconductor Test and $0.5 million in Wireless Test. |
|---|
During the year ended December 31, 2013, we recorded an inventory provision of $16.6 million included in cost of revenues, due to the following factors:
| — | A charge of $12.2 million due to downward revisions to previously forecasted demand levels, of which $5.2 million was in Semiconductor Test, $4.2 million was in System Test and $2.8 million was in Wireless Test; and |
|---|
| — | A $4.4 million inventory write-down as a result of product transition in Wireless Test. |
|---|
During the years ended December 31, 2015, 2014 and 2013, we scrapped $7.0 million, $20.8 million and $35.3 million of inventory, respectively, and sold $7.9 million, $13.1 million and $9.8 million of previously written-down or written-off inventory, respectively. As of December 31, 2015, we had inventory related reserves for amounts which had been written-down or written-off totaling $119.4 million. We have no pre-determined timeline to scrap the remaining inventory.
Engineering and Development
Engineering and development expenses were as follows:
| 2015 | 2014 | 2013 | 2014-2015 Change | 2013-2014 Change | ||||||||||||||||
| (dollars in millions) | ||||||||||||||||||||
| Engineering and Development | $ | 292.3 | $ | 291.6 | $ | 264.1 | $ | 0.7 | $ | 27.5 | ||||||||||
| Percent of Total Revenues | 17.8 | % | 17.7 | % | 18.5 | % |
The increase of $0.7 million in engineering and development expenses from 2014 to 2015 was due to $3.9 million of higher variable compensation, $2.6 million of additional costs related to the acquisition of Universal Robots in June 2015 and a $1.8 million increase in spending primarily in Storage Test, partially offset by lower pension expense related to actuarial losses, $4.7 million in 2015 compared to $12.2 million in 2014.
The increase of $27.5 million from 2013 to 2014 was due primarily to $12.2 million of pension expense related to actuarial losses in 2014, as a result of increases in life expectancy in the U.S., compared to $4.4 million of pension income related to actuarial gains in 2013, a $10.9 million increase in Semiconductor Test spending, $2.7 million of higher variable compensation and $2.6 million of increased spending in Wireless Test, partially offset by lower System Test spending.
Selling and Administrative
Selling and administrative expenses were as follows:
| 2015 | 2014 | 2013 | 2014-2015 Change | 2013-2014 Change | ||||||||||||||||
| (dollars in millions) | ||||||||||||||||||||
| Selling and Administrative | $ | 306.3 | $ | 319.7 | $ | 279.6 | $ | (13.4 | ) | $ | 40.1 | |||||||||
| Percent of Total Revenues | 18.7 | % | 19.4 | % | 19.6 | % |
The decrease of $13.4 million in selling and administrative expenses from 2014 to 2015 was due primarily to lower pension expense related to actuarial losses, $4.8 million in 2015 compared to $21.6 million in 2014, and a one-time $6.6 million stock-based compensation charge in 2014 related to a retirement agreement entered into with our retired chief executive officer, partially offset by higher variable compensation.
The increase of $40.1 million from 2013 to 2014 was due primarily to $21.6 million of pension expense related to actuarial losses in 2014, as a result of increases in life expectancy in the U.S., compared to $2.9 million
Table of Contents
of pension income related to actuarial gains in 2013, a one-time $6.6 million stock-based compensation charge in 2014 related to a retirement agreement entered into with our retired chief executive officer and increased spending in Semiconductor Test and Corporate.
Acquired Intangible Assets Amortization
Acquired intangible assets amortization expense was as follows:
| 2015 | 2014 | 2013 | 2014-2015 Change | 2013-2014 Change | ||||||||||||||||
| (dollars in millions) | ||||||||||||||||||||
| Acquired Intangible Assets Amortization | $ | 69.0 | $ | 70.8 | $ | 72.4 | $ | (1.8 | ) | $ | (1.6 | ) | ||||||||
| Percent of Total Revenues | 4.2 | % | 4.3 | % | 5.1 | % |
Acquired intangible assets amortization expense decreased from 2014 to 2015 due to intangible assets that became fully amortized during the year, partially offset by increased amortization expense due to the Universal Robots acquisition. Acquired intangible assets amortization expense decreased from 2013 to 2014 due to intangible assets that became fully amortized during the year, partially offset by increased amortization expense due to the AIT acquisition.
Goodwill Impairment
We assess goodwill for impairment at least annually, in the fourth quarter, as of December 31. The fourth quarter 2015 and 2013 goodwill impairment tests did not identify any goodwill impairments. In the fourth quarter of 2014, we performed our annual goodwill impairment test and recorded a goodwill impairment charge of $98.9 million in our Wireless Test segment as a result of decreased projected demand attributable to an estimated smaller future wireless test market due to reuse of wireless test equipment, price competition and different testing techniques.
Further reductions in the size of the wireless test market may occur, which may result in additional goodwill impairment charges, increased risk of excess and obsolete inventories, asset write-offs and restructuring charges.
Restructuring and Other
Other
During the year ended December 31, 2015, we recorded $3.6 million of other charges of which $5.3 million was for the increase in the fair value of the Universal Robots contingent consideration liability and $1.0 million for acquisition costs related to Universal Robots, partially offset by a $2.9 million gain from fair value adjustments to decrease the acquisition contingent consideration liability related to ZTEC, $1.6 million, and AIT, $1.3 million.
During the year ended December 31, 2014, we recorded a $0.6 million gain from the fair value adjustment to decrease the ZTEC acquisition contingent consideration, partially offset by $0.4 million of acquisition costs related to AIT.
Restructuring
During the year ended December 31, 2015, we recorded $1.5 million of severance charges related to headcount reductions of 23 people primarily in System Test and Semiconductor Test.
During the year ended December 31, 2014, we recorded $1.6 million of severance charges related to headcount reductions of approximately 43 people, primarily in Semiconductor Test and Wireless Test.
Table of Contents
During the year ended December 31, 2013, we recorded $1.9 million of severance charges related to headcount reductions of 48 people primarily in System Test and Semiconductor Test and a $0.4 million credit in Corporate related to a change in the estimated exit costs related to a leased facility.
The remaining accrual for severance of $0.4 million is reflected in the accrued employees’ compensation and withholdings on the balance sheet and is expected to be paid by March 2016.
Interest and Other
| 2015 | 2014 | 2013 | 2014-2015 Change | 2013-2014 Change | ||||||||||||||||
| (in millions) | ||||||||||||||||||||
| Interest Income | $ | (7.2 | ) | $ | (6.3 | ) | $ | (4.1 | ) | $ | (0.9 | ) | $ | (2.2 | ) | |||||
| Interest Expense | 1.9 | 6.9 | 26.1 | (5.0 | ) | (19.2 | ) | |||||||||||||
| Other (income) expense, net | (4.8 | ) | 0.4 | (33.2 | ) | (5.2 | ) | 33.6 |
Interest income increased by $0.9 million from 2014 to 2015 due primarily to higher interest rates on marketable securities. Interest income increased by $2.2 million from 2013 to 2014 due to an increase in realized gains from the sale of marketable securities and an increase in cash and marketable securities.
Interest expense decreased by $5.0 million from 2014 to 2015, and $19.2 million from 2013 to 2014, due primarily to the repayment of our convertible debt in the first quarter of 2014.
In 2015 and 2013, other (income) expense, net included a $5.4 million and a $34.2 million gain, respectively, from the sale of an equity investment.
Income (Loss) Before Income Taxes
| 2015 | 2014 | 2013 | 2014-2015 Change | 2013-2014 Change | ||||||||||||||||
| (in millions) | ||||||||||||||||||||
| Semiconductor Test | $ | 260.2 | $ | 255.8 | $ | 153.8 | $ | 4.4 | $ | 102.0 | ||||||||||
| System Test | 25.1 | 12.1 | 3.1 | 13.0 | 9.0 | |||||||||||||||
| Wireless Test | (13.8 | ) | (116.2 | ) | 23.2 | 102.4 | (139.3 | ) | ||||||||||||
| Industrial Automation | (7.6 | ) | — | — | (7.6 | ) | — | |||||||||||||
| Corporate (1) | (10.7 | ) | (56.3 | ) | 21.9 | 45.5 | (78.2 | ) | ||||||||||||
| $ | 253.1 | $ | 95.4 | $ | 201.9 | $ | 157.7 | $ | (106.5 | ) | ||||||||||
| (1) | Included in Corporate are pension and postretirement plans actuarial gains and losses, contingent consideration adjustments, interest income and interest expense. |
|---|
The increase in income before income taxes from 2014 to 2015 was primarily due to a $98.9 million goodwill impairment charge related to Wireless Test in 2014 and lower pension expense related to actuarial losses of $17.7 million in 2015 as compared to $46.6 million in 2014. Actuarial losses of $46.6 million in 2014 were primarily related to increases in life expectancy in the U.S.
The decrease in income before income taxes from 2013 to 2014 was primarily due to a $98.9 million goodwill impairment charge related to Wireless Test and $46.6 million pension expense related to actuarial losses in 2014, partially offset by higher income due to higher revenues in Semiconductor Test in 2014.
Income Taxes
Income tax expense for 2015, 2014 and 2013 totaled $46.6 million, $14.1 million and $37.0 million, respectively. The effective tax rate for 2015, 2014 and 2013 was 18.4%, 14.8% and 18.3%, respectively. The
Table of Contents
increase in the effective tax rate from 2014 to 2015 resulted from a shift in the geographic distribution of income which increased income subject to taxation in the United States relative to lower tax rate jurisdictions and a reduction in the benefit from U.S. research and development tax credits. These increases in the effective tax rate were partially offset by decreases associated with uncertain tax positions and a non-deductible goodwill impairment charge. The decrease in the effective tax rate from 2013 to 2014 was primarily attributable to a shift in the geographic distribution of income which decreased income subject to taxation in the United States relative to lower tax rate jurisdictions, partially offset by increases in the effective tax rate associated with uncertain tax positions and a non-deductible goodwill impairment charge.
In December 2015, Teradyne entered into an agreement with the Singapore Economic Development Board which extended our Singapore tax holiday under substantially similar terms to the agreement which expired on December 31, 2015. The new tax holiday is scheduled to expire on December 31, 2020. The tax savings attributable to the Singapore tax holiday for the years ended December 31, 2015, 2014 and 2013 were $11.5 million or $0.05 per diluted share, $13.2 million or $0.06 per diluted share and $4.7 million or $0.02 per diluted share, respectively.
Contractual Obligations
The following table reflects our contractual obligations as of December 31, 2015:
| Payments Due by Period | ||||||||||||||||||||||||
| Total | Less than 1 year | 1-3 years | 3-5 years | More than 5 years | Other | |||||||||||||||||||
| (in thousands) | ||||||||||||||||||||||||
| Purchase obligations | $ | 237,018 | $ | 230,296 | $ | 6,722 | $ | — | $ | — | $ | — | ||||||||||||
| Retirement plans contributions | 107,482 | 4,044 | 7,876 | 8,416 | 87,146 | — | ||||||||||||||||||
| Operating lease obligations | 68,720 | 15,665 | 21,337 | 15,709 | 16,009 | — | ||||||||||||||||||
| Fair value of contingent consideration | 37,436 | 15,500 | 15,319 | 6,617 | — | — | ||||||||||||||||||
| Other long-term liabilities reflected on the balance sheet under GAAP (1) | 84,564 | — | 25,745 | — | — | 58,819 | ||||||||||||||||||
| Total | $ | 535,220 | $ | 265,505 | $ | 76,999 | $ | 30,742 | $ | 103,155 | $ | 58,819 | ||||||||||||
| (1) | Included in other long-term liabilities are liabilities for customer advances, extended warranty, uncertain tax positions, deferred tax liabilities and other obligations. For certain long-term obligations, we are unable to provide a reasonably reliable estimate of the timing of future payments relating to these obligations and therefore we included these amounts in the column marked “Other.” |
|---|
Liquidity and Capital Resources
Our cash, cash equivalents and marketable securities balance decreased $291 million to $1,008 million from 2014 to 2015.
In 2015, changes in operating assets and liabilities, net of businesses acquired, provided cash of $9.3 million. This was due to a $38.7 million increase in operating assets and a $48.0 million increase in operating liabilities.
The increase in operating assets was due to a $57.3 million increase in accounts receivable due to an increase in sales during the last month of the fourth quarter of 2015 compared to 2014, partially offset by a $15.6 million decrease in inventories and a $3.0 million decrease in prepayments and other assets.
The increase in operating liabilities was due to a $37.0 million increase in accounts payable as a result of our planned inventory increase in the fourth quarter of 2015 as we added material to maintain attractive lead
Table of Contents
times, a $17.0 million increase in customer advance payments and deferred revenue and a $11.3 million increase in other accrued liabilities, partially offset by $12.1 million of retirement plans contributions and a $5.2 million increase in income taxes.
Investing activities during 2015 used cash of $113.7 million, due to $1,424.0 million used for purchases of marketable securities, $282.7 million used for the acquisition of Universal Robots, and $89.9 million used for purchases of property, plant and equipment, partially offset by proceeds from maturities and sales of marketable securities of $360.3 million and $1,316.1 million, respectively, proceeds from the sale of an equity investment of $5.4 million, and proceeds from life insurance of $1.1 million related to the cash surrender value from the cancellation of Teradyne owned life insurance policies. The decrease in purchases of property, plant and equipment of $79.1 million was primarily due to an increase in purchases of testers for customer leasing in 2014.
Financing activities during 2015 used cash of $328.7 million, due to $300.0 million used for the repurchase of 15.6 million shares of common stock at an average price of $19.20 per share, $50.7 million used for dividend payments, and $2.3 million used for debt issuance costs related to our April 2015 revolving credit facility, partially offset by $19.5 million from the issuance of common stock under employee stock purchase and stock option plans and $4.7 million from the tax benefit related to employee stock compensation awards.
In 2014, changes in operating assets and liabilities, net of businesses acquired, provided cash of $68.5 million. This was due to a $101.4 million decrease in operating assets and a $32.9 million decrease in operating liabilities.
The decrease in operating assets was due to a $41.5 million decrease in prepayments and other assets primarily related to a reduction in prepayments to our contract manufacturers, a $51.8 million decrease in inventories due to higher sales, and an $8.1 million decrease in accounts receivable.
The decrease in operating liabilities was due to $33.9 million of retirement plan contributions, a $17.0 million decrease in other accrued liabilities, a $16.9 million decrease in accounts payable, a $7.3 million decrease in accrued employee compensation due primarily to employee stock awards payroll taxes and variable compensation payments, a $4.3 million convertible note interest payment, partially offset by a $24.4 million increase in income taxes, and a $22.0 million increase in customer advance payments and deferred revenue.
Investing activities during 2014 used cash of $332.9 million due to $1,578.7 million used for purchases of marketable securities and $169.0 million used for purchases of property, plant and equipment, and $19.4 million used for the acquisition of AIT, completed in October 2014, partially offset by proceeds from sales and maturities of marketable securities that provided cash of $859.7 million and $570.4 million, respectively, and net proceeds from life insurance of $4.2 million primarily related to the cash surrender value from the cancellation of Teradyne owned life insurance policies on its retired chief executive officer. The increase in purchase of property, plant and equipment of $62.3 million in 2014 compared to the year ended December 31, 2013 is primarily due to testers used for customer leases.
Financing activities during 2014 used cash of $206.6 million, $191.0 million of cash was used for payments on long-term debt related to the convertible note and a loan in Japan and $37.4 million was used for dividend payments, partially offset by $21.3 million provided by the issuance of common stock under employee stock purchase and stock option plans and $0.5 million from the tax benefit related to stock options and restricted stock units.
In 2013, changes in operating assets and liabilities, net of businesses acquired, used cash of $49.6 million. This was due to a $31.0 million increase in operating assets and an $18.6 million decrease in operating liabilities.
The increase in operating assets was due to a $49.6 million increase in prepayments due primarily to prepayments to our contract manufacturers and a $3.7 million increase in accounts receivable, partially offset by a $22.3 million decrease in inventories.
Table of Contents
The decrease in operating liabilities was due to a $2.5 million decrease in accrued employee compensation due primarily to employee stock awards payroll taxes and variable compensation payments, a $28.9 million decrease in customer advance payments and deferred revenue, and $5.5 million of retirement plan contributions, partially offset by a $13.9 million increase in other accrued liabilities, a $3.7 million increase in accounts payable due to higher fourth quarter sales volume, and a $0.7 million increase in income taxes.
Investing activities during 2013 used cash of $283.3 million. In October 2013, we completed the acquisition of ZTEC for an initial cash purchase price, net of cash acquired, of $15.0 million. Purchases of property, plant and equipment were $106.7 million. Purchases of marketable securities used cash of $1,170.5 million, partially offset by proceeds from maturities and sales of marketable securities that provided cash of $516.5 million and $458.5 million, respectively. The sale of an equity investment provided cash of $34.2 million. Purchases of life insurance policies used cash of $0.3 million.
Financing activities during 2013 provided cash of $17.3 million, $17.6 million was from the issuance of common stock under stock option and stock purchase plans, and $2.7 million from the tax benefit related to stock options and restricted stock units, partially offset by $0.4 million of cash used for payments related to LitePoint acquisition contingent consideration and $2.5 million of cash used for payments on long-term debt related to a loan in Japan.
In January 2015, May 2015, August 2015 and November 2015, our Board of Directors declared a quarterly dividend of $0.06 per share. Total dividend payments in 2015 were $50.7 million.
In January 2014, our Board of Directors declared an initial quarterly cash dividend of $0.06 per share. In each of the second, third and fourth quarters of 2014, we paid a cash dividend of $0.06 per share. Total dividend payments in 2014 were $37.4 million.
In January 2016, our Board of Directors declared a quarterly dividend of $0.06 per share to be paid on March 21, 2016 to shareholders of record as of February 26, 2016. Payment of future cash dividends are subject to the discretion of our Board of Directors and will depend, among other things, upon our earnings, capital requirements and financial condition.
In January 2015, our Board of Directors authorized the repurchase of up to $500 million of common stock. As of December 31, 2015, we repurchased 15.6 million shares of common stock at an average price of $19.20, for a total cost of $300.0 million. In 2016, we intend to repurchase between $100 million and $200 million of common stock.
We believe our cash, cash equivalents and marketable securities balance will be sufficient to pay our quarterly dividend, execute our authorized share repurchase program and meet our working capital and expenditure needs for at least the next twelve months. The amount of cash, cash equivalents and marketable securities in the U.S. and our operations in the U.S. provide sufficient liquidity to fund our business activities in the U.S. We have approximately $588 million of cash outside the U.S. that if repatriated would incur additional taxes. Determination of the additional taxes that would be incurred is not practicable due to uncertainty regarding the remittance structure, the mix of earnings and earnings and profit pools in the year of remittance, and overall complexity of the calculation. Inflation has not had a significant long-term impact on earnings.
Retirement Plans
ASC 715-20, “Compensation – Retirement Benefits – Defined Benefit Plans” requires an employer with defined benefit plans or other postretirement benefit plans to recognize an asset or a liability on its balance sheet for the overfunded or underfunded status of the plans as defined by ASC 715-20. The pension asset or liability represents the difference between the fair value of the pension plan’s assets and the projected benefit obligation as of December 31. For other postretirement benefit plans, the liability is the difference between the fair value of the plan’s assets and the accumulated postretirement benefit obligation as of December 31.
Table of Contents
Our pension expense, which includes the U.S. Qualified Pension Plan (“U.S. Plan”), certain qualified plans for non-U.S. subsidiaries, and a U.S. Supplemental Executive Defined Benefit Plan, was approximately $21.3 million for the year ended December 31, 2015. The largest portion of our 2015 pension expense was $10.5 million for our U.S. Plan. Pension expense or income is calculated based upon a number of actuarial assumptions. Discount rate and expected return on assets are two assumptions which are important elements of pension plan expense/income and asset/liability measurement. We evaluate our discount rate and expected rate of return on assets assumptions annually on a plan and country specific basis. We evaluate other assumptions related to demographic factors, such as retirement age, mortality and turnover periodically, and update them to reflect our experience and expectations for the future. In the fourth quarter of 2014, we updated the mortality assumptions related to our U.S retirement plans using the mortality tables published in October 2014 by the U.S. Society of Actuaries. The change in the mortality assumptions resulted in approximately $39.0 million of actuarial losses in 2014 for the U.S. retirement plans.
In developing the expected return on U.S. Plan assets assumption, we evaluated input from our investment manager and pension consultants, including their review of asset class return expectations. Based on this review, we believe that 4.8% was an appropriate rate to use for 2015. The December 31, 2015 asset allocation for our U.S. Plan was 89% invested in fixed income securities, 10% invested in equity securities, and 1% invested in other securities. Our investment manager regularly reviews the actual asset allocation and periodically rebalances the portfolio to ensure alignment with our target allocations.
We recognize net actuarial gains and losses and the change in the fair value of plans assets in our operating results in the year in which they occur or upon any interim remeasurement of the plans. We calculate the expected return on plan assets using the fair value of the plan assets. Actuarial gains and losses are generally measured annually as of December 31 and, accordingly, recorded during the fourth quarter of each year or upon any interim remeasurement of the plans.
The discount rate that we utilized for determining future pension obligations for the U.S. Plan is based on the Citigroup Pension Index adjusted for the U.S. Plan’s expected cash flows and was 4.0% at December 31, 2015, up from 3.7% at December 31, 2014. We estimate that in 2016 we will recognize approximately $0.5 million of pension income for the U.S. Plan. The U.S. Plan pension income estimate for 2016 is based on a 4.0% discount rate and a 4.8% return on assets. Future pension expense or income will depend on future investment performance, changes in future discount rates and various other factors related to the employee population participating in our pension plans.
As of December 31, 2015, our pension plans had unrecognized pension prior service cost of $0.2 million.
We performed a sensitivity analysis, which expresses the potential U.S. Plan (income) expense for the year ending December 31, 2016, which would result from changes to either the discount rate or the expected return on plan assets. The below estimates exclude the impact of any potential actuarial gains or losses. It is difficult to reliably forecast or predict whether there will be any actuarial gains or losses in 2016 as they are primarily driven by events and circumstances beyond our control, such as changes in interest rates and the performance of the financial markets.
| Discount Rate | ||||||||||||
| Return on Plan Assets | 3.5% | 4.0% | 4.5% | |||||||||
| (in millions) | ||||||||||||
| 4.25% | $ | 0.3 | $ | 0.9 | $ | 1.5 | ||||||
| 4.75% | (1.2 | ) | (0.5 | ) | 0.0 | |||||||
| 5.25% | (2.6 | ) | (2.0 | ) | (1.4 | ) |
The assets of the U.S. Plan consist substantially of fixed income securities. U.S. Plan assets have decreased from $316.1 million at December 31, 2014 to $298.4 million at December 31, 2015 while the U.S. Plan’s liability decreased from $313.0 million at December 31, 2014 to $297.8 million at December 31, 2015.
Table of Contents
Our funding policy is to make contributions to our pension plans in accordance with local laws and to the extent that such contributions are tax deductible. During 2015, we made contributions of $8.0 million to the U.S. Plan, $2.5 million to the U.S. supplemental executive defined benefit pension plan and $0.8 million to certain qualified plans for non-U.S. subsidiaries. We expect to contribute approximately $2.6 million to the U.S. supplemental executive defined benefit pension plan in 2016. Contributions to be made in 2016 to certain qualified plans for non-U.S. subsidiaries are based on local statutory requirements and are estimated at approximately $0.8 million. We do not expect to make any contributions to the U.S. Plan in 2016.
Equity Compensation Plans
In addition to our 1996 Employee Stock Purchase Plan discussed in Note N: “Stock Based Compensation” in Notes to Consolidated Financial Statements, we have a 2006 Equity and Cash Compensation Incentive Plan (the “2006 Equity Plan”) under which equity securities are authorized for issuance. The 2006 Equity Plan was initially approved by stockholders on May 25, 2006.
At our annual meeting of stockholders held May 21, 2013, our stockholders approved an amendment to the 2006 Equity Plan to increase the number of shares issuable thereunder by 10.0 million, for an aggregate of 32.0 million shares issuable thereunder, and our stockholders also approved an amendment to our 1996 Employee Stock Purchase Plan to increase the number of shares issuable thereunder by 5.0 million, for an aggregate of 30.4 million shares issuable thereunder.
The following table presents information about these plans as of December 31, 2015 (share numbers in thousands):
| Plan category | Number of securities to be issued upon exercise of outstanding options, warrants and rights | Weighted-average exercise price of outstanding options, warrants and rights | Number of securities remaining available for future issuance under equity compensation plans (excluding securities reflected in column one) | |||||||||
| Equity plans approved by shareholders | 4,635 | (1) | $ | 17.39 | 15,790 | (2) | ||||||
| Equity plans not approved by shareholders (3,4,5) | 556 | $ | 2.92 | — | ||||||||
| Total | 5,191 | $ | 10.21 | 15,790 | ||||||||
| (1) | Includes 4,070,124 shares of restricted stock units that are not included in the calculation of the weighted average exercise price. |
|---|
| (2) | Consists of 10,913,160 securities available for issuance under the 2006 Equity Plan and 4,876,424 of securities available for issuance under the Employee Stock Purchase Plan. |
|---|
| (3) | In connection with the 2008 acquisition of Nextest (the “Nextest Acquisition”), we assumed the options and restricted stock units granted under the Nextest Systems Corporation 1998 Equity Incentive Plan, as amended, and the Nextest Systems Corporation 2006 Equity Incentive Plan (collectively, the “Nextest Plans”). Upon the consummation of the Nextest Acquisition, these options and restricted stock units were converted automatically into, respectively, options to purchase and restricted stock units representing, an aggregate of 4,417,594 shares of our common stock. No additional awards will be granted under the Nextest Plans. As of December 31, 2015, there were outstanding options exercisable for an aggregate of 4,528 shares of our common stock pursuant to the Nextest Plans, with a weighted average exercise price of $5.72 per share. |
|---|
| (4) | In connection with the 2008 acquisition of Eagle Test (the “Eagle Acquisition”), we assumed the options granted under the Eagle Test Systems, Inc. 2003 Stock Option and Grant Plan and the Eagle Test Systems, Inc. 2006 Stock Option and Incentive Plan (collectively, the “Eagle Plans”). Upon the consummation of the Eagle Acquisition, these options were converted automatically into options to purchase an aggregate of 3,594,916 shares of our common stock. No additional awards will be granted under the Eagle Plans. As of |
|---|
Table of Contents
| December 31, 2015, there were outstanding options exercisable for an aggregate of 94,980 shares of our common stock pursuant to the Eagle Plans, with a weighted average exercise price of $3.87 per share. |
|---|
| (5) | In connection with the 2011 acquisition of LitePoint Corporation (the “LitePoint Acquisition”), we assumed the options granted under the LitePoint Corporation 2002 Stock Plan (the “LitePoint Plan”). Upon the consummation of the LitePoint Acquisition, these options were converted automatically into options to purchase an aggregate of 2,828,344 shares of our common stock. No additional awards will be granted under the LitePoint Plan. As of December 31, 2015, there were outstanding options exercisable for an aggregate of 457,192 shares of our common stock pursuant to the LitePoint Plan, with a weighted average exercise price of $2.70 per share. |
|---|
The purpose of the 2006 Equity Plan is to motivate employees, officers and directors by providing equity ownership and compensation opportunities in Teradyne. The aggregate number of shares available under the 2006 Equity Plan as of December 31, 2015 was 10,913,160 shares of our common stock. The 2006 Equity Plan authorizes the grant of stock-based awards in the form of (1) non-qualified and incentive stock options, (2) stock appreciation rights, (3) restricted stock awards and restricted stock unit awards, (4) phantom stock, and (5) other stock-based awards. Awards may be tied to time-based vesting schedules and/or performance-based vesting measured by reference to performance criteria chosen by the Compensation Committee of the Board of Directors, which administers the 2006 Equity Plan. Awards may be made to any employee, officer, consultant and advisor of Teradyne and our subsidiaries, as well as, to our directors. The maximum number of shares of stock-based awards that may be granted to one participant during any one fiscal year is 2,000,000 shares of common stock. The 2006 Equity Plan will expire on May 12, 2025.
As of December 31, 2015, total unrecognized compensation expense related to non-vested restricted stock units and options was $44.9 million, and is expected to be recognized over a weighted average period of 2.3 years.
Performance Graph
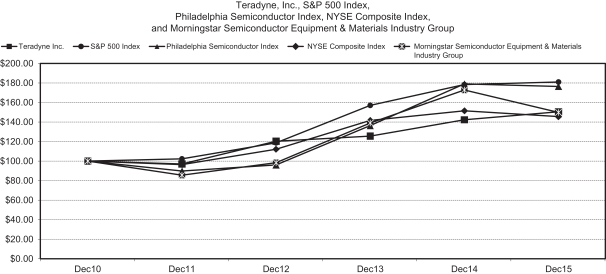
The following graph compares the change in our cumulative total shareholder return in our common stock with the Standard & Poor’s 500 Index, the Philadelphia Semiconductor Index, the NYSE Composite Index and the Morningstar Semiconductor Equipment & Materials Index. The comparison assumes $100.00 was invested on December 31, 2010 in our common stock and in each of the foregoing indices and assumes reinvestment of dividends, if any. Historic stock price performance is not necessarily indicative of future price performance. This is the last year that we will compare ourselves to the Standard & Poor’s 500 Index and the Philadelphia Semiconductor Index. Going forward, we will compare ourselves to (1) the NYSE Composite Index, as we are no
Table of Contents
longer included in the Standard & Poor’s 500 Index, and (2) the Morningstar Semiconductor Equipment & Materials Industry Group (compiled by Morningstar, Inc.) as this better aligns us with companies in the broader semiconductor equipment industry.
Recently Issued Accounting Pronouncements
In November 2015, the FASB issued Accounting Standards Update (“ASU”) 2015-17, “Balance Sheet Classification of Deferred Taxes.” ASU 2015-17 is aimed at reducing complexity in accounting standards. Currently GAAP requires the deferred taxes for each jurisdiction to be presented as a net current asset or liability and net noncurrent asset or liability. This requires a jurisdiction-by-jurisdiction analysis based on the classification of the assets and liabilities to which the underlying temporary differences relate, or, in the case of loss or credit carryforwards, based on the period in which the attribute is expected to be realized. Any valuation allowance is then required to be allocated on a pro rata basis, by jurisdiction, between current and noncurrent deferred tax assets. To simplify presentation, the new guidance requires that all deferred tax assets and liabilities, along with any related valuation allowance, be classified as noncurrent on the balance sheet. As a result, each jurisdiction will now only have one net noncurrent deferred tax asset or liability. The guidance does not change the existing requirement that only permits offsetting within a jurisdiction; companies are still prohibited from offsetting deferred tax liabilities from one jurisdiction against deferred tax assets of another jurisdiction. The new guidance is effective in fiscal years beginning after December 15, 2016, including interim periods within those years. Early adoption is permitted as of the beginning of an interim or annual reporting period. The guidance may be applied either prospectively, for all deferred tax assets and liabilities, or retrospectively by reclassifying the comparative balance sheet. We will early adopt this ASU prospectively in January 2016. This ASU is expected to have no impact on our results of operations.
In September 2015, the FASB issued ASU 2015-16, “Business Combinations (Topic 805)—Simplifying the Accounting for Measurement-Period Adjustments.” ASU 2015-16 requires that an acquirer recognize adjustments to provisional amounts that are identified during the measurement period in the reporting period in which the adjustments are identified, including the cumulative effect of the change in provisional amount as if the accounting had been completed at the acquisition date. ASU 2015-16 is effective for reporting periods beginning after December 15, 2015 and is applied prospectively. Early adoption is permitted. We early adopted this ASU in the three months ended October 4, 2015. Adoption of this ASU did not have a material impact on our financial position and results of operations.
Table of Contents
In April 2015, the FASB issued ASU 2015-03, “Simplifying the Presentation of Debt Issuance Costs,” which requires debt issuance costs to be presented in the balance sheet as a direct deduction from the carrying value of the associated debt liability, consistent with the presentation for debt discount. ASU 2015-03 does not specifically address requirements for the presentation or subsequent measurement of debt issuance costs related to line-of-credit arrangements. On August 8, 2015, the FASB issued ASU 2015-15, “Interest—Imputation of Interest (Subtopic 835-30)” clarifying that debt issuance costs related to line-of-credit arrangements could be presented as an asset and amortized over the term of the line-of-credit arrangement, regardless of whether there are any outstanding borrowings on the line-of-credit arrangement. For Teradyne, the standard is effective for financial statements issued for fiscal years beginning after December 15, 2015, and interim periods within those years. This ASU is expected to have no impact on our financial position and results of operations.
In May 2014, the FASB issued ASU 2014-09, “Revenue from Contracts with Customers (Topic 606),” which will replace numerous requirements in U.S. GAAP, including industry-specific requirements, and provide companies with a single revenue recognition model for recognizing revenue from contracts with customers. The core principle of the new standard is that a company should recognize revenue to show the transfer of promised goods or services to customers in an amount that reflects the consideration to which the company expects to be entitled to in exchange for those goods or services. In August 2015, FASB issued ASU 2015-14, which deferred the effective date of the new revenue standard by 1 year. For Teradyne, the standard will be effective in the first quarter of 2018. Early adoption is permitted but not before the original effective date (that is, annual periods beginning after December 15, 2016). The two permitted transition methods under the new standard are the full retrospective method, in which case the standard would be applied to each prior reporting period presented, or the modified retrospective method, in which case the cumulative effect of applying the standard would be recognized at the date of initial application. We have not yet selected a transition method. We are currently evaluating the impact of this ASU on our financial position and results of operations.
Previous: Item 6. Selected Financial Data · Next: Item 7A. Quantitative and Qualitative Disclosures about Market Risks